Abstract
Simulating a clinical condition of intracerebral hemorrhage (ICH) in animals is key to research on the development and testing of diagnostic or treatment strategies for this high mortality disease. In order to study the mechanism, pathology, and treatment for hemorrhagic stroke, various animal models have been developed. Measurement of hematoma volume is an important assessment parameter to evaluate post-ICH outcomes. However, due to tissue preservation conditions and variables in digitization, quantification of hematoma volume is usually labor intensive and sometimes even subjective. The objective of this study is to develop an automated method that can accurately and efficiently obtain unbiased cerebral hematoma volume. We developed an application (MatLab program) that can delineate the brain slice from the background and use the Hue information in the Hue/Saturation/Value (HSV) color space to segment the hematoma region. The segmentation threshold of Hue is calculated based on the Bayes classifier theorem so that the minimum error is mathematically ensured and automated processing is enabled. To validate the developed method, we compared the outcomes from the developed method with the hemoglobin content by the spectrophotometric assay method. The results were linearly correlated with statistical significance. The method was also validated by digital phantoms with an error less than 5% compared with the ground truth from the phantoms. Hematoma volumes yielded by the automated processing and those obtained by the operator’s manual operation are highly correlated. This automated segmentation approach can be potentially used to quantify hemorrhagic outcomes in rodent stroke models in an unbiased and efficient way.
Keywords: Color segmentation, Hemorrhage, Hematoma volume, Animal model, Bayes classifier
Introduction
In 2014, stroke contributed to more than 5% of the deaths in the United States. Its high mortality rate results in about 133,000 lives lost every year, ranking stroke as the fifth leading cause of all deaths. Intracerebral hemorrhage (ICH) is responsible for 13% of all stroke cases [1]. The 10 year hemorrhagic stroke survival rates for both men and women are below 50%, with women slightly higher than men [2]. The hemorrhagic stroke mortality at 1 month has not decreased over the past two decades [3]. Effective treatment regimens for hemorrhagic stroke are still under intense investigation, and more studies are required to provide further improvements [4, 5]. In order to pave a way to develop and test diagnostic or treatment strategies for human, animal experiments are imperative to investigate physiology, pathology, and other related aspects of the disease. One of prioritized tasks in animal experiments is to establish reliable, repeatable, and consistent animal models. Various animal models, usually conducted on rodents, have been well developed for experimental stroke research. These established animal ICH models have demonstrated characteristics that are also presented in human stroke cases [6]. Hemorrhagic stroke causes two types of damage to the brain tissue. One is physical damage, which comes from the shear force and mass effect. The other one is biological damage, which is induced by the toxic components in the blood and inflammatory response [7]. Commonly used methods to simulate ICH in rodents include the injection of autologous blood or the injection of bacterial collagenase [8].
In a rat ICH study, precise measurements of hematoma volume and the location of the hematoma are important parameters to evaluate the consistency of the animal model, the levels of brain tissue damage, and/or the efficacy of the treatments. Methods to analyze cerebral hemorrhage in rat models can be categorized into three approaches. The first method is spectrophotometric hemoglobin assay. In this approach, the rat brain tissue is homogenized and combined with a reagent to convert hemoglobin to cyanomethemoglobin or similar derivative which can be detected using a spectrophotometer. The measured optical signal is then converted to the concentration of the hemoglobin using a standard curve. This approach, utilizing hemoglobin content as a surrogate of hematoma volume, can quantitatively assess the volume of cerebral hematoma within the whole brain. The method is also referred to as the “gold standard” for hematoma volume estimation [9]. Although the results from the spectrophotometric hemoglobin assay method show an accurate amount of hematoma volume, the geometric information, where the blood “distributes,” is lost during the homogenization process.
The second approach is diagnostic imaging techniques. Since dynamic contrast-enhanced CT and MRI are able to assess the permeability of the blood-brain barrier [10], the images of brain sections can be used to estimate the volume of cerebral hematoma. It has been reported that the lesion segmentation procedure on the MRI images yields reproducible results [11]. The advantages of using these imaging techniques include preserving the whole brain tissue and increasing statistical power by the noninvasive nature. The inconvenience is that the imaging facility may not be available to all laboratories. In addition, owing to various animal models, a standard imaging protocol may affect the accuracy of the hematoma volume estimations, when compared to the conventional histological examination [10, 11].
The most popular approach is histological investigation. Brains of rats that are subjected to experimental cerebral hematoma are sectioned into equal-thickness slices, and are digitized by a CCD camera or a scanner. The hematoma volume can be estimated by integrating the “detected or identified” hematoma areas on all slices through the whole brain [12, 13]. To detect the hematoma area, investigators reference the “core” of the hematoma and determine the border [9]. The histological approach can utilize Adobe® Photoshop® or ImageJ to delineate the hematoma area. In manual segmentation, investigators sample the hematoma color within the core by experience and allow Photoshop® to identify pixels with similar colors [14, 15]. The accuracy of these measurements depends on each operator’s subjective judgements. Thus, intra-operator and inter-operator variation may affect the reproducibility of the results. Image processing techniques have been attracting investigators’ attention because of their objective, algorithm-based, and automated data handling nature.
Detection of hematoma area on histological slices is essentially a segmentation problem. The standard procedure is based on either pixel intensity in grayscales [16] or combined intensity values from RGB channels [17]. In the field of experimental stroke research, the challenges for hematoma segmentation include the following. Various models produce different hematoma outcomes, in terms of “color”. The CCD camera or other devices captured/scanned histological slices may further introduce unwanted signals (such as illumination, tissue preserving) to disturb the “color.” In order to reduce human subjectivity in histological analysis, target-specified color segmentation techniques have been developed, such as to identify atherosclerotic lesion and white blood cells [18, 19]. A general model-adaptive color segmentation method to delineate the hematoma region on rat brain slices would very much benefit research in this field. In this paper, we report a new hematoma analysis method based on the Bayes classification algorithm, which can also be used in broader applications. The effect of human subjectivity during image processing and associated error can be minimized due to the Bayes algorithm’s optimization nature. The method has been validated by a simulation study and used to process 84 rats subjected to collagenase-induced ICH and 13 mice subjected to blood-injection ICH. Comparisons between the automated method and manual process are also presented.
Material and Method
Animal Model and Data Acquisition
Experimental procedures on animals were carried out as per the Guide for the Care and Use of Laboratory Animals laid down by the National Institutes of Health and in accordance with the protocols approved by the Institutional Animal Care and Use Committee of the University of Miami.
Collagenase-induced ICH was used as a model of spontaneous ICH as described earlier [20–22]. In brief, Sprague-Dawley rats were anesthetized with isoflurane in a mixture of N2O (67%)/O2 (33%) and cannulated (femoral artery and vein). Rats were then intubated, paralyzed using rocuronium, and placed on mechanical ventilation. Physiological parameters like blood pressure, body temperature, head temperature, and blood gases were measured at various intervals during the experiment.
Rats were placed in a stereotaxic frame. A burr hole of approximately 2 mm2 area was made over the right side of the skull approximately 3.2 mm to the right and 0.2 mm anterior to the bregma. Drilling and injection were performed with Dill and Injection Robot (Neurostar, Tubingen, Germany). A 30 G needle was inserted 6.5 mm deep into the right hemisphere of the brain, i.e., 3.2 mm to the right and 0.2 mm anterior to the bregma through the burr hole. Bacterial collagenase IV (Collagenase from Clostridium histolyticum; Sigma-Aldrich Corp, St. Louis, USA), either 0.12, 0.167, or 0.22 U in 2 μL sterile saline, was injected into the striatum at a rate of 0.4 μL/min using a 10 μL Hamilton syringe (Hamilton Company, Reno, USA). The needle was left in place for an additional 5 min after the completion of injection before removing and sealing the hole with bone wax. At the end, both cannulas were removed from the femoral artery and vein, wounds were then sutured back, and animals were given appropriate post-operative care. At the end of the appropriate time (2–24 h) post-ICH, animals were re-anesthetized and briefly (2 min) perfused with saline. Brains were harvested and sectioned coronally (2 mm thick). Rostral side of sections were considered side A and caudal side of sections were considered section B. Approximate bregma levels for side A were 6.0, 4.0, 2.0, 0.0, −2.0, −4.0, and −6.0. The volumes of hematoma were the averaged results from both sides. To avoid processing induced artifacts, sections were handled carefully and scanned on Epson Perfection 4990 PHOTO scanner at 2400 dpi/24-bit color resolution. All images were inspected before further processing.
Spectrophotometric Assay
Hemoglobin content was determined using a spectrophotometric assay as described earlier with minor modifications [23]. In brief, brain tissues were homogenized in 1.8 mL of saline using a motor-operated Glass-Teflon homogenizer (Thomas AA-82). The homogenate was sonicated on ice for a total of 60 seconds in 10-second intervals with 10-second breaks in between, followed by an hour centrifugation at 19,500 × g at 4°C. The hemoglobin in the supernatant was measured following instructions from the manufacturer (Hemoglobin Assay Kit, Sigma-Aldrich Corp., St. Louis, USA). The optical density was measured and recorded at 400 nm using a spectrophotometer. Known quantities of hemoglobin (Hemoglobin Human, Sigma-Aldrich Corp., St. Louis, USA) were added to homogenized brain tissue from naïve rats to generate a standard curve. Standard samples were processed in the same manner as test samples. Protein concentration was determined using a Lowry’s method-based assay kit (Bio-Rad Laboratories, Hercules, USA). Hemoglobin content is expressed in μg of hemoglobin per mg of protein.
Preprocessing of Brain Section
In order to determine the volume and location of the hematoma objectively and automatically, two segmentation steps must be considered. The first segmentation is to extract the brain section from the scanning glass background. The second segmentation is to extract the hematoma pixels from the brain section.
The first segmentation is a preprocessing procedure. When brain sections were scanned, the brain tissue and background were affected by operation settings, such as illumination, reflection, absorption, brain tissue preservation and so on. Considering the characteristic curvature of the section boundary, we developed an edge detection method that combines intensity gradient and smoothed boundary feature to extract the brain section from the background (Fig. 1). This step of segmentation is a common practice in image processing. Technical details have been discussed in previous literature or textbooks [24–26].
Fig. 1.
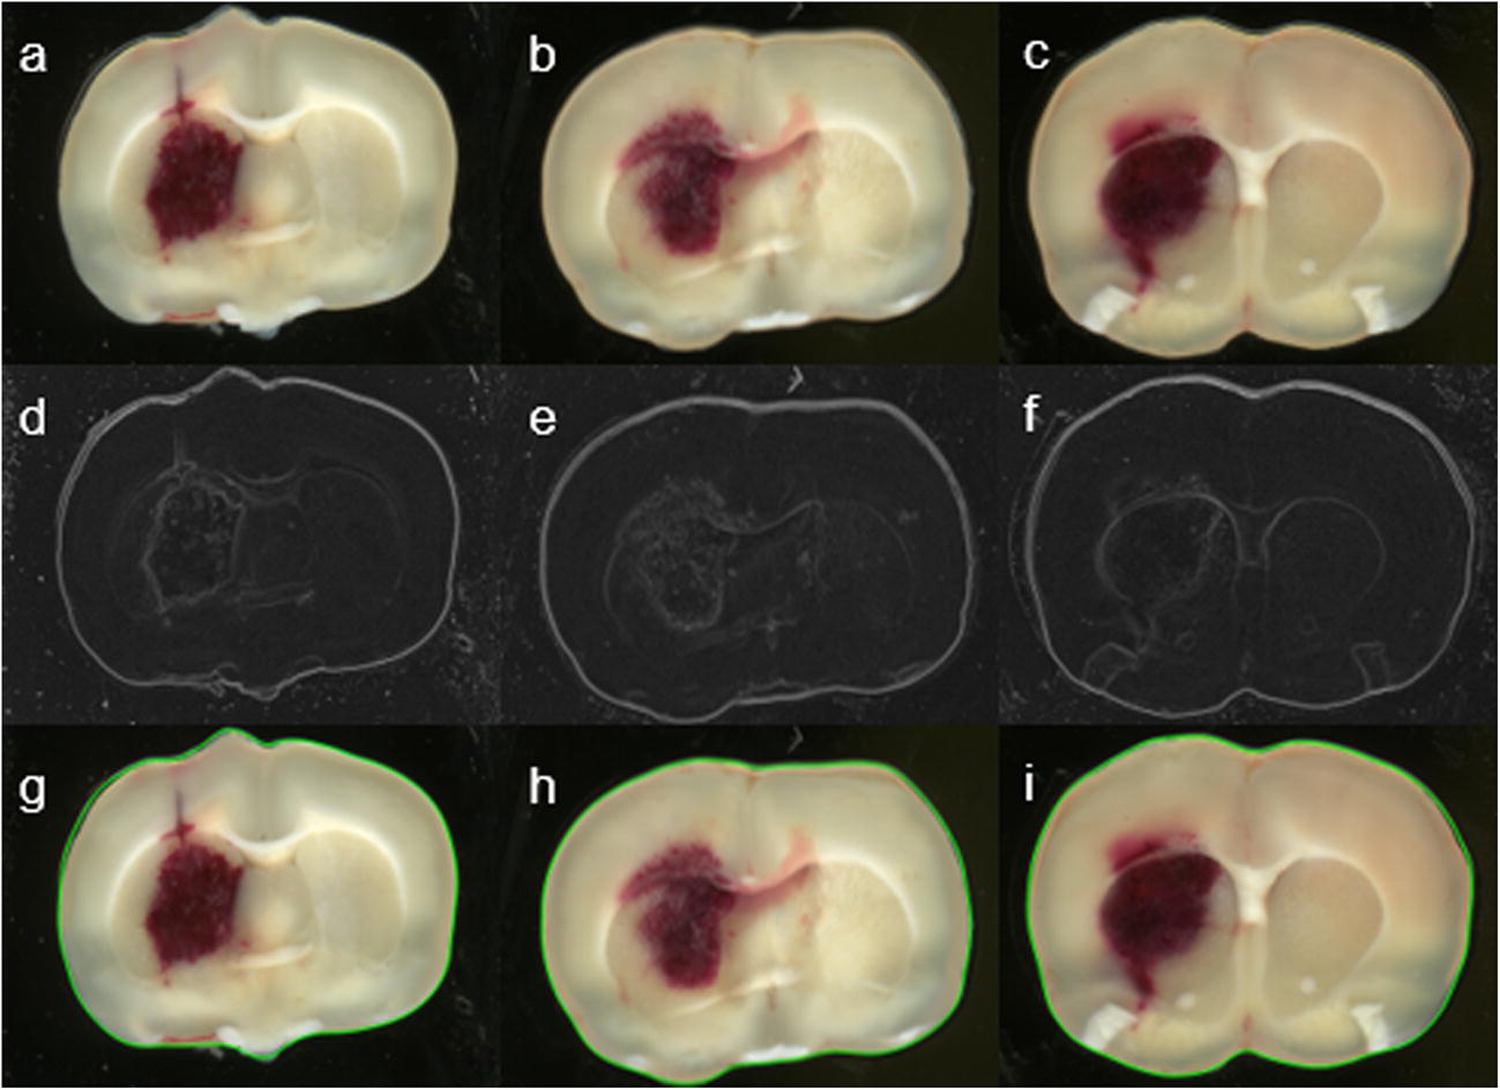
Examples of digitized brain sections of rats subjected to the hemorrhagic stroke described above. Top row (a-c): Original sections show the brain tissue and surrounding background. Middle row (d-f): Edge detection based on image gradients forms the boundary of the section. Bottom row (g-i): Extracted sections (delineated with green lines) are available for color segmentation.
Color Segmentation
After the brain section is separated from the background, the second step is to identify and extract the pixels belonging to the hematoma area from all pixels on the section. In manual segmentation, the investigator identifies the “bloodiness” region based on experience or with reference to the hematoma core [14]. In automated segmentation, we need to find a threshold, as a separation point, that can distinguish the “bloodiness” pixels automatically without human interference. Since the image is in the red, green, and blue (RGB) color space, each pixel is actually a three-dimensional (3D) vector. The 3D vector contains not only information about the ratio of RGB components but also can be linearly converted to the grayscale (intensity) of the pixel, defined as [25, 26]:
| (1) |
One would be able to solve the segmentation problem through a complicated 3D vector analysis approach. However, seeking a simple and practical solution, we investigated the histograms of each color-channel image and the histogram of the grayscale image for all the brain slices with hematoma (Fig. 2). We found that there generally exists a “bi-peak” distribution in each histogram. It is obvious that the major peak represents pixels belonging to the brain’s normal tissue and the second less-noticeable peak represents pixels belonging to the hematoma volume. The value corresponding to the deepest point of the valley between the major peak and the small peak supposes to be the separation value, i.e., the threshold or close to the threshold, to distinguish normal tissue and hematoma tissue. In terms of color, hematoma pixels ought to be close to the red color and the histogram for the R channel should indicate this difference. However, since color distribution and hematoma pixel distribution are less dominant among all pixels, the difference is almost indistinguishable from individual color or grayscale intensity (linearly combined color) channels. Based on this initial investigation, it is difficult to determine a threshold for segmentation. However, it motivated us to further investigate the histogram-based approach.
Fig. 2.
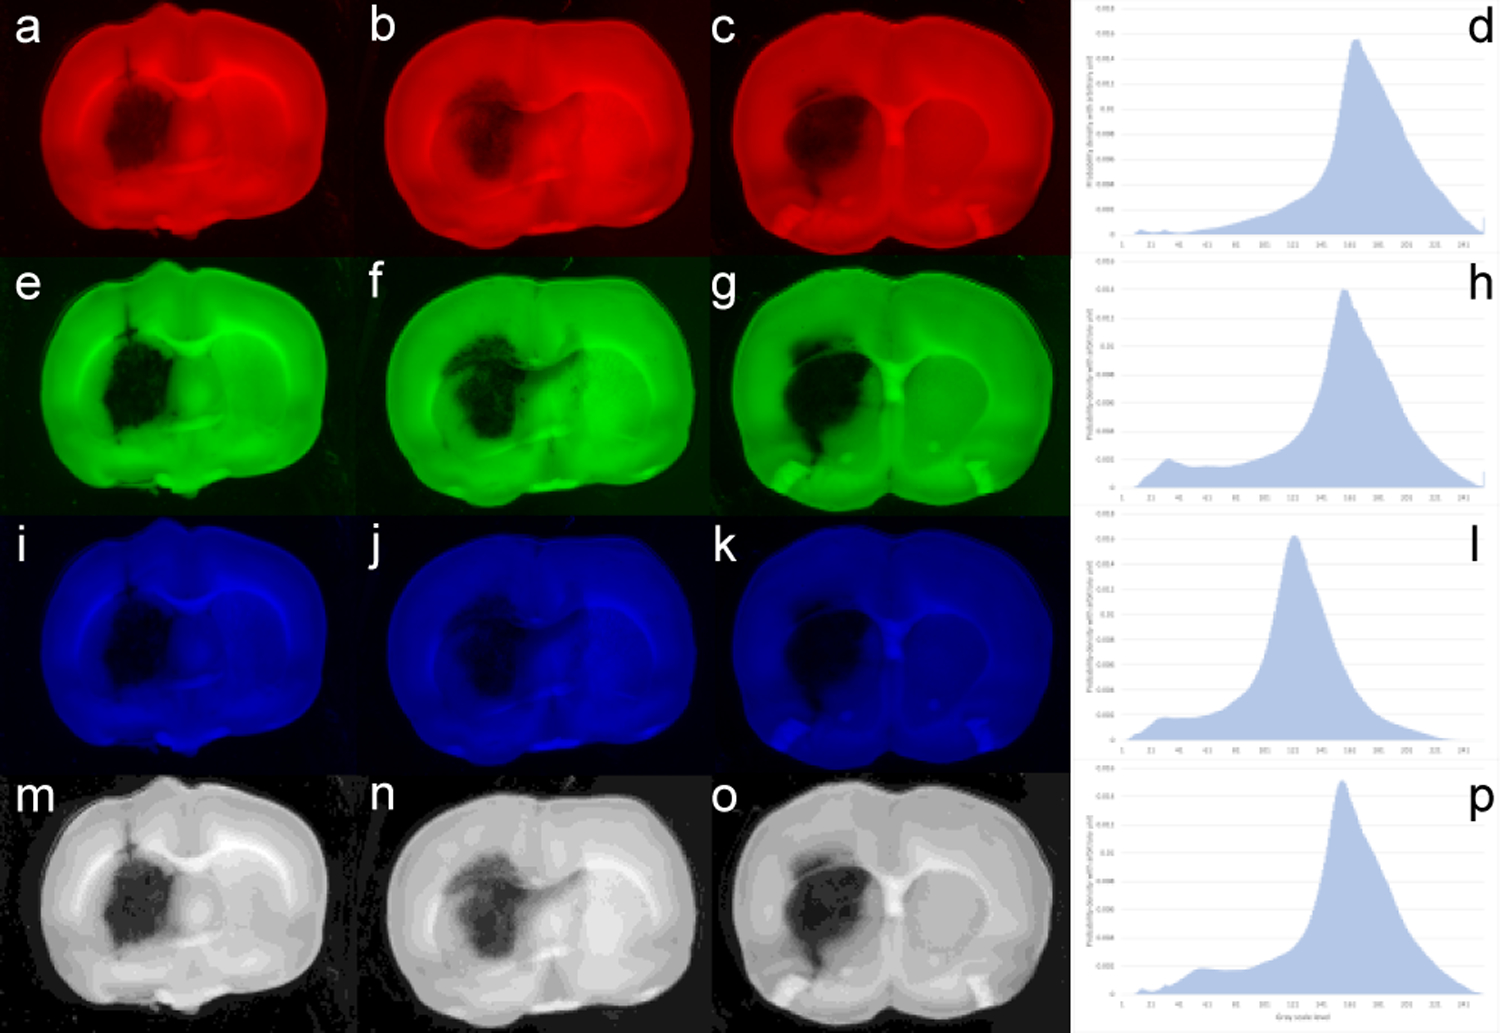
Images displayed in R (a-c), G (e-g), B (i-k), and intensity (m-o) channels from top row to bottom row, respectively. Right column (d, h, l, p) shows the histogram corresponding to each channel. Though the bi-peak distributions can be recognized, identification of the small peak that represents hematoma pixels is extremely difficult. The small peaks are either too small or almost merged into the major peaks without clear separation points
The RGB color space can also be converted into a cylindrical color space, i.e., Hue, Saturation, and Value (HSV) space. In the HSV space, Hue represents the color, Saturation represents the richness of the color, and Value represents the brightness of the color [27]. Since the hematoma region is mostly determined by its color change, we are then particularly interested in the conversion from RGB to Hue (H). Given R, G, and B values, the H-value ranges between 0° to 360° and is converted by the following equations:
| (2) |
This conversion sets a cycling function for Hue in a range of [0°, 360°]. Converting RGB to Saturation (S) and Value (V) follows different equations [24–26]. The Saturation and Value contribute insignificantly to the hematoma color definition, e.g., severe hematoma regions may have low intensity while light hematoma regions may have high intensity, due to the slice thickness and the degree of severity. We focus our investigation on the Hue dimension. Thus, by transforming from RGB color space to HSV color space and emphasizing the Hue dimension, we reduce this three-dimensional problem (three histograms) to be a one-dimensional problem (one histogram only). We selected all slices with different severity of cerebral hemorrhage and converted each RGB image into a Hue map. We then generated a Hue histogram for the whole study (Fig. 3).
Fig. 3.
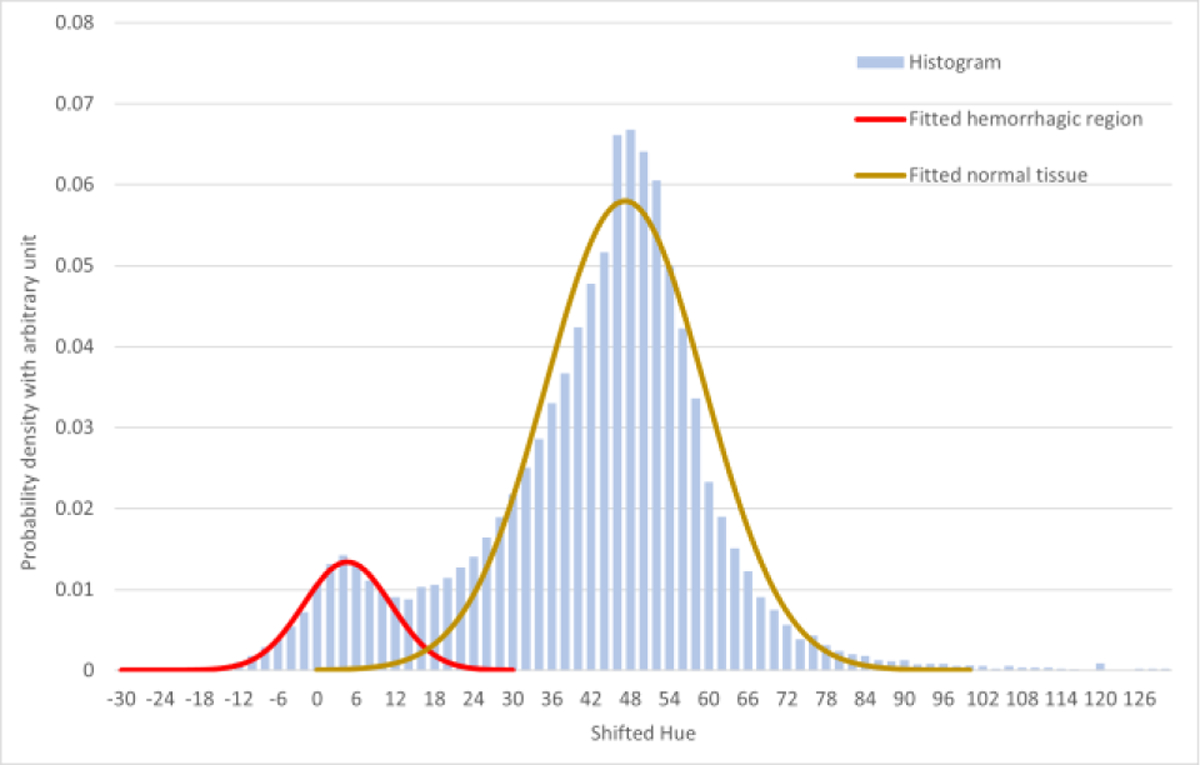
The Hue histogram consists of two overlapped peaks, one peak representing pixels belonging to the normal tissue, and the other peak representing pixels belonging to the hematoma tissue. It is reasonable to assume that distribution of normal brain tissue and the distribution of hematoma tissue are independent. These two peaks can be fitted into two Gaussian distributions (with R2 = 0.9949 for hematoma peak, and R2 = 0.9713 for normal brain tissue peak), and the overall histogram can be seen as a linear combination of these two Gaussian distributions. Though the “valley” between two distributions is not deep to zero, i.e., completely separate, we can seek available theory to solve the problem.
Separating normal and hematoma tissues then becomes a classification problem from this specific histogram. The Bayes classifier provides an optimal solution to this kind of problem in image processing applications [28, 29]. To employ the Bayes classifier to distinguish hematoma pixels from normal pixels, we define two hypotheses:
Hypothesis 1: x belongs to C1,
Hypothesis 2: x belongs to C2,
where C1 (normal tissue) and C2 (hematoma tissue) denote two classes of Hue values. Let p1 be the prior probability that x (Hue) belongs to C1, and p2 = 1 − p1 be the prior probability that x (Hue) belongs to C2. We can define
| (3) |
as the conditional density functions of x (Hue) belonging to C1 and C2, respectively. The combination of p1f1 + p2f2 = f is functionally identical to the Hue histogram; and initial values of the prior probabilities of p1 and p2 can be estimated by the deepest-valley threshold, i.e. p1 is the number of pixels on the left of the deepest-valley divided by the total number of pixels and p2 = 1 - p1. According to the Bayes rule, the optimal cutting point x (Hue) with minimum risk should satisfy:
| (4) |
The equal sign defines the optimal value x to distinguish the two classes. Since the two density functions f1 and f2 have already been fitted into Gaussian distributions, the optimal threshold (T) can be obtained by solving the quadratic function below:
| (5) |
where m1 and δ1 are the mean and standard deviation for the first distribution and m2 and δ2 are the mean and standard deviation for the second distribution. Note that the initial probabilities (i.e. the threshold based on the deepest valley) need to be updated after the first threshold is obtained. We then recursively perform the Bayes classifier until the threshold value (T) converges. The solution to the above equation defines the hematoma’s Hue higher bound. The lower bound is defined by m1 - 3δ1 based on the parameters of Gaussian distribution so that the classified hematoma pixels have more than 99.7% confidence.
Results
Comparison between Manual Segmentation and Automated Segmentation
By using previously developed manual processing method, an investigator selected a sample of hematoma region and used Adobe® Photoshop® to delineate all hematoma pixels on the section. The results may vary on different sections because the sample from a hematoma region may not be the same (Fig. 4), and some scattered hematoma pixels away from the hematoma center could be neglected. The results may also depend on the investigator’s training experience. Sometimes, multiple trails are required to produce an averaged result. The proposed method, however, is based on the threshold that is obtained through the Bayes theorem. This mathematical optimal threshold value is unique throughout the whole animal. Therefore, segmentation is uniformly processed for all sections (Fig. 4).
Fig. 4.
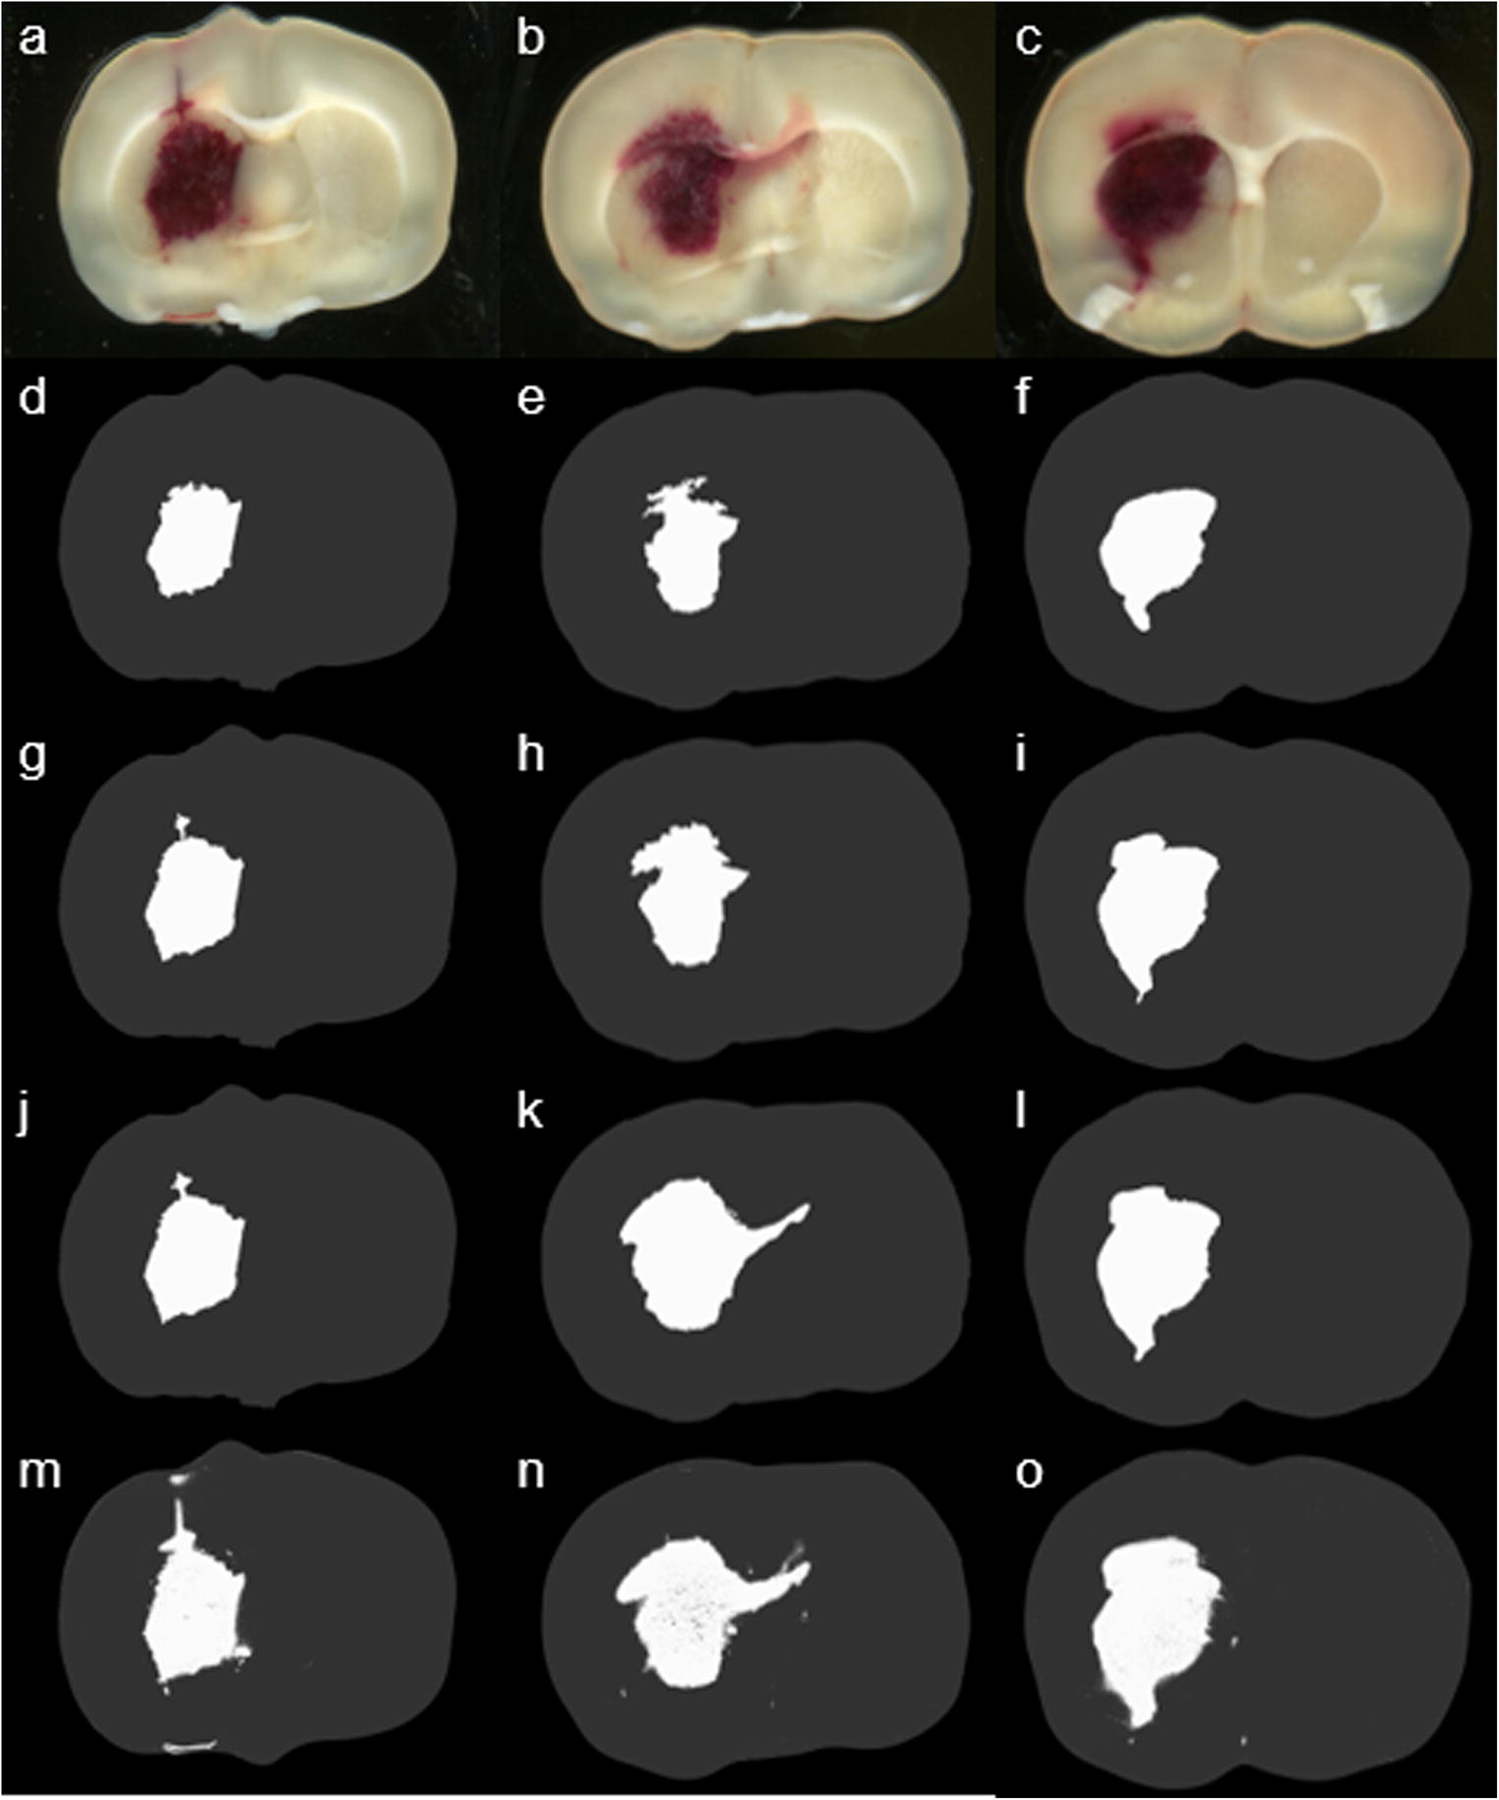
The top row (a-c) shows the original sections at different bregma levels. The second to the forth row (d-l) of the images represent three different manual segmentations by using Adobe® Photoshop®. Due to a different sample of hematoma regions each time, delineation of the hematoma region was determined by a different threshold. The bottom row (m-o) shows the results from the proposed automated color segmentation processing procedure.
Comparison between Hemoglobin Contents and Volumes Produced by Image Processing
Hemoglobin content obtained through spectrophotometric hemoglobin assay is considered as the “gold standard” for hematoma volume estimation [9]. The only disadvantage of the method is the loss of “region-specific” information due to the required tissue homogenization process. After digitizing all sections from 10 rats, we ran a spectrophotometric assay to obtain each rat’s hemoglobin content. We then compared them with corresponding volumes produced by manual segmentation and automated segmentation. We observed that both methods are linearly correlated to the hemoglobin contents with statistical significance. However, the automated method is superior to the manual method (Fig. 5).
Fig. 5.
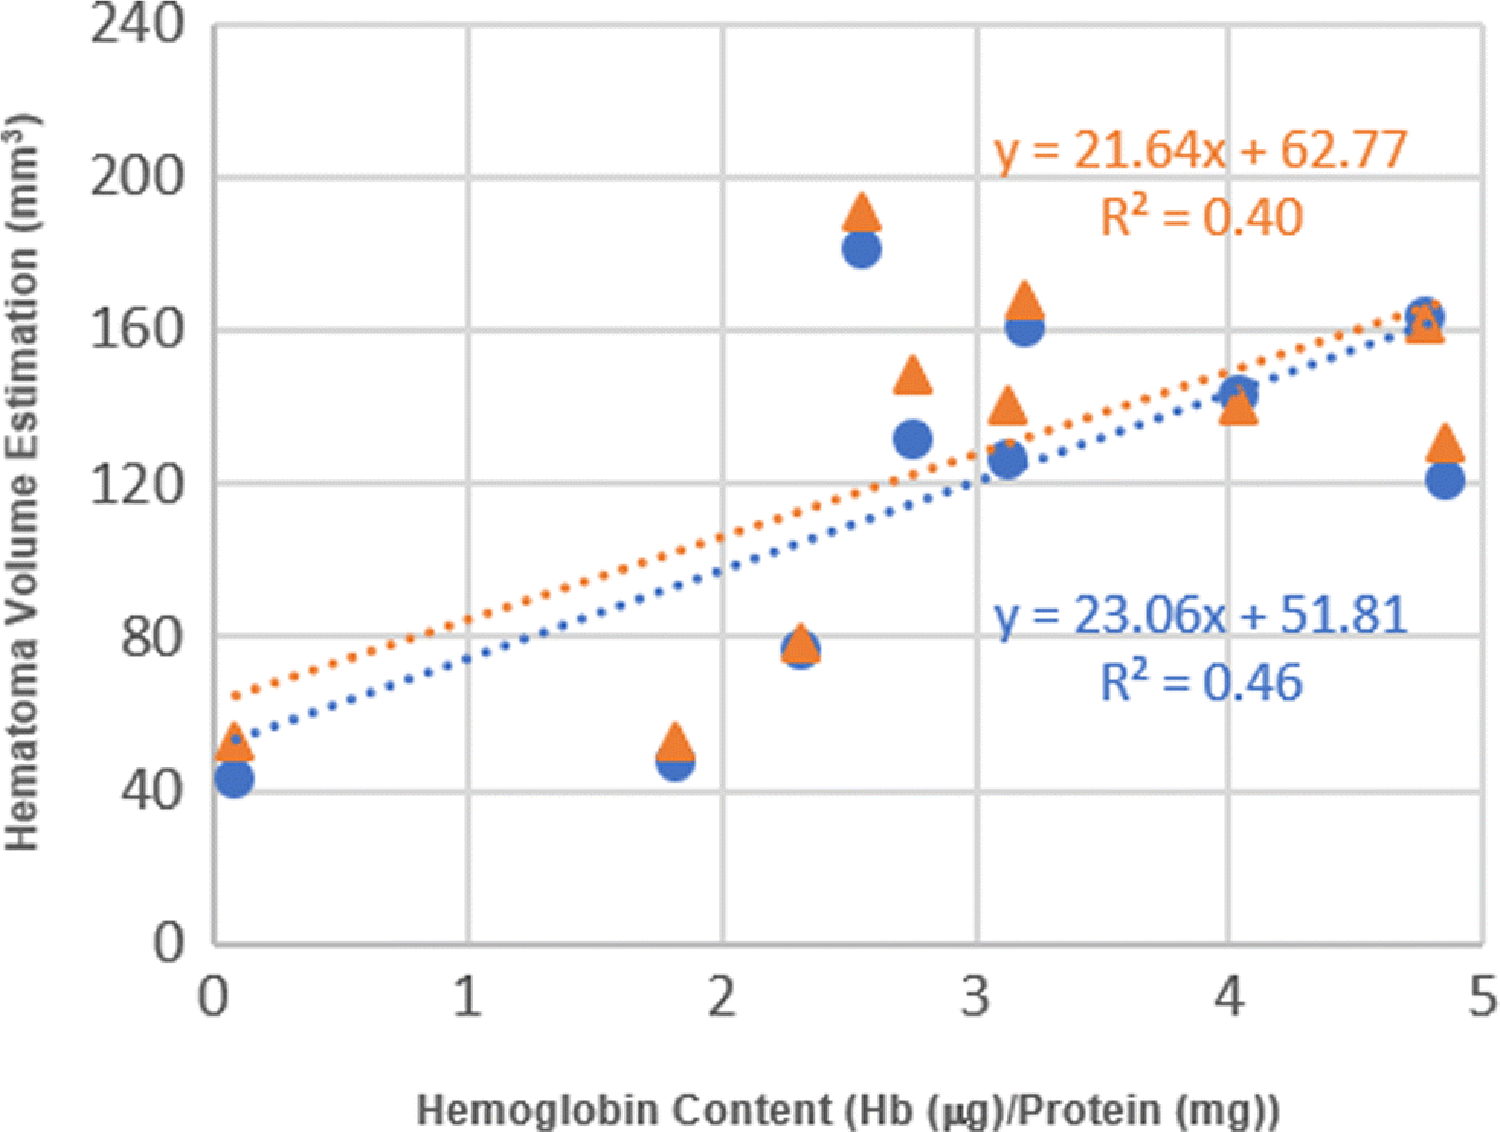
Correlation between hemoglobin content and estimated hematoma volume by the manual method and automated method. Data point (orange triangle) shows a linear correlation between hemoglobin content and volume obtained by manual segmentation method (R2 = 0.40, n = 10, p < 0.048). Data point (blue circle) shows a linear correlation between hemoglobin content and volume by automated segmentation method (R2 = 0.46, n = 10, p < 0.031).
Comparison between Rat Model and Mouse Model
To further validate the developed method, we first randomly selected 140 hematoma images from 84 rats. We compared the hematoma area (mm2) on each section by different methods. In this study, an experienced investigator blinded to experimental conditions outlined the hematoma area on each section by using the ImageJ software. Then, the hematoma data processing became very labor intensive. While using the developed automated method, processing efficiency was dramatically enhanced. Few hours of manual delineation by using the ImageJ software was reduced to a few minutes of processing. On the outcome scatter plot, the x and y coordinates of each point correspond to the estimated hematoma area of all images by the manual process and the automated process, respectively (Fig. 6A). It shows that the outcome by the automated processing was highly correlated to the result by the manual processing. From the correlation plot, the trend shows that the automated processing includes slightly more hematoma pixels than the manual processing. Similarly, we did the same process on 75 images from 13 mice that were subjected to autologous blood injection-induced ICH. We observed a similar correlation (Fig. 6B). Hematoma areas produced by the automated method are smaller than those produced by the manual method in the mouse model. This difference is most likely induced by relatively low resolution from digitization. Images of mice were scanned at a resolution of 300 dpi from a collaborator’s laboratory. While using manual delineation, if a non-hematoma pixel was included (false positive), the area of hematoma would easily increase. Images of rats were scanned at a resolution of 2400 dpi. These results demonstrate that our newly developed software-based estimation of hematoma volume requires high resolution images to correctly estimate hematoma volume.
Fig. 6.
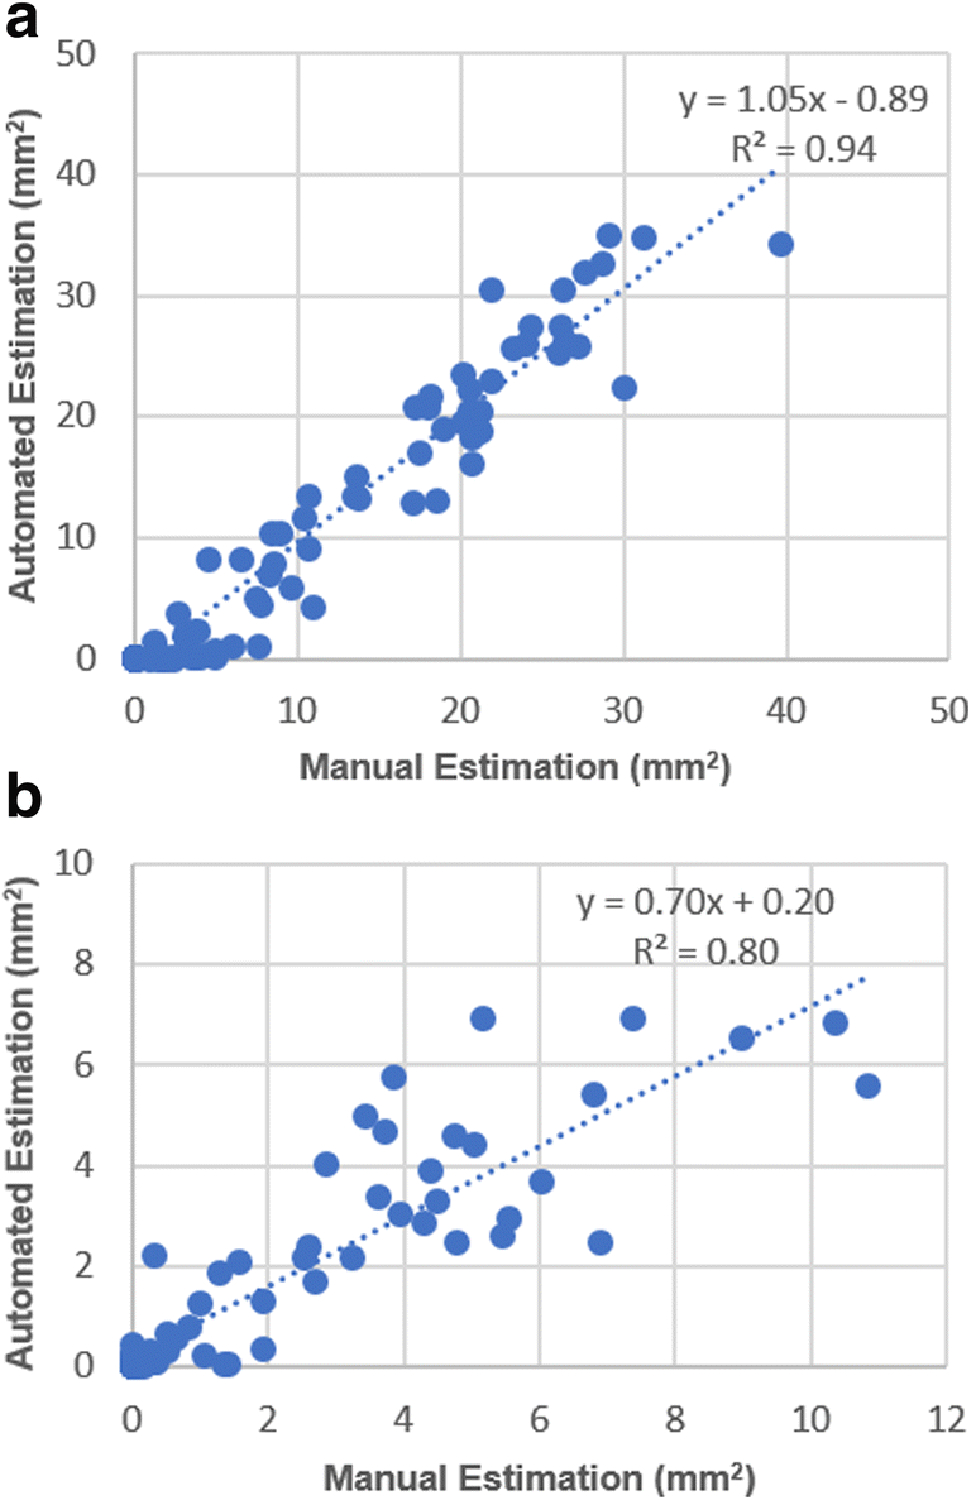
(A) Rat model: Correlation between manually acquired hematoma area and automatically acquired hematoma area shows that the proposed method is consistent with the manual processing (slope = 1.05, R2 = 0.94, p < 0.0001). (B) Mouse model: Correlation between manually acquired hematoma area and automatically acquired hematoma area shows that the manual processing slightly overestimated hematoma area (slope = 0.70, R2 = 0.80, p < 0.0001).
Discussion
It has been shown that the operator-acquired hematoma volume using “digital measure tools” provided by Photoshop® has a linear relationship with results obtained from spectrophotometric hemoglobin assay. However, the digital measurement tools require manually selecting a sample from the hematoma area in every brain slice (image). Photoshop® would then identify all the pixels that have similar color to the sample color in the image. The operator may need to select multiple color samples in order to visually confirm that the hematoma areas are covered. The automated assessment method utilizes the Bayes classifier and characteristics of Gaussian distribution to determine the hematoma pixels optimally. The Hue threshold, i.e., the separating point between normal and hematoma, is based on mathematical principles that assure a minimum estimation error. In addition, the histogram is generated from all animal sections such that the operator does not need to sample a brain section by section. The processing time for each animal is reduced to only a few seconds.
In order to compare with the “gold standard,” we ran the spectrophotometric assay on 10 rats. Comparisons demonstrate that the proposed method has a higher reliability than the manual method for hematoma estimation. Both methods were tested on 140 images from 84 rats and 75 images from 13 mice. We observed that (1) for the rat model, our laboratory digitized the brain sections at a resolution of 2400 dpi. Results from the automated method and from the manual method are very close to each other. The automated method estimates slightly more hematoma pixels than the manual method (slope = 1.05). A possible reason is that the automated method can identify “isolated” hematoma pixels, but the manual method cannot. (2) For the mouse model, our collaborator’s laboratory digitized the brain sections at a resolution of 300 dpi. Results show that the automated method estimates smaller hematoma areas than the manual method (slope = 0.70). A possible reason is that the manual method could not perform a “fine-delineation” and would easily include adjacent non-hematoma pixels into the hematoma region, because of the low resolution, to produce relatively larger hematoma areas.
In order to further validate the proposed method, we conducted validation experiments through phantom simulations. We first selected a large number of rat brain slices and analyzed their RGB distribution (mean and standard deviation) in regions of hematoma center, peripheral hematoma, and normal tissue. We generated a number of digital phantoms. Each phantom was associated with a randomly generated hematoma severity level and a hematoma shape. We generated “spikes-growing hematoma area” to simulate the irregularity of the hematoma shape (Fig. 7). The shape irregularity was quantified by the randomly assigned length of spikes, which are proportional to the diameter of the hematoma core. The simulated hematoma center was assigned the mean of the RGB distribution from rat brain slices. The color at the spikes was assigned the RGB distribution with randomly added standard deviation from the peripheral hematoma of rat brain slices so that the spikes had variable lengths and color variations to simulate the hematoma’s irregular shape and severity level. For the background of the phantom, we assigned the mean of RGB distribution with randomly added standard deviation from the rat brain slices’ normal tissue region to simulate noise. The validation experiments show that the proposed automated assessment program is able to segment the hematoma from the normal brain tissue. When we added noise level to three standard deviations on the background, the assessed hematoma volume remains almost unchanged. Comparing with the ground truth, less than 5% errors yielded from all noise levels. On the other hand, if operators selected samples from the hematoma core, the spikes would not be fully delineated because of RGB variations. If manually segmenting the hematoma, it would require significant amount of time. The simulation demonstrates the robustness of the proposed method.
Fig. 7.
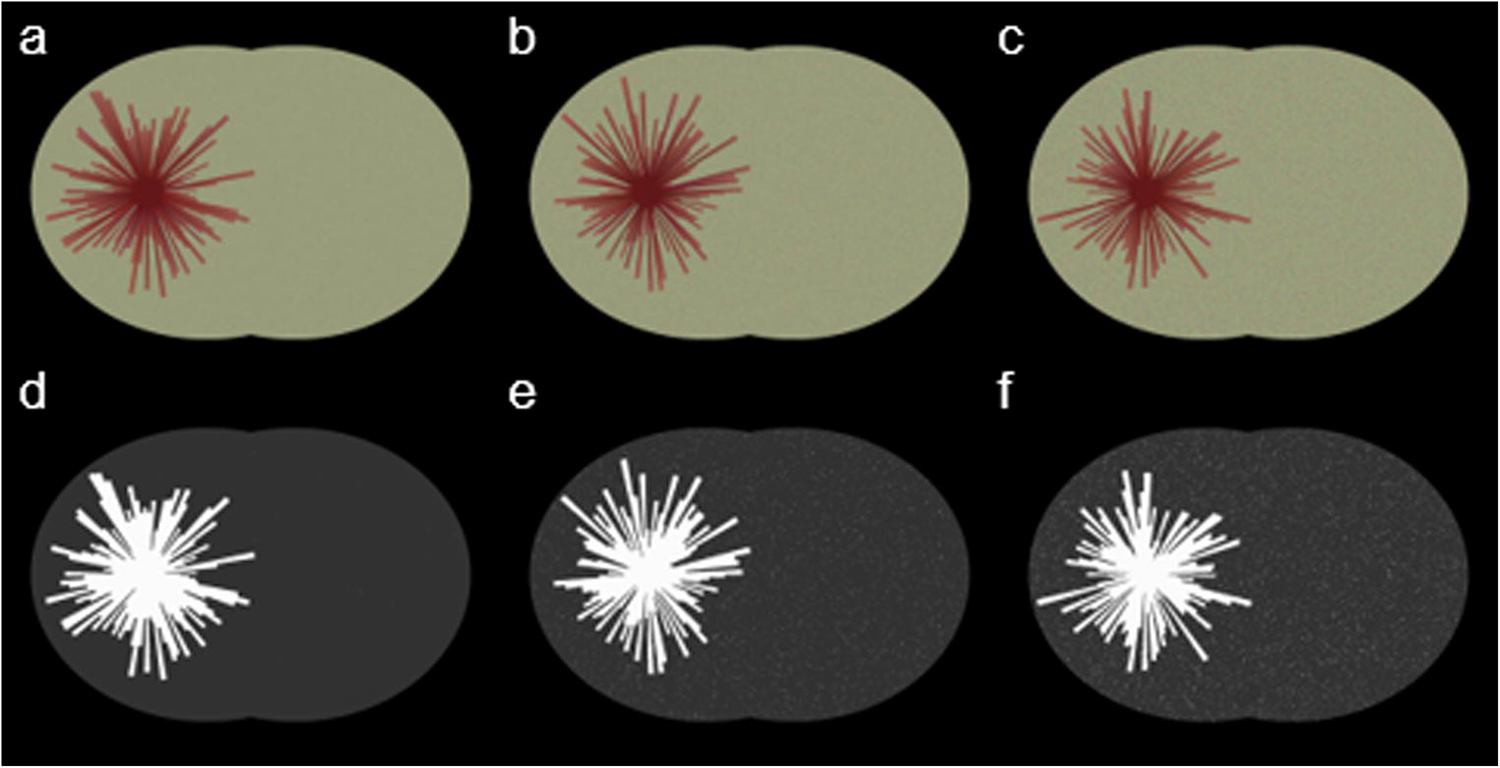
Simulated phantoms and automated segmentation results at various noise level settings. Images on top row (a–c) are simulated phantoms, and the corresponding segmented images (d–f) are the automated processed results. The noise level increased from one standard deviation to triple standard deviation from left to right
Conclusion
An accurate assessment of hematoma volume plays a crucial role in experimental hemorrhagic stroke research. We proposed an automated segmentation method, which converts image from RGB space to Hues space, and uses the Bayes classification theorem to distinguish hematoma pixels from normal pixels. The method is written by MatLab codes. The method was validated on brain sections of rats and mice subjected to experimental ICH. The obtained results linearly correlated to the hemoglobin content by the spectrophotometric assay with statistical significance. The obtained results also agreed with the results obtained by operator’s manual process. We also conducted a validation study to demonstrate the method’s robustness. The method can be potentially applied to other color segmentation problems.
Acknowledgement
This study was partially sponsored by the National Institutes of Health (grant number NS094896). Authors are grateful to Dr. Jian Wang’s Laboratory of Johns Hopkins University for providing images of mice.
Funding:
This study was partially funded by the National Institutes of Health (grant number NS094896).
Footnotes
Publisher's Disclaimer: This Author Accepted Manuscript is a PDF file of a an unedited peer-reviewed manuscript that has been accepted for publication but has not been copyedited or corrected. The official version of record that is published in the journal is kept up to date and so may therefore differ from this version.
Compliance with Ethical Standards
Conflict of Interest: All authors (Zhexuan Zhang, Sunjoo Cho, Ashish K. Rehni, Hever Quero Navarro, Kunjan R. Dave, and Weizhao Zhao) declare that they have no conflicts of interest.
Ethical approval: Experimental procedures on animals were carried out as per the Guide for the Care and Use of Laboratory Animals laid down by the National Institutes of Health and in accordance with the protocols approved by the Institutional Animal Care and Use Committee of the University of Miami. This article does not contain any studies with human participants performed by any of the authors.
Reference
- 1.Benjamin EJ, Blaha MJ, Chiuve SE, Cushman M, Das SR, Deo R et al. Heart Disease and Stroke Statistics-2017 Update: A Report From the American Heart Association. Circulation. 2017;135(10):e146–e603. doi: 10.1161/CIR.0000000000000485. [DOI] [PMC free article] [PubMed] [Google Scholar]
- 2.Lakshminarayan K, Berger AK, Fuller CC, Jacobs DR Jr., Anderson DC, Steffen LM et al. Trends in 10-year survival of patients with stroke hospitalized between 1980 and 2000: the Minnesota stroke survey. Stroke. 2014;45(9):2575–81. doi: 10.1161/STROKEAHA.114.005512. [DOI] [PMC free article] [PubMed] [Google Scholar]
- 3.van Asch CJ, Luitse MJ, Rinkel GJ, van der Tweel I, Algra A, Klijn CJ. Incidence, case fatality, and functional outcome of intracerebral haemorrhage over time, according to age, sex, and ethnic origin: a systematic review and meta-analysis. Lancet Neurol 2010;9(2):167–76. doi: 10.1016/S1474-4422(09)70340-0. [DOI] [PubMed] [Google Scholar]
- 4.Ariesen MJ, Claus SP, Rinkel GJ, Algra A. Risk factors for intracerebral hemorrhage in the general population: a systematic review. Stroke. 2003;34(8):2060–5. doi: 10.1161/01.STR.0000080678.09344.8D. [DOI] [PubMed] [Google Scholar]
- 5.Veltkamp R, Purrucker J. Management of Spontaneous Intracerebral Hemorrhage. Curr Neurol Neurosci Rep 2017;17(10):80. doi: 10.1007/s11910-017-0783-5. [DOI] [PMC free article] [PubMed] [Google Scholar]
- 6.Carmichael ST. Rodent models of focal stroke: size, mechanism, and purpose. NeuroRx 2005;2(3):396–409. doi: 10.1602/neurorx.2.3.396. [DOI] [PMC free article] [PubMed] [Google Scholar]
- 7.Ren C, Sy C, Gao J, Ding Y, Ji X. Animal Stroke Model: Ischemia-Reperfusion and Intracerebral Hemorrhage. Methods Mol Biol 2016;1462:373–90. doi: 10.1007/978-1-4939-3816-2_21. [DOI] [PubMed] [Google Scholar]
- 8.James ML, Warner DS, Laskowitz DT. Preclinical models of intracerebral hemorrhage: a translational perspective. Neurocrit Care. 2008;9(1):139–52. doi: 10.1007/s12028-007-9030-2. [DOI] [PubMed] [Google Scholar]
- 9.Choudhri TF, Hoh BL, Solomon RA, Connolly ES Jr., Pinsky DJ. Use of a spectrophotometric hemoglobin assay to objectively quantify intracerebral hemorrhage in mice. Stroke. 1997;28(11):2296–302. [DOI] [PubMed] [Google Scholar]
- 10.Merali Z, Wong T, Leung J, Gao MM, Mikulis D, Kassner A. Dynamic contrast-enhanced MRI and CT provide comparable measurement of blood-brain barrier permeability in a rodent stroke model. Magn Reson Imaging. 2015;33(8):1007–12. doi: 10.1016/j.mri.2015.06.021. [DOI] [PubMed] [Google Scholar]
- 11.Boltze J, Ferrara F, Hainsworth AH, Bridges LR, Zille M, Lobsien D et al. Lesional and perilesional tissue characterization by automated image processing in a novel gyrencephalic animal model of peracute intracerebral hemorrhage. J Cereb Blood Flow Metab 2018:271678X18802119. doi: 10.1177/0271678X18802119. [DOI] [PMC free article] [PubMed] [Google Scholar]
- 12.Lyden PD, Madden KP, Clark WM, Sasse KC, Zivin JA. Incidence of cerebral hemorrhage after treatment with tissue plasminogen activator or streptokinase following embolic stroke in rabbits [corrected]. Stroke. 1990;21(11):1589–93. [DOI] [PubMed] [Google Scholar]
- 13.Swanson RA, Morton MT, Tsao-Wu G, Savalos RA, Davidson C, Sharp FR. A semiautomated method for measuring brain infarct volume. J Cereb Blood Flow Metab 1990;10(2):290–3. doi: 10.1038/jcbfm.1990.47. [DOI] [PubMed] [Google Scholar]
- 14.Tang XN, Berman AE, Swanson RA, Yenari MA. Digitally quantifying cerebral hemorrhage using Photoshop and Image J. J Neurosci Methods. 2010;190(2):240–3. doi: 10.1016/j.jneumeth.2010.05.004. [DOI] [PMC free article] [PubMed] [Google Scholar]
- 15.Yang Y, Li Q, Shuaib A. Enhanced neuroprotection and reduced hemorrhagic incidence in focal cerebral ischemia of rat by low dose combination therapy of urokinase and topiramate. Neuropharmacology. 2000;39(5):881–8. [DOI] [PubMed] [Google Scholar]
- 16.Pal NR, Pal SK. A Review on Image Segmentation Techniques. Pattern Recogn 1993;26(9):1277–94. doi:Doi 10.1016/0031-3203(93)90135-J. [DOI] [Google Scholar]
- 17.Cheng HD, Jiang XH, Sun Y, Wang JL. Color image segmentation: advances and prospects. Pattern Recogn 2001;34(12):2259–81. doi:Doi 10.1016/S0031-3203(00)00149-7. [DOI] [Google Scholar]
- 18.Wu C, Daugherty A, Lu H. A Color Segmentation-Based Method to Quantify Atherosclerotic Lesion Compositions with Immunostaining. Methods Mol Biol 2017;1614:21–30. doi: 10.1007/978-1-4939-7030-8_2. [DOI] [PubMed] [Google Scholar]
- 19.Zhang C, Xiao X, Li X, Chen YJ, Zhen W, Chang J et al. White blood cell segmentation by color-space-based k-means clustering. Sensors (Basel) 2014;14(9):16128–47. doi: 10.3390/s140916128. [DOI] [PMC free article] [PubMed] [Google Scholar]
- 20.MacLellan CL, Auriat AM, McGie SC, Yan RH, Huynh HD, De Butte MF et al. Gauging recovery after hemorrhagic stroke in rats: implications for cytoprotection studies. J Cereb Blood Flow Metab 2006;26(8):1031–42. doi: 10.1038/sj.jcbfm.9600255. [DOI] [PubMed] [Google Scholar]
- 21.MacLellan CL, Silasi G, Poon CC, Edmundson CL, Buist R, Peeling J et al. Intracerebral hemorrhage models in rat: comparing collagenase to blood infusion. J Cereb Blood Flow Metab 2008;28(3):516–25. doi: 10.1038/sj.jcbfm.9600548. [DOI] [PubMed] [Google Scholar]
- 22.Rosenberg GA, Mun-Bryce S, Wesley M, Kornfeld M. Collagenase-induced intracerebral hemorrhage in rats. Stroke. 1990;21(5):801–7. [DOI] [PubMed] [Google Scholar]
- 23.Wu G, Bao X, Xi G, Keep RF, Thompson BG, Hua Y. Brain injury after intracerebral hemorrhage in spontaneously hypertensive rats. J Neurosurg 2011;114(6):1805–11. doi: 10.3171/2011.1.JNS101530. [DOI] [PMC free article] [PubMed] [Google Scholar]
- 24.Dougherty G Digital image processing for medical applications. Cambridge University Press; 2009. [Google Scholar]
- 25.Bankman IN, Morcovescu S. Handbook of medical imaging. processing and analysis. Medical Physics. 2002;29(1):107-. [Google Scholar]
- 26.Russ JC. The image processing handbook. CRC press; 2016. [Google Scholar]
- 27.Smith AR. Color gamut transform pairs. ACM Siggraph Computer Graphics. 1978;12(3):12–9. [Google Scholar]
- 28.Rish I, editor. An empirical study of the naive Bayes classifier. IJCAI 2001 workshop on empirical methods in artificial intelligence; 2001: IBM New York. [Google Scholar]
- 29.Young TY. Handbook of pattern recognition and image processing (vol. 2): computer vision. Academic Press, Inc.; 1994. [Google Scholar]


