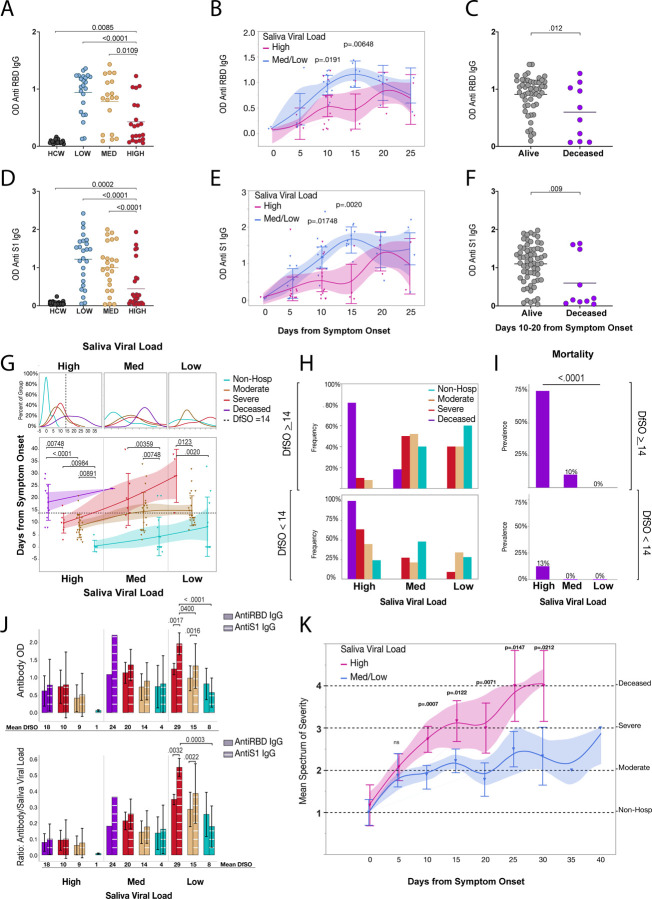
Fig. 4|. Early escape from high saliva viral load is associated with better antibody production and recovery.
a-k, a, Comparison of mean anti-RBD IgG levels between low, medium, and high saliva viral Load and uninfected healthcare workers. Comparisons were done using a one-way ANOVA p-values were adjusted using Tukey method for multiple comparisons. b, Least squares means analysis comparing Anti-RBD IgG levels amongst patients with high vs medium and low saliva viral load over days from symptom onset. Timepoints represent 5-day bins. P values are adjusted for multiple comparisons using Sidak correction. Whiskers and shading represent the 95% confidence interval of the mean. c, Comparison of the mean Anti-RBD IgG levels amongst alive and deceased individuals between days 10–20 from symptom onset using a 2-sided t-test and. P-vaules are adjusted for multiple comparisons with Sidak correction. d, e, f, Comparison of Anti-S1 IgG levels as in in a, b, c respectively. g, Comparison of the mean duration of days from symptom onset in the high, medium and low saliva viral load categories amongst spectrum of disease severity. Top Panel shows the Kernel projected percent distribution of time spent for individuals within severity subgroups in the high, medium, or low saliva viral load categories. Bottom panel compares the mean time (y -axis) of each severity subgroup within each saliva viral load category. Points represent a patient time point. Severity is color-coded as indicated on the graph. Lines connect the means within each severity subgroup in each viral load category. Whiskers represent the standard deviation of the mean and shading represents the 95% bootstrap confidence of fit. Comparisons within each viral load category were done by one-way ANOVA and significance was adjusted for multiple comparisons across all categories using the Holm-Sidak method. The dotted line in the top and bottom panels labeled as high viral load Escape Threshold in the legend (Day 14 from symptom onset) represents the rounded average of one standard deviation away from the mean for the moderate and severe groups of patients in the high saliva viral load category who survived. h, Panels are subdivided by the high viral load Escape threshold (Day 14 from symptom onset) as indicated in the Figure. Panels represent the frequency of individuals within each severity group that fall into the high, medium, and low saliva viral load categories before day 14 from symptom onset (bottom) and at or after day 14 from symptom onset (top). i, Subpanels show the prevalence of individuals who go on to die within the high, medium, and low saliva viral load categories before day 14 (bottom) and on or after day 14 (top). Chi-squared tests were used to measure significance. j, Panels show mean levels of Anti S1 IgG and Anti RBD IgG (top) and their ratios over saliva viral load (bottom), amongst severity groups in the high medium and low saliva viral load levels. X-axis denotes saliva viral load levels as well as mean days from symptom onset (DfSO) of each severity group within each viral load level as determined in g. Comparisons of means amongst severity groups is made in the low saliva viral load level via least squares mean analysis using REML to compare Anti S1 IgG and Anti RBD levels between the groups and within groups. P values are adjusted for multiple comparisons using Sidak correction. There was a significant positive interaction between disease severity and higher proportions of Anti S1 IgG over Anti RBD IgG (p=0.0033). k, Least squares mean analysis comparing disease trajectory between high and medium/low viral loads over days from symptom onset. Disease severity was ranked on an increasing scale from 1–4 with 1 being illness not requiring hospitalization, 2 hospitalization with moderate disease, 3 severe disease, and 4 death. Timepoints represent 5-day bins. Points represent the mean score of disease severity for all patients in each bin that fell within the high vs medium/low saliva viral load categories. Whiskers represent the 95% confidence interval and shading represents the bootstrap confidence of fit. There was a significant positive interaction between viral load level and days from symptom onset (p=0.0187).

