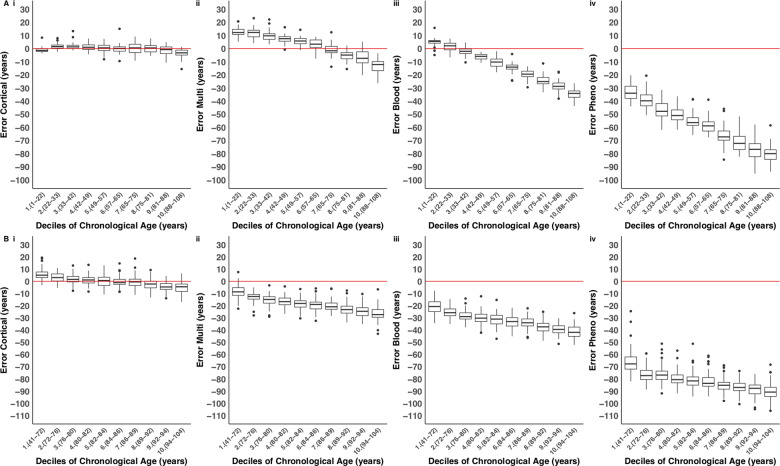
Figure 2.
The cortical DNA methylation age clock has elevated accuracy in human cortex samples across the lifespan. Shown is the distribution of the error (DNA methylation age − chronological age) for each age decile in (A) the testing dataset (n = 350 cortical samples), and (B) the independent test dataset (n = 1221 cortical samples) for each of the four DNA methylation age clocks: (i) our novel DNAmClockCortical; (ii) Horvath’s DNAmClockMulti; (iii) Zhang’s DNAmClockBlood and (iv) Levine’s DNAmClockPheno. Deciles were calculated by assigning chronological age into 10 bins and are represented along the x-axis by the numbers 1 to 10, followed by parentheses, which display the age range included in each decile. The ends of the boxes are the upper and lower quartiles of the errors, the horizontal line inside the box represents the median deviation and the two lines outside the boxes extend to the highest and lowest observations. Outliers are represented by points beyond these lines. The red horizontal line represents perfect prediction (zero error). Our novel DNAmClockCortical [A(i) testing and B(i) independent test] consistently had the smallest error across the age groups, shown by the tightness of the box plot distributions along the zero-error line. The DNAmClockMulti over-predicted younger ages [deciles 1–5 in A(ii)], shown by box plot distributions that are above the zero-error line, and under predicted older ages [deciles 8–10 in A(ii) and deciles 1–10 in B(ii)], shown by box plot distributions below the zero-error line. The DNAmClockBlood [A(iii) testing and B(iii) independent test] and the DNAmClockPheno [A(iv) testing and B(iv) independent test] consistently under predicted age, with under prediction of DNA methylation age increasing with chronological age.

