Figure 2.
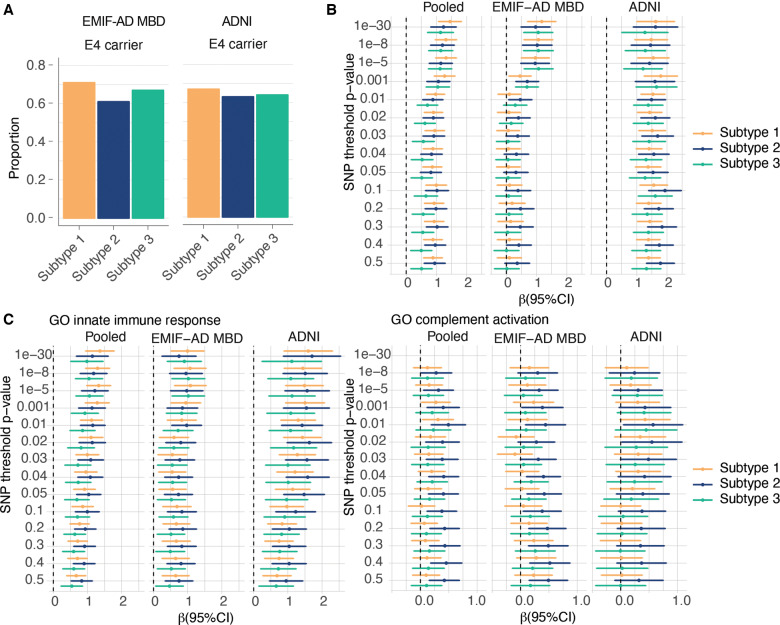
Genetic factor comparisons between subtypes. (A) Proportion of APOE e4 carriers according to subtype. (B) Effect sizes (95% CI) of Alzheimer’s disease polygenic risk scores for increasing SNP inclusion P-value thresholds, comparing Alzheimer’s disease subtypes to the control group (normal cognition, normal CSF amyloid and tau levels). (C) Comparisons of Alzheimer’s disease subtypes in Alzheimer’s disease polygenic risk specific for GO innate immune response (left) and GO complement activation (right), for increasing SNP inclusion P-value thresholds. (B and C) The pooled sample, and the cohorts separately. The dotted vertical lines in B and C indicate mean scores for the control group. See Supplementary Tables 10 and 11 for test statistics of all comparisons.

