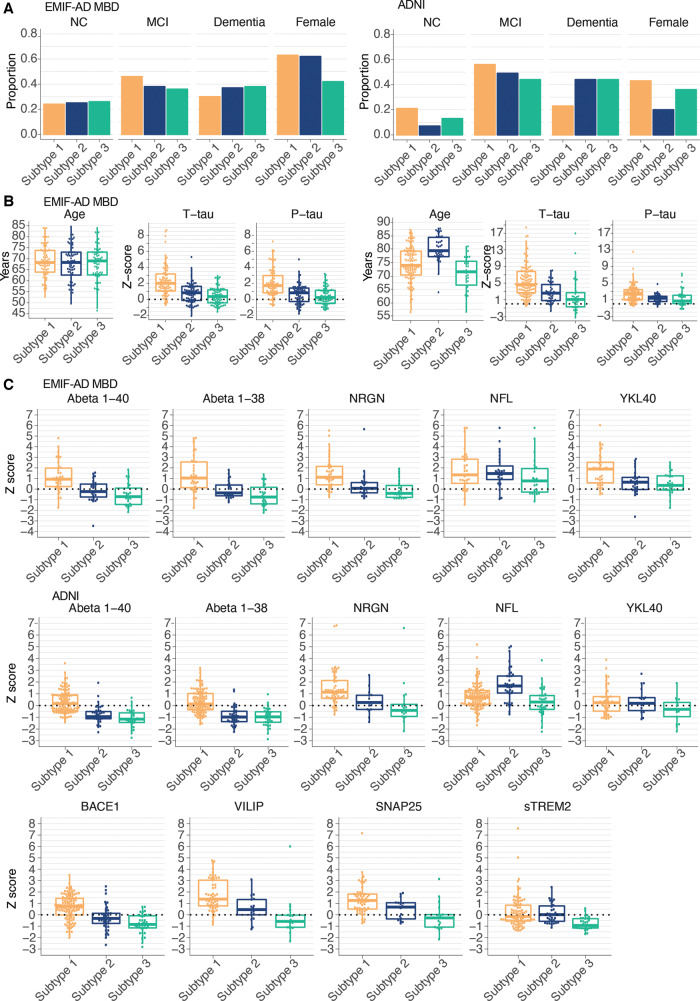
Figure 3.
Clinical stage, age, sex and other CSF markers comparisons between subtypes. (A) Proportions of disease stage (NC = normal cognition), and females according to Alzheimer’s disease subtypes and cohort. (B) Distributions of age, t-tau and p-tau levels according to Alzheimer’s disease subtypes and cohort. (C) Distributions of CSF markers not included in clustering according to subtype and cohort, including additional CSF biomarkers that were available in ADNI only for a subset of individuals. See Supplementary Table 10 for test statistics of all comparisons.

