

Abstract
We mapped the connections of the insular von Economo neuron (VEN) area in ex vivo brains of a bonobo, an orangutan and two gorillas with high angular resolution diffusion MRI imaging acquired in 36 hour imaging sessions for each brain. The apes died of natural causes without neurological disorders. The localization of the insular VEN area was based on cresyl violet-stained histological sections from each brain that were coregistered with structural and diffusion images from the same individuals. Diffusion MRI tractography showed that the insular VEN area are connected with olfactory, gustatory, visual and other sensory systems, as well as systems for the mediation of appetite, reward, aversion and motivation. The insular VEN area in apes is most strongly connected with frontopolar cortex, which could support their capacity to choose voluntarily among alternative courses of action particularly in exploring for food resources. The frontopolar cortex may also support their capacity to take note of potential resources for harvesting in the future (prospective memory). All of these faculties may support insight and volitional choice when contemplating courses of action as opposed to rule-based decision-making.
Keywords: insula, VEN, connection, frontopolar, cortex, exploration
Introduction
The insular VEN area participates in social and monetary decision-making, complex emotions such as empathy and disgust, and self-awareness (Allman et al., 2010; Evrard, 2019). In humans, the frontoinsular cortex comprises the ventral part of agranular insular cortex, which is distinguished by large bipolar cells termed von Economo neurons (VENs; von Economo and Koskinas, 1925; von Economo, 1926; Allman et al., 2010; Seeley et al., 2012; Kim et al., 2012). The progressive degeneration of the VENs and closely related fork cells in FI is related to the loss of empathy in frontotemporal dementia (Pasquini et al., 2020). In macaque monkeys, a smaller area within ventral agranular insula is also distinguished by the VENs and has been termed Iai (Evrard et al., 2012; Evrard, 2019). In this study we have found that this smaller VEN area is similarly located in part of ventral agranular insula in a bonobo (Pan paniscus), a Sumatran orangutan (Pongo abelii) and a Western lowland gorilla (Gorilla gorilla) (Figure 1) that we analyzed. The insular VEN area was more comparable in location and extent to the area in humans in a second gorilla from our collection (gorilla 2; Allman et al., 2010). The purpose of this study is to analyze the connections of the insular VEN areas in these four great apes based on ex vivo high angular resolution diffusion imaging (HARDI) of their brains. The connections of the VEN area in gorilla 2 were reported in an earlier publication (Allman et al., 2010). In this paper we report from all specimens using newer and more sensitive analytical methods.
Figure 1 -.
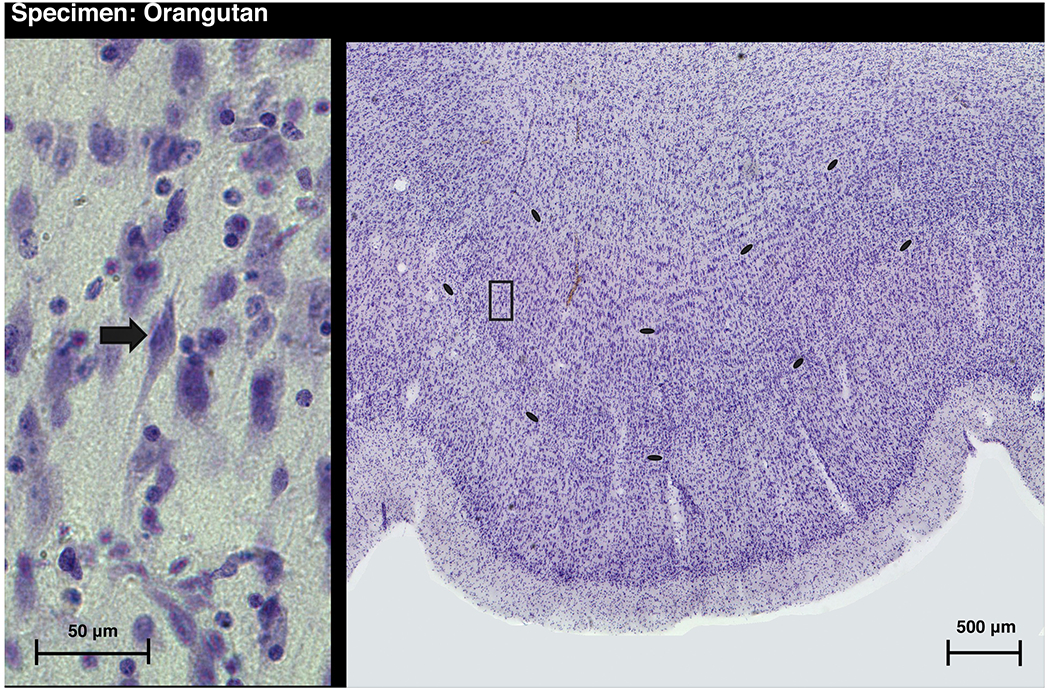
A cresyl violet stained section through the insular VEN area in a Sumatran orangutan (Pongo abelii, 25 year old female). The insular VEN area in this individual is located similarly to area Iai, the insular VEN area in macaques (Evrard et al., 2012). The insular VEN area forms a small gyrus and is similarly located in the bonobo and in gorilla 1. The histological section in Figure 1 corresponds approximately to the area enclosed by the pink outline delineating FI on the left side of the brain in the MR image in Figure 3D. In all 3 apes the VEN area forms a cortical bulge that may reflect differential developmental expansion compared with surrounding cortex. The insular VEN area in the elephant is also located in a series of small gyri (Hakeem et al., 2009). Layer 5 is delineated by the black ellipses. The higher magnification photomicrograph on the left depicts an example of a VEN and corresponds to the area enclosed by the box in the low magnification photomicrograph on the right. In a previous publication, the left insular VEN population in this individual was estimated by stereology to be about 2500 cells, which is 75% greater than the stereological estimate for the average for the insular VEN areas on the left side in 2 macaques (Allman et al., 2010; Evrard et al., 2012).
Methods
We acquired structural and diffusion magnetic resonance imaging data (MRI) and performed tractography-based analysis in conjunction with histological processing to investigate structural connectivity to the VEN area. The general design included using stained histological sectioning for identification of the VEN area, and image analysis with steps for artifact correction, multimodal image registration, manual segmentation of the VEN area, diffusion modeling, and seed-based tractography. Our analysis was implemented using FSL (Jenkinson et al., 2012), Advanced Normalization Tools (ANTs; Avants et al., 2009), and the Quantitative Imaging Toolkit (QIT; Cabeen et al., 2018), and the detailed steps taken are described as follows.
Data acquisition
Ex vivo MRI and histological sectioning and staining were performed at the California Institute of Technology as described by Allman et al. (2010). Four brains (bonobo, orangutan, gorilla 1, and gorilla 2) were obtained from apes in zoos, and all had died of natural causes without neurological disorders. The specimens were fixed in formalin directly after death. To acquire MRI data, the brains were placed in an acrylic canister filled with perfluoropolyether and imaged inside the 180 mm birdcage coil of a 9.4 T or 7 T Bruker magnet (Bruker BioSpin, Rheinstetten, Germany) at the Caltech Brain Imaging Center. Each session included a high-resolution 3D FLASH structural scan lasting approximately 16 hours and a pulsed-gradient spin-echo diffusion-weighted image (DWI) scan that lasted approximately 20 hours, including 6 repeats that were averaged together to improve the signal to noise ratio. The sequence parameters specific to each specimen are listed in Table 1. After being imaged, the brains were cryoprotected with sucrose, frozen on a specially designed microtome stage, and cut into serial 100 μm-thick frontal sections, which were mounted on gelatinized slides. The cut face of the tissue block was photographed with each new section and used to assist in the accurate mounting of the sections. Every fifth section was stained with a cresyl violet Nissl stain and adjacent sections were stained with the Gallyas technique for fibers. All ape brains were sectioned in their entirety, except for the bonobo where only the right hemisphere was available for histological processing. In gorilla 2, the insular VEN area in the right hemisphere was damaged so that only the insular VEN area in the left hemisphere was mapped. Photomicrographs of the histological sections were acquired at 40x and 400x magnification and imaged with a CCD camera to create a seamless photomontage from an array of individual images.
Table 1:
Magnetic Resonance Imaging sequence parameters, listing the spatial resolution, image dimensions, echo time (TE), repetition time (TR). For diffusion data, the number of baselines (NB), the number of diffusion-weighted (DW), and the b-value.
| Structural MRI | ||||
|---|---|---|---|---|
| case | Resolution | Dimensions | TE | TR |
| Bonobo | 190x215x293 μm3 | 512x512x256 | 4 ms | 50 ms |
| Gorilla #1 | 193x220x330 μm3 | 512x512x256 | 4 ms | 50 ms |
| Gorilla #2 | 250 μm3 | 407x477x334 | 4 ms | 50 ms |
| Diffusion MRI | |||||||
|---|---|---|---|---|---|---|---|
| Case | Resolution | Dimensions | TE | TR | NB | NW | B-value |
| Orangutan | 0.85 mm3 | 128x128x112 | 30 ms | 150 ms | 6 | 30 | 850 s/mm2 |
| Bonobo | 1.0 mm3 | 90x98x115 | 35 ms | 150 ms | 6 | 40 | 1450 s/mm2 |
| Gorilla #1 | 1.0 mm3 | 128x112x96 | 35 ms | 150 ms | 6 | 40 | 1450 s/mm2 |
| Gorilla #2 | 1.0 mm3 | 128x112x96 | 35 ms | 150 ms | 7 | 72 | 1040 s/mm2 |
Preprocessing
We first corrected for image intensity inhomogeneities in the structural and diffusion datasets using the N4 bias field correction algorithm (Tustison et al,. 2010). We corrected for motion and eddy current artifact in the diffusion MRI data using FSL to perform affine registration of each DWI to the first baseline scan and to rotate the associated b-vectors accordingly (Leemans et al., 2009). We also corrected for signal drift using QIT (Vos et al., 2017), where a quadratic drift effect across the duration of the scanning session was estimated and used for signal normalization. We performed deformable image registration using the Advanced Normalization Tools (ANTs; Avants et al., 2011) to spatially normalize the structural and diffusion. We used the diffusion baseline scan as the fixed image with the SyN metric. Ball-and-sticks multi-compartment models were obtained from the corrected DWI data using the Bayesian MCMC fitting procedure in FSL XFIBRES (Behrens et al., 2007).
VEN area segmentation
We manually demarcated the anterior commissure (AC), posterior commissure (PC), and midline reference point in each case. We used QIT to re-slice the image volumes in standard Talairaich space, that is, with the AC-PC axis parallel with the image y-axis and the midsagittal plane perpendicular to the image x-axis. Following multimodal spatial normalization, we resampled the imaging data in standardized coordinates for further analysis and visualization. The standardized imaging data was then compared to the histological sections to establish their correspondence with the insular VEN area. After identifying VEN areas from visual inspection of the histological sections with light microscopy, we manually delineated regions of interest (ROIs) in MRI frontal planes using QIT, outlining gray matter in accordance with the VEN. We subsequently inspected and manually corrected any defects in the ROIs, reviewing the data in sagittal and horizontal planes.
Tractography analysis
We performed seed-based multi-fiber streamline tractography to characterize the structural connectivity of the VEN areas. We used the manually-drawn VEN ROI as a seed region, and we also included a manually-drawn termination mask for each specimen, which was drawn to prevent anatomically implausible tracks that may occur due to imaging artifact, e.g. crossing sulci, partial volume effects at ventricles, or susceptibility-induced distortion. We performed tractography with the VolumeModelTrackStreamline module in QIT with an angle threshold of 65 degrees, a minimum volume fraction of 0.025, and 250,000 seeds per ROI. We then separated the resulting tracks into subgroups for frontal, temporal and insular connections. We computed the total brain volume from the total space occupied by specimen tissue, as well as the total and fraction volume of each tractography subgroup. We created visualizations of the resulting connections using QIT, where slices of standardized high-resolution structural data were rendered with a thin cross section of the tractography data shown around each slice, using coloring to indicate connection subgroup. We created still images and videos showing section of the tracks across the brain. Connected brain structures were identified using both the Paxinos et al. (2000) atlas and the study of insular cortex in macaques by Evrard et al. (2014) as guides. We summarized the connections and their 3D volumes; the results are shown in Tables 2 and 3, respectively.
Table 2:
Results from the tractography analysis of insular VEN area connectivity
| Regional Connectivity to the Insular VEN Area | ||||
|---|---|---|---|---|
| Case | Frontal | Temporal | Insular | Subcortical |
| Orangutan Left | Areas 10, 11, 14, 24†, 25*, GU, FP | TE, TP, STSau | Ial | CAH*, CL, DB*, HYL, LA, NA*, S |
| Orangutan Right | Areas 10, 11, 14, 24*†, 25*,46 | ER, PO, TP | CL, LA, NA, S | |
| Bonobo Right | Areas 10*, 14*, 25 | PO, STSau, TP | Ial | CAH*, CL, NA |
| Gorilla #1 Left | Areas 10, 14, 25, 46, GU | PO, STSau, TP | Idm, Ivfp | CAH*, CL, DB*, HYL, NA, PU, S |
| Gorilla #1 Right | Areas 10, 14, 25, GU | TP | Idm, Ivfp | CAH*, CL, DB, HYL, NA, PU, S, |
| Gorilla #2 Left | Areas 8, 9*, 10*, 14*, 24†, 25, 32*, 46*, GU | STSau, TE | Idm, Ivfp | CAH*, CL, NA*, PU, S |
| Region Lookup Table | |
|---|---|
| Region ID | Region Name |
| ACC | anterior cingulate cortex |
| CAH | head of caudate nucleus |
| CC | corpus callosum |
| CL | claustrum |
| DB | diagonal band of Broca |
| ER | entorhinal cortex |
| GU | gustatory cortex |
| HYL | lateral hypothalamus |
| Ial | insular agranular lateral |
| Idm | insular dysgranular mound |
| IVA | insular VEN area |
| Ivfp | ventral mid-insula |
| LA | lateral amygdala |
| LS | lateral septum |
| NA | nucleus accumbens |
| PGM | parietal area medial |
| PO | primary olfactory |
| PT | putamen |
| s | septum |
| STSau | STS anterior upper bank |
| TE | inferotemporal cortex |
| TP | temporal pole |
| Region Statistics | |
|---|---|
| Region | Occurance count |
| Area 10 | 6 |
| Area 14 | 6 |
| Area 25 | 6 |
| CL | 6 |
| NA | 6 |
| TP | 5 |
| S | 5 |
| CAH | 5 |
| STSau | 4 |
| GU | 4 |
| DB | 3 |
| Area 24 | 3† |
| Area 46 | 3* |
| Idm | 3* |
| Ivfp | 3* |
| PO | 3* |
| HYL | 3 |
| Ial | 2** |
| LA | 2 |
| PT | 2 |
| TE | 2 |
| Area 11 | 2 |
| ER | 1 |
| Area 8 | 1 |
| Area 9 | 1 |
| Area 32 | 1 |
| Area 23 | 1 |
| PGM | 1 |
Annotations:
includes contralateral connection:
VEN-containing ACC
Annotations:
gorillas only
non-gorillas only
VEN-containing ACC
Table 3:
Bundle Volumes. The first data column lists the total brain volume in cubic mm. The next six columns list the total volumes of frontal, temporal, and insular connections. The second table lists the normalized volume, that is, the percentage of the total brain volume
| Total Volume (in cubic mm) | |||||||
|---|---|---|---|---|---|---|---|
| Case | Left Frontal | Right Frontal | Left Temporal | Right Temporal | Left Insular | Right Insular | Total Brain Volume |
| Orangutan | 5927 | 4992 | 1160 | 1352 | 0 | 0 | 344865.75 |
| Bonobo | N/A | 4177 | N/A | 2574 | N/A | 655 | 344536.81 |
| Gorilla #1 | 7996 | 6076 | 1121 | 94 | 233 | 851 | 355631.35 |
| Gorilla #2 | 23033 | N/A | 2800 | N/A | 488 | N/A | 409868.34 |
| Normalized Volume (percentage of total brain) | ||||||
|---|---|---|---|---|---|---|
| Case | Left Frontal | Right Frontal | Left Temporal | Right Temporal | Left Insular | Right Insular |
| Orangutan | 1.72 % | 1.45 % | 0.336 % | 0.392 % | 0 % | 0 % |
| Bonobo | N/A | 1.21 % | N/A | 0.747 % | N/A | N/A |
| Gorilla #1 | 2.25 % | 1.71 % | 0.315 % | 0.0264 % | 0.0655 % | 0.239 % |
| Gorilla #2 | 5.62 % | N/A | 0.683 % | N/A | 0.119 % | N/A |
Results and Discussion
Figures 2 through 4 illustrate the main tractography connections we found in this study. We also summarize these connections and their 3D volumes in Tables 2 and 3, respectively. While we also provide figures depicting many of these connections, the reader is invited to examine them in more detail in our supplementary videos illustrating the complete set of connection in the frontal, parasagittal and horizontal planes for all 4 apes (Supplementary Material, in the following order: Bonobo, Gorilla 1, Gorilla 2, Orangutan). It is worth noting that tractography based on diffusion imaging reveals tracts but not the direction of connections within them.
Figure 2 -.
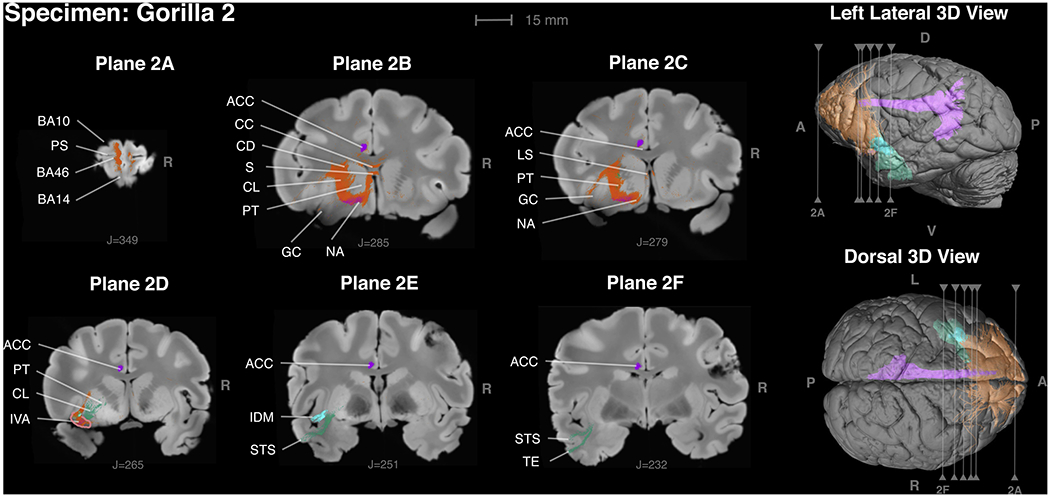
Insular VEN area connections in gorilla 2 in frontal planes proceeding from anterior to posterior. Orange fibers connect with the frontal lobe; green fibers connection with the temporal lobe; purple fibers connect with the cingulum bundle. Only the left VEN area was available for histology, and thus the insular VEN area could be identified only in the right hemisphere. Plane 2A: Connections with areas 10, 14 and 46. PS = principal sulcus. Plane 2B: Insular VEN area outlined in pink. Purple fibers connect with area 24, the VEN area in the anterior cingulate cortex. Green fibers are connecting with the temporal lobe areas in 2A and 2 F. Plane 2C: Orange fibers connect with the gustatory cortex (GC) and nucleus accumbens (NA) and the lateral septum (LS). Purple fibers connect with area 24, the VEN area of anterior cingulate cortex. Plane 2D: Orange fibers connect with the putamen (PT), septum, area 25 and pass through the corpus callosum. Purple fibers connect with area 24. Plane 2E: Turquoise fibers connect with Idm, the insular dysgranular mound area (Evrard et al., 2014). The deeper layers of Idm are densely myelinated in macaques (Evrard et al., 2014) and also in Gorilla 2 as depicted in Fig. 4. Green fibers connected with the anterior upper bank of the superior temporal sulcus (STS). Purple fibers connect with area 24. Plane 2F: Green fibers connect with the anterior upper bank of the superior temporal sulcus (STS) and inferotemporal cortex (TE). Purple fibers connect with area 24.
Figure 4 -.
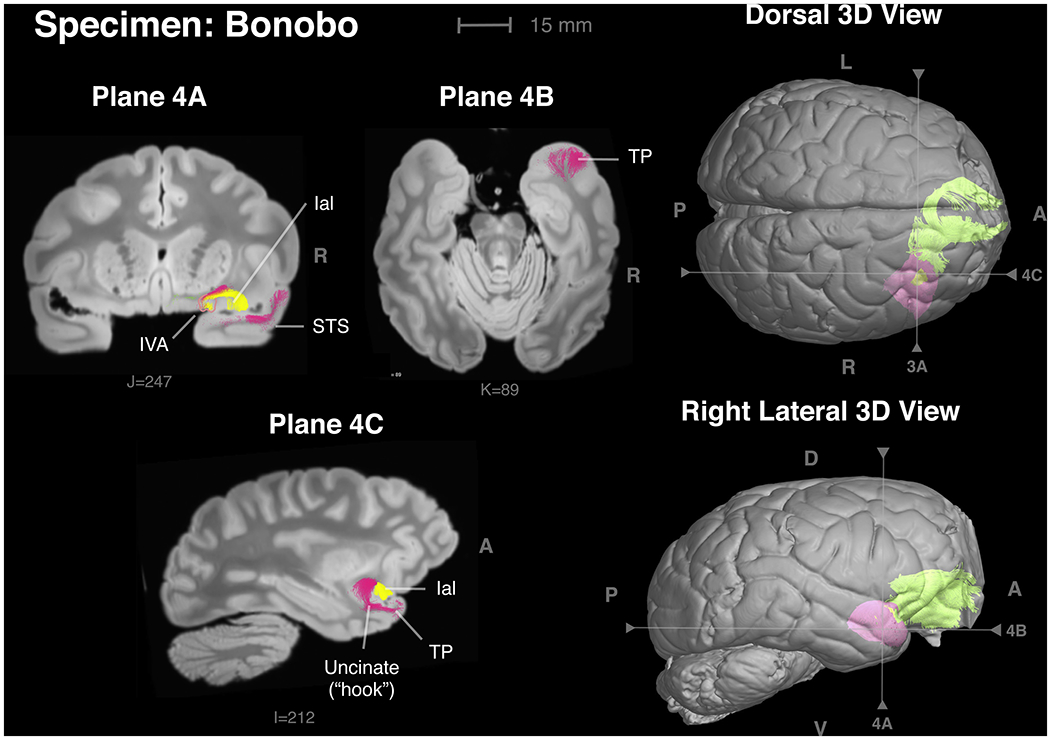
Some of the connections of the insular VEN area in a bonobo. Only the right hemisphere was available for histology and thus the insular VEN area could be identified only in the right hemisphere. Plane 4A: Frontal section through the insular VEN area outlined in pink. Yellow: connection between the insular VEN area and Ial (insula agranular lateral). Magenta: connection with the anterior upper bank of the superior temporal sulcus (STS). Plane 4B: Horizontal section illustrating a strong connection with the temporal pole (TP) in magenta. Plane 4C: Parasagittal section illustrating the “hook” of the uncinate fasciculus connecting the insular VEN area with the temporal pole.
Frontal pole connections
One of our strongest findings is that the insular VEN area in all cases is connected to areas 10 and 14 in the frontopolar cortex (Figures 2 and 3). The insular VEN area is also connected to area 11 in two cases. There is direct experimental evidence in macaque monkeys demonstrating connection to area 10 from the insular VEN area (Markov et al., 2014; Saleem et al., 2014). Area 10 is of evolutionary interest because it undergoes considerable expansion over time in great apes and humans compared to monkeys (Semendeferi et al., 2001; Allman et al., 2002). Functional imaging studies in humans reveal that frontopolar cortex is involved in exploratory decisions and voluntary decisions to switch to alternative strategies (Daw et al., 2006; Boorman al, 2009). In humans, frontopolar lesions interfere with the capacity to update choices on the basis of recent reward history (Kovach et al., 2012). However, some of the basic functions of area 10 have been revealed by studies in macaque monkeys. For example, neurons in area 10 are active when monkeys make self-generated voluntary choices, as opposed to rule-based decisions (Tsujimoto et al., 2010). Boschin et al. (2015) found that area 10 in macaques facilitates exploration and rapid learning about the relative value of novel behavioral options. These finding in macaques and humans are consistent with the human activation in humans of area 10 in tasks involving monetary gain and loss (Knutson et al., 2003) or the determination of successful strategies in auction bidding when no specific rules were provided (Grether et al., 2007). The insular VEN area is also activated during monetary tasks (Knutson et al., 2003) and in particular by monetary loss in a gambling task (Preuschoff et al., 2007). Humans exploring for monetary rewards may be derived from the same brain circuitry as non-humans exploring for food resources. Thus one of the functions of the connections between the insular VEN area and the frontal pole may involve foraging and the rapid adaptation to variations in the availability of different resources, which would carry a large survival advantage in changing environments. Other functions of area 10 in humans that are also consistent with the idea that it evolved within the context of adaptive foraging include multitasking, prospective memory and the capacity to shift attention (Hoffman and Bar-On, 2012). Successful foraging for variable or diverse resources requires the capacity to access the values of multiple resources or to switch to alternative behavioral strategies for food acquisition when a primary resource is depleted. Survival in conditions of scarcity requires the capacity to redirect attention, to multitask, and to remember prospective resources that will become available in the future such as unripe fruit that is not yet ready to harvest. Area 10 is also involved in the assessment of internal states, introspection, and theory of mind (Gilbert et al., 2006; Hoffman and Bar-On, 2012), which may be linked the role of the insular VEN area in interoceptive awareness (Allman et al., 2010; Evrard, 2019). The adjacent area 11 in ventral frontopolar cortex is activated when subjects choose between small likely rewards and large unlikely rewards, which is a key decision to be made in foraging (Rogers et al., 1999). In humans, lesions involving areas 10 and 11 interfere with cognitive empathy (Shamay-Tsoory, 2009). Overall, the circuitry of the insular VEN area with frontopolar areas may influence the motivation to explore and make choices related to foraging and social interactions, in conjunction with introspective states and the strategies and insights that arise from them.
Figure 3 -.
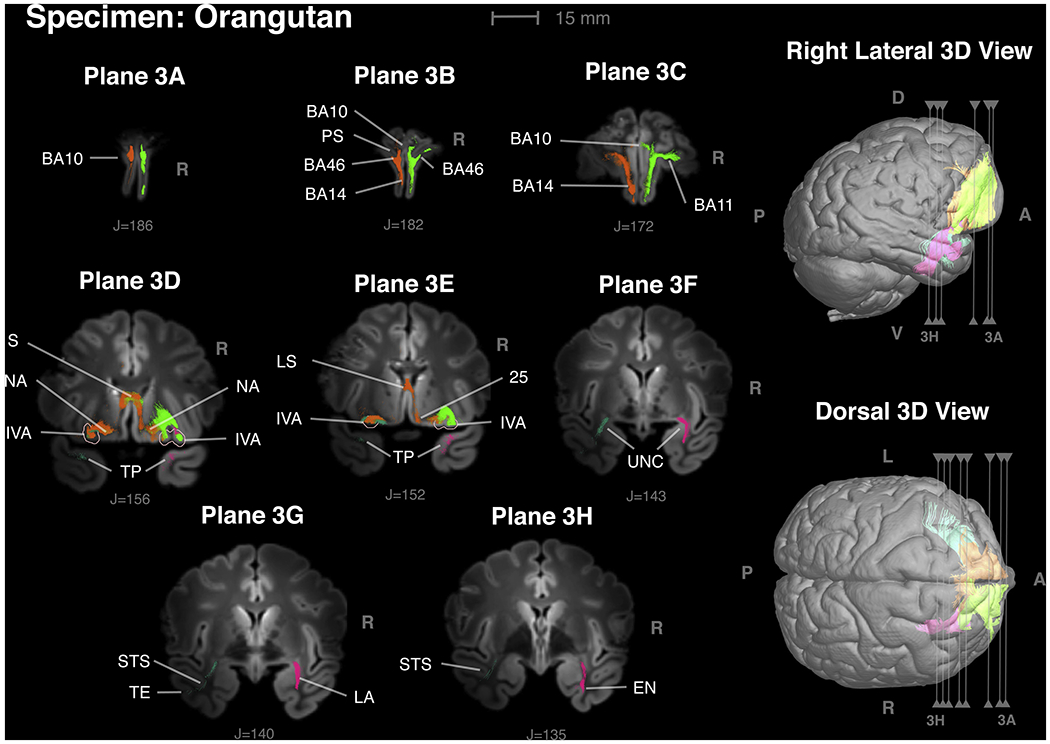
Insular VEN area connections in an orangutan in frontal planes proceeding from anterior to posterior. Orange fibers arise from the VEN area in the left hemisphere; green from the VEN area on the right. The frontal lobe in orangutans is distinctive from other apes in being exceptional high and having a prominent ventral keel (Connolly, 1950). The ventral keel is visible in cross-sections in 3A, 3B and 3C. Plane 3A: Connections with area 10. Plane 3B: Orange fibers show connections with areas 10, 14 and 46 in the fundus of the principal sulcus (PS). Plane 3C: Connections with areas 11 and 14 with a small connection with area 10. Plane 3D: Insular VEN areas outlined in pink. Frontal lobe connections associated with the left VEN area are orange. Frontal lobe connections associated with the right VEN area are green. There are also connections with nucleus accumbens (NA) and septum (S). Temporal lobe connections associated with the left VEN area are blue. Temporal lobe connections associated with the right VEN area are magenta. Temporal polar cortex (TP). Note that the histological section in Fig. 1 corresponds approximately to FI on the left side in this figure. Plane 3E: - Connections with the septum and area 25. Plane 3F: Fibers passing through the uncinate fasciculus. Plane 3G: On the left, blue fibers pass the fundus of the superior temporal sulcus (STS) and reach inferotemporal cortex (TE). On the right, magenta fibers pass through the lateral amygdala (LA). Plane 3H: On the right, magenta fibers in the deep layers of entorhinal cortex (EN) with a distribution similar to projection of Iai to entorhinal cortex mapped by Carmichael and Price (1995) in a macaque (case OM19).
Claustrum
Fibers from the insular VEN area pass through and possibly connect with the claustrum in all 6 hemispheres. The claustrum appears to be connected to virtually the entire cerebral cortex and may have an integrative role related to consciousness as proposed by Crick and Koch (2005). A 2014 study showed that electrical stimulation of the claustrum in an epilepsy patient resulted in a temporary loss of consciousness during stimulation (Koubeissi et al., 2014). Later, Chau et al. (2015) studied the effects of claustrum lesions in a large series of epilepsy patients and, similarly, found that the presence of these lesions was correlated with an increased likelihood of a patient experiencing loss of consciousness during electrical stimulation, but 27% of patients with claustrum lesions did not experience loss of consciousness and more than half of patients without claustrum lesions also experienced loss of consciousness. However, the many fiber pathways passing through this region pose a challenge to making definitive functional interpretations of claustral lesions. Based on numerous lines of evidence, an alternative hypothesis has been advanced that the claustrum is involved in the regulation of the mechanisms of attention throughout the cortex (Goll et al., 2015).
Temporal cortex areas
The insular VEN area is connected with the temporal pole in 5 cases. The temporal pole connections are illustrated in Figures 2, 3 and 4 from gorilla 2, the orangutan and the bonobo respectively. The temporal pole connections are especially well developed in the bonobo (Figure 4 and Table 3). In macaques, neurons in the temporal pole project directly to the insular VEN area (Kondo et al., 2003). The temporal pole receives its main input from inferotemporal cortex (area TE) in macaques and is involved in visual object, facial recognition, and memory (Nakamura et al., 1996; Olson et al., 2007). The insular VEN area is also directly connected to TE (inferotemporal cortex) in 2 specimens (Figure 2 and 3). Nakamura et al. (1996) temporal pole findings were built directly on Gross’s classic studies of inferotemporal cortex (Gross et al., 1972), and the upper bank of the superior temporal sulcus (STS), where face-specific responses were recorded (Bruce et al., 1981). Although visual input predominates in the upper bank of the superior temporal sulcus, there is also activation in many neurons by auditory and somatic inputs as well (Bruce et al., 1981). The insular VEN area is connected to the anterior part of the upper bank of the STS in all 4 apes. In macaques, the insular VEN area projects to the anterior upper bank of the STS (Saleem et al., 2008; Markov et al., 2014). Thus, the insular VEN area is connected to highest levels of visual and polysensory processing in the temporal lobe, a finding which relates to several past imaging studies. Functional imaging studies in humans have frequently shown temporal pole activity related to tasks involving theory of mind (Olson et al., 2007). The insular VENs and closely related fork cells are substantially reduced in number in patients suffering from behavioral variant of frontotemporal dementia (bvFTD) in which social functioning and the appetite regulation are severely compromised (Kim et al., 2012). Pathological changes in the VENs and Fork cells occurs in the early stages of bvFTD before other cell populations show evidence of abnormalities (Nana et al., 2018). Further, a restricted stroke-induced lesion involving the insular VEN area also caused disrupted social functioning and appetite regulation (Cho et al., 2012). However, there is no evidence of direct projections in macaques from the insular VEN area to the “face patches”, which are temporal lobe areas that are specifically and selectively activated by faces (Grimaldi et al., 2016).
Olfactory and gustatory cortices and nucleus accumbens
The insular VEN area lies between the primary gustatory cortex (Benjamin and Burton, 1968; Rolls, 1989) and primary olfactory cortex and is connected with these structures in 4 and 3 cases respectively. The insular VEN area is also connected to insular dysgranular mound (Idm) and the secondary gustatory cortex in 3 cases, which will be discussed further when considering insular connections below. In macaques, neurons in primary olfactory cortex project directly to the insular VEN area (Carmichael et al., 1994). In functional imaging studies, the insular VEN area in humans was activated by both gustatory and olfactory stimuli, which together serve as the basis of flavor perception, in addition to the nucleus accumbens activation (Small, 2012). In all 6 hemispheres, the insular VEN area is connected to the nucleus accumbens (Figures 2 and 3), which is strongly related to natural rewards such as food and sex (Olsen, 2011). Ortigue et al. found that the activity of the insular VEN area is correlated with orgasm quality in women (Ortigue et al., 2007). In macaques, neurons in the insular VEN area project directly to the nucleus accumbens (Chikama et al., 1997). Thus, the insular VEN area may represent a node in the circuitry for reward and appetite regulation. This set of functions is also reflected in the emotion of disgust, literally distaste, which elicits activity in the insular VEN area when mediated either by taste, by sight or by imagination (Jabbi et al., 2008). Although disgust has a gustatory and olfactory basis, it extends beyond appetite regulation to social relations, which can also elicit disgust. Reward and aversion influence motivation and choice among courses of action in both foraging and social domains.
Area 25, septum, diagonal band of Broca, and lateral hypothalamus
The insular VEN area is connected to area 25 in 5 cases (Figures 2 and 3). Area 25 is implicated in the regulation of negative emotions (Wallis et al., 2017). Our investigation into cortical microstructure characteristics in humans has also revealed an association of tetrahydrocannabinol (THC) and negative intrusive thinking with features of both frontoinsular and ventromedial frontal cortex (Cabeen et al., 2020). In macaques, area 25 is in turn connected with the lateral septum, nucleus accumbens, diagonal band of Broca and anterior hypothalamus (Freedman et al., 2000). The insular VEN area in our ape study is connected to septum in 5 cases, nucleus accumbens in 6 cases as previously mentioned, the diagonal band of Broca in 3 cases, and the lateral hypothalamus in 3 cases (Figures 2, 3, 6C, 6D, 6E, and 6F). In macaques, the insular VEN area (Iai) is reciprocally connected the lateral hypothalamus (Öngür et al., 1998). Furthermore, the septum, via its connections with the lateral hypothalamus, regulates food intake (Sweeney and Yang, 2016). More broadly considered, the lateral hypothalamus is involved with reward-seeking (Harris and Aston-Jones, 2006), which is consistent with the notion that the insular VEN network is heavily associated with exploration and foraging.
Figure 6 -.
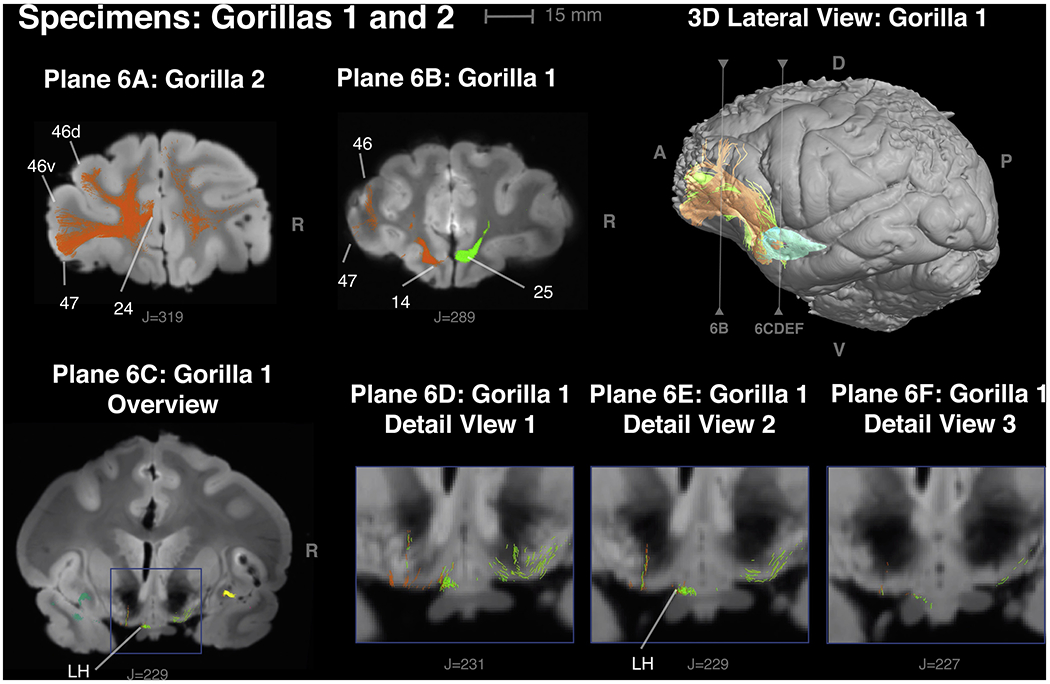
Comparison of connections of the insular VEN area with prefrontal cortex in gorilla 2 and gorilla 1 in panels 6A and 6B. Panel 6C, 6D, 6E and 6F illustrate insular VEN area connections with the lateral hypothalamus.
6A - Gorilla 2 – Orange, connections of the left VEN area with areas 25, 46 and 47. Green, connections of the right VEN area with Area 25.
6B - Gorilla 1 - Orange connections of the left VEN area with areas 24, 25, 46 and 47. Area 24 is the anterior extension of the VEN area in anterior cingulate cortex (ACC).
6C - Gorilla 1 - connections from the contralateral insular VEN area (green) and ipsilateral VEN area (orange) with the lateral hypothalamus. LH = lateral hypothalamus.
6D, 6E, 6F Gorilla 1 - details of hypothalamic connections from adjacent planes.
Area 24, the VEN area of anterior cingulate cortex
The insular VEN area is connected in 3 cases to area 24 of anterior cingulate cortex (Figures 2 and 3), which is the other major VEN area in the cerebral cortex (Allman et al., 2010; Nimchinsky et al., 1995; Nimchinsky et al., 1999). These connections are also present in macaques (Saleem et al., 2008; Evrard, 2019) and were reported earlier in gorilla 2 (Allman et al., 2010).
Connections within the insula
The insular VEN area is connected with the dysgranular insula mound (Idm) area in 3 cases (Figure 2E). Idm in macaques is thicker than adjacent cortex, and its deeper layers are richly myelinated in Gallyas stained sections (Evrard et al., 2014); this is also true in the comparable area in the ape brains in our study (Figure 5). Idm is involved with visceral and oral sensations and taste (Evrard, 2019). It is secondary taste cortex in macaques (Rolls, 1989). Idm appears to overlap with the insular “affiliative field” which, when electrically stimulated, elicits positive facial expressions such as lipsmacking in macaques (Jezzini et al., 2015). The insular VEN area is also connected with another dysgranular insular area, the posterior area of the ventral fundus (Ivfp) in 3 hemispheres. Evrard (2019) suggested that both Idm and Ivfp are involved in social functioning. We also found the insular VEN area connects with insula to the lateral agranular cortex (Ial), in 3 cases (Figure 4).
Figure 5 -.
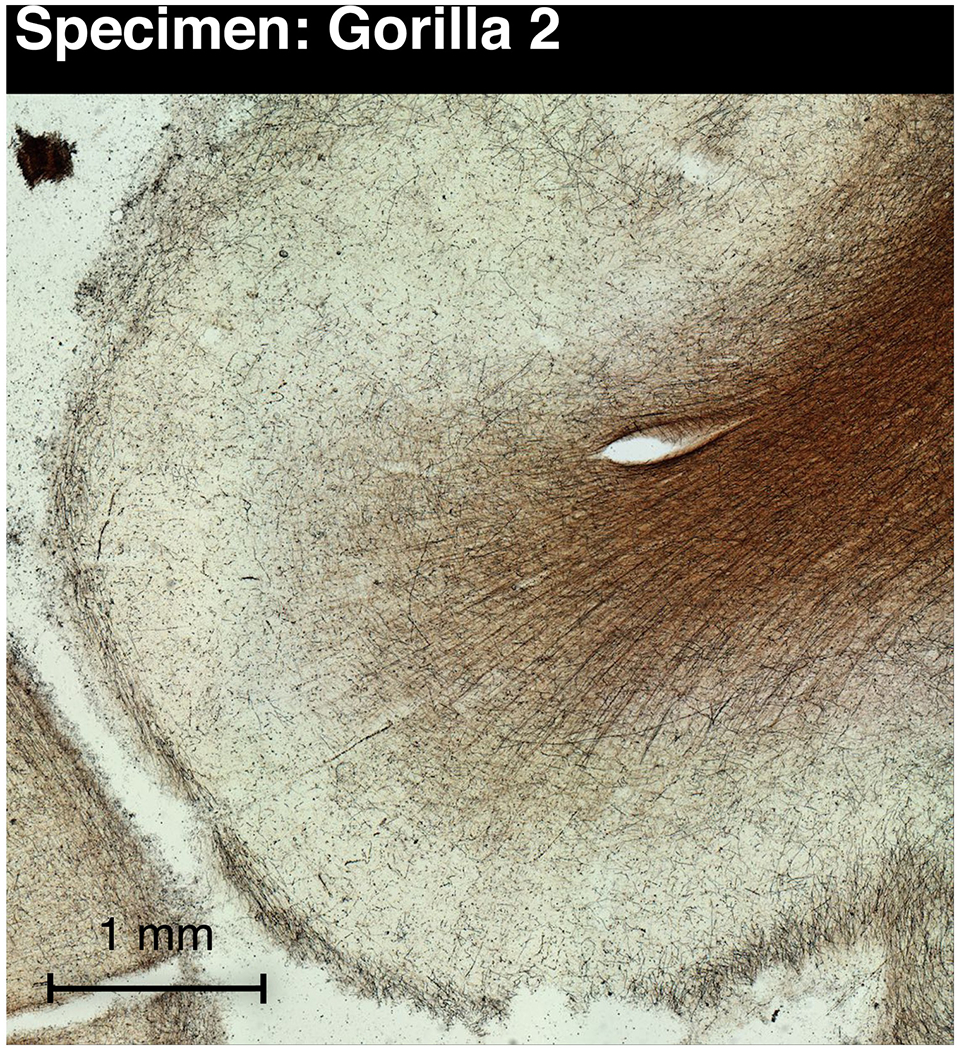
Gallyas-stained section through the insular mound (Idm) in gorilla 2 showing myelinated fibers in the deeper layers similar to Idm in macaques (Evrard et al., 2014). The section is from the same plane as Figure 2E and corresponds to insular VEN connection with Idm labeled in turquoise in Figure 2E.
Area 46
The insular VEN area is connected with Area 46 in lateral prefrontal cortex in the left hemispheres of 3 cases. In macaques, the insular VEN area projected to area 46 in 1 out of 7 cases in one study (Saleem et al., 2014); in a second study the VEN area strongly projected to area 46 in one case; and had very light connections in one and no connections in a third (Markov et al., 2014). Thus the connectional variability in apes may reflect inherent variability observed in the macaque tracer studies. In behavioral studies in both macaques and humans area 46 is involved in working memory and the capacity to learn abstract rules (Boschin et al., 2017).
Lateral amygdala
Insular VEN area connections with the lateral part of the amygdala were present in both hemispheres in the orangutan, but were not seen in the other apes (Figure 3). Injections of retrograde tracers in lateral amygdala revealed light connectivity with the region corresponding to the insular VEN area (Iai) in 1 of 3 macaques observed (Stephanacci and Amaral, 2000). Projections from the amygdala to Iai were reported in 1 macaque (Carmichael and Price, 1995).
Gorilla 2 has larger and more extensive connections
Gorilla 2 has more extensive connections with frontal cortical areas, including area 9 in addition to previously noted connections to frontal areas 10, 11, 14, 24, 25 and 46 and also via the cingulum bundle with posterior parietal cortex, areas 23 and the medial surface of the parietal lobe (PGM) (Figure 2). The connection with area 9 of dorsal prefrontal cortex has been described in a macaque (Markov et al., 2014). The volume of the frontal lobe connections of the insular VEN area in the left hemisphere in gorilla 2 is much larger than in any other ape in our study (Table 3). Figure 6 compares the extensive connections with prefrontal cortex in gorilla 2 with gorilla 1. We considered the possibility that this more extensive connectivity was due to the larger insular VEN area in gorilla 2 and so mapped connectivity from a smaller and more medial part of this area that matched the insular VEN area in the other specimens. The connections from this reduced region are similar to those found with the complete insular VEN area in gorilla 2, and we conclude that the extensive connectivity is a feature of this individual. Gorilla 2 had considerably more insular VENs than other apes with numbers overlapping the lower end of the human distribution (Allman et al., 2010). Gorilla 2 had an exceptionally enriched environment (Patterson and Gordon 2002). Although we can conclude nothing definitive from this isolated observation, it does raise the possibility that VEN abundance and the extensive connectivity of the insular VEN area may be related to environmental influences in gorilla 2.
Expected connections not found
We did not find insular VEN area connections with either the periaqueductal gray or the parabrachial nuclei although there is evidence for their existence. In macaques there are reciprocal connections between the insular VEN area and the lateral and ventrolateral columns of the periaqueductal gray (An et al., 1998). The lateral columns mediate reward-seeking behavior (Tyron and Mizumori, 2018) and the ventrolateral are related to the homeostatic regulation of pain (Lane et al., 2005). There is also evidence that the insular VEN area is connected with the parabrachial nuclei in humans, though they may not be direct (Fischer et al., 2016). The evidence in humans comes from a remarkable study in which the lesions that caused coma in 12 patients were compared with 24 patients with brain stem lesions that did not cause coma; the net coma-causing area largely overlapped with the parabrachial nuclei (Fischer et al., 2016). Then, in normal subjects, the authors mapped functional connectivity between the pontine coma area and the forebrain and found that the connected areas closely corresponded to the VEN areas in the anterior insula and anterior cingulate cortex suggesting that the VEN areas may be related to consciousness (Fischer et al., 2016). In our earlier analysis of magnetic resonance diffusion data from gorilla 2 we reported connections with the thalamus, amygdala and hippocampus (Allman et al., 2010), but the methods employed in the current analysis provide overall more finely differentiated pathways that more clearly match the experimental findings in macaque monkeys for most brain structures. To contrast with our previous work, we have used a newly developed method for detection and correction of signal drift, which was necessary given the long scan time; furthermore, we employed deterministic streamline tractography which is a conservative approach with a lower false positive rate than probabilistic methods (Sarwar et al., 2019). Anterior insular connections with thalamic structures have been frequently reported (Mufson and Mesulam, 1984; Giguere and Goldman-Rakic, 1988; Yeterian and Pandya, 1988; Ray and Price, 1993; Erickson and Lewis, 2004; Jezzini et al., 2015), yet we did not find connections between the thalamus and FI in any of the ape brains investigated with the improved methods of diffusion tractography. Similarly we found no connections between the FI and the amygdala in the gorillas and bonobo, although we did find them in the oranguatan in comparable locations to those previously shown in macaques (see section on lateral amygdala above). We think the failure to find connections may be due to technical issues. As an inverse modeling problem, tractography-based reconstruction is not without limitations (Schilling et al., 2019); furthermore, the mapping of connectivity depends on axon caliber and coherence, as well as the extent of intervening crossing fibers, so it is possible that these features of pathways may differ between the connections of FI with the thalamus compared to the many other connections revealed by tractography in this study. Looking forward, these features could be examined more exhaustively using emerging MRI acquisition and modeling techniques for microstructure imaging, which can potentially differentiate features such as axon caliber and diffusion and relaxation properties of sub-populations of crossing fibers (Alexander et al., 2017; Westin et al., 2019), features that are beyond what can be quantified with the data acquired in the present study.
Conclusions
The insular VEN area in great apes is most strongly connected with the frontopolar cortex, which supports their capacity to choose voluntarily among alternative courses of action particularly in exploring alternatives while foraging. The frontopolar cortex may also support their ability to take note of potential resources for harvesting in the future (prospective memory). The insular VEN area is also connected with olfactory, gustatory, visual and other sensory systems, as well as systems for the mediation of appetite, reward, aversion and motivation. The VEN area’s connections within the insula appear to support self-awareness and introspection. In humans, both the frontopolar and the temporopolar cortices are activated when subjects think about the mental states of others (theory of mind), and this capacity is likely to the present in apes as well (Kano et al., 2019). All of these faculties may support insight and volitional choice when contemplating courses of action as opposed to rule-based decision-making (Tsujimoti et al., 2010; Boschin et al., 2015; 2017). These faculties thus enhance the capacity to find the resources necessary to survive and thrive in constantly changing environments.
Supplementary Material
Highlights.
The connections of the VEN area in anterior insula were mapped with ex-vivo diffusion tractography in apes.
The insular VEN area is connected to highest levels of visual and polysensory processing in the temporal lobe.
The insular VEN area is connected with several sensory systems and also systems mediating appetite, reward, aversion and motivation.
Circuitry of the insular VEN area with frontopolar areas may influence the motivation to explore and make choices.
These choices may relate to foraging and socialization, and work in step with introspective states and their resulting strategies and insights.
Acknowledgements
We thank Michael Tyszka and Jason Kaufman for their help in acquiring the structural and diffusion MRI data used in this study. We thank Virginie Goubert for the histological processing of the brain tissue. We thank Laura Korobkova for her skillful acquisition and assembly of the photomontage in Figures 1 and 5. Several of the ape brains involved in this study are on loan to the “Great Ape Aging Project” from zoological gardens that are accredited by the Association of Zoos and Aquariums (AZA) and that participate in the Ape Taxon Advisory Group (Ape-TAG). We especially appreciate the contribution of zoo veterinarians and staff in collecting and providing specimens. Some comparative specimens were collected under the “Comparative Neurobiology of Aging Resource,” NIH/NIA grant AG014308, J. Erwin, PI. This research was supported by the James S. McDonnell Foundation, the Tianqiao and Chrissy Chen Foundation and National Institutes of Health grant number P41 EB015922.
Footnotes
Publisher's Disclaimer: This is a PDF file of an unedited manuscript that has been accepted for publication. As a service to our customers we are providing this early version of the manuscript. The manuscript will undergo copyediting, typesetting, and review of the resulting proof before it is published in its final form. Please note that during the production process errors may be discovered which could affect the content, and all legal disclaimers that apply to the journal pertain.
References
- Alexander DC, Dyrby TB, Nilsson M and Zhang H, 2017. Imaging brain microstructure with diffusion MRI: practicality and applications. NMR in Biomedicine, 32(4), p.e3841. [DOI] [PubMed] [Google Scholar]
- Allman J, Hakeem A, Watson K 2002. Two phylogenetic specializations in the human brain. Neuroscientist 8:335–46 [DOI] [PubMed] [Google Scholar]
- Allman JM, Tetreault NA, Hakeem AY, Manaye K, Semendeferi K, Erwin JM, Park S, Goubert V, Hof PR, 2010. The von Economo neurons in frontoinsular and anterior cingulate cortex in great apes and humans. Brain Struct Funct 214:495–517 DOI 10.1007/s00429-010-0254-0 [DOI] [PubMed] [Google Scholar]
- An X, Bandler R, Ongiir D, Price JL 1998. Prefrontal cortical projections to longitudinal columns in the midbrain periaqueductal gray in macaque monkeys. J Comp Neurol.401:455–79. [PubMed] [Google Scholar]
- Avants BB, Tustison N and Song G, 2009. Advanced normalization tools (ANTS). Insight journal, 2, pp.1–35. [Google Scholar]
- Avants BB, Tustison NJ, Song G, Cook PA, Klein A and Gee JC, 2011. A reproducible evaluation of ANTs similarity metric performance in brain image registration. Neuroimage, 54(3), pp.2033–2044. [DOI] [PMC free article] [PubMed] [Google Scholar]
- Behrens TE, Berg HJ, Jbabdi S, Rushworth MF and Woolrich MW, 2007. Probabilistic diffusion tractography with multiple fibre orientations: What can we gain?. Neuroimage, 34(1), pp. 144–155. [DOI] [PMC free article] [PubMed] [Google Scholar]
- Boorman E, Behrens T, Woolrich M, Rushworth M, 2009. How green is the grass on the other side? Frontopolar cortex and the evidence in favor of alternative curses of action. Neuron 62: 733–43 DOI 10.1016/j.neuron.2009.05.014 [DOI] [PubMed] [Google Scholar]
- Boschin EA, Brkic MM, Simons JS, Buckley MJ 2017. Distinct Roles for the Anterior Cingulate and Dorsolateral Prefrontal Cortices During Conflict Between Abstract Rules. Cereb Cortex 27:34–45. doi: 10.1093/cercor/bhw350. [DOI] [PMC free article] [PubMed] [Google Scholar]
- Boschin EA, Piekema C, Buckley MJ 2015. Essential functions of primate frontopolar cortex in cognition. ProcNatl Acad Sci. 112:E1020–7. doi: 10.1073/pnas.1419649112. [DOI] [PMC free article] [PubMed] [Google Scholar]
- Bruce C, Desimone R, Gross CG 1981. Visual properties of neurons in a polysensory area in superior temporal sulcus of the macaque. J Neurophysiol. 46:369–84. [DOI] [PubMed] [Google Scholar]
- Cabeen RP, Bastin ME and Laidlaw DH, 2016. Kernel regression estimation of fiber orientation mixtures in diffusion MRI. Neuroimage, 127, pp. 158–172. [DOI] [PMC free article] [PubMed] [Google Scholar]
- Cabeen RP, Laidlaw DH and Toga AW, 2018. Quantitative Imaging Toolkit: Software for interactive 3D visualization, data exploration, and computational analysis of neuroimaging datasets. In Proceedings of the International Society for Magnetic Resonance in Medicine (ISMRM) (Vol. 2854). [Google Scholar]
- Cabeen RP, Allman JM and Toga AW, 2020 THC exposure is reflected in the microstructure of the cerebral cortex and amygdala of young adults. Cerebral cortex. Volume 30, Issue 9, September 2020, Pages 4949–4963 [DOI] [PMC free article] [PubMed] [Google Scholar]
- Carmichael ST, Clugnet MC, Price JL 1994. Central olfactory connections in the macaque monkey. J Comp.Neurol. 346:403–34. [DOI] [PubMed] [Google Scholar]
- Carmichael ST, Price JL 1996. Connectional networks within the orbital and medial prefrontal cortex of macaque monkeys. J Comp Neurol. 371:179–207. [DOI] [PubMed] [Google Scholar]
- Chau A, Salazar A, Kreuger F, Christofori T, Grafman J 2015. The effect of claustrum lesions of human consciousness and recovery of function. Consciousness and Cognition 36:256–64. 10.1016/j.concog.2015.06.017 [DOI] [PubMed] [Google Scholar]
- Chikama M, McFarland N,R, Amaral DG, Haber SN. 1997. Insular cortical projections to functional regions of the striatum correlate with cortical cytoarchitectonic organization in the primate. J Neurosci. 17:9686–705. [DOI] [PMC free article] [PubMed] [Google Scholar]
- Cho HJ, Kim SJ, Hwang SJ, Jo MK, Kim HJ, Seeley WW, Kim EJ 2012. Social-emotional dysfunction after isolated right anterior insular infarction. J Neurol. 259:764–7. doi: 10.1007/s00415-011-6246-z. [DOI] [PubMed] [Google Scholar]
- Connolly C 1950. External Morphology of the Primate Brain. Charles Thomas, Springfield, Illinois. [Google Scholar]
- Crick FC, Koch C 2005. What is the function of the claustrum? Philos Trans R Soc Lond B Biol Sci. 360:1271–9. [DOI] [PMC free article] [PubMed] [Google Scholar]
- Daw N, O’Doherty J, Dayan P, Seymour B, Dolan R 2006. Cortical substrates for exploratory decisions in humans. Nature 441:876–79. doi: 10.1038/nature04766 [DOI] [PMC free article] [PubMed] [Google Scholar]
- Erickson SL and Lewis DA 2004. Cortical connectons of the mediodorsal thalamuc in cynomolgus monkeys. Journal of Comparative Neurology 373:107–127 [DOI] [PubMed] [Google Scholar]
- Evrard HC, 2019. The Organization of the Primate Insular Cortex. Front. Neuroanat 13:43. doi: 10.3389/fnana.2019.00043 [DOI] [PMC free article] [PubMed] [Google Scholar]
- Evrard HC, Forro T, and Logothetis N, 2012. Von Economo Neurons in the Anterior Insula of the Macaque Monkey. Neuron 74, 482–489. DOI 10.1016/j.neuron.2012.03.003 [DOI] [PubMed] [Google Scholar]
- Evrard HC, Logothetis NK, Craig AD 2014. Modular architectonic organization of the insula in the macaque monkey. Comp Neurol.522:64–97. doi: 10.1002/cne.23436. [DOI] [PubMed] [Google Scholar]
- Fischer DB, Boes AD, Demertzi A, Evrard HC, Laureys S, Edlow BL, Liu H, Saper CB, Pascual-Leone A, Fox MD, Geerling JC. 2016A human brain network derived from coma-causing brainstem lesions. Neurology 87:2427–2434. [DOI] [PMC free article] [PubMed] [Google Scholar]
- Freedman LJ, Insel TR, Smith Y 2000. Subcortical projections of area 25 (subgenual cortex) of the macaque monkey. J Comp Neurol. 421:172–88. [PubMed] [Google Scholar]
- Giguere M and Goldman-Rakic P 1988. Mediodorsal nucleus: areal, laminar and tangential distribution of afferents and efferents in the frontal lobe of rhesus monkeys. Journal of Compaarative Neurology 277: 105–213 doi: 10.1002/cne.902770204 [DOI] [PubMed] [Google Scholar]
- Gilbert SJ, Spengler S, Simons JS, Steele JD, Lawrie SM, Frith C,D, Burgess PW 2006. Functional specialization within rostral prefrontal cortex (area 10): a meta-analysis. J Cogn Neurosci. 18:932–48. [DOI] [PubMed] [Google Scholar]
- Goll Y, Atlan G, Citri A 2015. Attention: the claustrum. Trends in Neuroscience 38:486–95. 10.1016/j.tins.2015.05.006 [DOI] [PubMed] [Google Scholar]
- Grether D, Plott C, Rowe D, Sereno M, Allman J 2007. Mental processes and strategic equilibration: An fMRI study of selling strategies in second price auctions Experimental Economics 10:105–122. [Google Scholar]
- Grimaldi P, Saleem K, and Tsao D, 2016. Anatomical connections of the functionally-defined “face patches” in the macaque monkey Neuron 90: 1325–1342. doi: 10.1016/j.neuron.2016.05.009. [DOI] [PMC free article] [PubMed] [Google Scholar]
- Gross CG, Rocha-Miranda CE, Bender DB 1972. Visual properties of neurons in inferotemporal cortex of the Macaque. J Neurophysiol. 35:96–111. [DOI] [PubMed] [Google Scholar]
- Hakeem A, Sherwood C, Bonar C, Butti C, Hof P, Allman J 2009. Von Economo neurons in the elephant brain. Anat. Rec 292:242–248. [DOI] [PubMed] [Google Scholar]
- Harris G, Aston-Jones G 2006. Arousal and Reward: a dichotomy in orexin function. Trends in Neuroscience 29:571–77. doi: 10.1016/j.tins.2006.08.002 [DOI] [PubMed] [Google Scholar]
- Hoffmann M, Bar-On R 2012. Isolated frontopolar cortex lesion: a case study. Cogn Behav Neurol. 25:50–6. doi: 10.1097/WNN.0b013e318249a479. [DOI] [PubMed] [Google Scholar]
- Jabbi M, Bastiaansen J, Keysers C 2008. A common anterior insula representation of disgust observation, experience and imagination shows divergent functional connectivity pathways. PLoS One 3(8):e2939. doi: 10.1371/journal.pone.0002939. [DOI] [PMC free article] [PubMed] [Google Scholar]
- Jenkinson M, Beckmann CF, Behrens TE, Woolrich MW and Smith SM, 2012. Fsl. Neuroimage, 62(2), pp.782–790. [DOI] [PubMed] [Google Scholar]
- Jezzini A, Rozzi S, Borra E, Gallese V, Caruana F, Gerbella M 2015. A shared neural network for emotional expression and perception: an anatomical study in the macaque monkey. Front Behav Neurosci. 9:243. doi: 10.3389/fnbeh.2015.00243 eCollection 2015 [DOI] [PMC free article] [PubMed] [Google Scholar]
- Kano F, Krupenye C, Hirata S, Tomonaga M, Call J 2019. Great apes use self-experience to anticipate an agent’s action in a false-belief test. Proceedings of the National Academy of Science 116:20904–9. 10.1073/pnas.1910095116 [DOI] [PMC free article] [PubMed] [Google Scholar]
- Kim E-J, Sidhu M, Gaus SE, Huang E, Hof P, Miller B, DeArmond S and Seeley WW. 2012. Selective Frontoinsular von Economo Neurons and Fork Cell loss in early behavioral variant frontotemporal dementia. Cerebral Cortex 22:251–259. doi: 10.1093/cercor/bhr004 [DOI] [PMC free article] [PubMed] [Google Scholar]
- Knutson B, Fong GW, Bennett SM, Adams CM, Hommer D 2003. A region of mesial prefrontal cortex tracks monetarily rewarding outcomes: characterization with rapid event-related fMRI. Neuroimage. 218:263–72. [DOI] [PubMed] [Google Scholar]
- Kondo H, Saleem KS, Price JL 2003. Differential connections of the temporal pole with the orbital and medial prefrontal networks in macaque monkeys. J Comp Neurol.27;465: 499–523. [DOI] [PubMed] [Google Scholar]
- Koubeissi MZ, Bartolomei F, Beltagy A, Picard F 2014. Electrical stimulation of a small brain area reversibly disrupts consciousness. Epilepsy Behav.37:32–5. doi: 10.1016/j.yebeh.2014.05.027. [DOI] [PubMed] [Google Scholar]
- Kovach CK, Daw ND, Rudrauf D, Tranel D, O’Doherty JP, Adolphs R 2012. Anterior prefrontal cortex contributes to action selection through tracking of recent reward trends. J Neurosci. 32:8434–42. doi: 10.1523/JNEUROSCI.5468-11.2012. [DOI] [PMC free article] [PubMed] [Google Scholar]
- Lane DA, Patel PA, Morgan MM 2005. Evidence for an intrinsic mechanism of antinociceptive tolerance within the ventrolateral periaqueductal gray of rats. Neuroscience 135:227–34. [DOI] [PubMed] [Google Scholar]
- Leemans A and Jones DK, 2009. The B-matrix must be rotated when correcting for subject motion in DTI data. Magnetic Resonance in Medicine, 61(6), pp. 1336–1349. [DOI] [PubMed] [Google Scholar]
- Markov NT, Ercsey-Ravasz M, Lamy C, Ribeiro Gomes AR, Magrou L, Misery P, Giroud P, Barone P, Dehay C, Toroczkai Z, Knoblauch K, Van Essen DC, Kennedy H 2014. The role of long-range connections on the specificity of the macaque interareal cortical network. Proc Natl Acad Sci 110:5187–92. doi: 10.1073/pnas.1218972110. [DOI] [PMC free article] [PubMed] [Google Scholar]
- Mufson EJ and Mesulam MM 1984. Thalamic connections of the insula in the rhesus monkey and comments on the paralimbic connectivity of the medial pulvinar nucleus. Journal of Comparative Neurology 227:109–120 doi: 10.1002/cne.902270112. [DOI] [PubMed] [Google Scholar]
- Nakamura K, Kubota K 1996. The primate temporal pole: its putative role in object recognition and memory. Behav Brain Res. 77:53–77. [DOI] [PubMed] [Google Scholar]
- Nana A, Sidhu M, Gaus S, Hwang J-H, Li L, Park Y, Kim E-J, Pasquini L, Allen T, Rankin K, toller G, Kramer J, Geschwind D, Coppola G, Huang E, Grinberg L, Miller B, Seeley W. 2018. Neurons selectively targeted in frontotemporal dementia releal early stage TDP-43 pathobiology. Acta Neuropathologica 137:27–46. 10.1007/s00401-018-1942-8 [DOI] [PMC free article] [PubMed] [Google Scholar]
- Nimchinsky EA, Vogt BA, Morrison JH and Hof PR, 1995. Spindle neurons of the human anterior cingulate cortex. Journal of Comparative Neurology, 355(1), pp.27–37. [DOI] [PubMed] [Google Scholar]
- Nimchinsky EA, Gilissen E, Allman JM, Perl DP, Erwin JM and Hof PR, 1999. A neuronal morphologic type unique to humans and great apes. Proceedings of the National Academy of Sciences, 96(9), pp.5268–5273. [DOI] [PMC free article] [PubMed] [Google Scholar]
- Olsen C 2011. Natural Rewards, Neuroplasticity, and Non-Drug Addictions Neuropharmacology 61: 1109–22. doi: 10.1016/j.neuropharm.2011.03.010 [DOI] [PMC free article] [PubMed] [Google Scholar]
- Olson IR, Plotzker A, Ezzyat Y 2007. The Enigmatic temporal pole: a review of findings on social and emotional processing. Brain 130:1718–31. [DOI] [PubMed] [Google Scholar]
- Ongür D, An X, Price JL 1998. Prefrontal cortical projections to the hypothalamus in macaque monkeys. J Comp Neurol. 401:480–505. [PubMed] [Google Scholar]
- Ortigue S, Grafton ST, Bianchi-Demicheli F 2007. Correlation between insula activation and self-reported quality of orgasm in women. Neuroimage 37:551–60. [DOI] [PubMed] [Google Scholar]
- Pasquini L, Nana A, TGoller G, Brown J, Deng J, Staffaroni A, Kim E-J, Hwang L, Li L, Park Y, Gaus S/, Allen I/, Strum V, Spina S, Grinberg L, Rankin K, Kramer J, Rosen H, Miller B, Seeley W. 2020. Salience network atrophy links neuron type-specific pathobiology to loss of empathy in frontotemporal dementia. Cerebral Cortex 30:5387–99 doi: 10.1093/cercor/bhaa119 [DOI] [PMC free article] [PubMed] [Google Scholar]
- Patterson F, Gordon W 2002. Twenty-seven years of Project Koko and Michael In: Galdikas B, Briggs N, Sheeran L, Shapiro G, Goodall J (eds) All apes great and small, Vol I Kluwer Press, New York, pp 165–176 [Google Scholar]
- Paxinos G/. Huang X, Toga A. 2000. The Rhesus Monkey Brain in Stereotactic Coordinates. Academic Press, San Diego. [Google Scholar]
- Preuschoff K, Quartz SR, Bossaerts P 2008. Human insula activation reflects risk prediction errors as well as risk. J Neurosci. 28:2745–52. doi: 10.1523/JNEUROSCI.4286-07.2008 [DOI] [PMC free article] [PubMed] [Google Scholar]
- Ray J, Price J 1993. The organization of projections from the mediodorsal nucleus of the thalamus to orbital and medial prefrontal cortex in macaque monkeys. Journal of Comparative Neurology 337:1–31. [DOI] [PubMed] [Google Scholar]
- Rogers R, Owen A, Middleton H, Williams E, Pickard J, Sahakian B, and Robbins T, 1999. Choosing between Small, Likely Rewards and Large, Unlikely Rewards Activates Inferior and Orbital Prefrontal Cortex. J. Neuroscience 20:9029–9038. [DOI] [PMC free article] [PubMed] [Google Scholar]
- Rolls E 1989. Information processing in the taste system of primates. J. Exp. Biol 146:141–64. [DOI] [PubMed] [Google Scholar]
- Saleem KS, Kondo H, Price J. 2008. Complementary circuits connecting the orbital and medial prefrontal networks with the temporal, insular, and opercular cortex in the macaque monkey. J Comp Neurol. 506:659–93. [DOI] [PubMed] [Google Scholar]
- Saleem K, Miller B, and Price J, 2014. Subdivisions and Connectional Networks of the Lateral Prefrontal Cortex in the Macaque Monkey. Journal of Comparative Neurology |522:1641–1690. [DOI] [PubMed] [Google Scholar]
- Sarwar T, Ramamohanarao K and Zalesky A, 2019. Mapping connectomes with diffusion MRI: deterministic or probabilistic tractography?. Magnetic resonance in medicine, 81(2), pp.1368–1384. [DOI] [PubMed] [Google Scholar]
- Schilling KG, Nath V, Hansen C, Parvathaneni P, Blaber J, Gao Y, Neher P, Aydogan DB, Shi Y, Ocampo-Pineda M and Schiavi S, 2019. Limits to anatomical accuracy of diffusion tractography using modern approaches. Neuroimage, 185, pp. 1–11. [DOI] [PMC free article] [PubMed] [Google Scholar]
- Seeley WW„ Merkle FT,, Gaus SE, Craig AD, Allman JM„ Hof PR., 2012. Distinctive neurons of the anterior cingulate and frontoinsular cortex: a historical perspective. Cereb Cortex.22:245–50. doi: 10.1093/cercor/bhr005. [DOI] [PubMed] [Google Scholar]
- Semendeferi K, Armstrong E, Schleicher A, Zilles K, Van Hoesen GW 2010. Prefrontal cortex in humans and apes: a comparative study of area 10. Am J Phys Anthropol. 114:224–41. [DOI] [PubMed] [Google Scholar]
- Shamay-Tsoory S, Aharon-Peretz J, Perry D 2009. Two systems for empathy: a double dissaociation between emotional and cognitive empathy in the interior frontal gyrus versus ventromedial prefrontal lesions. Brain 132:617–27 doi: 10.1093/brain/awn279 [DOI] [PubMed] [Google Scholar]
- Small DM, 2012 Flavor in the brain. Physiology & Behavior 107 (2012) 540–552. doi: 10.1016/j.physbeh.2012.04.011 [DOI] [PubMed] [Google Scholar]
- Stephanacci L, Amaral DG 2000. Topographic organization of cortical inputs to the lateral nucleus of the macaque monkey amygdala: a retrograde tracing study. J Comp Neurol. 421:52–79. [DOI] [PubMed] [Google Scholar]
- Sweeney P, Yang Y 2016. An Inhibitory Septum to Lateral Hypothalamus Circuit That Suppresses Feeding. J Neurosci. 36:11185–11195. [DOI] [PMC free article] [PubMed] [Google Scholar]
- Tsujimoti S, Genovesio A, Wise S, 2010. Evaluating self-generated decisions in frontal pole cortex in monkeys. Nature Neuroscience 13:120–6. doi: 10.1038/nn.2453. [DOI] [PMC free article] [PubMed] [Google Scholar]
- Tryon VL, Mizumori SJY 2018. A Novel Role for the Periaqueductal Gray in Consummatory Behavior. Front Behav Neurosci.l2:178. doi: 10.3389/fnbeh.2018.00178 eCollection 2018. [DOI] [PMC free article] [PubMed] [Google Scholar]
- Tustison NJ, Avants BB, Cook PA, Zheng Y, Egan A, Yushkevich PA and Gee JC, 2010. N4ITK: improved N3 bias correction. IEEE transactions on medical imaging, 29(6), p. 1310. [DOI] [PMC free article] [PubMed] [Google Scholar]
- Von Economo C, Koskinas G, 1925. Die Cytoarchitectonik der Himrinde des erwachsenen Menschen. Springer, Berlin. [Google Scholar]
- Von Economo C (1926). A new type of special cells of the cingulate and insular lobes. Z Ges Neurol Psychiatr, 100, 707–712. [Google Scholar]
- Vos SB, Tax CM, Luijten PR, Ourselin S, Leemans A andFroeling M, 2017. The importance of correcting for signal drift in diffusion MRI. Magnetic resonance in medicine, 77(1), pp.285–299. [DOI] [PubMed] [Google Scholar]
- Wallis CU, Cardinal RN, Alexander L, Roberts AC, Clark e H.F. 2017. Opposing roles of primate areas 25 and 32 and their putative rodent homologs in the regulation of negative emotion. Proc Natl Acad Sci 114(20):E4075–E4084. doi: 10.1073/pnas.l620115114 [DOI] [PMC free article] [PubMed] [Google Scholar]
- Westin CF, Knutsson H, Pasternak O, Szczepankiewicz F, Özarslan E, van Westen D, Mattisson C, Bogren M, O’Donnell LJ, Kubicki M and Topgaard D, 2016. Q-space trajectory imaging for multidimensional diffusion MRI of the human brain. Neuroimage, 135, pp.345–362. [DOI] [PMC free article] [PubMed] [Google Scholar]
- Yeterian EH and Pandya D 1988. Corticothalamic connections of the paralimbic regions in the rhesus monkey. Journal of Comparative Neurology 269:130–46 doi: 10.1002/cne.902690111 [DOI] [PubMed] [Google Scholar]
Associated Data
This section collects any data citations, data availability statements, or supplementary materials included in this article.