Figure 2.

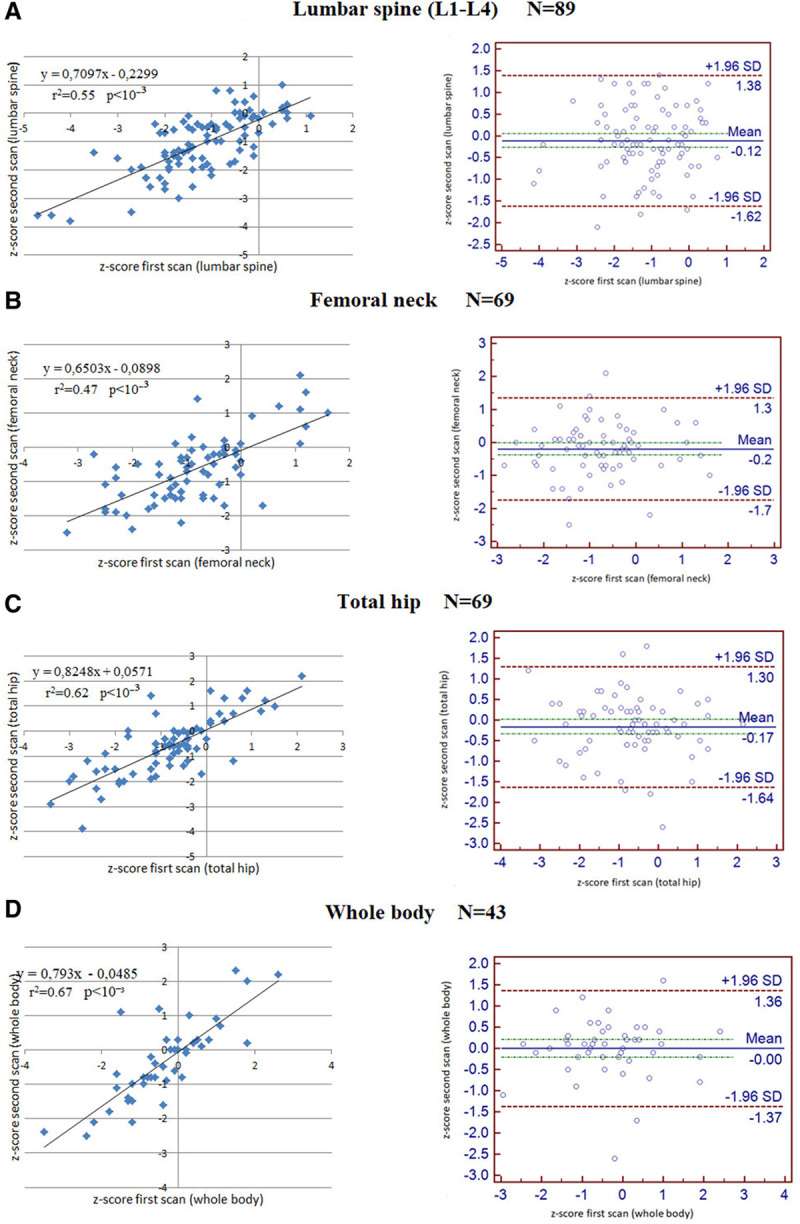
Correlation between z-scores of the first and the second scan and corresponding Bland Altman plots at lumbar spine (A), femoral neck (B), total hip (C), and whole body (D).

Correlation between z-scores of the first and the second scan and corresponding Bland Altman plots at lumbar spine (A), femoral neck (B), total hip (C), and whole body (D).