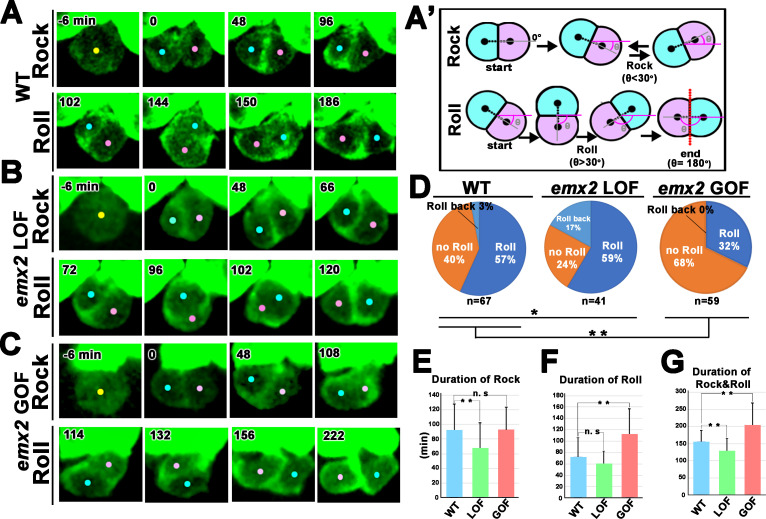
Figure 4. Quantification of frequency and duration of Rock and Roll among hair cells (HCs) in wild-type (WT) and emx2 mutants.
(A) In WT, a HC precursor (yellow dot) divides to form two daughter HCs (pink and blue dots), which first rock (Rock phase) and then frequently roll to exchange positions with each other (Roll phase). (A’) Definition of the Rock and Roll phase (see Materials and methods). (B and C) Compared to WT, emx2 loss of function (LOF) (B) and gain of function (GOF) (C) HC pairs took a shorter time in Rock and Roll and a longer time in the Roll phase, respectively. (D) Frequencies of Roll, No Roll, and Roll back of nascent HC pairs in WT (n = 67 from seven larvae), Emx2 LOF (n = 41 from six larvae), and GOF (n = 59 from seven larvae). Significance was assessed by using chi-squared test with 3 × 3 contingency table (X2 (df = 4)=30.00, p<0.0001, source data 1). A post-hoc 2 × 3 chi-squared test was performed for multiple comparisons. WT vs. LOF; (X2 (df = 2)=7.95, p=0.018), WT vs. GOF; (X2 (df = 2)=10.39, p=0.0055). Post-hoc chi-squared tests were performed for pairwise comparisons with FDR correction. (E–G) Duration of Rock (E), Roll (F), and Rock and Roll (G) of sibling HCs that underwent Rock and Roll in WT (n = 42), emx2 LOF (n = 35), and GOF (n = 19) larvae. Significance was assessed by using MANOVA (Rock, F(df1 = 2, df2 = 93)=5.349, p=0.0063, Wilks’ λ = 0.897; Roll, F(df1 = 2, df2 = 93)=15.638, p<0.0001, Wilks’ λ = 0.748; Rock and Roll, F(df1 = 2, df2 = 93)=20.10, p<0.0001, Wilks’ λ = 0.698), with post-hoc Tukey’s test for pairwise comparisons. *p<0.05, **p<0.01, n.s., not significant.


