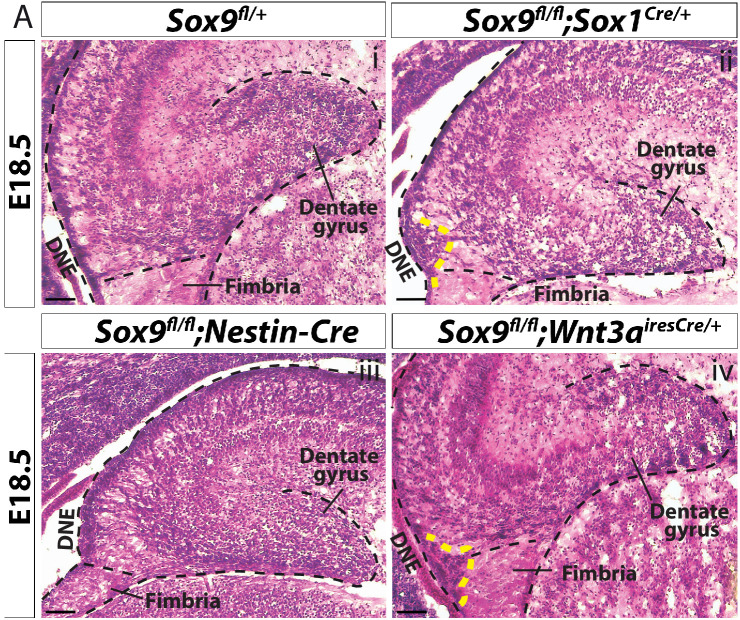
Figure 7. CH-specific deletion of Sox9 using Wnt3airesCre specifically affects granule neuron progenitor migration along the 1ry-to-3ry matrix axis.
(A–D) Analysis of PROX1+ differentiating granule neurons in E18.5 Sox9fl/fl;Wnt3airesCre/+ dentate gyrus (DG). (A) Immunostaining for PROX1 on E18.5 controls and Sox9fl/fl;Wnt3airesCre/+ brains. The total number of PROX1+ cells (B) and their distribution within the forming DG (C, see Figure 3N for analysis settings) was not affected in Sox9fl/fl;Wnt3airesCre/+ mutants compared to controls. (D) Percentage of PROX1+ granule neurons positioned in the DG lower blade (bins 1–5), versus the DG upper blade (bins 6–10) in E18.5 controls, Sox9fl/fl;Sox1Cre/+ and Sox9fl/fl;Nestin-Cre mutants (results from Figure 2N), and Sox9fl/fl;Wnt3airesCre/+ mutants (results from C). In contrast with Sox9fl/fl;Sox1Cre/+ (bins 1–5: 63.53 ± 1.85%, bins 6–10: 36.43 ± 1.70%, p=<0.0001) and Sox9fl/fl;Nestin-Cre mutants (bins 1– 5: 60.10 ± 7.47%, bins 6–10: 39.87 ± 7.43%, p=0.0002), PROX1+ granule neurons distribution in Sox9fl/fl;Wnt3airesCre/+ mutants (bins 1–5: 54.60 ± 3.26%, bins 6–10: 45.35 ± 3.30%) is similar to controls (bins 1–5: 54.00 ± 2.61%, bins 6–10: 46.03 ± 2.60%; Sidak multiple comparison test, Two-way ANOVA interaction p=0.0044). (E–H) Analysis of TBR2+ intermediate progenitors at E18.5 in Sox9fl/fl;Wnt3airesCre/+ DG via immunofluorescence (E). The total number of TBR2+ cells is unchanged (F) but their distribution along the three matrices (G) is affected as there were more cells in the 2ry matrix of Sox9fl/fl;Wnt3airesCre/+ mutants (228.60 ± 5.37) compared to controls (180.07 ± 1.79, p=0.0001, t test). Arrow indicates accumulation of TBR2+ cells in the ectopic cluster in Sox9fl/fl;Wnt3airesCre/+ mutants. (H) Percentage of TBR2+ in ectopic cluster. The percentage of TBR2+ cells in the ectopic cluster is comparable to that observed Sox9fl/fl;Sox1Cre/+ and Sox9fl/fl;Nestin-Cre mutants (calculated as % of TBR2+ progenitors in ectopic cluster relative to total number of TBR2 progenitors in 2ry matrix). (J) Immunofluorescence for NeuroD1 showing ectopic differentiation toward granule neuron cell fate in the ectopic cluster of Sox9fl/fl;Wnt3airesCre/+ mutants (arrow). (K) Triple immunostaining for SOX9, YFP, and GFAP on E18.5 controls and Sox9fl/fl;Wnt3airesCre/+ brains showing YFP- cells accumulating next to the SOX9+ DNE in E18.5 Sox9fl/fl;Wnt3airesCre/+;R26ReYFP mutants (delineated by yellow dashed line) and underlaid by a defective GFAP scaffold. DNE: dentate neuroepithelium. Scale bars represent 50 µm in (K); 100 µm in (A), (E), and (J).


