

LILRA3 is related to IBD and was markedly increased in IBD patients compared with healthy controls. LILRA3 functions as an anti‐inflammatory modulator by down‐regulating IFN‐γ, TNF‐α and up‐regulating IL‐10 secretion in monocytes. LILRA3 might promote monocyte proliferation through Akt and MEK/Erk signaling pathways.
Keywords: IBD, LILRA3, monocyte, polymorphism, signal transduction
Summary
Growing evidence shows that a homozygous 6·7‐kb deletion of the novel anti‐inflammatory molecule leukocyte immunoglobulin‐like receptor A3 (LILRA3) is associated with many autoimmune disorders. However, its effects on pathogenesis of inflammatory bowel disease (IBD) have yet not been clarified. LILRA3 is mainly expressed in monocytes, whereas its effects on biological behaviors of monocytes have not been systematically reported. In our study, to investigate the association between LILRA3 polymorphism and IBD susceptibility, LILRA3 polymorphism was assessed in 378 IBD patients and 509 healthy controls. Quantitative real time PCR (qRT–PCR), Western blot and immunohistochemistry (IHC) were employed to detect the LILRA3 expression in IBD patient blood and intestinal samples. The human U937 monocyte cell line was employed to establish LILRA3 over‐expressing cells and the effects of LILRA3 on the biological behaviors of U937 cells were systematically explored. Although no association of the polymorphism with IBD development was found, LILRA3 expression was markedly increased in IBD patients compared with healthy controls. Over‐expression of LILRA3 in monocytes led to significant decreases in secretion of interferon (IFN)‐γ, tumor necrosis factor (TNF)‐α and interleukin (IL)‐6. Additionally, LILRA3 abated monocyte migration by reducing the expression of several chemokines and enhanced monocyte phagocytosis by increasing CD36 expression. Furthermore, LILRA3 promoted monocyte proliferation through a combination of Akt and extracellular receptor kinase/mitogen‐activated protein kinase (Erk/MEK) signaling pathways. We report for the first time, to our knowledge, that LILRA3 is related to IBD and functions as an anti‐inflammatory modulator in U937 cells.
Introduction
Inflammatory bowel disease (IBD), which encompasses ulcerative colitis (UC) and Crohn’s disease (CD), comprises a group of intestinal chronic disorders characterized by inflammation and periods of remission and relapse [1]. The populations of western countries are more likely to suffer from IBD than those in Asia. However, recent studies have shown that the incidence and prevalence rates in some Asian countries are rapidly increasing [2, 3, 4].
Numerous studies have indicated that genetic factors play important roles in the pathogenesis of IBD, with the involvement of some of these genes in multiple autoimmune disorders. Leukocyte immunoglobulin‐like receptors (LILRs; synonyms: ILT, LIR, CD85) are the most conserved genes among those located within the leukocyte receptor cluster on human chromosome 19. The family includes 13 members with activating or inhibiting capacity [5]: LILRs with long cytoplasmic tails bearing tyrosine‐based inhibitory motifs are inhibitory receptors (LILRBs), whereas LILRs with short cytoplasmic tails have activating functions (LILRAs) [6, 7]. LILRs consist of two pseudogenes and 11 functional genes encoding five activating (LILRA1, 2, 4–6), five inhibitory (LILRB1–5) and one soluble (LILRA3) form. LILRA3 (ILT‐6, CD85e), located in the centromeric ILT cluster, is a special member of the LILR family. Genomic sequencing of LILRA3 has revealed that LILRA3 is highly homologous to other LILRs such as LILRB1 and LILRB2 [8], suggesting that LILRA3 might act by impairing the function of these LILRBs.
Rs103294 and rs410852 are two single‐nucleotide polymorphisms (SNPs) of the LILRA3 gene. rs103294 was located within the leukocyte immunoglobulin‐like receptor gene cluster at 19q13.4. In a case–control study among the Chinese population, rs103294 was reported to be associated with benign prostatic hyperplasia [9]. A genome‐wide association study (GWAS) identified rs103294 as a new risk locus for prostate cancer [10]. It was also reported to be associated with systemic lupus erythematosus (SLE) [11]. rs410852 was located at chr19, and relevant study is rare. Our previous study revealed that rs410852 was predisposed to CD in an immunochip assay.
LILRA3 shows presence–absence variation, as opposed to other LILRs, which are conserved genetically [12]. For example, some individuals may carry an aberrant deletion of a 6·7‐kb fragment encompassing the first seven exons [8, 13], and this variation has been proved to be associated with many autoimmune diseases, such as Sjögren’s syndrome (SS), multiple sclerosis (MS) and rheumatoid arthritis (RA) [14, 15, 16, 17]. Many articles have demonstrated that the 6·7‐kb deletion affects LILRA3 mRNA and protein expression, with individuals carrying the wild‐type (+/+) having much higher levels than those with the homozygous deletion (−/−) [17, 18, 19]. Nonetheless, increased LILRA3 is detected in many diseases, such as MS and systemic lupus erythematosus (SLE) [17, 19], both of which are autoimmune disorders characterized by excessive inflammation. These findings indicate that LILRA3 is a novel susceptibility gene for autoimmune diseases and might play a crucial role in the pathogenesis of chronic inflammatory diseases. Additionally, it has been reported that interleukin (IL)‐10 or interferon (IFN)‐γ sharply up‐regulates LILRA3 expression in human monocytes, whereas tumor necrosis factor (TNF)‐α exhibits the opposite effect [20]. Furthermore, LILRA3 induces proliferation of CD8+ T cells and natural killer (NK) cells in the presence of proinflammatory cytokines [21], suggesting an anti‐inflammatory effect of LILRA3. Apart from inflammation, LILRA3 is also reported to function as an antagonist of LILRB2 and to promote synapse formation through the extracellular receptor kinase/mitogen‐activated protein kinase (Erk/MEK) pathway [22].
Because IBD is an autoimmune disorder characterized by recurrent intestinal inflammation, we hypothesized that LILRA3 might play a role in IBD pathogenesis. Accordingly, in this study we investigated the interaction between LILRA3 polymorphisms and IBD development. Although no significant association was found, we surprisingly observed increased LILRA3 in IBD patients. LILRA3 is mainly expressed in mono‐myeloid cells, such as monocytes, macrophages (Mø) and DCs [21, 23, 24, 25]. Monocytes are critical regulators in immune responses and have important roles in immune surveillance. The effects of LILRA3 on monocytes have not been systematically reported. We employed the U937 human monocyte cell line to establish LILRA3 over‐expressing cells, and then explored the effects of LILRA3 on the above functions of monocytes as well as other biological behaviors, such as apoptosis and proliferation.
Materials and methods
Ethics statement
Our study was conducted in accordance with the principles expressed in the Declaration of Helsinki, and was approved by the ethics committee of Zhongnan Hospital of Wuhan University (2014037). Informed consent was obtained.
Patients and sample collection
Lithium sulfate anti‐coagulated peripheral blood samples were obtained from 378 IBD patients (185 CD, 193 UC) and 509 healthy controls (HC). All patients were recruited from the Department of Gastroenterology, Zhongnan Hospital of Wuhan University (Wuhan, China) from September 2014 to January 2016. The patients were subtyped according to Montreal classification criteria. HC were selected among volunteers from January to November 2015. Detailed criteria are listed in Table 1. The demographic and subphenotype data for the patients and controls are shown in Supporting information, Table S1. Total genomic DNA was extracted from blood using the QIAamp DNA blood midi kit (Qiagen, Shanghai, Germany). Inflamed ileal and/or colonic tissues were collected from 40 CD patients and 57 UC patients who underwent endoscopy at Zhongnan Hospital. All biopsies were taken from inflammatory sites adjacent to ulcerations. Non‐inflamed colonic mucosa samples were collected from 16 healthy volunteers; another 20 normal biopsies (Zhongnan Hospital from September 2014 to June 2015) obtained from uninfected sites 20 cm from polyps or neoplasms served as controls. All patients and controls were of the Han population from central China. Diagnosis of CD and UC was based on a combination of clinical symptoms, laboratory and radiological examinations and endoscopy with histology.
Table 1.
Inclusions and exclusions for patients and healthy controls
| Inclusions and exclusions for patients | Diagnosis of IBD (CD or UC) was conducted according to established clinical criteria including endoscopic, radiological and histopathological examination |
| Patients combined with other autoimmune disease, such as psoriasis, SLE, rheumatoid arthritis, multiple sclerosis, were excluded from the study | |
| Patients combined with disease that may impair the immune function, such as viral hepatitis and HIV infection, were excluded. | |
| Patients who had ever accepted bone marrow transplants were excluded | |
| All the patients included should have no blood relationship | |
| Inclusions and exclusions for control cohort | All the health controls included should be assessed according to general health evaluation and blood routine, liver and kidney function |
| Those who experience a treatment of glucocorticoid and immunosuppressant within 3 months should be excluded | |
| Those with obvious abdominal symptoms should be excluded | |
| Those have family history of autoimmune disease, including IBD, should be excluded |
IBD = inflammatory bowel disease; CD = Crohn’s disease; UC = ulcerative colitis; SLE = systemic lupus erythematosus.
6·7‐kb deletion genotyping
LILRA3 presence–absence variation was detected by polymerase chain reaction (PCR) using the two sets of primers listed in Supporting information, Table S2. PCR mix components are listed in Supporting information, Table S3. PCR conditions of two reactions were: 95°C for 2 min, 40 cycles of 94°C for 30 s, annealing at 59°C for 1·5 min, annealing at 72°C for 1 min and finally extension at 72°C for 10 min. With LILRA3 deletion, primer 1 (flanking the deletion) amplified a fragment of 166 base pairs (bp). When LILRA3 was present, primer 2 (designed within the 6·7‐kb region) amplified a fragment of 250 bp. Each DNA sample was tested using the two sets of primers in separate reactions. The amplified products were analyzed on a 1·5% agarose gel. The results of gel electrophoresis are shown in Supporting information, Fig. S1.
Fig. 1.
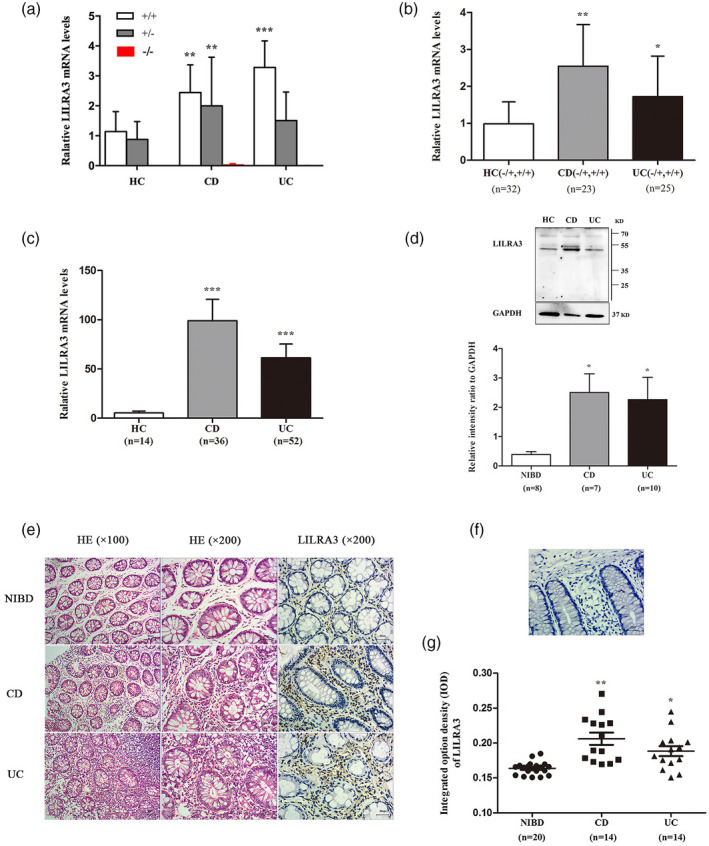
Leukocyte immunoglobulin‐like receptor A3 (LILRA3) is increased in inflammatory bowel disease (IBD) patients compared with healthy controls. (a) Impact of the 6·7‐kb deletion on LILRA3 mRNA expression in peripheral blood. mRNA expression was evaluated by quantitative real time polymerase chain reaction (qRT–PCR) assay. Data are expressed as mean ± standard deviation (s.d.);** P< 0·01,*** P< 0·001versusthe same genotypes in healthy controls (HC). (b) mRNA expression of LILRA3 in blood. (c,d) mRNA and protein expression of LILRA3 in the intestine. Protein was extracted from eight non‐inflammatory bowel disease (NIBD), seven Crohn’s disease (CD) and 10 ulcerative colitis (UC) samples. (e) Hematoxylin and eosin (H&E) staining (left two columns) and immunohistochemistry for LILRA3 (right column). Representative pictures are shown. Scale bar is 50 μm for the left column, 30 μm for the two right columns. (f) Negative control staining for immunohistochemistry. Scale bar is 30 μm. (G) Quantification of LILRA3+cells in intestinal biopsies. A total of 20 NIBD, 14 CD and 14 UC samples were enrolled; * P < 0·05, ** P < 0·01, *** P < 0·001 versus HC or NIBD groups.
rs103294 and rs410852 genotyping
The genotypes of rs103294 and rs410852 were detected by the PCR–ligation detection reaction (PCR‐LDR) method, with technical support from Shanghai Biowing Applied Biotechnology Company (Shanghai, China) [26, 27]. The sequences of the primers and probes are listed in Supporting information, Table S2. The PCR and LDR mix components are listed in Supporting information, Tables S3 and S4, respectively. PCR cycling parameters were as follows: 95°C for 2 min; 35 cycles at 94°C for 30 s, 59°C for 90 s, 65°C for 30 s and a final extension step at 65°C for 10 min. The PCR product was used as the template in the LDR reaction, and the LDR products were assessed using the ABI 3730 sequencer (ABI, Carlsbad, CA, USA). LDR was programmed with a 2‐min denaturing step at 95°C, and 40 cycles at 94°C for 15 s and 50°C for 25 s.
Cell culture
The human U937 monocyte cell line (cat. no. FDCC‐HLC063) and 293T cells (cat. no. FDCC‐HSN190) were obtained from Fudan Cell Center (FDCC) of Fudan University (Shanghai, China). Identification of the two cell lines were at the China Centre for Type Culture Collection in Wuhan, China. The U937 cells were cultured with RPMI‐1640 medium (HyClone, Logan, UT, USA); 293T cells were cultured in Dulbecco’s modified Eagle’s medium (DMEM) (HyClone) containing 10% fetal bovine serum (FBS) (HyClone), penicillin (100 U/ml) and streptomycin (100 µg/ml) in humidified 5% CO2 at 37°C.
Establishment of the LILRA3 over‐expressing U937 cell line
The open reading frame (ORF) of LILRA3 was amplified from U937 cells using quantitative real time–polymerase chain reaction (qRT–PCR) and cloned into the expression vector pWSLV‐02 [carrying enhanced green fluorescent protein (EGFP) as a reporter gene; Viewsolid, Beijing, China] to generate the plasmid pWSLV‐02‐LILRA3. For lentivirus production, 293T cells were co‐transfected with the pWSLV‐02‐LILRA3 plasmid, which encodes the intact sequence of LILRA3 cDNA, or the empty vector pWSLV‐02 as a control using Lenti‐Pac HIV Expression Packaging Kit (GeneCopoeia, Rockville, MD, USA). Virus was collected at 24 and 48 h after transfection. To prepare the LILRA3 over‐expressing cell line, U937 cells were infected with lentivirus for 72 h, and flow cytometry (FCM) was then used to select cells with stable LILRA3 lentivirus integration.
RNA extraction and qRT–PCR
Total RNA was extracted from peripheral blood, fresh‐frozen biopsies and pWSLV‐02‐LILRA3 plasmid‐ or pWSLV‐02‐transfected U937 cells using the TRIzol reagent (Invitrogen, Carlsbad, CA, USA). The quantity and quality of the RNA samples were assessed using a NanoDrop 2000 spectrophotometer (Thermo Scientific, Waltham, MA, USA). Total RNA (1 μg) was used to synthesize cDNA using a first‐strand cDNA synthesis kit (Thermo Scientific). qRT–PCR was subsequently performed using the QuantStudioTM6 Flex Real‐Time PCR instrument (ABI) with the SYBR® Premix Ex TaqTM II mix (Takara, Kusatsu, Japan). The primer sequences are listed in Supporting information, Table S2. The 2−ΔΔCT method was applied to determine the relative mRNA levels normalized to the housekeeping gene glyceraldehyde‐3‐phosphate dehydrogenase (GAPDH).
Western blotting
Total protein was extracted from fresh‐frozen intestinal biopsies and pWSLV‐02‐LILRA3 plasmid‐ or pWSLV‐02‐transfected U937 cells using a mixture of radioimmunoprecipitation assay (RIPA) lysis solution containing protease inhibitor and phosphatase inhibitor. The protein concentration was determined using a bicinchoninic acid (BCA) assay kit. RIPA and the BCA kit were purchased from Beyotime Biotechnology (Shanghai, China). A total of 40 µg protein from each sample was separated by 12·5 or 8% sodium dodecyl sulfate‐polyacrylamide gel electrophoresis (SDS‐PAGE) under reducing conditions, and then transferred onto polyvinylidene difluoride (PVDF) membranes (Millipore, Burlington, VT, USA). The membranes were blocked with 5% non‐fat milk in Tris‐buffered saline (TBST) with 0·1% Tween 20 at room temperature for 1 h, and then incubated with specific primary antibodies in TBST overnight at 4°C followed by three washes with TBST. The membranes were then incubated with a horseradish peroxidase (HRP)‐conjugated goat anti‐rabbit/mouse antibody in TBST for 2 h at room temperature. After three washes with TBST, the blots were visualized using enhanced chemiluminescence kit (Bio‐Rad, Hercules, CA, USA). The antibody information is listed in Supporting information, Table S5.
Enzyme‐linked immunosorbent assay (ELISA)
Culture media of U937 cells were collected and centrifuged at 20 000 g for 1 min. The supernatants were aliquoted and stored at −80°C until analysis. The concentrations of IFN‐γ, IL‐6, TNF‐α, C‐C motif chemokine ligand 2 (CCL2), CCL3, C‐X‐C motif chemokine ligand 8 (CXCL8)/IL‐8 and CXCL10 were measured using ELISA kits (NeoBiosciences, Shenzhen, China), according to the manufacturers’ protocol.
Histopathology, immunohistochemistry (IHC) and immunofluorescence
Colon biopsies for histopathology were fixed overnight in 10% formalin. After paraffin embedding, 3‐μm sections were cut and stained with hematoxylin and eosin (H&E) in accordance with standard protocols for microscopic examination. IHC was performed on 3‐μm sections of paraffin‐embedded fresh‐frozen endoscopic colon tissues from patients with IBD and control individuals. The sections were deparaffinized, and antigen was retrieved by microwave oven irradiation using sodium citrate buffer, followed by blocking with 5% goat serum for 30 min at room temperature. The sections were incubated with the primary antibody [anti‐LILRA3 pAb, cat. no. GTX108819; GeneTex, Irvine, CA, USA; and anti‐CD68 monoclonal antibody (mAb), cat. no. MCA1815T; BioRad, Hercules, CA, USA] overnight at 4°C. After careful washing, the sections were then incubated for 1 h at room temperature with a secondary antibody [fluorescein isothiocyanate (FITC)‐goat anti‐rabbit antibody, cat. no. BA1105; Boster, Wuhan, China; and CY3‐goat anti‐mouse antibody, cat. no. BA1031; Boster]. Sections treated with phosphate‐buffered saline (PBS) instead of the primary antibody were used as a negative control. Images were acquired by a microscope (Olympus, cat. no. IX73). Image‐Pro Plus version 6.0 (Media Cybernetics, Bethesda, MD, USA) was used to calculate the integrated option density (IOD).
Apoptosis assay
FCM was applied to detect the involvement of LILRA3 in apoptosis of U937 cells. U937 cells (4 × 10⁵cells/well) harboring the null vector (pWSLV‐02) and over‐expression plasmid (pWSLV‐02‐LILRA3) were plated in six‐well plates. After 48 h culture, the cells were harvested and washed twice with PBS. The cells were then stained using an annexin V‐PE/7‐amino‐actinomycin D (7‐AAD) kit (BD Biosciences, San Jose, CA, USA), following the manufacturer’s protocols. Annexin V‐PE was used to detect phosphatidylserine externalization, a hallmark of early apoptosis, and 7‐AAD was used to label DNA fragments, a sign of cell death. The Q4 area (annexin V‐PE‐positive and 7‐AAD‐negative) represents early apoptotic cells, and Q2 (both annexin V‐PE‐ and 7‐AAD‐positive) represents late apoptosis.
Cell migration
A migration assay was performed using Transwell 24‐well Boyden chambers (Corning, Corning, NY, USA) with an 8·0 μm pore size membrane without matrigel. Cells transfected with pWSLV‐02‐LILRA3 or pWSLV‐02 U937 were seeded in the upper chamber at a density of 5 × 10⁴ cells/well in 200 μl serum‐free RPMI‐1640 medium. As a chemoattractant, 600 μl 10% FBS containing complete medium was added to the lower chamber. After incubation for 6 h at 37°C in humidified 5% CO2, the upper chamber was detached from the well and the cells at the lower chamber, representing migrated cells, were counted using a cell‐counting chamber.
Phagocytosis assay
Latex beads (L3030; Sigma, St. Louis, MO, USA) were used to detect the potential influence of LILRA3 on the phagocytosis capacity of U937 cells. U937 cell lines harboring pWSLV‐02‐LILRA3 or pWSLV‐02 were seeded in six‐well plates (1.0 × 10⁵cells/well) in RPMI‐1640 medium containing 1% FBS, followed by incubation at 37°C in humidified 5% CO2 for 20 h. A mixture of FBS and latex beads (FBS: latex beads = 20 : 1) was added to each well. The percentage of GFP+ Texas red+ cells was then analyzed by FCM at 0·5, 6, 12 and 24 h.
Cell proliferation assay
Cell proliferation was detected by the cell‐counting kit‐8 (CCK‐8) assay, according to the manufacturer’s instructions. U937 cells harboring the LILRA3 over‐expression plasmid or the null vector were plated in 96‐well plates (3·0 × 103cells/well) for 0, 12, 24, 48 and 72 h. To each sample, 10 μl CCK‐8 solutions (Dojindo, kamimashiki gun Kumamoto, Japan) were added at the indicated time. After incubation at 37°C in humidified 5% CO2 for 1 h, the optical density (OD) of each sample was measured at 450 nm using an auto‐microplate reader (Infinite M200; Tecan, Mannedorf, Switzerland). Three parallel replicates were employed for each sample.
Statistical analysis
All analyses were performed using spss version 17.0 and GraphPad Prism software version 5.0. Among the HC, the distributions of the 6·7‐kb deletion genotype, rs103294 and rs410852 were in Hardy–Weinberg Equilibrium (HWE) (P = 0·55, P = 0·31, P = 0·55, respectively). The χ2 test was used to analyze the frequencies of alleles and genotypes between the cases and controls and the differences between the subphenotypes of the patient groups with the controls. Odds ratios (ORs) are provided with 95% confidence intervals (CIs) to estimate the relative risk of developing CD and UC. Differences in LILRA3 mRNA and protein expression between the patient groups and controls were analyzed using one‐way analysis of variance (anova). Differences between the U937 cells harboring the null vector and over‐expression plasmid were analyzed using an unpaired t‐test. A P‐value less than 0·05 was considered to be statistically significant. Data are presented as mean ± standard deviation (s.d.) from three independent experiments and representative data are shown.
Results
The association between LILRA3 gene polymorphism and the development of IBD
The deletion rate among 877 subjects enrolled into our study (both patients and HC) was 89·4%, which was higher in comparison with that reported for the Han Chinese population in Beijing (CHB) (89·4 versus· 70%) [28]· The deletion ratio in three groups was 88·4% for HC, 91·4% for CD and 90·7% for UC, and no association was found between the 6·7‐kb deletion and IBD development (P = 0·27, P FDR = 0·41, OR = 1·39, 95% CI = 0·78–2·47 for CD;P = 0·39, P FDR = 0·96, OR = 1·28, 95% CI = 0·73–2·22 for UC). In addition, no difference at the allele level (− versus +) was found (P = 0·70, P FDR = 0·90, OR = 1·05, 95% CI = 0·82–1·35 for CD; P = 0·87, P FDR = 0·87, OR = 1·02, 95% CI = 0·80–1·30 for UC) (Table 2), and the deletion did not affect the phenotype frequencies of CD or UC (Table 3). These data indicate that the 6·7‐kb deletion has no association with CD and UC development among the Han population of central China.
Table 2.
Association between LILRA3 polymorphism and IBD development
| Name | a HC (n = 509) | CD (n = 185) | UC (n = 193) | ||||||
|---|---|---|---|---|---|---|---|---|---|
| n (%) | n (%) | P | b P FDR | OR (95% CI) | n (%) | P | P FDR | OR (95% CI) | |
| 6.7 kb deletion | |||||||||
| −/−, −/+ | 450 (88·4) | 169 (91·4) | 175 (90·7) | ||||||
| +/+c* | 59 (11·6) | 16 (8·6) | 0·27 | 0·41 | 1·39 (0·78–2·47) | 18 (9·3) | 0·39 | 0·96 | 1·28 (0·73–2·22) |
| Allele | |||||||||
| − | 660 (64·8) | 244 (65·9) | 252 (65·3) | ||||||
| +* | 358 (35·2) | 126 (34·1) | 0·7 | 0·9 | 1·05 (0·82–1·35) | 134 (34·7) | 0·87 | 0·87 | 1·02 (0·80–1·30) |
| rs103294 | |||||||||
| TT, CT | 453 (89·0) | 165 (89·2) | 172 (89·1) | ||||||
| CC* | 56 (11·0) | 20 (10·8) | 0·94 | 0·94 | 1·02 (0·59–1·75) | 21 (10·9) | 0·96 | 0·96 | 1·01 (0·60–1·72) |
| Allele | |||||||||
| T | 696 (68·4) | 274 (74·1) | 257 (66·6) | ||||||
| C* | 322 (31·6) | 96 (25·9) | 0·04 | 0·12 | 1·32 (1·01–1·73) | 129 (33·4) | 0·52 | 0·78 | 0·92 (0·72–1·18) |
| rs410852 | |||||||||
| GG, AG | 495 (97·2) | 176 (95·1) | 187 (96·9) | ||||||
| AA* | 14 (2·8) | 9 (4·9) | 0·17 | 0·4 | 0·55 (0·24–1·30) | 6 (3·1) | 0·8 | 0·96 | 0·88 (0·33–2·33) |
| Allele | |||||||||
| G | 864 (84·9) | 315 (85·1) | 336 (87·0) | ||||||
| A* | 154 (15·1) | 55 (14·9) | 0·9 | 0·9 | 1·02 (0·73–1·43) | 50 (13·0) | 0·3 | 0·78 | 1·20 (0·85–1·69) |
HC = healthy controls;
P FDR = P‐value adjusted by false discovery rate correction;
* = wild genotype or wild allele; IBD = inflammatory bowel disease; LILRA3 = leukocyte immunoglobulin‐like receptor A3; CD = Crohn’s disease; UC = ulcerative colitis; OR = odds ratio; CI = confidence interval.
Table 3.
Association between LILRA3 polymorphism and IBD in subphenotype control cohort
| Phenotype | 6.7 kb deletion | rs103294 | rs410852 | |||||||||
|---|---|---|---|---|---|---|---|---|---|---|---|---|
| −/−, −/+ VS +/+ | P | OR (95% CI) | TT, CT VS CC | P | OR (95% CI) | GG,AG VS AA | P | OR (95% CI) | ||||
| d HC (n) | 450 | 59 | Ref | Ref | 453 | 56 | Ref | Ref | 495 | 14 | Ref | Ref |
| CD (n) | 169 | 16 | 165 | 20 | 176 | 9 | ||||||
| Diagnosis age e (yr) | ||||||||||||
| < 17 | 13 | 2 | 1 | 0·79 (0·19–3·87) | 12 | 2 | 1 | 0·74 (0·16–3·40) | 14 | 0 | 1 | 1·03 (1·01–1·04) |
| 17–40 | 122 | 10 | 1·60 (0·80–3·22) | 113 | 13 | 0·83 | 1·08 (0·57–2·03) | 120 | 6 | 0·38 | 0·57 (0·21–1·50) | |
| > 40 | 34 | 4 | 1 | 1·11 (0·38–3·25) | 40 | 5 | 1 | 0·99 (0·38–2·61) | 42 | 3 | 0·31 | 0·40 (0·11–1·43) |
| Site of disease | ||||||||||||
| L1 ileal | 45 | 3 | 0·26 | 1·97 (0·59–6·53) | 43 | 5 | 0·9 | 1·06 (0·40–2·80) | 45 | 3 | 0·36 | 0·42 (0·12–1·53) |
| L2 colonic | 51 | 8 | 0·66 | 0·84 (0·38–1·85) | 51 | 8 | 0·56 | 0·79 (0·36–1·75) | 56 | 3 | 0·55 | 0·53 (0·15–1·89) |
| L3 ileocolitis | 69 | 5 | 0·21 | 1·81 (0·70–4·67) | 67 | 7 | 0·69 | 1·18 (0·52–2·70) | 71 | 3 | 0·8 | 0·67 (0·19–2·39) |
| L4 upper f GI | 4 | 0 | 1 | 1·13 (1·10–1·17) | 4 | 0 | 1 | 1·12 (1·09–1·16) | 4 | 0 | 1 | 1·03 (1·01–1·04) |
| Disease behavior | ||||||||||||
| B1 non‐stricturing/ | 114 | 11 | 0·37 | 1·36 (0·69–2·67) | 113 | 12 | 0·65 | 1·16 (0·60–2·25) | 122 | 3 | 1 | 1·12 (0·33–4·07) |
| Non‐penetrating | ||||||||||||
| B2 stricturing | 33 | 4 | 1 | 1·08 (0·37–3·16) | 31 | 6 | 0·49 | 0·64 (0·26–1·60) | 33 | 4 | 0·03 | 0·23 (0·07–0·75) |
| B3 penetrating | 22 | 1 | 0·46 | 2·88 (0·38–21·79) | 21 | 2 | 0·99 | 1·30 (0·30–5·68) | 21 | 3 | 0·04 | 0·20 (0·05–0·74) |
| Perianal disease | 26 | 1 | 0·34 | 3·41 (0·45–25·59) | 25 | 2 | 0·79 | 1·55 (0·36–6·70) | 26 | 1 | 0·54 | 0·74 (0·09–5·81) |
| UC (n) | 175 | 18 | 172 | 21 | 187 | 6 | ||||||
| Diagnosis age (yr) | ||||||||||||
| < 17 | 3 | 0 | 1 | 1·13 (1·10–1·17) | 22 | 0 | 0·2 | 1·12 (1·09–1·16) | 2 | 0 | 1 | 1·03 (1·01–1·04) |
| 17–40 | 96 | 8 | 0·25 | 1·57 (0·73–3·40) | 73 | 10 | 0·78 | 0·90 (0·44–1·85) | 101 | 2 | 0·9 | 1·43 (0·32–6·38) |
| > 40 | 76 | 10 | 0·99 | 1·00 (0·49–2·03) | 77 | 11 | 0·68 | 0·87 (0·43–1·73) | 84 | 4 | 0·57 | 0·59 (0·19–1·85) |
| Disease location | ||||||||||||
| E1 proctitis | 19 | 4 | 0·61 | 0·62 (0·21–1·89) | 19 | 4 | 0·54 | 0·59 (0·19–1·79) | 22 | 1 | 0·49 | 0·62 (0·08–4·95) |
| E2 left‐sided | 70 | 8 | 0·73 | 1·15 (0·53–2·50) | 68 | 10 | 0·64 | 0·84 (0·41–1·73) | 76 | 2 | 1 | 1·08 (0·24–4·82) |
| E3 extensive | 86 | 6 | 0·15 | 1·88 (0·79–4·49) | 85 | 7 | 0·33 | 1·50 (0·62–3·41) | 89 | 3 | 1 | 0·84 (0·24–2·98) |
HC = healthy controls;
yr = year;
GI = gastrointestinal; LILRA3 = leukocyte immunoglobulin‐like receptor A3; IBD = inflammatory bowel disease; CD = Crohn’s disease; UC = ulcerative colitis; OR = odds ratio; CI = confidence interval.
Limited association was detected between the rs103294 and rs410852 genotypes and disease susceptibility (P = 0·94 for rs103294; P = 0·17 for rs410852). Nonetheless, at the allele level, the allele T of rs103294 was found to be a risk locus for CD (P = 0·04, P FDR = 0·12, OR = 1·32, 95% CI = 1·01–1·73) (Table 2). Relationships between the phenotypes of patient groups and the controls were then analyzed, revealing that the CD patients carrying the rs410852 mutant genotype (GG or AG) were less likely to develop intestinal stricturing or penetrating complications (Table 3). However, no association for the genotypes and allele frequencies between the UC patients and controls was observed for the groups as a whole or after stratified.
IBD patients exhibit increased LILRA3 expression compared with HC
The effect of LILRA3 variation on its expression in peripheral blood was assessed for 36 patients with CD, 48 patients with UC and 53 HC. The subjects enrolled were derived from samples with available genotyping data. As shown in Fig. 1a, LILRA3 was almost undetectable in subjects homozygous for the 6·7‐kb deletion, whereas its expression was significantly increased in those heterozygous for the deletion and with the wild‐type gene. In addition, we found remarkable increases in the levels of LILRA3 mRNA in both the CD (1·54 ± 2·10) and UC (1·33 ± 2·10) patients compared with the controls (0·59 ± 0·67) (P = 0·011 for CD; P = 0·031 for UC) (Fig. 1b).
Considering that IBD is a chronic inflammatory disease that primarily involves the gut, we then carried out qRT–PCR and Western blotting to investigate intestinal LILRA3 expression. Overall, a total of 16 HC, 40 CD and 57 UC intestinal samples were collected. Increased LILRA3 mRNA levels were observed in the patient groups compared with HC (P = 0·001 for both CD and UC group) (Fig. 1c). Total protein from another eight non‐IBD, seven CD and 10 UC samples was extracted, and in accordance with the qRT–PCR data, Western blotting showed a noteworthy increase in LILRA3 expression in both the CD (2·50 ± 1·68) and UC (2·26 ± 1·72) groups in comparison with HC (0·39 ± 0·27) (P < 0·05 for both the CD and UC groups) (Fig. 1d).
To further detect pathological changes and in‐situ expression of LILRA3 in intestinal biopsies, H&E staining and IHC were applied. The morphology and structure of mucosa from the HC were normal. In contrast, the submucosa and lamina propria (LP) of the CD and UC biopsies were saturated with lymphocytes, plasma cells and neutrophils (Fig. 1e). LILRA3 is reported to exist in a soluble form, and we consistently found LILRA3 in the cytoplasm of cells located in the LP (Fig. 1e). Compared with the non‐IBD controls (0·16 ± 0·009), many more LILRA3‐positive cells were detected in the LP of samples from the CD (0·21 ± 0·03) and UC patients (0·19 ± 0·03) (P < 0·01 for CD; P < 0·05 for UC) (Fig. 1e,g). According to previous studies, LILRA3 is mainly expressed in myeloid cells. We then used CD68 and LILRA3 antibody to stain the macrophages in the LP. Immunofluorescence assay revealed that the LILRA3 proteins were expressed in CD68‐positive macrophages and CD patients possessed more CD68+LILRA3+ cells than HC (16·09 ± 5·03 for CD, 6·57 ± 1·96 for HC, P < 0·01) (Fig. 2a,b). In summary, these findings demonstrate that the overwhelming majority of LILRA3 protein is expressed in macrophages and is remarkably increased in IBD patients, suggesting that LILRA3 might play a certain role in IBD development.
Fig. 2.
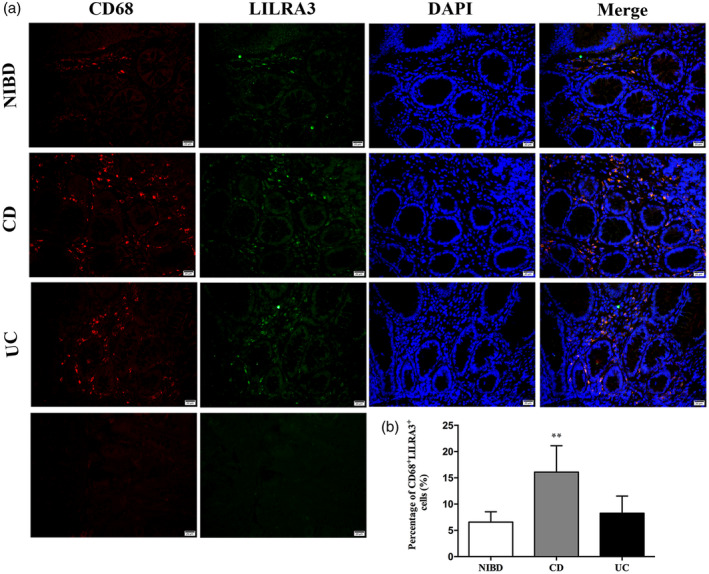
Leukocyte immunoglobulin‐like receptor A3 (LILRA3) is mainly expressed on CD68+macrophages in human intestinal. (a) Localization of LILRA3 expression by immunofluorescence. CD68 monoclonal antibody was used to mark macrophages. LILRA3 protein were expressed in CD68+macrophages and Crohn’s disease (CD) patients possessed more CD68+LILRA3+cells than the non‐inflammatory bowel disease (IBD) group. Scale bar is 20 μm for each column. (b) Quantification of LILRA3+CD68+cells in intestinal biopsies. Each group includes five samples. Each experiment was repeated for at least three times; ** P < 0·01.
Over‐expression of LILRA3 down‐regulates secretion of many cytokines by U937 cells
The genotypes of three gene locus of U937 cell lines used in our experiment were detected as homozygous for 6·7‐kb deletion, rs103294 (CC) and rs410852 (AA) (Fig. 3a). Establishment of LILRA3 over‐expressing U937 cells was verified at the mRNA and protein levels. As shown in Fig. 3b, significant increases in LILRA3 were detected in the over‐expressing U937 cells. To explore the potential effect of LILRA3 on cytokine secretion and further elucidate its role in inflammation, the supernatant of the two established cell lines were collected. ELISA assay demonstrated that the presence of LILRA3 could markedly down‐regulate secretion of IFN‐γ (P < 0·001), TNF‐α (P < 0·001) and IL‐6 (P < 0·001) (Fig. 3c). In view of that the LILRA3 is a soluble protein, we use LILRA3 over‐expressing U937 cell lines supernate to culture the U937 cells for 12 and 24 h, respectively, and consistent with the previous results we detected a significant decrease in the secretion of IFN‐γ and TNF‐α as well as IL‐6. Cells cultured for 12 h showed a more significant effect of inhibition (Fig. 3d). Previous studies have demonstrated an anti‐inflammatory role for LILRA3 based on findings that IL‐10 up‐regulates but TNF‐α down‐regulates LILRA3 production in vitro. Our results support the growing body of evidence that LILRA3 participates in inflammation as an anti‐inflammatory molecule.
Fig. 3.
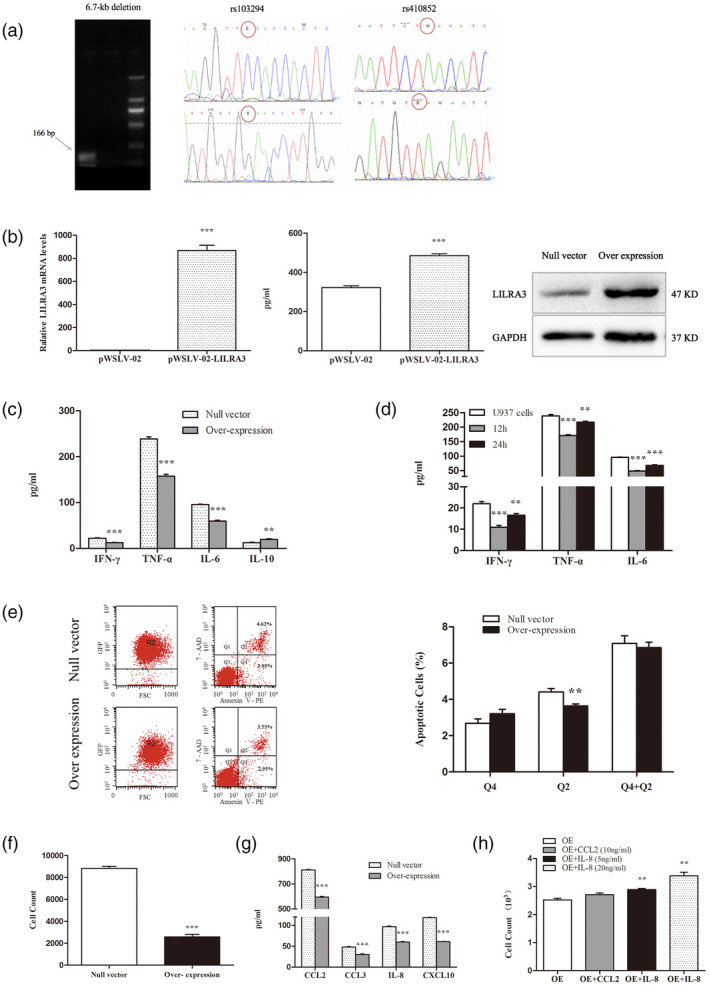
Effect of leukocyte immunoglobulin‐like receptor A3 (LILRA3) on U937 cells and related mechanisms. (a) 6.7‐kb deletion and genotypes of rs103294, rs410852 for the U937 cell line. U937 cell line is homozygous for LILRA3 deletion (−/−). rs103294 is CC (wild‐type), rs410852 is AA (wild‐type). (b) Verification of LILRA3 expression in the two established cells by quantitative real time polymerase chain reaction (qRT–PCR), enzyme‐linked immunosorbent assay (ELISA) and Western blotting. (c) Effect of LILRA3 on cytokine secretion by U937 cells. Expression of interferon (IFN)‐γ, tumor necrosis factor (TNF)‐α, interleukin (IL)‐6 and IL‐10 was assessed by ELISA. Data are expressed as mean ± standard deviation (s.d.). (d) Supernate collected from the LILRA3 over‐expressing U937 cell lines was used to culture the U937 cells, and secretion of IFN‐γ, TNF‐α and IL‐6 were significantly decreased. Cells cultured for 12 h showed a more significant effect of inhibition. (e) Representative flow cytometry analysis of apoptosis and statistical analysis of apoptotic rate (%) in the two established cell lines. (f) Effect of LILRA3 on U937 cell migration. (g) Impact of LILRA3 on chemokine secretion in U937 cells by ELISA assay. CCL2, CCL3, IL‐8 and CXCL10 were dramatically decreased by LILRA3. (h) Recombinant CCL2 and CXCL8 were added to the upper chamber in the migration assay, and LILRA3‐induced impaired cell migration was reversed by the exogenous IL‐8. Data are expressed as mean ± s.d.; * P < 0·05,** P < 0·01,*** P < 0·001.
The presence of LILRA3 has limited effects on U937 cell apoptosis
The impact of LILRA3 on apoptosis has not been reported. After culturing for 48 h, cells were harvested and stained with 7‐AAD kit, and the apoptosis ratio was calculated for GFP+ cells. According to the data shown in Fig. 3e, we conclude that although LILRA3 obviously decreased the late apoptosis rate compared with the null vector cells (3·64 ± 0·11% versus· 4·41 ± 0·20%, P < 0·01), it had little effect on early apoptosis and total apoptosis frequencies (P > 0·05). This result indicates that LILRA3 is not involved in regulating apoptosis in U937 cells.
LILRA3 attenuates U937 cell migration by decreasing expression of certain chemokines
A Transwell test was applied to investigate cell migration. We found that after 6 h of incubation in 10% FBS containing RPMI‐1640, few of the U937 cells over‐expressing LILRA3 had migrated into the lower chamber compared with cells harboring the null vector (P < 0·001) (Fig. 3f). Chemokines and their seven‐transmembrane, G‐protein coupled receptors are recognized as key mediators physiologically directing cell migration. We then performed an ELISA assay to detect expression of two CC‐type chemokines (CCL2, CCL3) and other two CXC‐type chemokines (CXCL8/IL‐8, CXCL10), which were predominantly expressed in monocytes. Interestingly, we found that CCL2, CCL3, IL‐8 and CXCL10 were significantly suppressed by LILRA3 (P < 0·001) (Fig. 3g). To verify our findings, we then added a certain amount of recombinant CCL2 or CXCL8 (PeproTech, Rocky Hill, CT, USA) to the upper chamber, and the migration assay results showed that the migration capacity, inhibited by LILRA3, was reversed by the exogenous IL‐8 (P < 0·01) (Fig. 3h). The data suggest that LILRA3 attenuates the migration capacity of U937 cell lines mainly by suppressing IL‐8 secretion.
LILRA3 promotes phagocytosis of U937 cells by up‐regulating CD36 expression
The phagocytosis efficiency was detected by FCM at 0·5, 6, 12 and 24 h by analyzing the percentage of GFP+ Texas red+ cells. As shown in Fig. 4a, LILRA3 over‐expressing U937 cells showed a strong ability to engulf beads beginning at 6 h in comparison with cells expressing the null vector (5·23 ± 0·21% versus 3·80 ± 0·35%, P < 0·01 at 6 h; 26·00 ± 0·17% versus 20·47 ± 0·42%, P < 0·001 at 12 h; 30·03 ± 0·83% versus 26·43 ± 0·64%, P < 0·01 at 24 h). Pattern recognition receptors (PRRs), mainly including mannose receptor (MR) and scavenger receptor (SR), play important roles in phagocytosis. CD206/MRC1 (an important MR) and CD36/SCARB3 (an important class B SR) are two highly effective endocytic receptors expressed on monocytes [29, 30]. qRT–PCR and Western blotting were employed to further explore whether LILRA3 could alter expression of these two receptors on the plasma membrane (for primers used in the reaction, see Supporting information, Table S2). We found that LILRA3 could significantly promote expression of CD36, yet had no influence on CD206 (Fig. 4b,c). CD36‐specific antibody (BD Biosciences) was added to the culture of LILRA3 over‐expressing cell lines, and the phagocytosis efficiency was detected again. The specific antibody could significantly decrease the phagocytosis ability of LILRA3 over‐expression cell lines in a concentration‐dependent manner (P < 0·01 for both groups at 12 h culture, P < 0·01 for 1 mg/ml and P < 0·001 for 10 mg/ml at 24 h culture) (Fig. 4d). Taken together, our results reveal that LILRA3 enhances the phagocytosis ability of U937 cells by increasing CD36 expression.
Fig. 4.
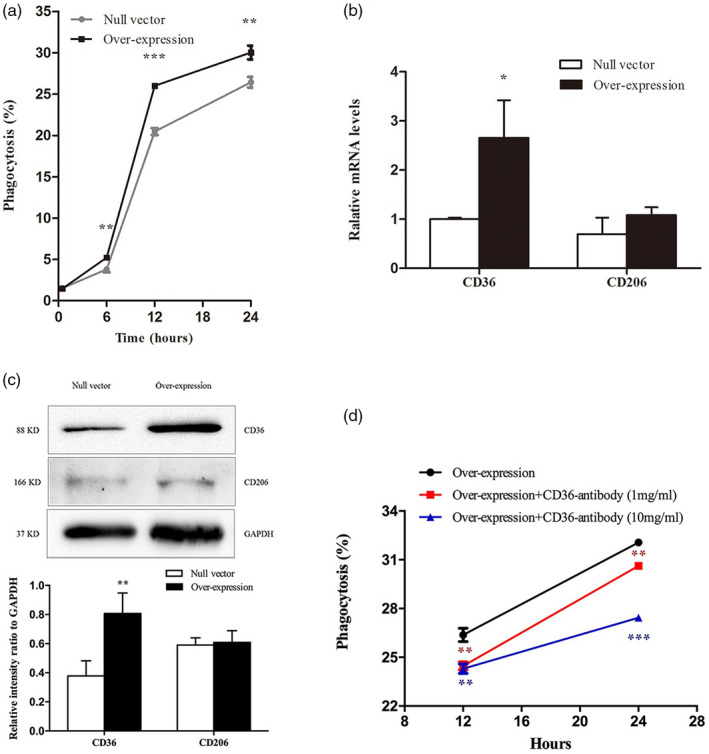
Leukocyte immunoglobulin‐like receptor A3 (LILRA3) enhances the phagocytosis ability of U937 cells by up‐regulating CD36 expression. (a) Phagocytosis rates were statistically analyzed between LILRA3 over‐expressing U937 cells and U937 cells expressing the null vector. (b,c) Effects of LILRA3 on CD36 and CD206 expression according to quantitative real time–polymerase chain reaction (qRT–PCR) and Western blotting. (d) The specific antibody of CD36 could significantly decrease the phagocytosis ability of LILRA3 over‐expression cell lines in a concentration‐dependent manner; * P < 0·05,** P < 0·01,*** P < 0·001.
LILRA3 enhances the proliferation of U937 cells through a combination of Akt and MEK/Erk signaling pathways
The proliferation capacity of the two established U937 cell lines was evaluated using CCK‐8 assay by detecting OD values at 450 nm at 12, 24, 48 and 72 h. After 24 h of culturing, enhanced proliferation was observed for the LILRA3 over‐expressing U937 cells compared with the cells expressing the null vector, and the difference was significant at 48 and 72 h (P = 0·016 for 48 h; P = 0·003 for 72 h) (Fig. 5a). Western blotting was applied to investigate the potential signaling pathway, and we found that over‐expression of LILRA3 significantly increased the levels of phosphorylated Akt, MEK and P38 MAPK (Fig. 5b–d). Given that the MEK and Akt pathways are closely related to proliferation, our ensuing research mainly focused upon exploring the upstream and downstream factors of these two kinases. The levels of phosphorylated Erk (the accepted downstream protein of MEK), PDK1 and c‐Raf (the classical kinases for Akt and MEK, respectively), PI3K (the conventional upstream protein of both Akt and MEK) and Foxo3a (the shared downstream protein of MEK and Akt) were further examined. Intriguingly, we found that phosphorylation of Erk, PDK1, c‐Raf and PI3K was significantly increased, but that of class O forkhead box transcription factors (Foxo3a) decreased in the presence of LILRA3 (Fig. 5c,e,f,g). Phosphorylation of P65, SAPK/JNK and mTOR was also investigated, but no difference was found (see Supporting information, Fig. S2). Because both Akt and MEK can be activated by PI3K, we speculated that the two pathways might function synergistically to regulate U937 cell proliferation. To confirm our hypothesis, LILRA3 over‐expressing cells were seeded into six‐well plates and pretreated with specific inhibitors of MEK (GSK1120212, 1 μmol/l), Akt (MK‐2206 2HCL, 5 μmol/l) or PI3K (LY294002, 20 mmol/l); the three inhibitors were purchased from Selleckchem (Houston, TX, USA). Western blotting was used to evaluate the inhibitory efficiency, and the CCK‐8 assay was carried out at 24, 48 and 72 h to detect cell viability. We found that the three inhibitors could dramatically decrease phosphorylation of their targeted proteins (Fig. 6a–c) and could sharply reduce cell viability after 24 h of culture compared with cells treated with dimethyl sulfoxide (DMSO) (Fig. 6d). Most importantly, as shown in Fig. 6c,d, LY294002 (a specific inhibitor of PI3K) also markedly decreased phosphorylation of Akt and MEK, with the highest inhibitory efficiency on cell proliferation compared with the other inhibitors. These results were consistent with our speculation. Foxo3a is a well‐known critical transcription factor involved in cell growth. Although we detected a noteworthy decline in phosphorylation of this protein in cells pretreated with the three inhibitors, this result was not in accordance with our finding when the level of phosphorylated Foxo3a was detected between LILRA3 over‐expressing and null vector cells. Indeed, Foxo3a phosphorylation should be enhanced by activated Akt and MEK; in contrast, we detected a decreased level when LILRA3 was over‐expressed. A possible hypothesis to explain this phenomenon is that LILRA3 might have a direct/indirect inhibitory effect on Foxo3 phosphorylation; further investigations are needed to verify this speculation. In conclusion, our data indicate that LILRA3 regulates cell proliferation, most probably through PI3K/Akt and PI3K/MEK/Erk signaling pathways.
Fig. 5.
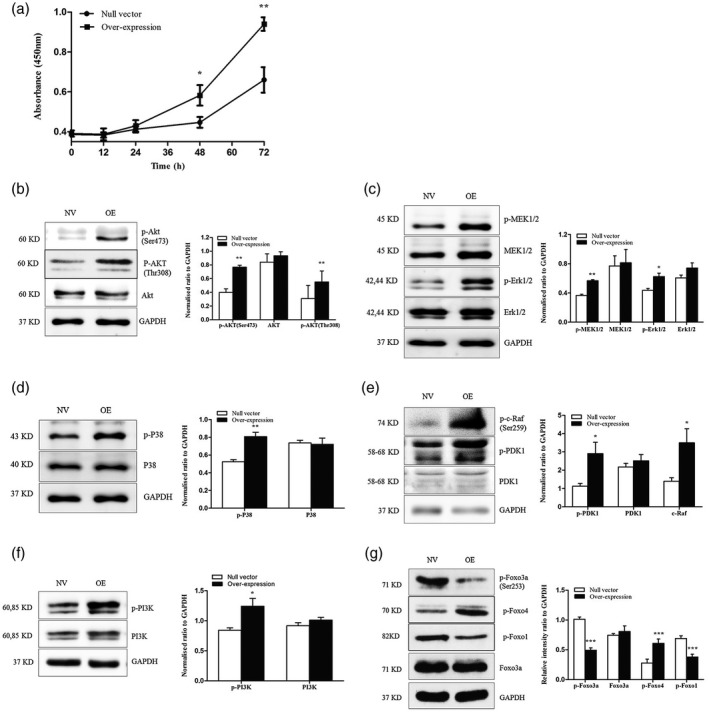
Leukocyte immunoglobulin‐like receptor A3 (LILRA3) increases U937 cell proliferation and the possible signaling pathway. (a) Proliferation of the LILRA3 over‐expressing U937 cells and null vector U937 cells were analyzed by CCK‐8 assay. Optical density (OD) at 450 nm was detected at 0, 12, 24, 48 and 72 h. (b–d) Western blot analysis of p‐protein kinase B (Akt), Akt, p‐mitogen‐activated protein kinase/extracellular signal‐regulated kinase (MAPK/ERK), MEK, p‐Erk, Erk, p‐P38 (MAPK) and P38 MAPK in LILRA3 over‐expressing cells (OE) and null vector cells (NV). (e,f,g) Western blot analysis of p‐3‐phosphoinositide‐dependent protein kinase 1 (PDK1), PDK1, p‐c‐Raf, p‐phosphoinositide 3‐kinase/protein kinase (PI3K), PI3K, p‐class O forkhead box transcription factors (Foxo3a) and Foxo3a, p‐Foxo4 and p‐Foxo1 in LILRA3 over‐expressing cells (OE) and null vector cells (NV). Each experiment was repeated for at least three times; * P < 0·05,** P < 0·01,*** P < 0·001versusnull vector cells. Glyceraldehyde 3‐phosphate dehydrogenase (GAPDH) abundance was used as a control.
Fig. 6.
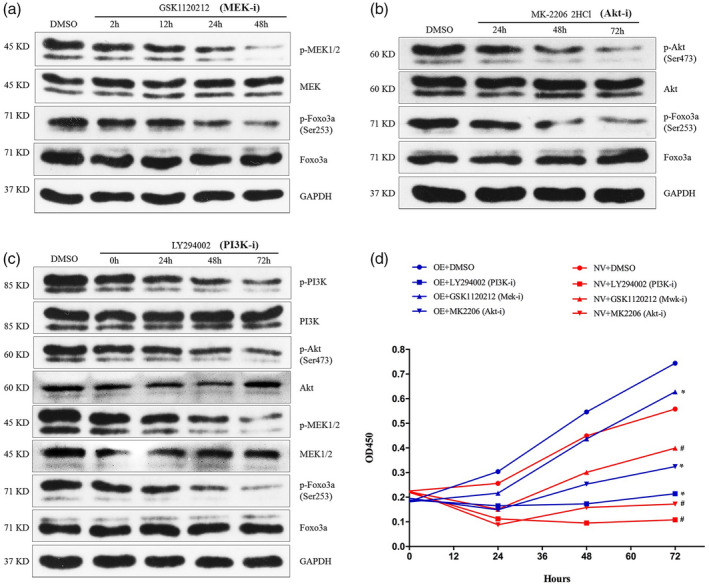
Leukocyte immunoglobulin‐like receptor A3 (LILRA3) might regulate U937 cells proliferation through phosphoinositide 3‐kinase/protein kinase (PI3K/Akt) and PI3K/mitogen‐activated protein kinase/extracellular signal‐regulated kinase (MAPK/ERK) kinase (MEK)/Erk signaling pathways. (a–c) Western blot analysis for the inhibitory efficiency of GSK1120212, MK‐2206‐2HCL and LY294002 and the expression of the related downstream proteins [p‐class O forkhead box transcription factors (p‐Foxo3a) and Foxo3a for (a) and (b), p‐Akt, Akt, p‐MEK, MEK, p‐Foxo3a and Foxo3a for (c)]. Glyceraldehyde 3‐phosphate dehydrogenase (GAPDH) abundance was used as a control. (d) Cell counting kit‐8 (CCK‐8) assay to detect the proliferation of LILRA3 over‐expressing U937 cells (OE) after pretreatment with three specific inhibitors for indicated time. NV = null vector U937 cells. Each experiment was repeated for at least three times; * P < 0·05,# P < 0·01versusLILRA3 over‐expressing U937 cells pretreated with dimethylsulfoxide (DMSO).
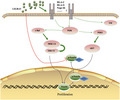
A schematic of the possible signaling pathway for LILRA3
The exact ligand for LILRA3 remains unknown. Human leukocyte antigen (HLA)‐C, HLA‐G and Nogo 66 (a highly conserved 66‐amino acid loop of Nogo A) are reported as possible ligands for LILRA3 [22, 31, 32]. Based on these findings, we hypothesize that LILRA3 might activate the above signaling pathway by interacting with one of the above or unknown ligands (Fig. 7).
Fig. 7.
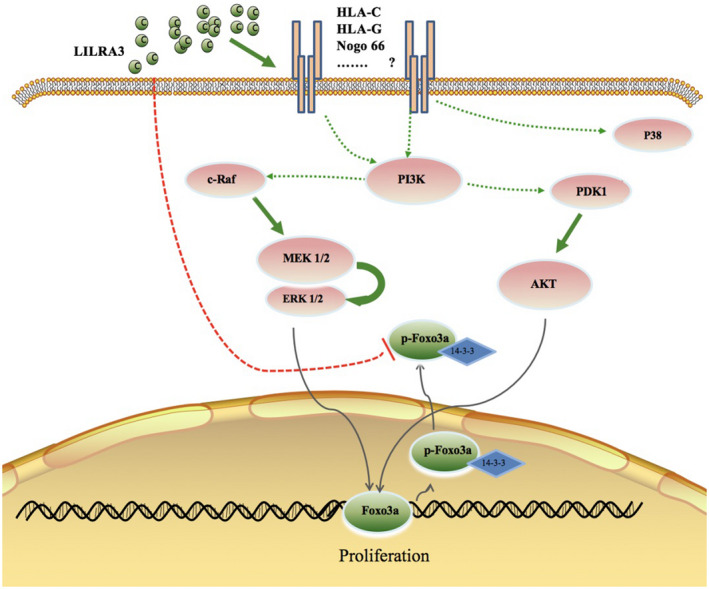
A schematic of the possible signaling pathway of leukocyte immunoglobulin‐like receptor A3 (LILRA3) . LILRA3 might interact with one of the listed or unknown ligands and trigger phosphoinositide 3‐kinase/protein kinase (PI3K/Akt) and PI3K/mitogen‐activated protein kinase/extracellular signal‐regulated kinase (PI3K/MEK/Erk) signaling to regulate U937 cell proliferation. LILRA3 might directly/indirectly inhibit class O forkhead box transcription factors (Foxo3a) phosphorylation. Whether Foxo3a plays a role in LILRA3‐induced cell proliferation needs to be further investigated.
Discussion
Our initial goal was to clarify the association between LILRA3 polymorphism and IBD susceptibility. Although no significant association with IBD development was observed between rs103294, rs410852 and the 6.7‐kb deletion genotypes, we demonstrated that homozygous 6·7‐kb deletion results in undetectable LILRA3 levels, which is consistent with previous studies [18, 19]. In addition, we detected a much higher deletion ratio among the Han population of central China compared with CHB. Unexpectedly, we found LILRA3 expression in IBD patients was significantly higher than in HC.
LILRs can be categorized into two groups, according to the amino acid sequence similarity of the region responsible for binding to HLA [33]. LILRB1, B2, A1, A2 and A3 belong to group 1. In contrast to group 2 LILRs, group 1 members display high sequence similarity and are predicted to bind to HLA class I molecules (HLAIs). LILRB1 was reported to block the combination of CD8 molecular with HLA‐I hence to regulate CD8+ T cells. LILRB2 promoted hematopoietic stem cell (HSC) proliferation. Among LILRS, LILRA3 is the only soluble member. It is homologous to LILRB1 and LILRB2. Studies have reported that the LILRA3 domain 1 (D1) and D1D2 (domains 1 and 2) could bind to classical HLA‐A*0201 and non‐classical HLA‐G1, thus inhibit the immune response, but the affinities were reduced compared to either LILRB1 or LILRB2 [34, 35]. Based on these findings, we speculate that LILRA3 might play certain roles in the immune system.
In vitro, recombinant LILRA3 shows strong and specific binding to the surface of primary peripheral blood mononuclear cells (PBMCs), U937 monocyte cells and B cells [23]. Additionally, recombinant LILRA3 could dramatically abrogate lipopolysaccharide (LPS)‐induced TNF‐α secretion by monocytes, and increases in LILRA3 have been detected in MS and SLE patients. All these data indicate a critical role for LILRA3 in inflammatory diseases. The intestinal LP contains a diverse array of mononuclear phagocyte (MNP) subsets, including conventional DCs, monocytes and tissue‐resident macrophages that collectively play an essential role in mucosal homeostasis, infection and inflammation. In our study, we also found that LILRA3 is mainly expressed on macrophages located in the LP of intestinal macrophages, and CD patients possessed more CD68+LILRA3+ cells. Intestinal macrophages are mainly derived from monocytes in circulation, and LILRA3 was reported to be mainly expressed on monocytes, as IBD is characterized by immunological disorder and monocytes are critical regulators in immune responses and played important roles in IBD pathogenesis. We speculate that LILRA3 might exert certain functions on monocytes. To deduce the effect of LILRA3 on immune responses, in our study human U937 monocytes were employed to establish LILRA3 over‐expressing cells, and we observed that LILRA3 could markedly decrease IFN‐γ, TNF‐α and IL‐6 secretion and increase IL‐10 secretion. This finding further confirms an anti‐inflammatory effect of LILRA3 in immune responses.
Monocytes account for 2–10% of all leukocytes in the human body. These cells circulate through the blood and lymphatic system and are recruited to damaged tissue or infected sites to differentiate into Mø and DCs, thus triggering adaptive immune responses [36]. Therefore, stimulation of monocyte migration can help to boost inflammatory responses. In vivo, migration is largely mediated by interaction between chemokines and chemokine receptors. We found that the migration ability of U937 cells was sharply attenuated by LILRA3. CCL2, CCL3, CXCL8 and CXCL10 are the main chemokines secreted by monocytes, and LILRA3 was able to conspicuously reduce expression of these molecules on U937 cells. This finding is in agreement with our Transwell assay, which demonstrated impaired migration capacity of U937 cells when LILRA3 was over‐expressed. Based on these results, we speculate that LILRA3 might prevent monocyte migration from the circulation into tissues, thereby suppressing inflammation.
In this study, LILRA3 over‐expressing cells engulfed more latex beads than cells harboring the null vector. This result indicates that LILRA3 can promote the phagocytosis capacity of U937 cells. Phagocytosis is predominantly mediated by endocytic receptors present on the phagocyte membrane [37]. SR and MR are important receptors associated with endocytosis. SR consists of a family of receptors with many ligands and can be divided into two subgroups: class A and class B. Class A and class B can be further divided into many types, including SR‐AI, SR‐AII, SR‐AIII, SR‐BI, SR‐BII and SRBIII [27, 37]. SRBIII, also termed CD36, is mainly expressed on cells of lymphoid and hematopoietic lineages, such as monocytes, Mø, platelets, endothelial cells and a variety of cultured cell lines [38, 39]. MR is a carbohydrate‐binding receptor mainly expressed by Mø and DCs [30]. In our study, both CD36 and CD206 were detected on U937 cells, and LILRA3 increased CD36 expression but had a limited effect on CD206 expression. These results are consistent with our phagocytosis assay.
Similar to previous studies reporting that recombinant LILRA3 could induce the proliferation of CD8+ T cells and NK cells in mixed lymphocyte reactions (MLR) [21], we observed that increased LILRA3 expression could enhance U937 cell proliferation in vitro. PI3K/Akt and PI3K/MEK/Erk signaling are two essential pathways involved in cell survival and growth [40, 41], and we found that LILRA3 activated these two pathways to regulate cell proliferation. Foxo3a, a tumor‐suppressive transcriptional factor, is known to regulate various cellular events such as metabolism, proliferation, tumorigenesis, cell cycle arrest, apoptosis and longevity [42, 43, 44]. Previous studies have shown that the two key kinases Akt and Erk have the ability to regulate the transcriptional activity of Foxo3a via specific phosphorylation [45, 46, 47]. Akt‐ or MEK‐mediated phosphorylation causes Foxo3a to bind to the 14‐3‐3 protein, followed by translocation from the nucleus to the cytoplasm, with inhibition of transcriptional activity [43, 44, 48]. The Ras/Erk pathway also regulates cell growth by inhibiting Foxo3a via MDM2‐mediated degradation [44]. In our study, we observed that Foxo3a phosphorylation was decreased when LILRA3 was over‐expressed. In contrast, phosphorylation of Foxo3a was conspicuously reduced when LILRA3 over‐expressing cells were preincubated with specific inhibitors of MEK, Akt and PI3K. One possible explanation for this inconsistency is that LILRA3 might directly/indirectly affect Foxo3a phosphorylation through an unknown mechanism. Further experiments are needed to elucidate this mechanism.
Taken together, we found that LILRA3 might function as an anti‐inflammatory molecule in U937 cells based on the following: (1) LILRA3 directly inhibited inflammation by decreasing proinflammatory cytokine secretion; (2) LILRA3 restrained monocytes in circulation system by attenuating their migration ability and accordingly reduced Mø and DCs in tissues, thereby restricting activation of adaptive immunity; (3) increased LILRA3 enabled monocytic cells to engulf more pathogens in circulation; and (4) LILRA3 increased the proliferation of immunocytes, such as monocytes, CD8+ T cells and NK cells, thus allowing these cells to kill more pathogens and microorganisms.
Collectively, for the first time to our knowledge, we report that LILRA3 expression is markedly increased in IBD patients. LILRA3 might function as an anti‐inflammatory modulator in innate immune responses and regulate cell proliferation through a combination of Akt and MEK/Erk signaling pathways. Further efforts are needed to explore the exact role of LILRA3 in adaptive immunity.
Disclosure
There are no financial conflicts of interest to declare for any of the authors.
Author contributions
X. L. gave substantial contribution to acquisition, analysis and interpretation of the data. F. L. and J. M. drafted the article and revised it. Y. C. revised the article critically for important intellectual content. X. L. and L. X. collected the samples and analyzed the data. X. S. and F. Z. designed the experiments. Q. Z. designed the experiments and gave final approval of the version.
Supporting information
Fig. S1. Agarose gel electrophoresis analysis of LILRA3 PCR products. M: 100 bp DNA molecular marker; −/−: homozygous mutant genotype with 6.7‐kb deletion in both alleles (166 bp); +/−: heterozygous genotype with a single intact (250 bp) and a single mutant allele (166 bp); +/+: homozygous wild type genotype with intact gene in both alleles (250 bp).
Fig. S2. (A and B) Western blot of p‐P65, P65, p‐SAPK/JNK, JNK2, p‐mTOR, mTOR in LILRA3‐overexpressing U937 cells (OE) and null vector cells (NV). (C and D) Western blot analysis of p‐P65, P65, p‐SAPK/JNK and JNK2, p‐mTOR and mTOR protein in LILRA3 over‐expressing cells and null vector cells.
Table S1. Demographic and sub‐phenotype data of IBD patients and controls.
Table S2. Sequence of primers and probes.
Table S3. PCR components detecting 6.7‐kb deletion, rs103294 and rs410852 genotype.
Table S4. LDR components detecting rs103294 and rs410852 genotype.
Table S5. Antibodies used in our manuscript.
Acknowledgements
This work was supported by grants from the National Natural Science Foundation of China (grant numbers 81470823, 81800488). The authors thank all individuals who participated in this study. The data are openly available in a public repository that issues data sets with DOIs.
Data availability statement
Data openly available in a public repository that issues datasets with DOIs.
References
- 1. Khor B, Gardet A, Xavier RJ. Genetics and pathogenesis of inflammatory bowel disease. Nature 2011; 474:307–17. [DOI] [PMC free article] [PubMed] [Google Scholar]
- 2. Ahuja V, Tandon RK. Inflammatory bowel disease in the Asia–Pacific area: a comparison with developed countries and regional differences. J Dig Dis 2010; 11:134–47. [DOI] [PubMed] [Google Scholar]
- 3. Lee YM, Fock K, See SJ et al Racial differences in the prevalence of ulcerative colitis and Crohn’s disease in Singapore. J Gastroenterol Hepatol 2000; 15:622–5. [DOI] [PubMed] [Google Scholar]
- 4. Zheng JJ, Zhu XS, Huangfu Z et al Prevalence and incidence rates of Crohn’s disease in mainland China: a meta‐analysis of 55 years of research. J Dig Dis 2010; 11:161–6. [DOI] [PubMed] [Google Scholar]
- 5. Wilson MJ, Torkar M, Haude A et al Plasticity in the organization and sequences of human KIR/ILT gene families. Proc Natl Acad Sci USA 2000; 97:4778–83. [DOI] [PMC free article] [PubMed] [Google Scholar]
- 6. Volz A, Wende H, Laun K et al Genesis of the ILT/LIR/MIR clusters within the human leukocyte receptor complex. Immunol Rev 2001; 181:39–51. [DOI] [PubMed] [Google Scholar]
- 7. Barten R, Torkar M, Haude A et al Divergent and convergent evolution of NK‐cell receptors. Trends Immunol 2001; 22:52–7. [DOI] [PubMed] [Google Scholar]
- 8. Torkar M, Haude A, Milne S et al Arrangement of the ILT gene cluster: a common null allele of the ILT6 gene results from a 6.7‐kbp deletion. Eur J Immunol 2000; 30:3655–62. [DOI] [PubMed] [Google Scholar]
- 9. Jiao Y, Wang L, Gu X et al LILRA3 is associated with benign prostatic hyperplasia risk in a Chinese population. Int J Mol Sci 2013; 14:8832–40. [DOI] [PMC free article] [PubMed] [Google Scholar]
- 10. Xu J, Mo Z, Ye D et al Genome‐wide association study in Chinese men identifies two new prostate cancer risk loci at 9q31.2 and 19q13.4. Nat Genet 2012; 44:1231–5. [DOI] [PMC free article] [PubMed] [Google Scholar]
- 11. Du Y, Su Y, He J et al Impact of the leucocyte immunoglobulin‐like receptor A3 (LILRA3) on susceptibility and subphenotypes of systemic lupus erythematosus and Sjögren’s syndrome. Ann Rheum Dis 2015; 74:2070–5. [DOI] [PubMed] [Google Scholar]
- 12. Torkar M, Norgate Z, Colonna M et al Isotypic variation of novel immunoglobulin‐like transcript/killer cell inhibitory receptor loci in the leukocyte receptor complex. Eur J Immunol 1998; 28:3959–67. [DOI] [PubMed] [Google Scholar]
- 13. Kabalak G, Koch S, Dobberstein B et al Immunoglobulin‐like transcripts as risk genes for autoimmunity. Ann NY Acad Sci 2007; 1110:10–4. [DOI] [PubMed] [Google Scholar]
- 14. Kabalak G, Dobberstein SB, Matthias T et al Association of immunoglobulin‐like transcript 6 deficiency with Sjögren’s syndrome. Arthritis Rheum 2009; 60:2923–5. [DOI] [PubMed] [Google Scholar]
- 15. Ordóñez D, Sánchez AJ, Martínez‐Rodríguez JE et al Multiple sclerosis associates with LILRA3 deletion in Spanish patients. Genes Immun 2009; 10:579–85. [DOI] [PubMed] [Google Scholar]
- 16. Du Y, Cui Y, Liu X et al Contribution of functional LILRA3, but not nonfunctional LILRA3, to sex bias in susceptibility and severity of anti‐citrullinated protein antibody‐positive rheumatoid arthritis. Arthritis Rheumatol 2014; 68:822–30. [DOI] [PubMed] [Google Scholar]
- 17. Koch S, Goedde R, Nigmatova V et al Association of multiple sclerosis with ILT6 deficiency. Genes Immun 2005; 6:445–7. [DOI] [PubMed] [Google Scholar]
- 18. Tedla N, An H, Borges L et al Expression of activating and inhibitory leukocyte immunoglobulin‐like receptors in rheumatoid synovium: correlations to disease activity. Tissue Antigens 2011; 77:305–16. [DOI] [PubMed] [Google Scholar]
- 19. An H, Lim C, Guillemin GJ et al Serum leukocyte immunoglobulin‐like receptor A3 (LILRA3) is increased in patients with multiple sclerosis and is a strong independent indicator of disease severity; 6.7kbp LILRA3 gene deletion is not associated with diseases susceptibility. PLOS ONE 2016; 11:e0149200. [DOI] [PMC free article] [PubMed] [Google Scholar]
- 20. An H, Chandra V, Piraino B et al Soluble LILRA3, a potential natural antiinflammatory protein, is increased in patients with rheumatoid arthritis and is tightly regulated by interleukin 10, tumor necrosis factor‐alpha, and interferon‐gamma. J Rheumatol 2010; 37:1596–606. [DOI] [PubMed] [Google Scholar]
- 21. Low HZ, Reuter S, Topperwien M et al Association of the LILRA3 deletion with B‐NHL and functional characterization of the immunostimulatory molecule. PLOS ONE 2013; 8:e81360. [DOI] [PMC free article] [PubMed] [Google Scholar]
- 22. An H, Brettle M, Lee T et al Soluble LILRA3 promotes neurite outgrowth and synapses formation through a high‐affinity interaction with Nogo 66. J Cell Sci 2016; 129:1198–209. [DOI] [PubMed] [Google Scholar]
- 23. Lee TH, Mitchell A, Liu Lau S et al Glycosylation in a mammalian expression system is critical for the production of functionally active leukocyte immunoglobulin‐like receptor A3 protein. J Biol Chem 2013; 288:32873–85. [DOI] [PMC free article] [PubMed] [Google Scholar]
- 24. Brown D, Trowsdale J, Allen R. The LILR family: modulators of innate and adaptive immune pathways in health and disease. Tissue Antigens 2004; 64:215–25. [DOI] [PubMed] [Google Scholar]
- 25. Kane BA, Bryant KJ, McNeil HP et al Termination of immune activation: an essential component of healthy host immune responses. J Innate Immun 2014; 6:727–38. [DOI] [PMC free article] [PubMed] [Google Scholar]
- 26. Liu C, Xu X, Zhou Y. Association between EGFR polymorphisms and the risk of lung cancer. Int J Clin Exp Pathol 2015; 8:15245–9. [PMC free article] [PubMed] [Google Scholar]
- 27. Liang J, Zhao T, Yang J et al MMP‐9 gene polymorphisms (rs3918242, rs3918254 and rs4810482) and the risk of psoriasis vulgaris: no evidence for associations in a Chinese Han population. Immunol Lett 2015; 168:343–8. [DOI] [PubMed] [Google Scholar]
- 28. Hirayasu K, Ohashi J, Tanaka H et al Evidence for natural selection on leukocyte immunoglobulin‐like receptors for HLA class I in Northeast Asians. Am J Hum Genet 2008; 82:1075–83. [DOI] [PMC free article] [PubMed] [Google Scholar]
- 29. Murphy JE, Tedbury PR, Homer‐Vanniasinkam S et al Biochemistry and cell biology of mammalian scavenger receptors. Atherosclerosis 2005; 182:1–15. [DOI] [PubMed] [Google Scholar]
- 30. Martinez‐Pomares L. The mannose receptor. J Leukoc Biol 2012; 92:1177–86. [DOI] [PubMed] [Google Scholar]
- 31. Jones DC, Kosmoliaptsis V, Apps R et al HLA class I allelic sequence and conformation regulate leukocyte Ig‐like receptor binding. J Immunol 2011; 186:2990–7. [DOI] [PubMed] [Google Scholar]
- 32. Shiroishi M, Tsumoto K, Amano K et al Human inhibitory receptors Ig‐like transcript 2 (ILT2) and ILT4 compete with CD8 for MHC class I binding and bind preferentially to HLA‐G. Proc Natl Acad Sci USA 2003; 100:8856–61. [DOI] [PMC free article] [PubMed] [Google Scholar]
- 33. Willcox BE, Thomas LM, Bjorkman PJ. Crystal structure of HLA‐A2 bound to LIR‐1, a host and viral major histocompatibility complex receptor. Nat Immunol 2003; 4:913–9. [DOI] [PubMed] [Google Scholar]
- 34. Ryu M, Chen Y, Qi J et al LILRA3 binds both classical and non‐classical HLA class I molecules but with reduced affinities compared to LILRB1/LILRB2: structural evidence. PLOS ONE 2011; 6:e19245. [DOI] [PMC free article] [PubMed] [Google Scholar]
- 35. Jones DC, Roghanian A, Brown DP et al Alternative mRNA splicing creates transcripts encoding soluble proteins from most LILR genes. Eur J Immunol 2009; 39:3195–206. [DOI] [PubMed] [Google Scholar]
- 36. Gerhardt T, Ley K. Monocyte trafficking across the vessel wall. Cardiovasc Res 2015; 107:321–30. [DOI] [PMC free article] [PubMed] [Google Scholar]
- 37. Savill J, Hogg N, Ren Y et al Thrombospondin cooperates with CD36 and the vitronectin receptor in macrophage recognition of neutrophils undergoing apoptosis. J Clin Invest 1992; 90:1513–22. [DOI] [PMC free article] [PubMed] [Google Scholar]
- 38. Febbraio M, Hajjar DP, Silverstein RL. CD36: a class B scavenger receptor involved in angiogenesis, atherosclerosis, inflammation, and lipid metabolism. J Clin Invest 2001; 108:785–91. [DOI] [PMC free article] [PubMed] [Google Scholar]
- 39. Greenwalt DE, Lipsky RH, Ockenhouse CF et al Membrane glycoprotein CD36: a review of its roles in adherence, signal transduction, and transfusion medicine. Blood 1992; 80:1105–15. [PubMed] [Google Scholar]
- 40. Furukawa‐Hibi Y, Kobayashi Y, Chen C et al FOXO transcription factors in cell‐cycle regulation and the response to oxidative stress. Antioxid Redox Signal 2005; 7:752–60. [DOI] [PubMed] [Google Scholar]
- 41. Huang H, Tindall DJ. FOXO factors: a matter of life and death. Future Oncol 2006; 2:83–9. [DOI] [PubMed] [Google Scholar]
- 42. Burgering BM, Kops GJ. Cell cycle and death control: long live forkheads. Trends Biochem Sci 2002; 27:352–60. [DOI] [PubMed] [Google Scholar]
- 43. Woods YL, Rena G. Effect of multiple phosphorylation events on the transcription factors FKHR, FKHRL1 and AFX. Biochem Soc Trans 2002; 30:391–7. [DOI] [PubMed] [Google Scholar]
- 44. Kops GJ, de Ruiter ND, De Vries‐Smits AM et al Direct control of the forkhead transcription factor AFX by protein kinase B. Nature 1999; 398:630–4. [DOI] [PubMed] [Google Scholar]
- 45. Yang JY, Zong CS, Xia W et al ERK promotes tumorigenesis by inhibiting FOXO3a via MDM2‐mediated degradation. Nat Cell Biol 2008; 10:138–48. [DOI] [PMC free article] [PubMed] [Google Scholar]
- 46. Cardone MH, Roy N, Stennicke HR et al Regulation of cell death protease caspase‐9 by phosphorylation. Science 1998; 282:1318–21. [DOI] [PubMed] [Google Scholar]
- 47. Zhang X, Tang N, Hadden TJ et al Akt, FoxO and regulation of apoptosis. Biochim Biophys Acta 2011; 1813:1978–86. [DOI] [PubMed] [Google Scholar]
- 48. Brunet A, Bonni A, Zigmond MJ et al Akt promotes cell survival by phosphorylating and inhibiting a Forkhead transcription factor. Cell 1999; 96:857–68. [DOI] [PubMed] [Google Scholar]
Associated Data
This section collects any data citations, data availability statements, or supplementary materials included in this article.
Supplementary Materials
Fig. S1. Agarose gel electrophoresis analysis of LILRA3 PCR products. M: 100 bp DNA molecular marker; −/−: homozygous mutant genotype with 6.7‐kb deletion in both alleles (166 bp); +/−: heterozygous genotype with a single intact (250 bp) and a single mutant allele (166 bp); +/+: homozygous wild type genotype with intact gene in both alleles (250 bp).
Fig. S2. (A and B) Western blot of p‐P65, P65, p‐SAPK/JNK, JNK2, p‐mTOR, mTOR in LILRA3‐overexpressing U937 cells (OE) and null vector cells (NV). (C and D) Western blot analysis of p‐P65, P65, p‐SAPK/JNK and JNK2, p‐mTOR and mTOR protein in LILRA3 over‐expressing cells and null vector cells.
Table S1. Demographic and sub‐phenotype data of IBD patients and controls.
Table S2. Sequence of primers and probes.
Table S3. PCR components detecting 6.7‐kb deletion, rs103294 and rs410852 genotype.
Table S4. LDR components detecting rs103294 and rs410852 genotype.
Table S5. Antibodies used in our manuscript.
Data Availability Statement
Data openly available in a public repository that issues datasets with DOIs.