Galectin‐10 secretion by eosinophils
Keywords: eosinophils, extracellular traps, galectin‐10, human, immune synapses
Summary
Galectin‐10 is involved in the T cell suppressive activity of regulatory T cells and eosinophils alike. We have identified a subpopulation of T cell suppressive eosinophils that express CD16 on the surface and contain more galectin‐10 compared with conventional CD16‐negative eosinophils. Our main goal was to determine how the intracellular protein galectin‐10 is released from eosinophils when exposed to proliferating T cells and if such release could be inhibited. Confocal microscopy and imaging flow cytometry were used to study the release of galectin‐10 from eosinophils incubated with polyclonally activated T cells. T cell proliferation was monitored by measurement of the incorporation of [3H]‐thymidine. Initially, galectin‐10‐containing synapses formed between eosinophils and T cells. Subsequently, the plasma membrane of eosinophils began to disintegrate and cap‐like accumulations of galectin‐10 budded on the eosinophil cell surface. Lastly, eosinophil extracellular traps composed of nuclear DNA and galectin‐10 were freed. It was solely the CD16‐expressing suppressive eosinophils that formed synapses and eosinophil extracellular traps containing galectin‐10. Dissolution of the extracellular traps by DNase I partly abrogated the T cell suppression exerted by eosinophils. Extracellular trap formation has mainly been associated with anti‐bacterial defense, but we show a new putative function of these cellular formations, as mediators of T cell suppression by enabling the release of galectin‐10 from eosinophils.
Introduction
Eosinophilic granulocytes are involved in a range of allergic and other inflammatory conditions that are driven by T cells, such as atopic dermatitis, allergic rhinitis and asthma [1], eosinophilic esophagitis [2], chronic graft‐versus‐host disease [3], bullous pemphigoid [4] and Churg–Strauss syndrome [5]. The roles of eosinophils in these conditions have not been precisely defined, but recently it has become evident that eosinophils can regulate the function of T cells [6, 7, 8, 9, 10]. We have previously shown that eosinophils from hematopoietic stem cell transplant recipients with chronic graft‐versus‐host disease [11] and patients with eosinophilic esophagitis [12] can suppress the proliferation of polyclonally activated T cells. Both groups of patients showed up‐regulated production of galectin‐10 [11, 12], a protein that mediates the T cell‐suppressive function of regulatory T cells (Tregs) [13]. We have shown that the galectin‐10 of eosinophils also has T cell‐suppressive capacity [10]. Furthermore, we have identified a subgroup of eosinophils that express both CD16 and high levels of galectin‐10, which are more potent T cell suppressors than conventional eosinophils. We have also found that conventional eosinophils up‐regulate CD16 during co‐culture with T cells [10]. Lastly, we have demonstrated that cell–cell contact is required for eosinophils to be able to suppress the proliferation of T cells [11].
Galectin‐10 is one of the most abundant proteins of human eosinophils, but is not found in murine eosinophils [14]. It is located in the primary, but not in the secondary, granules of eosinophils, and is diffusely spread in the cytoplasm and the nucleus of the cells [15, 16]. Contrary to the other members of the galectin family that bind galactosides, galectin‐10 binds weakly to mannose‐containing ligands [17]. Kubach and co‐workers showed by the siRNA technique that galectin‐10 was required for the T cell‐suppressive function of Tregs, but were unable to neutralize galectin‐10’s suppressive effect by the administration of antibodies [13]. In contrast, we were able to revert part of the eosinophil‐mediated suppression of T cells by administration of neutralizing antibodies, which suggested that some of the galectin‐10‐mediated T cell suppressive activity of eosinophils occurred extracellularly [10]. Further, purified recombinant galectin‐10 could partly suppress T cell proliferation on its own [10].
Although release of galectin‐10 from eosinophils has never been demonstrated under physiological conditions, it must be assumed that this occurs. Like the other galectins, galectin‐10 lacks signal peptide sequences, which indicates that the protein is not secreted via traditional secretory pathways [18]. It has previously been shown that galectin‐10 is not secreted by vesicular transport, exocytosis of entire primary granules or via partial secretion of the contents of primary granules, so‐called piecemeal degranulation [19]. However, deposits of galectin‐10 (also named Charcot–Leyden crystals) have been demonstrated in the liver of parasite‐infested patients [20] in the bone marrow of patients with leukemia [21], in the nasal lavage fluid of asthmatic patients [22] and in the skin of patients with hypereosinophilic syndrome [16], suggesting that the protein is released from eosinophils under certain circumstances.
A recently identified mechanism by which eosinophils can release their cytoplasmic contents is via the formation of ‘eosinophil extracellular traps’ (EETs) [23, 24]. These structures can be either released from live eosinophils within seconds [23] or as part of a slower process that results in the death of the eosinophils by cytolysis, also called EETosis [24]. The rapidly formed EETs are composed of mitochondrial DNA nets and contain cationic proteins that are normally stored within the cytoplasmic secondary granules of eosinophils such as eosinophilic cationic protein and eosinophil peroxidase [23]. The slowly formed EETs consist of histone‐rich nuclear DNA and lack free cationic proteins; instead, entire granules or clusters of granules containing cationic proteins seem to be shed simultaneously from the dying cells [24]. Recently, it was reported that galectin‐10 crystal formation was associated with EETosis when eosinophils were stimulated in vitro with calcium ionophores or phorbol myristate acetate (PMA) [25]. In addition, a newly published paper by Lambrecht et al. demonstrated EETs containing galectin‐10 in the nasyl polyps of patients suffering from chronic rhinosinusitis [26].
The aim of the current study was to investigate if, and by which mechanisms, galectin‐10 is released from eosinophils exposed to proliferating T cells, and if it would be possible to abrogate eosinophil‐mediated T cell suppression by interfering with galectin‐10 release.
Materials and methods
Blood samples
Twenty‐nine healthy adult individuals were enrolled into the study. Participants donated heparin anti‐coagulated blood for isolation of eosinophils, peripheral blood mononuclear cells (PBMC) and T cells for co‐culture experiments. The study was approved by the Regional Ethical Review Board of Gothenburg, Sweden.
Eosinophil purification
Eosinophils were freshly isolated from heparinized venous blood samples by negative immunomagnetic depletion using anti‐CD3, ‐CD14, ‐CD16 and ‐CD19 monoclonal antibodies (mAbs), as previously described [27]. Eosinophil preparations were ≥ 98% pure, as determined by Diff Quik staining (Polysciences Europe GmbH, Eppelheim, Germany), with 99% viability according to trypan blue staining. The eosinophils were used directly for co‐culture assays in phenol red‐free and serum‐free X‐VIVO 15 buffer supplemented with gentamicin (Lonza, Basel, Switzerland).
Confocal microscopy
Eosinophils (100 000 cells) and T cells (300 000 cells) purified using the Pan T Cell Isolation Kit (Miltenyi Biotec, Bergisch Gladbach, Germany) were placed on microscopic slides and analyzed at 0, 30, 60 and 120 min. T cells were preincubated with anti‐CD3 mAb (clone OKT3, 1 µg/ml; eBioscience, San Diego, CA, USA) followed by anti‐CD28 mAb (clone CD28.2, 2 µg/ml; eBioscience) or sham‐incubated with medium for 30 min before the addition of eosinophils. Eosinophil/T cell co‐cultures were stained with CD16 polyclonal antibody conjugated to Alexa Fluor 555 (catalog number: bs‐6028R‐AF555; Nordic Biosite, Stockholm, Sweden) or an isotype control conjugated to AF555 (catalog number: bs‐0295P‐AF555, polyclonal antibody; Nordic Biosite). Cells were washed and fixed [eBioscience forkhead box protein 3 (FoxP3)/transcription factor staining buffer set; ThermoFisher, Waltham. MA, USA] followed by staining with phalloidin conjugated to Alexa Fluor 488 (ThermoFisher), galectin‐10 mAb (clone B‐F42; Diaclone, Besançon, France) conjugated in‐house with allophycocyanin (APC) (Lynx rapid APC antibody conjugation kit; Bio‐Rad, Hercules, CA, USA), nuclear stain Hoechst 34580 (Life Technologies, Carlsbad, CA, USA) and a mAb against human histone H3 conjugated to AF555 (clone 17H2L9; ThermoFisher, Fremont, CA, USA) and isotype control conjugated to APC (clone MOPC‐21; BD Biosciences, San Jose, CA, USA). Confocal immunofluorescence microscopy (Zeiss LSM700; Carl Zeiss AG, Oberkochen, Germany) analysis was used to visualize cells and EETs and analyzed with the zen software (Carl Zeiss AG). Quantification of cellular events was performed manually by counting a total of 149 microscopic fields (×40 and ×63) of eosinophil–T cell co‐cultures derived from seven different subjects and converted to number of events per 1000 eosinophils. For example, enumeration of 60 eosinophils and 15 EETs in one slide results in 250 EETs/1000 eosinophils (15/60 × 1000 = 250).
Imaging flow cytometry
Cells from 24‐h‐old eosinophil–PBMC co‐cultures were fixated (eBioscience FoxP3/transcription factor staining buffer set; ThermoFisher) and incubated with galectin‐10 mAb conjugated to APC, the DNA stain 4′,6‐diamidino‐2‐phenylindole (DAPI) (140 nM), anti‐histone mAb (clone H11‐4, specific for histones H1, H2A, H2B, H3 and H4; Merck, Darmstadt, Germany) followed by anti‐mouse immunoglobulin (Ig)G1 conjugated to phycoerythrin (PE) (BD Biosciences), phalloidin conjugated to Alexa Fluor 488, CCR3 mAb conjugated to PE (clone 5E8), CD4 mAb conjugated to FITC (clone L200) or CD8 mAb conjugated to FITC (clone RPA‐T8), all from BD Biosciences. One thousand events corresponding to eosinophils were collected in the imaging flow cytometer (Image Stream X Mk II; Amnis, Seattle, WA, USA) and analyzed with ideas software version 6.0. The frequency of synapse formation between CD4+ T cells and eosinophils and between CD8+ T cells and eosinophils during co‐cultures was estimated by gating for cell doublets composed of cells positive for either CD4 or CD8 together with cells expressing C‐C chemokine receptor type 3 (CCR3). The correct identification of CCR3‐expressing cells as eosinophils and of CD4+ and CD8+ cells as T cells was verified by visualization of nuclear morphology.
Eosinophil co‐cultures with CD3/CD28‐stimulated T cells
PBMC (105 cells) were added to anti‐CD3 mAb‐coated (clone OKT3, 1 µg/ml; eBioscience, San Diego, CA, USA) 96‐well microplate plates (TPP, Trasadingen, Switzerland) followed by anti‐CD28 mAb (clone CD28.2, 2 µg/ml; eBioscience). Three h later, eosinophils (105 cells) were added. The cell cultures were incubated for 2 days at 37°C, the time required to detect the T cell suppressive function of eosinophils. For blocking experiments, DNase I (10 units, catalog number D5025; Sigma Aldrich, St Louis, MO, USA) was added simultaneously with the eosinophils. When DNase I (5 units) was combined with anti‐galectin‐10 mAb (16 µg/ml, clone B‐F42; Diaclone/Nordic Biosite), a ratio of 105 PBMC to 104 eosinophils was used. To evaluate cellular proliferation, [3H]‐thymidine (1 µCi/well) was added on the second day of culture. After 6 h, the cells were harvested onto glass fiber filters. Incorporated [3H]‐thymidine was detected using a β‐counter and quantified as counts per minute (cpm). To calculate the degree of inhibition of T cell proliferation in cultures with and without added DNase I, the following algorithm was used: [1 cpm (T cells + eosinophils)/cpm (T cells) × 100] compared with [1‐cpm (T cells + eosinophils + DNase I)/cpm (T cells + DNase I) × 100]. For determination of viability, the cells were stained with PE‐conjugated with annexin V (cat. no 556422, PE; BD Biosciences) and 7‐amino‐actinomycin D (7AAD (cat. no 559925; BD Biosciences). All reagents were azide‐free.
DNA quantification
Double‐stranded DNA was quantified in supernatants from PBMC–eosinophil co‐cultures incubated with or without DNase I, using the Picogreen dsDNA Assay Kit (Thermo Fisher), according to the manufacturer’s instructions. The assay was performed in 96‐well plates at an excitation of 485 nm and recorded at an emission of 540 using the microplate reader CLARIOstar (BMG Labtech, Ortenberg, Germany).
Statistical methods
Wilcoxon’s paired test was employed to determine the statistical significance when comparing two groups, the analysis of variance (anova) Kruskal–Wallis test for comparison of three groups and the Friedman multiple comparison test for paired samples, using the GraphPad Prism version 7.0 software (GraphPad, San Diego, CA, USA). A P‐value < 0·05 was considered statistically significant.
The data sets used during the current study are available from the corresponding author upon request
Results
Galectin‐10 is released from eosinophils exposed to proliferating T cells via synapses and EETs
Eosinophils were added to T cells that had been allowed to proliferate for 30 min after cross‐linking of CD3 and CD28, and the cells were analyzed after 30, 60 and 120 min of co‐incubation for release of galectin‐10 from the eosinophils. At the start of the co‐cultures, eosinophils were seen as relatively large cells with evenly distributed intracellular galectin‐10 (red) and a bilobed nucleus (blue), whereas the T cells were smaller with a rounded nucleus (Fig. 1a). Both cell types had intact cell borders that were stained green by phalloidin, which binds to activated cortical and cytoskeletal actin (Fig. 1a). After 30 min co‐incubation, immune synapse formation between eosinophils and T cells was already seen, as well as a few eosinophils that displayed cap‐like accumulation of galectin‐10 on the cell surface (Fig. 1b). After 60 min, eosinophils with dissolved cortical actin borders and a few EETs composed of DNA strands (blue) and galectin‐10 (red) began to be observed (Fig. 1c). At this time‐point, more eosinophils with cap‐like deposits of galectin‐10 were seen (Fig. 1c). Finally, after 120 min co‐culture, there was massive release of EETs (Fig. 1d). None of the described processes, e.g. immune synapse formation, cap‐like accumulation of galectin‐10 on the surface of eosinophils, dissolved actin or release of galectin‐10‐containing EETs were seen when eosinophils were incubated with unstimulated T cells (data not shown). Isotype controls were used to monitor background staining (data not shown). To ascertain that eosinophils did not undergo spontaneous cell death, the viability of eosinophils cultured alone for 120 min was determined and found to be 95% (min/max = 93–99, n = 4), as determined by staining with 7AAD and annexin V.
Fig. 1.
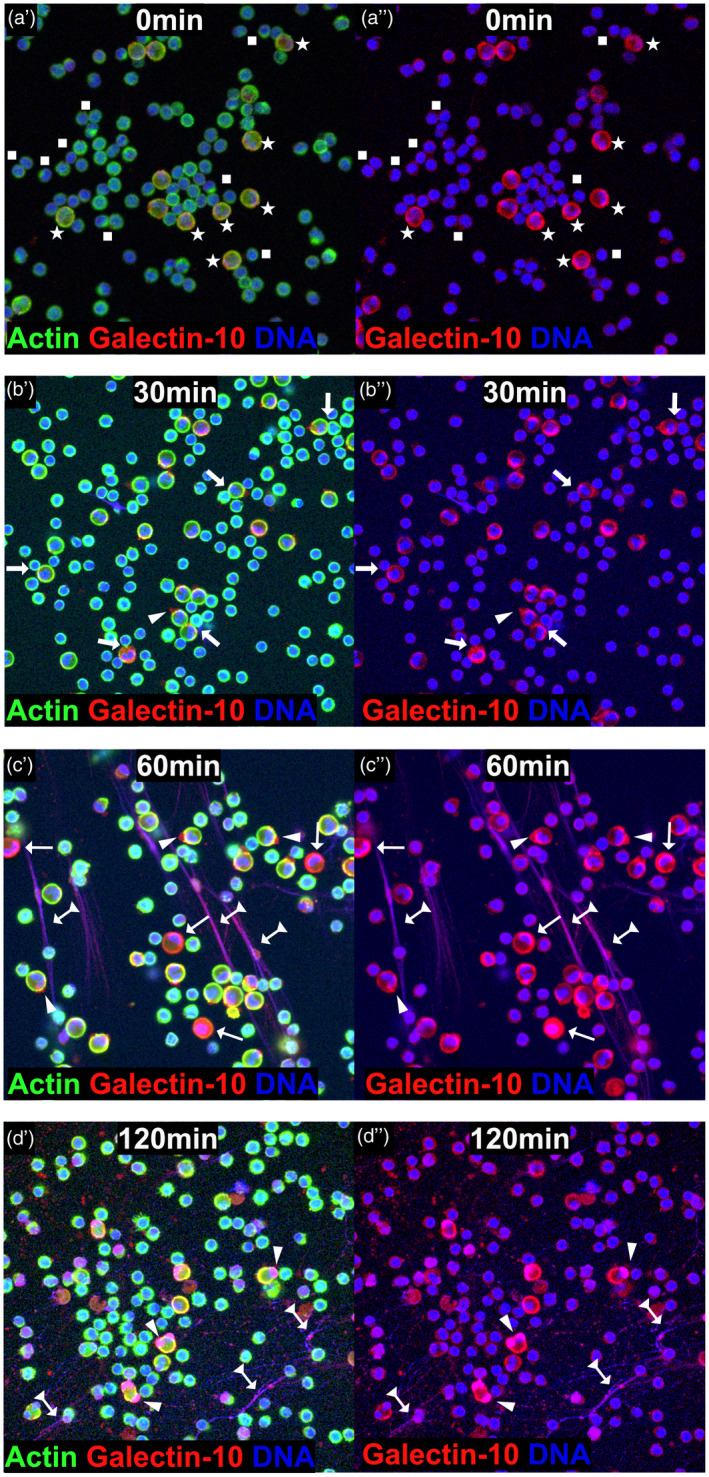
Cellular events resulting in the release of galectin‐10 from eosinophils exposed to proliferating T cells. Panels labelled by a single prime (′) show staining for actin, galectin‐10 and DNA and those labelled with a double prime (″) show staining for galectin‐10 and DNA. (a) At the start of the co‐cultures, T cells (indicated by squares) were seen as small cells with blue nuclei and green borders (cortical actin cytoskeleton), while eosinophils (indicated by stars) were seen as larger cells with multi‐lobed blue nuclei and yellowish borders due to merged actin (green) and galectin‐10 (red) stains. Cell nuclei and DNA were stained blue by Hoechst 34580, cell borders and cytoskeleton were stained green by phalloidin that binds activated actin and galectin‐10 was stained red by allophycocyanin (APC)‐labelled monoclonal antibodies (mAb). (b) Immune synapses between T cells and eosinophils (arrow) and cap‐like accumulation of galectin‐10 on the surface of eosinophils (arrowheads) developed after 30 min co‐culture. (c) Increased numbers of galectin‐10 caps (arrowheads) were seen after 60 min incubation. Eosinophils with dissolved actin cytoskeleton (cortical as well as cytoplasmic) also began to appear (thin arrows), as well as a few eosinophil extracellular traps composed of DNA and galectin‐10 (arrows with triangle tails). (d) Massive release of eosinophil extracellular traps composed of DNA and galectin‐10 was apparent after 120 min co‐culture (arrows with triangle tails) and galectin‐10 caps (arrowheads) was also observed. Representative images based on seven experiments.
Quantification of and sequence of events leading to galectin‐10 release
In an attempt to quantify and determine the sequence of the events leading up to the release of galectin‐10 from eosinophils exposed to proliferating T cells, 149 microscopic fields were analyzed and manually counted in a blinded manner (Fig. 2a–d). The earliest event was the formation of galectin‐10‐containing synapses, where it was common for one eosinophil to form close contact with two or more T cells (Fig. 2a). Over time, synapse formation became a rarer happening (Fig. 2a). The cap‐like accumulation of galectin‐10 was also an early event, which increased in frequency with time (Fig. 2b). Intriguingly, the galectin‐10 caps did not accumulate randomly, but were always located in front of the eosinophils’ nuclear lobes (Fig. 2b). After 60 min, eosinophils with dissolved cortical and cytoskeletal actin began to appear, and were seen even more frequently after 120 min (Fig. 2c). The final event was massive release of EETs saturated with galectin‐10; a few of these formations were evident after 60 min co‐incubation, but increased markedly in frequency after 2 h of co‐culture (Fig. 2d).
Fig. 2.
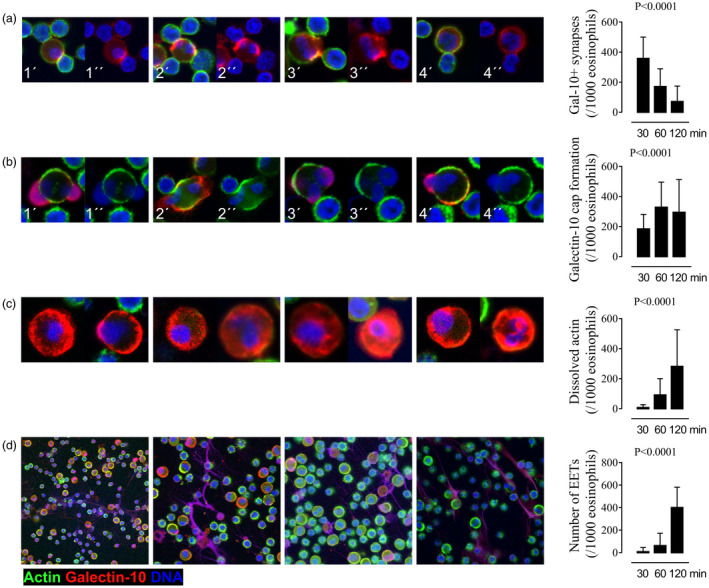
Kinetics of the cellular events resulting in the release of galectin‐10 from eosinophils exposed to proliferating T cells. The frequencies of immune synapse formation between T cells and eosinophils, galectin‐10 cap formation on the surface of eosinophils, cytoskeletal actin dissolution displayed by eosinophils, and galectin‐10‐containing eosinophil extracellular traps (EETs) were enumerated manually by studying confocal images after 30, 60 and 120 min eosinophil T cell co‐culture. (a) Synapses formed early between T cell and eosinophils. Four representative cell clusters are shown with the synapses between the larger eosinophils and the smaller T cells displaying an accumulation of galectin‐10 (red) and of actin (seen as yellow because of merged green actin stain with red galectin‐10 stain) after 30 min. (b) Eosinophils with protruding nuclear lobes (blue) capped with massive accumulation of galectin‐10 (red) began to show after 30 min and increased over time. Four representative images are shown after 60 min. (c) Eosinophils whose cytoskeleton had dissolved (no cortical nor cytoplasmic staining of activated actin visible by green stain) and with resulting diffuse dispersion of galectin in the cytoplasm (red) increased with time. Eight representative images after 120 min are shown. (d) Massive release of eosinophil extracellular traps containing DNA (blue) and galectin‐10 (red) was the last cellular event to appear after 120 min, seen as purple webs. Enumeration and kinetics of the cellular events are depicted in the graphs in the right‐hand column and denoted per 1000 eosinophils (n = 7 experiments). Panels labelled by a single prime (′) show staining for actin, DNA and galectin‐10, and those labelled with a double prime (″) show staining for DNA and galectin‐10 in (a) and staining for DNA and actin in (b). (c,d) All figures show staining for actin, DNA and galectin‐10. Bars represent mean value with standard deviations (s.d.). Analysis of variance (anova) Kruskal–Wallis test.
Rapid cessation of T cell proliferation upon incubation of eosinophils with proliferating T cells
Purified T cells were polyclonally activated by CD3/CD28 cross‐linking and then incubated with purified eosinophils or sham‐incubated with medium. Large blast‐like cells that we suspected were proliferating T cells were prominent in the eosinophil/T cell co‐cultures after 30 min, but had virtually disappeared after 60 min (Fig. 3a). In contrast, proliferating T cell blasts were seen at all the studied time‐points among the polyclonally activated T cells that had been incubated in the absence of eosinophils (Fig. 3b). Occasional galectin‐10+ T cells believed to be Treg cells were seen (Fig. 3b, split tail arrow); however, these were so few that it is unlikely that they had a major contribution to the observed T cell suppression. Enumeration of T cell blasts in cultures performed with and without eosinophils revealed an inverse relationship, such that T cell blast numbers decreased over time in the presence of eosinophils and increased in the absence of eosinophils (Fig. 3c,d).
Fig. 3.
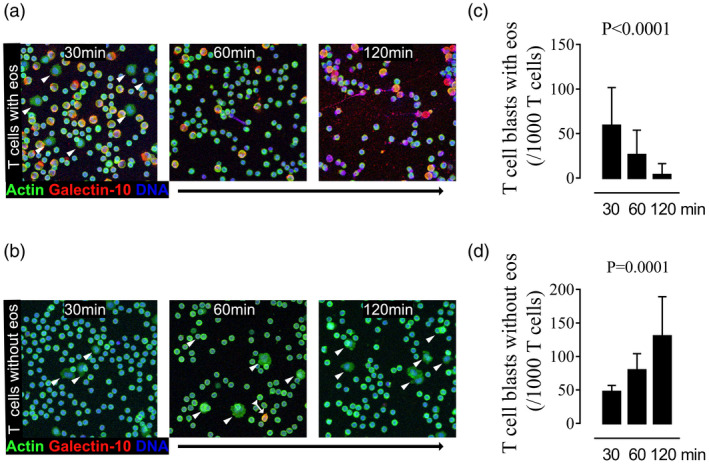
Rapid cessation of T cell proliferation upon incubation of eosinophils with proliferating T cells. Purified T cells pre‐activated by CD3/CD28 cross‐linking for 30 min were allowed to proliferate in the (a) presence or (b) absence of eosinophils for 30, 60 and 120 min, respectively, and analyzed by confocal microscopy. Representative images of cell nuclei and DNA stained blue, galectin‐10 in red and actin in green are shown. Whereas proliferating T cells in the expansion phase (arrowheads) were only seen during the first 30 min when T cells were incubated with eosinophils (a), T cells in the expansion phase were apparent at all studied time‐points when T cells were cultured in the absence of eosinophils (b). A single galectin‐10‐expressing regulatory T cell is seen in (b), shown at 60 min (arrow with triangle tail). Enumeration and kinetics of the frequencies of proliferating T cells are shown in the right‐hand column, based on seven experiments. The graph shows the number of T cell blasts per 1000 T cells after 30, 60 and 120 min co‐culture (c) with and (d) without eosinophils. Bars represent mean value with standard deviation. Analysis of variance (anova) Kruskal–Wallis test.
CD16+ eosinophils are responsible for galectin‐10 release
Next, we examined if it was the suppressive eosinophils (CD16+), conventional eosinophils (CD16−) or both that released galectin‐10. It should be emphasized that no CD16‐expressing eosinophils were present at the start of the co‐cultures, as eosinophils were purified from blood by negative immune depletion of CD16‐expressing cells in order to separate them from neutrophils. Indeed, it was the CD16‐expressing eosinophils that formed immune synapses (Fig. 4a), galectin‐10 containing caps (Fig. 4b), had dissolved actin (Fig. 4c) and released galectin‐10‐containing EETs (Fig. 4d). The majority of the eosinophils had up‐regulated their expression of CD16 by 30 min co‐culture with activated T cells, and this was maintained in the 60‐ and 120‐min co‐cultures (Supporting information, Fig. S1a–e). Enumeration of the cellular events performed by CD16+ eosinophils is presented in Supporting information, Fig. S2a–d. A previous attempt to block CD16 with antibodies had no neutralizing effect on the capacity of eosinophils to suppress T cell proliferation [10]. Isotype controls were used to rule out the possibility of unspecific binding of anti‐CD16 antibodies and anti‐galectin‐10 antibodies, which did not give rise to any fluorescent signal (Fig. 4e, Supporting information, Fig. S1d,e).
Fig. 4.
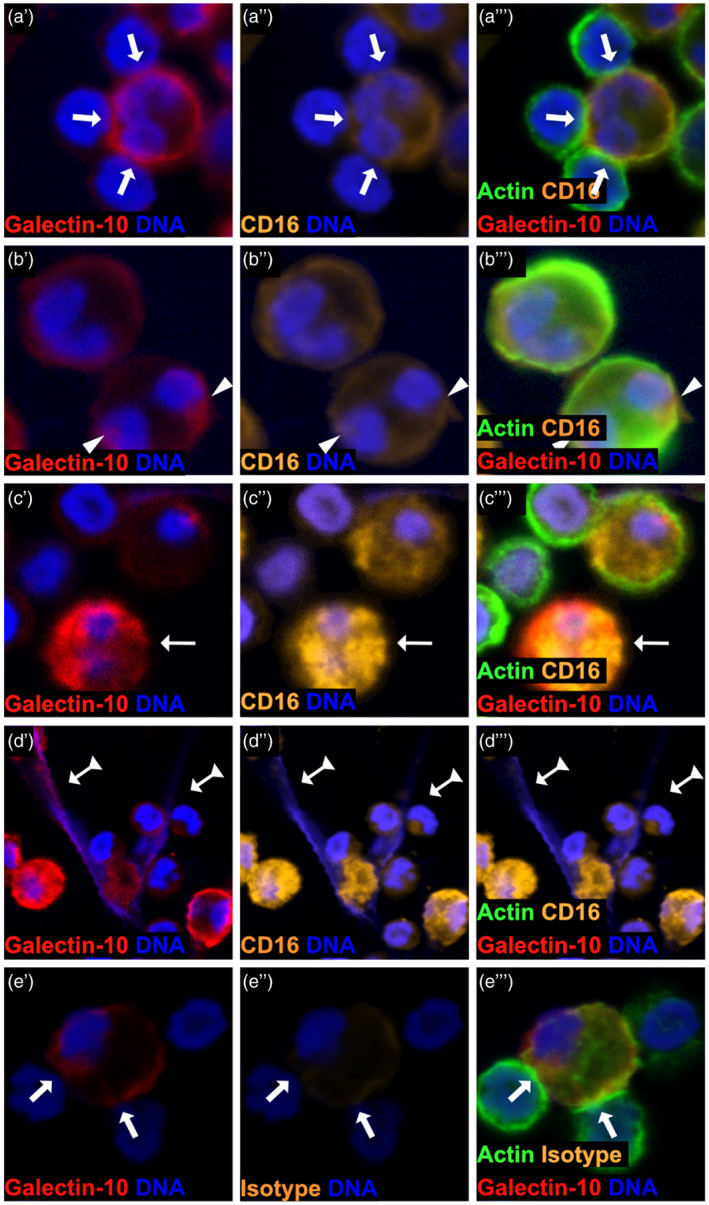
Suppressive CD16+eosinophils are responsible for immune synapse formation with T cells and release of galectin‐10‐containing eosinophil extracellular traps (EETs). Confocal microscopy analyses revealed that it was solely CD16‐expressing eosinophils that (a) formed synapses (arrows) with proliferating T cells, (b) displayed cap‐like accumulation of galectin‐10 on the cell surface (arrowhead), (c) had dissolved cytoskeleton, discerned as a complete lack of cortical cytoskeleton (no green cell border, thin arrows) and concomitant diffuse cytoplasmic dispersion of galectin‐10 and (d) generated extracellular traps (arrows with triangle tails). Representative images of cells are shown stained orange for CD16, green for actin, red for galectin‐10 and blue for DNA. (e) Eosinophils forming synapses (arrows) with proliferating T cells stained for galectin‐10, DNA, actin and a CD16 isotype control. Panels labelled by a single prime (′) show staining for galectin‐10 and DNA, figures labelled by a double prime (″) show staining for CD16/isotype control and DNA and those labelled with a triple prime (′′′) show staining for actin, CD16/isotype control, galectin‐10 and DNA.
Eosinophils form galectin‐10‐containing synapses with CD4+ and with CD8+ T cells
Next, we determined if eosinophils preferentially formed synapses with CD4+ T cells, CD8+ T cells or both. Imaging flow cytometry was used to select and gate for cell doublets containing eosinophils attached to CD4+ or CD8+ T cells in cell suspensions after 48 h co‐culture. A total of 15 000 cellular events were collected, of which approximately 10% were found to be doublets. Among the doublets, 208 events were composed of CCR3+/CD8+ doublets and 189 events of CCR3+/CD4+ doublets. Each doublet was next visualized morphologically, and after discarding debris and doubtful images, 89 verified events composed of CD8+ T cells interacting with eosinophils and 85 events composed of CD4+ T cells interacting with eosinophils remained (Fig. 5).
Fig. 5.
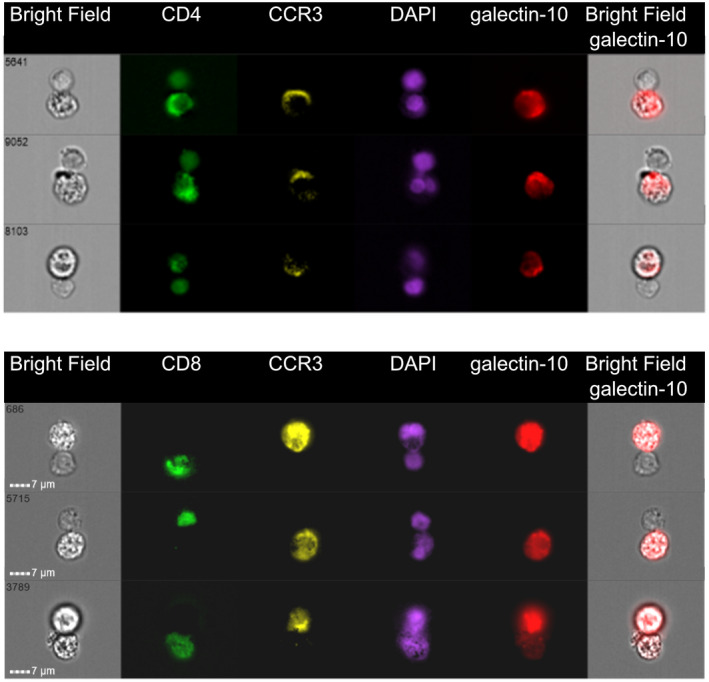
Eosinophils form synapses with polyclonally activated CD4+and CD8+T cells. Imaging flow cytometry pictures of eosinophils co‐cultured with CD3/CD28‐activated peripheral blood mononuclear cells (PBMC) for 2 days. Three representative images of CD4+T cells (upper panel) and three representative images of CD8+T cells (lower panel) forming synapses with eosinophils are shown. Bright‐field (BF) images and images stained for CD4 (upper figure, green), CD8 (lower figure, green), CCR3 (yellow), DNA [4′,6‐diamidino‐2‐phenylindole (DAPI), purple] and galectin‐10 (red) and overlay BF images with galectin‐10 are shown. Eosinophils can up‐regulate CD4 upon activation [33].
Galectin‐10 is secreted via nuclear EETs
Using imaging flow cytometry, it was possible to more closely inspect the EETs released by eosinophils exposed to proliferating T cells. As EETs began to appear after 1–2 h, we chose to stain for histones to ascertain that the galectin‐10‐containing EETs were composed of nuclear DNA. One‐day‐old co‐cultures of eosinophils with polyclonally activated T cells were stained with mAb directed against histones, and it was clearly seen that eosinophils released EETs that were enriched for nuclear DNA (Fig. 6a). To confirm this, the co‐cultures were stained simultaneously for DNA, histone and galectin‐10. After 120 min of incubation, histone‐rich EETs could be observed (Fig. 6b,c). To ascertain that no unspecific binding occurred, an isotype control was used which did not give any fluorescent signal.
Fig. 6.
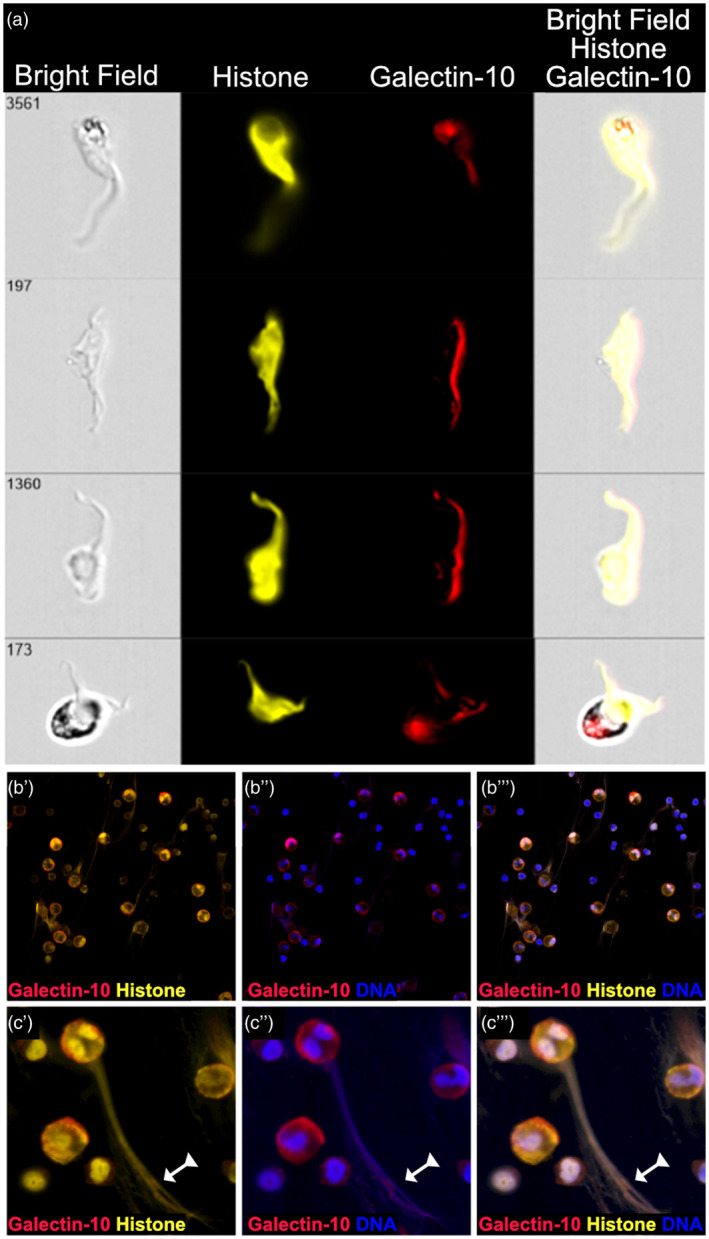
Eosinophil extracellular traps (EET) evoked by proliferating T cells contain nuclear DNA. (a) Four representative imaging flow cytometry pictures of EETs generated by eosinophils co‐cultured with CD3/CD28‐activated peripheral blood mononuclear cells (PBMC) for 1 day are shown. The EETs were stained for histones (yellow), which are associated with nuclear but not mitochondrial DNA, and for galectin‐10 (red). Bright‐field and overlay images are shown. (b) Confocal microscopy images at ×40 magnification show that EETs composed of histone (yellow) and DNA (blue) are saturated with galectin‐10 (red). (c) A large magnification of an eosinophil that has released an EET composed of histones, DNA and galectin‐10 (arrow with triangle tail). Panels labelled by a single prime (′) show staining for galectin‐10 and histone, figures labelled by a double prime (′′) show staining for galectin‐10 and DNA and those labelled with a tripple prime (′′′) show staining for galectin‐10, histone and DNA.
Blockade of EETs and galectin‐10
Finally, we tried to stop the formation of EETs by adding DNase I to the eosinophil–T cell co‐cultures. A clearly reduced amount of EETs was seen after addition of DNase I (Fig. 7a) compared to when DNase I was not added (Fig. 7b). Eosinophils in the absence of DNase I suppressed T cell proliferation by 95% (min/max = 64–99%). After addition of DNase I their suppressive capacity decreased to 84% (min/max = 59–95%); i.e. DNase I decreased the ability of the eosinophils to suppress T cell proliferation by 11% (Fig. 7c). Next, we evaluated if the suppressive capacity of the eosinophils could be reduced even further when combining DNase I and anti‐galectin‐10 mAb. As eosinophils contain massive amounts of galectin‐10, we reduced the number of eosinophils in these experiments such that a ratio of 1 T cell : 0·1 eosinophils was used in the co‐cultures, to optimize our ability to neutralize released galectin‐10. Although an enhanced reversion of the suppressive capacity of eosinophils by the combination of DNase I and anti‐galectin‐10 mAb was seen, this did not reach statistical significance: eosinophils in the absence of DNase I and anti‐galectin‐10 suppressed T cell proliferation by 30% (min/max = 18–46%), whereas the combination of DNase I and anti‐galectin‐10 reverted half the suppressive capacity, which decreased to 14% (min/max = 0–18%) (Fig. 7d). Lastly, we assessed the amount of free DNA released into the supernatants of eosinophil–T cell cultures as a correlate of the quantity of released EETs. Four times more DNA was detected in eosinophil–T cell co‐cultures (792 ng/ml, min/max = 506–1064, n = 4) compared with when T cells were cultured alone (181 ng/ml, min/max = 174–366, − = 4). As expected, the amount of free DNA was much reduced when eosinophils and T cells were co‐cultured with DNase I (89 ng/ml, min/max = 42–121) (Fig. 7e). Cellular viability was maintained in the eosinophil–T cell co‐cultures as determined by staining with 7AAD and annexin V. After 2 days of co‐culture, an average of 79% (min/max = 71–84, n = 4) of eosinophils and 79% (min/max = 73–85, n = 4) of T cells were still viable. The addition of DNase I had no negative impact on T cell viability: it was 92% (min/max = 90–96, n = 4) with DNase I, 85% (min/max = 79–93, n = 4) with eosinophils and DNase I, and 89% (min/max = 85–95) when T cells were cultured alone (Supporting information, Fig. S3).
Fig. 7.
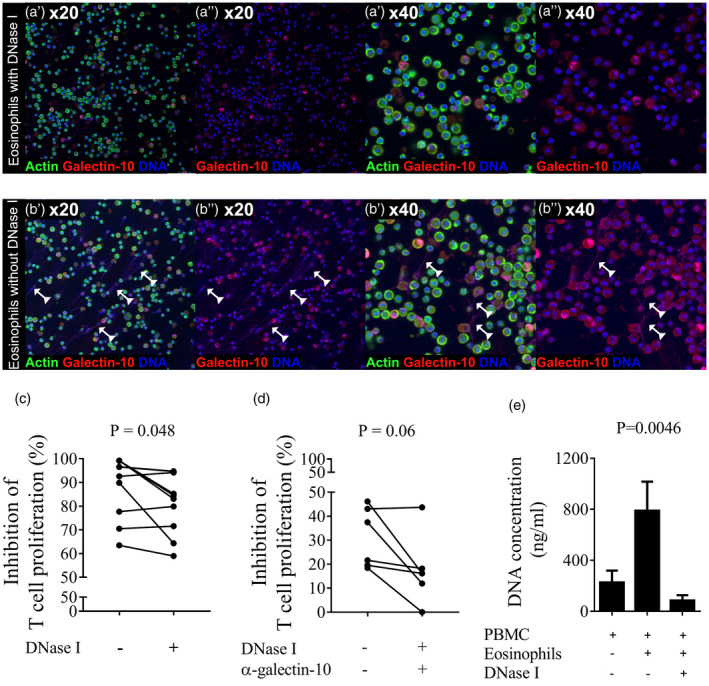
The suppressive capacity of eosinophils decreased when eosinophil extracellular trap (EET) formation was reduced. The ability of eosinophils to suppress T cell proliferation was evaluated by their co‐culture with CD3/CD28‐activated T cells with or without DNase I. EET formation was studied by using confocal microscopy and suppressed T cell proliferation was analyzed by measuring the incorporation of tritiated thymidine. (a) Confocal microscopy images at ×20 and ×40 magnification show no or few EETs in images of the eosinophil–T cell cultures supplemented with DNase I, images show DNA in blue and galectin‐10 in red. Panels labelled by a single prime (′) show staining for actin, galectin‐10 and DNA and those labelled with a double prime (′′) show staining for galectin‐10 and DNA. (b) EETs composed of DNA (blue) and galectin‐10 (red) were abundant in the eosinophil–T cell cultures when no DNase I was added. (c) The capacity of eosinophils to suppress the proliferation of CD3/CD28‐activated T cells decreased when EET formation was reduced by the addition of DNase I. An eosinophil to peripheral blood mononuclear cells (PBMC) ratio of 1 : 1 was used. Results from 48 h co‐cultures are depicted. Wilcoxon’s matched‐pairs signed‐rank test (n = 10). Bars represent mean value with standard deviation (s.d.). (d) The capacity of eosinophils to suppress the proliferation of CD3/CD28‐activated T cells further decreased when EET formation and galectin‐10 release was reduced by the combined addition of DNase I and anti‐galectin‐10 monoclonal antibody (mAb). An eosinophil to PBMC ratio of 1 : 10 was used. Results from 48‐h co‐cultures are depicted. Bars represent mean value ± standard deviation (s.d.) Wilcoxon’s matched‐pairs signed‐rank test (n = 6). (e) Quantification of EETs by measurement of free double‐stranded DNA released into the supernatants of activated T cells co‐cultured with eosinophils in the presence or absence of DNase I. Results are depicted as mean ± s.d. Means were compared using Friedman’s multiple comparison test for paired samples (n = 4).
Discussion
Galectin‐10 has been reported to confer Treg cells with T cell suppressive capacity [13]. We have reported that eosinophils can suppress T cells [11, 12] and that part of this suppressive activity was inhibited by the administration of neutralizing antibodies to galectin‐10 [10]. However, until the present it has been unclear how galectin‐10 is released from eosinophils exposed to proliferating T cells. Here, we show that eosinophils released extracellular traps consisting of nuclear DNA and galectin‐10 when exposed to proliferating T cells. Two major types of eosinophil extracellular traps can be generated in vitro: rapid ones engendered by incubation of eosinophils with thymic stromal lymphopoietin (TSLP) or interleukin (IL)‐5 combined with either lipopolysaccharide (LPS), complement factor 5a or eotaxin [23], and slow ones formed in response to stimuli that trigger reactive oxygen production; for example, calcium ionophores, phorbol myristate acetate or immobilized immunoglobulin deposits [24].
The first sequence of events leading up to the release of EETs was the formation of synapses between the eosinophils and proliferating T cells. Eosinophils established close contact with both CD4+ and CD8+ T cells, which is consistent with our previous findings that eosinophils are able to suppress the proliferation of both CD4+ and CD8+ T cells [11]. Proliferating T cells (T cell blasts) were seen after 30 min of co‐incubation with eosinophils, but not after 1 or 2 h of co‐culture. This is also in line with our previous findings; namely, that the number of T cells expressing the proliferation marker Ki‐67 decreased in the presence of eosinophils [11]. The next cellular event in the eosinophil–T cell co‐cultures occurred after 1 h, when cap‐like accumulation of galectin‐10 appeared in front of the eosinophils’ nuclear lobes, most probably in preparation for the ejection of galectin‐10 in association with DNA. As well as the observation that galectin‐10 was directly associated with the nuclear lobes, we could document that the ejected EETs contained histones, further corroborating that the EETs consisted of nuclear and not mitochondrial DNA. At approximately the same time‐point, eosinophils with dissolved cytoskeleton and an even cytoplasmic distribution of galectin‐10 were also seen, which we believe to be an early stage of eosinophil cytolysis. A recent study demonstrated that galectin‐10 is stored in the cytoplasm itself and not in the cytoplasmic granules of eosinophils [28], which might explain our observation that the nuclear lobes of eosinophils appear to push accumulated cap‐like formations of galectin‐10 through the cytoplasm prior to the extracellular release of EETs. The timing of events, the fact that the EETs evoked by proliferating T cells were enriched for nuclear DNA and that eosinophils had started to lyse indicate that what we observed was the phenomenon of EETosis, a particular form of cell death by which leukocytes go into cytolysis while simultaneously releasing extracellular DNA traps [24].
An interesting study from Weller and co‐workers that is in line with our results showed that galectin‐10 crystal formation by eosinophils exposed in vitro to calcium ionophore or combinations of cytokines was associated with EETosis [25]. Occasionally, we detected crystal formation when eosinophils were exposed to proliferating T cells, but this was not a dominating feature. Nevertheless, the magnitude of EET production by activated eosinophils reported by Weller et al. using their various in‐vitro stimuli were in the same order as in the present study: they found that eosinophils stimulated with the calcium ionophore A23187 resulted in the formation of approximately 200 EETs per 1000 eosinophils compared to our estimated 400 EETs per 1000 eosinophils stimulated by proliferating T cells. It should be pointed out that it is challenging to determine if EETs and entire nets originate from one or several eosinophils with certainty by studying confocal microscopy images.
It has been proposed that EETs capture and kill bacteria [29]. However, these structures have also been demonstrated in the tissues of patients with non‐infectious conditions such as bullous pemphigoid, allergic asthma and eosinophilic esophagitis [23, 30, 31]. A recent study showed that eosinophils purified from the blood of patients with severe eosinophilic asthma, which were stimulated ex vivo with IL‐5 and LPS, released significantly more EETs compared with eosinophils derived from patients with non‐severe asthma. It was also shown that the formation of EETs correlated with the release of the granule protein eosinophil‐derived neurotoxin [32]. More recently, Lambrecht et al. showed galectin‐10‐containing eosinophil extracellular traps in the tissues of patients with chronic rhinosinusitis with nasal polyps [26]. In the present study, we observed that it was CD16‐expressing eosinophils that formed synapses with proliferating T cells and released galectin‐10‐containing EETs. Initially, during the early events of synapse and galectin‐10 cap formation. CD16 appeared to be mobilized to the cell surface indicative of the cells having an intact membrane at this stage. In contrast, CD16 was evenly dispersed in the cytoplasm during the later stages characterized by actin dissolution and EET formation, suggestive of lysis of the cells. In an earlier study, we identified a subpopulation of CD16high/galectin‐10high eosinophils as being superior T cell suppressors compared with conventional CD16− eosinophils, and we suggested that this subpopulation constituted an immune regulatory subset of eosinophils [10]. We also demonstrated that recombinant galectin‐10 on its own could diminish but not abolish T cell proliferation [10]. Herein, we established that the T cell suppressive capacity of eosinophils was partly reverted when their ability to form EETs was decreased through the addition of DNase I to the cell cultures. However, this was a modest reversal of suppression by 11%, which was enhanced by the addition of anti‐galectin‐10 mAb. This supports our contention that galectin‐10‐containing extracellular traps are functional and mediate part of the T cell suppressive function of human eosinophils. Possibly, eosinophils also exert their suppressive function through the synapses they formed with proliferating T cells, either by the intracellular transfer of galectin‐10 or by as‐yet unidentified mechanisms. In the future, we hope to unravel the mechanisms by which galectin‐10 from eosinophils suppresses T cell proliferation.
Disclosures
The authors declare that they have no competing commercial or financial interests.
Author contributions
C. L. and K. A. participated in the performance and design of the experiments and the analysis as well as the writing of the manuscript. C. W. participated in the design of the experiments as well as in the writing of the manuscript and supervised the entire study.
Availability of Data and Material
The datasets used during the current study are available from the corresponding author upon request.
Supporting information
Fig. S1. CD16 expression by eosinophils co‐cultured with CD3/CD28‐stimulated T cells after 30 minutes (a), 60 minutes (b) and 120 minutes (c). Cells were stained for actin, CD16, galectin‐10 and DNA. Fig.s labelled by a single prime (′) show staining for CD16 and DNA, those with a double prime (″) show staining for actin, CD16, galectin‐10 and DNA in Fig.s (a‐c). Fig. (d) labelled by a single prime (′) show staining for CD16 isotype control and DNA, with a double prime (″) show staining for actin, CD16 isotype control, galectin‐10 and DNA. Fig. (de) labelled by a single prime (′) show staining for galectin‐10 isotype control and DNA, labelled with a double prime (″) show staining for actin, galectin‐10 isotype control and DNA.
Fig. S2. Kinetics of the cellular events resulting in the release of galectin‐10 from CD16+ (black bars) and CD16‐ eosinophils (grey bars) incubated with proliferating T cells. The frequencies of immune synapse formation between T cells and eosinophils (a), galectin‐10 cap formation by eosinophils (b), cytoskeletal actin dissolution displayed by eosinophils (c), and galectin‐10‐containing EETs (d) were enumerated manually by studying 17 confocal images derived from one experiment after 30 minutes, 60 minutes and 120 minutes of eosinophil‐T cell co‐culture. Enumeration and kinetics of the cellular events are depicted in the graphs and denoted per 1000 eosinophils. Bars represent mean value with standard deviations (SD).
Fig. S3. Graph showing viability of eosinophils and T cells after 48 hours of culture (n = 4). Cells negative for both Annexin V and 7AAD are shown in light grey (live cells), cells stained positive for Annexin V but not for 7AAD are shown in medium grey (apoptotic cells), cells stained for 7AAD but not for Annexin V are shown in dark grey (necrotic cells) and cells stained for 7AAD and for Annexin V are shown in black (dead cells). From the top to the bottom indicated with bold text viability is shown for PBMC cultured with eosinophils and DNase I, PBMC cultured with eosinophils, PBMC cultured alone, PBMC cultured with DNase I, eosinophils cultured with PBMC and eosinophils cultured alone.
Acknowledgements
This work was funded by grants from the Swedish state under the agreement between the Swedish government and the county councils, the ALF agreement (71580 and 74080), the Cancer and Allergy Foundation (149781), Health and Medical Care Committee of the Regional Executive Board of Region Västra Götaland (96490), Inga Britt and Arne Lundberg Research Foundation, and the University of Gothenburg.
References
- 1. Sustiel A, Rocklin R. T cell responses in allergic rhinitis, asthma and atopic dermatitis. Clin Exp Allergy 1989; 19:11–18. [DOI] [PubMed] [Google Scholar]
- 2. Prussin C, Lee J, Foster B. Eosinophilic gastrointestinal disease and peanut allergy are alternatively associated with IL‐5+ and IL‐5(‐) T(H)2 responses. J Allergy Clin Immunol 2009; 124:1326–1332.e1326. [DOI] [PMC free article] [PubMed] [Google Scholar]
- 3. Perkey E, Maillard I. New insights into graft‐versus‐host disease and graft rejection. Annu Rev Pathol 2018; 13:219–245. [DOI] [PubMed] [Google Scholar]
- 4. Hertl M, Eming R, Veldman C. T cell control in autoimmune bullous skin disorders. J Clin Invest 2006; 116:1159–1166. [DOI] [PMC free article] [PubMed] [Google Scholar]
- 5. Boita M, Guida G, Circosta P et al The molecular and functional characterization of clonally expanded CD8+ TCR BV T cells in eosinophilic granulomatosis with polyangiitis (EGPA). Clin Immunol 2014; 152:152–163. [DOI] [PubMed] [Google Scholar]
- 6. Peterson CG, Skoog V, Venge P. Human eosinophil cationic proteins (ECP and EPX) and their suppressive effects on lymphocyte proliferation. Immunobiology 1986; 171:1–13. [DOI] [PubMed] [Google Scholar]
- 7. Odemuyiwa SO, Ghahary A, Li Y et al Cutting edge: human eosinophils regulate T cell subset selection through indoleamine 2,3‐dioxygenase. J Immunol 2004; 173:5909–5913. [DOI] [PubMed] [Google Scholar]
- 8. Liu LY, Mathur SK, Sedgwick JB, Jarjour NN, Busse WW, Kelly EA. Human airway and peripheral blood eosinophils enhance Th1 and Th2 cytokine secretion. Allergy 2006; 61:589–597. [DOI] [PubMed] [Google Scholar]
- 9. Harfi I, Schandene L, Dremier S, Roufosse F. Eosinophils affect functions of in vitro‐activated human CD3‐CD4+ T cells. J Transl Med 2013; 11:112. [DOI] [PMC free article] [PubMed] [Google Scholar]
- 10. Lingblom C, Andersson J, Andersson K, Wenneras C. Regulatory eosinophils suppress T cells partly through galectin‐10. J Immunol 2017; 198:4672–81. [DOI] [PubMed] [Google Scholar]
- 11. Andersson J, Cromvik J, Ingelsten M et al Eosinophils from hematopoietic stem cell recipients suppress allogeneic T cell proliferation. Biol Blood Marrow Transplant 2014; 20:1891–1898. [DOI] [PubMed] [Google Scholar]
- 12. Lingblom C, Wallander J, Ingelsten M et al Eosinophils from eosinophilic oesophagitis patients have T cell suppressive capacity and express FoxP3. Clin Exp Immunol 2017; 187:455–65. [DOI] [PMC free article] [PubMed] [Google Scholar]
- 13. Kubach J, Lutter P, Bopp T et al Human CD4+CD25+ regulatory T cells: proteome analysis identifies galectin‐10 as a novel marker essential for their anergy and suppressive function. Blood 2007; 110:1550–8. [DOI] [PubMed] [Google Scholar]
- 14. Lee JJ, Jacobsen EA, Ochkur SI et al Human versus mouse eosinophils: ‘that which we call an eosinophil, by any other name would stain as red’. J Allergy Clin Immunol 2012; 130:572–84. [DOI] [PMC free article] [PubMed] [Google Scholar]
- 15. Dvorak AM, Letourneau L, Login GR, Weller PF, Ackerman SJ. Ultrastructural localization of the Charcot–Leyden crystal protein (lysophospholipase) to a distinct crystalloid‐free granule population in mature human eosinophils. Blood 1988; 72:150–158. [PubMed] [Google Scholar]
- 16. Dvorak AM, Weller PF, Monahan‐Earley RA, Letourneau L, Ackerman SJ. Ultrastructural localization of Charcot–Leyden crystal protein (lysophospholipase) and peroxidase in macrophages, eosinophils, and extracellular matrix of the skin in the hypereosinophilic syndrome. Lab Invest 1990; 62:590–607. [PubMed] [Google Scholar]
- 17. Leonidas DD, Elbert BL, Zhou Z, Leffler H, Ackerman SJ, Acharya KR. Crystal structure of human Charcot–Leyden crystal protein, an eosinophil lysophospholipase, identifies it as a new member of the carbohydrate‐binding family of galectins. Structure 1995; 3:1379–1393. [DOI] [PubMed] [Google Scholar]
- 18. Su J. A brief history of Charcot–Leyden crystal protein/galectin‐10 research. Molecules 2018; 23:2931. [DOI] [PMC free article] [PubMed] [Google Scholar]
- 19. Dvorak AM, Weller PF. Ultrastructural analysis of human eosinophils. Chem Immunol 2000; 76:1–28. [DOI] [PubMed] [Google Scholar]
- 20. Thakral D, Agarwal P, Saran RK, Saluja S. Significance of Charcot Leyden crystals in liver cytology – a case report. Diagn Cytopathol 2015; 43:392–394. [DOI] [PubMed] [Google Scholar]
- 21. Ahluwalia J, Das R, Malhotra P, Verma S, Garewal G. Charcot Leyden crystals in acute myeloid leukemia. Am J Hematol 2003; 73:141. [DOI] [PubMed] [Google Scholar]
- 22. Negrete‐Garcia MC, Jimenez‐Torres CY, Alvarado‐Vasquez N et al Galectin‐10 is released in the nasal lavage fluid of patients with aspirin‐sensitive respiratory disease. Sci World J 2012; 2012:474020. [DOI] [PMC free article] [PubMed] [Google Scholar]
- 23. Yousefi S, Gold JA, Andina N et al Catapult‐like release of mitochondrial DNA by eosinophils contributes to antibacterial defense. Nat Med 2008; 14:949–953. [DOI] [PubMed] [Google Scholar]
- 24. Ueki S, Melo RC, Ghiran I, Spencer LA, Dvorak AM, Weller PF. Eosinophil extracellular DNA trap cell death mediates lytic release of free secretion‐competent eosinophil granules in humans. Blood 2013; 121:2074–2083. [DOI] [PMC free article] [PubMed] [Google Scholar]
- 25. Ueki S, Tokunaga T, Melo RCN et al Charcot–Leyden crystal formation is closely associated with eosinophil extracellular trap cell death. Blood 2018; 132:2183–2187. [DOI] [PMC free article] [PubMed] [Google Scholar]
- 26. Persson EK, Verstraete K, Heyndrickx I et al Protein crystallization promotes type 2 immunity and is reversible by antibody treatment. Science 2019; 364:eaaw4295. [DOI] [PubMed] [Google Scholar]
- 27. Svensson L, Rudin A, Wenneras C. Allergen extracts directly mobilize and activate human eosinophils. Eur J Immunol 2004; 34:1744–1751. [DOI] [PubMed] [Google Scholar]
- 28. Melo RCN, Wang H, Silva TP et al Galectin‐10, the protein that forms Charcot–Leyden crystals, is not stored in granules but resides in the peripheral cytoplasm of human eosinophils. J Leukoc Biol 2020; 108:139–149. [DOI] [PMC free article] [PubMed] [Google Scholar]
- 29. Yousefi S, Simon D, Simon HU. Eosinophil extracellular DNA traps: molecular mechanisms and potential roles in disease. Curr Opin Immunol 2012; 24:736–739. [DOI] [PubMed] [Google Scholar]
- 30. Dworski R, Simon HU, Hoskins A, Yousefi S. Eosinophil and neutrophil extracellular DNA traps in human allergic asthmatic airways. J Allergy Clin Immunol 2011; 127:1260–1266. [DOI] [PMC free article] [PubMed] [Google Scholar]
- 31. Simon D, Hoesli S, Roth N, Staedler S, Yousefi S, Simon HU. Eosinophil extracellular DNA traps in skin diseases. J Allergy Clin Immunol 2011; 127:194–199. [DOI] [PubMed] [Google Scholar]
- 32. Choi Y, Le Pham D, Lee DH, Lee SH, Kim SH, Park HS. Biological function of eosinophil extracellular traps in patients with severe eosinophilic asthma. Exp Mol Med 2018; 50:104. [DOI] [PMC free article] [PubMed] [Google Scholar]
- 33. Lucey DR, Dorsky DI, Nicholson‐Weller A, Weller PF. Human eosinophils express CD4 protein and bind human immunodeficiency virus 1 gp120. J Exp Med 1989; 169:327–332. [DOI] [PMC free article] [PubMed] [Google Scholar]
Associated Data
This section collects any data citations, data availability statements, or supplementary materials included in this article.
Supplementary Materials
Fig. S1. CD16 expression by eosinophils co‐cultured with CD3/CD28‐stimulated T cells after 30 minutes (a), 60 minutes (b) and 120 minutes (c). Cells were stained for actin, CD16, galectin‐10 and DNA. Fig.s labelled by a single prime (′) show staining for CD16 and DNA, those with a double prime (″) show staining for actin, CD16, galectin‐10 and DNA in Fig.s (a‐c). Fig. (d) labelled by a single prime (′) show staining for CD16 isotype control and DNA, with a double prime (″) show staining for actin, CD16 isotype control, galectin‐10 and DNA. Fig. (de) labelled by a single prime (′) show staining for galectin‐10 isotype control and DNA, labelled with a double prime (″) show staining for actin, galectin‐10 isotype control and DNA.
Fig. S2. Kinetics of the cellular events resulting in the release of galectin‐10 from CD16+ (black bars) and CD16‐ eosinophils (grey bars) incubated with proliferating T cells. The frequencies of immune synapse formation between T cells and eosinophils (a), galectin‐10 cap formation by eosinophils (b), cytoskeletal actin dissolution displayed by eosinophils (c), and galectin‐10‐containing EETs (d) were enumerated manually by studying 17 confocal images derived from one experiment after 30 minutes, 60 minutes and 120 minutes of eosinophil‐T cell co‐culture. Enumeration and kinetics of the cellular events are depicted in the graphs and denoted per 1000 eosinophils. Bars represent mean value with standard deviations (SD).
Fig. S3. Graph showing viability of eosinophils and T cells after 48 hours of culture (n = 4). Cells negative for both Annexin V and 7AAD are shown in light grey (live cells), cells stained positive for Annexin V but not for 7AAD are shown in medium grey (apoptotic cells), cells stained for 7AAD but not for Annexin V are shown in dark grey (necrotic cells) and cells stained for 7AAD and for Annexin V are shown in black (dead cells). From the top to the bottom indicated with bold text viability is shown for PBMC cultured with eosinophils and DNase I, PBMC cultured with eosinophils, PBMC cultured alone, PBMC cultured with DNase I, eosinophils cultured with PBMC and eosinophils cultured alone.
Data Availability Statement
The datasets used during the current study are available from the corresponding author upon request.


