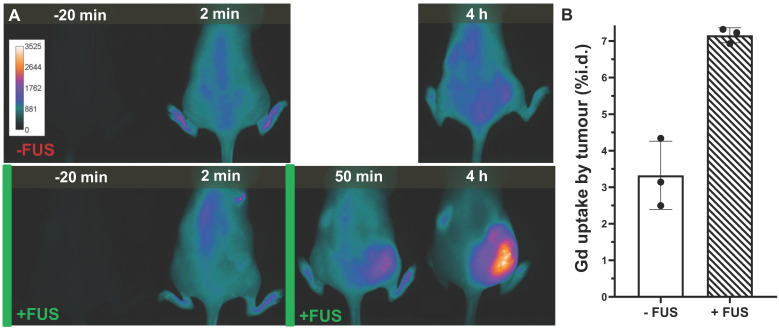
Figure 7.
Representative imaging of iTSL-DOX uptake; (A) Near-infrared fluorescence imaging comparison of mice injected (i.v. tail; t = 0) with iTSL-DOX, and without (-FUS) or with (+FUS) focused ultrasound on the right side. Images are shown pre-, then post-injection and the FUS treatments are indicated by the green bars. The CF750-DSA liposome label was excited at 704 nm and fluorescence emission collected over 740-950 nm. (B) Gadolinium tumour concentration (n = 3; mean ± SD; normalised by tumour mass) assessed by TXRF.

