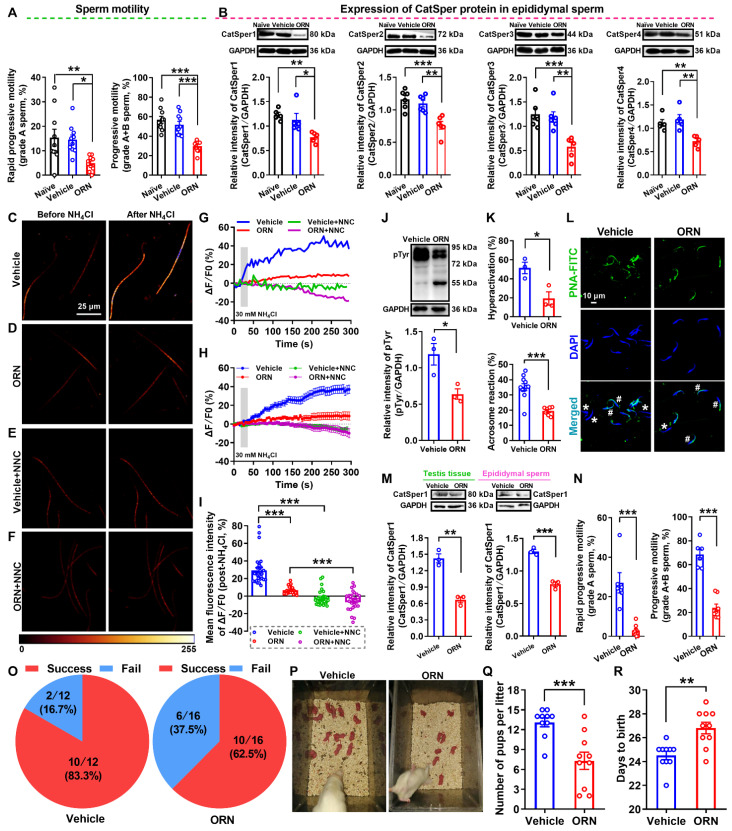
Figure 3.
Reduced sperm motility and functional CatSper channels expression in the spermatozoa, and impaired fertility in asthenozoospermic (AZS) model rats. (A) Sperm motility in epididymal sperm of naïve rats, vehicle-treated rats, and ornidazole (ORN)-induced AZS rats (n = 10 rats per group). (B) CatSper protein (from CatSper1 to CatSper4) abundance (n = 5-6 rats per group). (C-F) Representative fluorescence images from Fluo-4 loaded sperm before and after 30 mM NH4Cl treatment in different groups as indicated. Scale bar = 25μm. (G) Representative single sperm fluorescence traces. (H) Changes in normalized [Ca2+]i fluorescent signals of all tested sperm. (I) Summary plot of normalized [Ca2+]i fluorescent signals of all tested sperm in response to NH4Cl treatment (n = 26-29 spermatozoa from 4-6 rats per group). (J-L) Protein tyrosine phosphorylation (pTyr) (J), hyperactivation (K), and acrosome reaction (AR) (K-L) in the epididymal sperm of vehicle- and ORN-treated rats (n = 3 rats per group). (L) Shown are representative images of sperm acrosome reaction of vehicle- and ORN-treated rats. Asterisk and pound sign indicate the sperm that has acrosome reaction (acrosome disappeared) and has no acrosome reaction (acrosome existed), respectively. Scale bar = 10 μm. (M-R) In vivo fertility assay of vehicle- and ORN-treated rats (n = 3-10 male rats per group). (M, N) Validation of the decreased CatSper1 protein (M) and sperm motility (N) in the ORN-treated male rats that to mate with the normal female rats. (O) The pregnancy rate of female rats that were mated with the ORN-induced AZS rats. (P-Q) Representative and a summary plot for number of pups per litter. (R) Days to birth of the pup. All data are presented as mean ± SEM. *P < 0.05, **P < 0.01, ***P < 0.001. One-way ANOVA with Sidak's post-hoc test for (A)-(B), and (I); Unpaired t test for (J)-(N) and (Q)-(R). See also Figures S2-S4.

