

Abstract
Objectives
Testing and treatment for hepatitis B virus (HBV) and hepatitis C virus (HCV) infection are highly effective, high-impact interventions. This article aims to estimate the cost-effectiveness of scaling up these interventions by scenarios, regions, and income groups.
Methods
We modeled costs and impacts of hepatitis elimination in 67 low- and middle-income countries from 2016 to 2030. Costs included testing and treatment commodities, healthcare consultations, and future savings from cirrhosis and hepatocellular carcinomas averted. We modeled disease progression to estimate disability-adjusted life-years (DALYs) averted. We estimated incremental cost-effectiveness ratios (ICERs) by regions and World Bank income groups, according to 3 scenarios: flatline (status quo), progress (testing/treatment according to World Health Organization guidelines), and ambitious (elimination).
Results
Compared with no action, current levels of testing and treatment had an ICER of $807/DALY for HBV and –$62/DALY (cost-saving) for HCV. Scaling up to progress scenario, both interventions had ICERs less than the average gross domestic product/capita of countries (HBV: $532/DALY; HCV: $613/DALY). Scaling up from flatline to elimination led to higher ICERs across countries (HBV: $927/DALY; HCV: $2528/DALY, respectively) that remained lower than the average gross domestic product/capita. Sensitivity analysis indicated discount rates and commodity costs were main factors driving results.
Conclusions
Scaling up testing and treatment for HBV and HCV infection as per World Health Organization guidelines is a cost-effective intervention. Elimination leads to a much larger impact though ICERs are higher. Price reduction strategies are needed to achieve elimination given the substantial budget impact at current commodity prices.
Keywords: cost-effectiveness, DALY, elimination, viral hepatitis
Introduction
In 2015, the World Health Organization (WHO) estimated that viral hepatitis led to 1.34 million deaths globally.1 Most hepatitis deaths are secondary to cirrhosis and hepatocellular carcinoma (HCC) that can be prevented through testing and treatment for hepatitis B virus (HBV) and hepatitis C virus (HCV) infections.1 In 2016, the World Health Assembly adopted a resolution calling for elimination of viral hepatitis as a public health threat by 2030 (–90% incidence, –65% mortality, compared with 2015 baseline).2 Nevertheless, in 2019, only a small number of countries had scaled up testing and treatment.3
To justify inclusion of testing and treatment for HBV and HCV infection into universal health coverage (UHC), a number of factors need to be considered. The WHO recommends testing4 and treatment for HBV5 and HCV infection6 as effective, high-impact interventions. Scaling of testing and treatment under the ambitious scenario7,8 represents 1.5% of the overall estimated price tag for UHC, but the effect would be proportionally higher, leading to a reduction of about 5% in mortality and an increase of about 10% in healthy life-years. To assess cost-effectiveness, the WHO assisted countries through provision of online, interactive tools for HBV9 and HCV.10 Published studies in specific countries reported that treatment of already diagnosed individuals can be cost-effective11 or cost saving.12 Nevertheless, there are little data available on the cost-effectiveness of testing followed by treatment for HBV and HCV in low- and middle-income countries (LMICs).13,14 Thus, the WHO needed a systematic assessment of cost-effectiveness of testing and treatment to consider various scenarios, regions, and country income groups.
We built on previous work that estimated costs for the scale-up of testing and treatment in 67 LMICs7 by adding the cost of healthcare consultations and subtracting future healthcare savings through prevented cirrhosis and HCCs. We generated cost-effectiveness estimates for testing and treatment of HBV and HCV infections by WHO regions and World Bank income groups.
Methods
Economic Model
We incorporated all applicable long-term costs and effects to our published costing model for the scale-up of viral hepatitis management8 to allow a cost-effectiveness analysis. Briefly, the costing model was a state-based cohort model based on national population extrapolations for 67 LMICs, using a 2016 to 2030 time horizon for the costs of various approaches to testing and treatment of HBV and HCV. The published model already included commodities and programmatic costs for testing and treatment according to WHO guidelines. We extended the model to (1) add consultation costs, and (2) subtract future savings from averted cirrhosis and HCCs for a cost-effectiveness analysis estimating the net cost per disability-adjusted life-year (DALY) gained. An overview of the components of the published and present model is given in Figure 1. We used the 2016-2030 time horizon from the original model for costs, and a lifetime horizon for benefits. The time horizon for costs reflected the period of investment required to meet the sustainable development goals. The lifetime horizon for benefits took into account long-term health benefit (future morbidity and mortality avoided) through scaled up treatment over the first 15 years. Given the slow evolution of chronic hepatitis, the time horizon for benefits was longer than for costs. This unusual approach was necessary to reflect that each infection treated would lead to long-term benefits beyond cost incurred.
Figure 1.
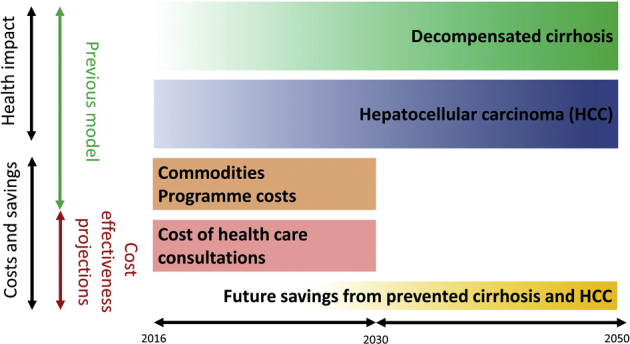
Comparison of the components of the cost-effectiveness and previous model.
We used a health system perspective, quantifying direct market-valued costs regardless of who pays for them. Costs were reported in 2016 USD, and where appropriate were inflated from source year using the World Bank gross domestic product (GDP) deflator.15 The primary outcome of the study was the incremental cost-effectiveness ratio (ICER) per DALY averted. Costs and benefits were discounted at 3% per annum in the base case. In this analysis, we expressed ICERs as a function of the GDP/capita for international comparison purposes only. An ICER above or below 1 × or 3 × GDP/capita should not be interpreted as an indication of whether the intervention is worthwhile or not at a country level.
Scenarios
We modeled scaling up HBV and HCV testing and treatment and its economic and health impacts across 3 scenarios. A flatline scenario represented current levels of testing and treatment activity projected until 2030. A progress scenario scaled up testing and treatment according to what is recommended in the WHO guidelines.4, 5, 6 An ambitious scenario scaled up testing and treatment to the coverage levels that would lead to elimination of hepatitis as a public health threat, that is, diagnosing 90% of those infected and treating 85% of those diagnosed. This scenario is referred to in the rest of the article as elimination.
Interventions and Comparators
We compared 3 scenarios of coverage for testing followed by treatment. We compared the flatline scenario against a hypothetical counterfactual do-nothing scenario in which no testing or treatment took place. We compared the progress scenario to the flatline scenario, and the elimination scenario with both the flatline and progress scenarios. We used estimates on effectiveness of HBV and HCV treatments to prevent cirrhosis and HCCs from previously published models.10,16
Costs and Quantities
For the costing of testing and treatment activities, we used the quantities and unit costs of the previous model.8 Although the previous model was a financial costing, there were no conceptual differences that prevented us from reusing the same data along with a modified analysis. The model estimated the quantity of resources consumed each year (diagnostics, medicines, outpatient visits), and we calculated total costs from global unit costs (Table 1). For outpatient visits, we used the costs for outpatient consultations (health center, no beds) at the country level from the CHOosing Interventions that are Cost-Effective (WHO-CHOICE) database.17 We used data from South Africa as a proxy for missing WHO-CHOICE data for Tanzania and Zimbabwe. We inflated all WHO-CHOICE data from 2010 USD to 2016 USD using country-level World Bank annual GDP deflators.15
Table 1.
Financial and human resources involved in testing and treatment for HBV and HCV (2016 USD).
| Stages of pathway | Costing elements | Case mix (%) | Base | Lower | Upper | Average base | Consultations(n) | ||
|---|---|---|---|---|---|---|---|---|---|
| HBV | Initial testing | HBsAg rapid diagnostic test∗ | 30 | 1.60 | 0.40 | 2.80 | |||
| Immunoassay lab-based HBsAg∗ | 70 | 1.98 | 0.50 | 5.00 | |||||
| Average per person tested | 1.86 | 1 | Per person tested | ||||||
| Confirmation | Not applicable | - | - | - | - | - | |||
| Assessment for treatment | HBV DNA† (n = 1) | 90 | 20.00 | 5.00 | 100.00 | 1 | Per person tested | ||
| APRI‡ test (n = 1) | 100 | 2.50 | 2.00 | 5.00 | 1 | Per person tested | |||
| Average per person assessed | 20.50 | ||||||||
| Treatment | Tenofovir (lifetime, annual cost) | 100 | 30.00 | 10.00 | 300.00 | 30.00 | 1 | Per year starting first year | |
| Monitoring | HBV DNA∗ (every year for treated) | 100 | 20.00 | 5.00 | 100.00 | 1 | Per year starting first year | ||
| APRI‡ test | 100 | 2.50 | 2.00 | 5.00 | |||||
| Average per person monitored yearly | 22.50 | ||||||||
| HCV | Initial testing | Anti-HCV rapid diagnostic test | 30 | 1.25 | 0.50 | 2.00 | |||
| Immunoassay lab-based anti-HCV | 70 | 1.10 | 0.50 | 5.00 | |||||
| Average per person tested | 1.15 | 1 | Per person tested | ||||||
| Confirmation | HCV RNA§ (per person anti HCV +) | 50 | 20.00 | 5.00 | 100.00 | 10.00 | 1 | Per person tested | |
| Assessment for treatment | APRI‡ test | 100 | 2.50 | 2.00 | 5.00 | 2.50 | 1 | Per person tested | |
| Average per person assessed | 2.50 | ||||||||
| Treatment | Countries with generics available | ||||||||
| DAA‖ for 12 weeks (no cirrhosis) | 90 | 105.00 | 40.00 | 135.00 | |||||
| DAA‖ for 24 weeks (cirrhosis) | 10 | 210.00 | 80.00 | 270.00 | |||||
| Average per person treated with generic | 115.50 | 1 | Per person treated | ||||||
| Countries with generics unavailable | |||||||||
| DAA‖ for 12 weeks (no cirrhosis) | 90 | 105.00 | 105.00 | 5000.00 | |||||
| DAA‖ for 24 weeks (cirrhosis) | 10 | 210.00 | 210.00 | 10000.00 | |||||
| Average per person treated with non-generic | 115.50 | 1 | Per person treated | ||||||
| Monitoring | RNA amplification test (per cure) | 100 | 20 | 5.00 | 100.00 | 20.00 | 1 | Per person treated | |
APRI indicates AST to Platelet Ratio Index; DAA, direct-acting antiviral; HBV, hepatitis B virus; HCV, hepatitis C virus.
Hepatitis B surface antigen.
Hepatitis B virus DNA amplification test.
APRI: AST to Platelet Ratio Index.
Hepatitis C virus RNA amplification test.
Direct acting anti-virals.
The direct healthcare costs of long-term complications of viral hepatitis (cirrhosis and HCC) were those estimated for the hepatitis C calculator at country level,10 which we applied equally to both HBV and HCV, under the assumption that the cost of cirrhosis or HCC would be independent from the virus involved. These annual healthcare costs were estimated using the WHO-CHOICE database.18 Briefly, we extracted inpatient visit costs (primary-level hospital) and outpatient visit costs (health center with no beds) per patient from WHO-CHOICE for all countries included in our analysis. For each state (cirrhosis, HCC), we calculated state-specific visit cost as weighted average of the inpatient and outpatients visit cost using a published inpatient/outpatient cost ratio.19 Inpatient visits accounted for 66% of costs for patients with decompensated cirrhosis (DC) and 55% of costs for patients with HCC.17 We then estimated the ratio of health state-specific per-visit cost in each country with the corresponding estimates in the United States to obtain the country-specific multiplier for that health state. Finally, we estimated the country-specific annual healthcare costs associated with each health state by multiplying the corresponding HCV health state annual costs in the United States with this multiplier. We assumed missing costs of sequelae for Zimbabwe, Togo, Sudan, South Sudan, Ivory Coast, Uganda, and Tanzania to be equal to those of South Africa.
The treatment pathway was based on WHO guidelines.4, 5, 6 For HBV, a rapid diagnostic test or lab-based immunoassay was followed by aspartate aminotransferase (AST) to Platelet Ratio Index to determine if there was cirrhosis. Nucleic acid amplification was then used in the absence of cirrhosis to test for treatment eligibility. Tenofovir used for treatment was monitored annually with AST and nucleic acid amplification. For HCV, rapid diagnostic test or lab-based immunoassay testing preceded HCV RNA testing, and AST to Platelet Ratio Index. Treatment was based on direct-acting antivirals (DAAs), using the WHO-recommended sofosbuvir-daclatasvir combination that does not require genotyping,8 and effectiveness assessed with HCV RNA.
Testing Assumptions by Scenarios
In the flatline scenario, we assumed baseline testing to stay at existing levels. Under the progress scenario, testing targeted high prevalence groups (eg, people who inject drugs), persons with chronic liver disease, and the general population in countries where prevalence exceeded 5%.4 For the elimination scenario, testing of the general population was added to targeted testing regardless of prevalence. Testing was assumed to occur at random, and each person was assumed to be tested at most once. The efficiency of testing (cases identified per test) was consequently defined as the ratio of the undiagnosed prevalent population over the total untested population.
Health Impacts
We calculated DALYs saved using the number of treatments initiated incrementally between scenarios, using the cohort models of the costing paper.8 Briefly, people with HBV were modeled to progress though treated and untreated compensated cirrhosis (CC), DC, and HCC. People with HCV were modeled to progress through a sequence of increasing liver fibrosis stages that eventually led to CC, DC, and HCC. Disease progression rates for HBV and HCV were taken from the published literature. HCV-related mortality rates were included for people with DC and HCC, and HBV-related mortality rates were included for people in those states plus those with chronic HBV and CC. If treated for HCV, people in the model were assumed to maintain the liver disease but without further progression, with the exception of people with CC who could still develop DC or HCC but at lower rates to their HCV-infected counterparts. If treated for HBV, people had dramatically lower rates of progression to CC, DC, HCC, or HBV-related death. DALYs were calculated based on differences in the person-years spent in the DC and HCC states (years lived with disability) and years of life lost owing to HBV- and HCV-related deaths. We accounted for DALYs associated with prevented early deaths in the year it would have occurred, and accounted for DALYs associated with improved health states in the year the benefit occurred. Disutilities associated with DC and HCC were 0.194 and 0.508, respectively (see Appendix Table 12 in Supplemental Materials at https://doi.org/10.1016/j.jval.2020.06.015), using the Global Burden of Disease parameters. DC and HCC account for most of the burden. According to Global Burden of Disease methods, we did not include a disability weight for chronic HCV infection. Such a disutility would have made the ICERs of interventions more favorable. Chronic HBV infection is associated with a disutility of 0.012.
Sensitivity Analysis
We conducted univariate deterministic sensitivity analysis using plausible ranges for central model parameters and explored the sensitivity of the modeled ICERs relative to the base case.
We selected variables for the sensitivity analysis based on expected cost drivers, including all unit costs and predictors of clinical need and outcomes: reduction in incidence over time of HCV in the progress scenario, proportion of diagnosed who are eligible for treatment (HBV only), rate of treatment success, spontaneous viral clearance, and prevalence of cirrhosis. We determined parameter uncertainty ranges based on expert opinion within WHO regional and country-level representatives.
Results
Testing and Treatment of HBV Infection
Under the flatline scenario, testing and treatment for HBV infection had a net cost of $8025 million for 9 947 682 DALYs averted (ICER: $807/DALY compared to doing nothing) (Table 2; see Appendix Table 1 in Supplemental Materials found at https://doi.org/10.1016/j.jval.2020.06.015). Relative to the flatline scenario, scaling up of testing and treatment to the progress scenario lead to an incremental net cost of $76 600 million for 143 900 928 DALYs averted, which was more cost-effective ($532/DALY; see Appendix Table 2 in Supplemental Materials found at https://doi.org/10.1016/j.jval.2020.06.015). In the elimination scenario relative to the flatline scenario, net incremental costs reached $183 015 million for 197 460 343 DALYs, with an ICER that was only marginally higher than in the flatline scenario ($927/DALY; see Appendix Table 3 in Supplemental Materials found at https://doi.org/10.1016/j.jval.2020.06.015). The net incremental cost of the elimination scenario compared to the progress scenario was $106 415 000 million, for an incremental impact of 53 559 416 DALYs at an ICER of $1987/DALY (see Appendix Table 4 in Supplemental Materials found at https://doi.org/10.1016/j.jval.2020.06.015).
Table 2.
Cost-effectiveness of testing and treatment for HBV and HCV infection in 2016-2030 for the flatline, progress, and elimination scenario (present value, discounted).
| Program costs (USD 2016 millions) |
Future savings (USD 2016 millions) | Net incremental costs (USD 2016 millions) | Total incremental impact (DALYs) | ICER (2016 USD/DALY) | ||
|---|---|---|---|---|---|---|
| Commodities | Program and staff time | |||||
| HBV | ||||||
| Flatline∗ | 4434 | 3690 | 99 | 8025 | 9 947 682 | 807 |
| Progress† | 10 746 | 67 200 | 1347 | 76 600 | 143 900 928 | 532 |
| Elimination‡ | 19 091 | 165 737 | 1813 | 183 015 | 197 460 343 | 927 |
| Elimination versus progress§ | 8344 | 98 537 | 467 | 106 415 | 53 559 416 | 1987 |
| HCV | ||||||
| Flatline∗ | 1428 | 4519 | 6875 | −928 | 15 061 782 | −62 |
| Progress† | 3343 | 26 432 | 11 001 | 18 773 | 30 638 054 | 613 |
| Elimination‡ | 11 723 | 184 679 | 23 807 | 172 595 | 68 279 199 | 2528 |
| Elimination versus progress§ | 8380 | 158 247 | 12 806 | 153 821 | 37 641 146 | 4087 |
DALY indicates disability-adjusted life year; HBV, hepatitis B virus; HCV, hepatitis C virus; ICER, incremental cost-effectiveness ratio;
Cost-effectiveness of treatment at the current level of testing and diagnosis compared with no action.
Cost-effectiveness of scaled up testing and treatment as per the progress scenario, compared with the flatline.
Cost-effectiveness of scaled up testing and treatment as per the elimination scenario, compared with the flatline.
Cost-effectiveness of scaled up testing and treatment as per the elimination scenario, compared with the progress scenario.
Across regions, under the flatline scenario, the ICER as a proportion of unweighted average GDP per capita ranged from 14% in Western Pacific region (WPR) to 107% in the African region (AFR) (Fig 2). The ICERs for scaling up to the progress scenario were lower in all regions, ranging from 10% of GDP/capita in WPR to 45% of GDP/capita in AFR. When compared to the flatline scenario, the ICERs of the elimination scenario ranged from 13% of GDP/capita in WPR to 101% of GDP/capita in the American region. When compared to progress, the ICERs for elimination ranged from 23% GDP/capita in WPR to 188% of GDP/capita in the American region.
Figure 2.

Cost-effectiveness of HBV and HCV by WHO region relative to GDP/capita.
Under the flatline scenario, the highest ICER relative to GDP per capita was in the low-income group (LICs) (129%), while the lowest was in the upper middle income group (UMICs) (12%; Fig 3). The ICERs relative to GDP/capita for scaling up to the progress scenario were lower in all income groups. The ICERs for the elimination scenario relative to the flatline scenario remained under 1 GDP/capita, from 16% in the UMICs to 68% in LICs. The ICERs for elimination compared with the progress scenario were higher, from 40% of GDP/capita in UMICs to 97% of GDP/capita in LMICs and LICs, respectively.
Figure 3.

Cost-effectiveness of HBV and HCV by World Bank income groups relative to GDP/capita.
Testing and Treatment of HCV Infection
Under the flatline scenario, testing and treatment for HCV infection was cost-saving with a negative net cost of $ –928 million for 15 061 782 DALYs averted (ICER: $–62/DALY) (Table 2, see Appendix Table 5 in Supplemental Materials found at https://doi.org/10.1016/j.jval.2020.06.015). Compared with the flatline scenario, scaling up of testing and treatment to the progress scenario levels led to net incremental costs of $18 773 million for 30 638 054 DALYs averted (ICER: $613/DALY) (see Appendix Table 6 in Supplemental Materials found at https://doi.org/10.1016/j.jval.2020.06.015). The elimination scenario net incremental costs compared with the flatline scenario reached $172 595 million for 68 279 199 DALYs, with an ICER that increased to $2 528/DALY (see Appendix Table 7 in Supplemental Materials found at https://doi.org/10.1016/j.jval.2020.06.015). Compared with the progress scenario, the incremental cost of elimination was $153 821 million for 37 641 146 DALYs at an ICER of $4087/DALY (see Appendix Table 8 in Supplemental Materials found at https://doi.org/10.1016/j.jval.2020.06.015).
Under the flatline scenario, diagnosis followed by treatment for HCV was cost-saving in all regions except the South East Asia region and the WPR, where the ICERs were 5% and 8% of GDP/capita, respectively (Fig 2). ICERs for scaling up to progress coverage levels were higher in all regions, ranging from 7% of GDP/capita in the European region to 78% in the AFR. Compared with the flatline, ICERs for the elimination scenario ranged from 45% of GDP/capita in the Eastern Mediterranean region and European region to 213% of GDP/capita in AFR. For the elimination scenario compared to the progress scenario, ICERs ranged from 77% of GDP/capita in the Eastern Mediterranean region up to 314% in the AFR.
Under the flatline scenario, the highest ICER relative to GDP per capita was in LICs (24%) while the lowest was in the LMICs (–4%) (Fig 3). Scaling up to the progress scenario led to an increase of the ICER in all income groups (12% of GDP/capita in UMICs to 74% of GDP/capita in LIC). ICERs for elimination compared with flatline ranged from 71% of GDP/capita in LMICs to 282% in LICs. Compared with the progress scenario, the ICERs for elimination increased to 134% of GDP/capita in UMICs group, 110% in LMICs, and 432% in LICs.
Sensitivity Analyses
The impact of the change in input parameters was comparable for the flatline scenario (see Appendix Table 9 in Supplemental Materials found at https://doi.org/10.1016/j.jval.2020.06.015), progress (Fig 4, see Appendix Table 10 in Supplemental Materials found at https://doi.org/10.1016/j.jval.2020.06.015), and elimination scenarios (see Appendix Table 11 in Supplemental Materials found at https://doi.org/10.1016/j.jval.2020.06.015). For HBV, the parameters that influenced cost-effectiveness the most were the discount rates for costs and benefits, and the costs of tenofovir and HBV DNA (currently recommended every year for treatment monitoring). A 0% or 5% discount rate for benefits reduced/increased the ICER by 33-37%. For HCV, the parameters that influenced cost-effectiveness the most were discount rates for costs and benefits, and the cost of DAAs in countries where generic medicines were not available. The cost of HCV RNA that are used only once to assess cure had much less influence on the ICERs. Similar to HBV, varying the discount rate for benefits from 0% to 5% decreased/increased the ICER by 48-49%.
Figure 4.

Sensitivity analysis of HBV and HCV results for the progress scenario, relative to base case ICER.
Discussion
Overall, at the current level of implementation, testing, and treatment for HBV and HCV infection is a good use of healthcare resources. For HBV, treatment is lifelong and still requires (according to WHO guidelines) a yearly monitoring of HBV DNA. Hence, the intervention is usually not cost-saving from a healthcare perspective. For HCV, treatment is shorter and leads to a single test that documents cure in more than 90% of patients. As a result, the intervention can be cost-saving from a healthcare perspective.
When regional variations are considered, the interventions are less cost-effective in the AFR. Here, the prevalence of HCV is low, leading to lower efficiency of testing and consequently higher costs to identify infected individuals. Additionally, the prevalence of HBV in the AFR is higher than in other regions, but only a small proportion of known cases are currently treated, requiring an important increase in the cost of HBV treatment in the region. Similarly, the intervention is less cost-effective in LICs, probably for identical reasons. Compared with analyses conducted with the HBV9 and HCV10 calculators, the results of our analysis yield higher ICERs, suggesting that the intervention is less cost-effective. Unlike the calculators that consider treatment for persons already diagnosed, our analysis takes into account testing at different levels of intensity, as well as programmatic costs. Given that a number of these tests are negative, testing inefficiencies make the intervention less cost-effective when considered from a programmatic perspective.
Scaling up testing and treatment under the progress scenario as described in the testing4 and treatment5,6 guidelines leads to higher cost, but also to the identification of more people to treat, leading to more treatments, and therefore to more future savings from prevented sequelae. As a result, management according to WHO guidelines is often more cost-effective than the status quo. Under the progress scenario, focused testing among populations at high prevalence or with signs and symptoms of chronic liver disease is efficient, yielding more patients per test conducted. Under the elimination scenario, however, the requirement to identify 90% of those infected leads to the need to test most of the population. Many countries have a prevalence of HBV or HCV under the 2% to 5% threshold that is the one recommended for population testing by WHO.3 As a result, the efficiency of testing decreases, leading to higher ICERs.
Across all regions, the ICER for elimination of HBV and HCV was less than 3 × GDP/capita. Willingness-to-pay thresholds have been proposed to decide what is an acceptable ICER. Willingness-to-pay represents an estimate of what the consumer (of healthcare) might demand, given preferences for other, competing consumption goods. Alternatively, a supply-side concept of threshold represents an estimate of the health foregone owing to the provider’s reallocating resources to a new intervention in a package of services. The concept of health opportunity cost might be the most relevant sense of thresholds for providers concerned with improving health given the resources currently available. GDP thresholds serve the purpose of trying to understand what consumers might demand, all things considered. The Commission on Macroeconomics and Health used GDP thresholds for the economic value of a year of healthy life.20 Subsequently, WHO-CHOICE cost-effectiveness analyses categorized interventions with a cost equal to or less than 1 unit of GDP per capita per DALY gained as very cost-effective and those with a cost between 1 and 3 units as cost-effective. The WHO-CHOICE thresholds were intended to measure an aspirational, demand-side threshold based on estimates of individuals’ preferences for health versus other consumption goods.21 In our analysis, we expressed our ICERs with reference to a GDP/capita threshold to provide context but not to indicate whether an intervention should be pursued.
The sensitivity analysis indicated that our results are not substantially affected by our economic and clinical assumptions. Nevertheless, the cost of commodities has a major influence on the ICER estimates. First, procuring HBV medicines through inefficient systems affects the cost-effectiveness of programs. Such inefficiencies from fragmented procurement and high in-country markup remain too common in a context where HBV treatment should cost $30 or less annually.22 Second, in countries that cannot access generic medicines,23 the higher prices of DAAs procured from originators substantially decreases cost-effectiveness. The price of diagnostics has less influence on cost-effectiveness. Nevertheless, further reductions in cost—to a level of $5/test for HBV DNA and HCV RNA—as envisioned24 would improve cost-effectiveness.
Our analysis is affected by 4 main limitations. First, we still miss accurate information on the cost of sequelae and on the proportion of patients with cirrhosis and HCC who actually access care. This limits our capacity to estimate future savings from sequelae prevented. National programs seeking a better understanding of the cost-effectiveness of their efforts need to work with clinicians and healthcare administrators to quantify the use of healthcare resources by patients with cirrhosis and HCC. Second, our scenarios are based on assumptions about the efficiency of testing, the probability of being tested twice, and the outcome of testing activities for the proportion of persons living with HBV and HCV infection diagnosed. These assumptions are mostly theoretical at this stage given the limited real-world experience of programs to test persons from the general population.25, 26, 27 More experiences are needed so that we can better quantify the outcome and impact of such programs. Third, we did not account for the possibility of reinfection. To address this limitation, we undertook a sensitivity analysis on the assumed reduction in incidence, which showed only a marginal impact on the ICER, similar to the original costing exercise.8 Finally, our analysis considered cost-effectiveness from a healthcare perspective. It did not take into account the societal impact, including productivity gains. The WHO prefers to make the investment case at the level of the overall health system,28 while a health payer perspective is preferred to assign resources within the healthcare sector.29 As a result, our results cannot be compared with other analyses that used a societal investment case or cost-benefit approach.30, 31, 32, 33, 34
In conclusion, at the current level of activities, testing and treatment for hepatitis is cost-effective for HBV, and cost-effective and sometimes cost-saving for HCV. Scaling up of these activities as recommended in the WHO guidelines would have a major health impact with ICERs that would remain under 1 GDP/capita. For elimination, testing and treatment is less cost-effective but ICERs are consistently lower than 3 GDP/capita in all regions. Overall, the price of commodities remains the main driver of cost-effectiveness. On the basis of these conclusions, we can suggest 3 main implications. First, health systems should work to integrate testing and treatment for HBV and HCV into UHC given the impact, budget impact, and cost-effectiveness. Second, scaling up of testing and treatment should be considered, at least to the progress level that generates substantial health benefit at an optimized cost-effectiveness ratio. Third, we need to continue to work on price reductions for commodities to make it possible to scale up in the future to levels that would be required for elimination.
Article and Author Information
Accepted for Publication: June 3, 2020
Published Online: October 9, 2020
Acknowledgments
Author Contributions: Concept and design: Tordrup, Hutin, Ball
Acquisition of data: Tordrup, Stenberg, Toy, Scott, Chhatwal
Analysis and interpretation of data: Tordrup, Lauer, Hutton, Toy, Scott, Chhatwal
Drafting of the manuscript: Tordrup, Hutin, Stenberg, Lauer, Toy
Critical revision of the paper for important intellectual content: Tordrup, Stenberg, Lauer, Hutton, Toy, Scott, Chhatwal, Ball
Statistical analysis: Hutton
Obtaining funding: Hutin
Supervision: Hutin, Ball
Other: HBV disease progression model: Toy. HCV disease progression model: Scott
Conflict of Interest Disclosures: Dr Tordrup reported receiving personal fees from the World Health Organization during the conduct of the study. Dr Hutton reported receiving grants and personal fees from the World Health Organization outside the submitted work. Dr Scott reported receiving grants from Gilead Sciences outside the submitted work. Dr Chhatwal reported receiving grants from Merck and Gilead outside the submitted work; personal fees from Gilead and Value Analytics Labs outside the submitted work; and other support from Value Analytics outside the submitted work. No other disclosures were reported.
Funding/Support: This work was funded by the World Health Organization, Unitaid, and the US Centers for Disease Control and Prevention.
Role of the Funder/Sponsor: The funder other than WHO had no role in the design and conduct of the study; collection, management, analysis, and interpretation of the data; preparation, review, or approval of the manuscript; or decision to submit the manuscript for publication.
Acknowledgment: We are grateful to a number of people who provided crucial comments on the draft manuscript, including Margaret Hellard, Charles Gore, Po-Lin Chan, Naoko Ishikawa, Olufunmilayo Lesi, Andrew Mirelman, Antons Mozalevski, Nick Walsh, and Karin Timmermans.
Footnotes
Supplementary data associated with this article can be found in the online version at https://doi.org/10.1016/j.jval.2020.06.015.
Contributor Information
David Tordrup, Email: dtordrup@gmail.com.
Yvan Hutin, Email: hutiny@who.int.
Supplemental Material
References
- 1.Global hepatitis report, 2017. World Health Organization. http://apps.who.int/iris/bitstream/10665/255016/1/9789241565455-eng.pdf?ua=1
- 2.Global health sector strategy on viral hepatitis, 2016–2021 – towards ending hepatitis. World Health Organization. https://apps.who.int/iris/bitstream/handle/10665/246177/WHO-HIV-2016.06-eng.pdf;jsessionid=C218A471F69D97C680E0940470EB5455?sequence=1
- 3.World Health Organization Progress report on HIV, viral hepatitis and sexually transmitted infections 2019. Accountability for the global health sector strategies, 2016–2021. https://www.who.int/hiv/strategy2016-2021/progress-report-2019/en/
- 4.Guidelines on hepatitis B and C testing. World Health Organization. http://apps.who.int/iris/bitstream/10665/254621/1/9789241549981-eng.pdf?ua=1
- 5.Guidelines for the prevention, care and treatment of persons with chronic hepatitis B infection. World Health Organization. http://apps.who.int/iris/bitstream/10665/154590/1/9789241549059_eng.pdf?ua=1&ua=1 [PubMed]
- 6.Guidelines for the care and treatment of persons diagnosed with chronic hepatitis C virus infection. World Health Organization. https://apps.who.int/iris/bitstream/handle/10665/273174/9789241550345-eng.pdf?ua=1 [PubMed]
- 7.Stenberg K., Hanssen O., Edejer T.T. Financing transformative health systems towards achievement of the health Sustainable Development Goals: a model for projected resource needs in 67 low-income and middle-income countries. Lancet Glob Health. 2017;5(9):e875–e887. doi: 10.1016/S2214-109X(17)30263-2. [DOI] [PMC free article] [PubMed] [Google Scholar]
- 8.Tordrup D., Hutin Y., Stenberg K. Additional resource needs for viral hepatitis elimination through universal health coverage: projections in 67 low-income and middle-income countries, 2016-30. Lancet Glob Health. 2019;7(9):e1180–e1188. doi: 10.1016/S2214-109X(19)30272-4. [DOI] [PubMed] [Google Scholar]
- 9.Toy M., Hutton D.W., Lauer J., Bulterys M., Hutin Y., So S. The “Hep B Calculator”: an online global tool for country-specific cost-effectiveness analyses of hepatitis B treatment. Lancet Gastroenterol Hepatol. 2019;4:668. doi: 10.1016/S2468-1253(19)30223-7. [DOI] [PubMed] [Google Scholar]
- 10.Chhatwal J., Chen Q., Bethea E. Hep C calculator: an online tool for cost-effectiveness analysis of DAAs. Lancet Gastroenterol Hepatol. 2018;3(12):819. doi: 10.1016/S2468-1253(18)30281-4. [DOI] [PubMed] [Google Scholar]
- 11.Toy M., Hutton D.W., So S.K. Cost-effectiveness and cost thresholds of generic and brand drugs in a national chronic hepatitis B treatment program in China. PLoS One. 2015;10 doi: 10.1371/journal.pone.0139876. [DOI] [PMC free article] [PubMed] [Google Scholar]
- 12.Aggarwal R., Chen Q., Goel A. Cost-effectiveness of hepatitis C treatment using generic direct-acting antivirals available in India. PLoS One. 2017;12 doi: 10.1371/journal.pone.0176503. [DOI] [PMC free article] [PubMed] [Google Scholar]
- 13.Nayagam S., Sicuri E., Lemoine M. Economic evaluations of HBV testing and treatment strategies and applicability to low and middle-income countries. BMC Infect Dis. 2017;17(suppl 1):692. doi: 10.1186/s12879-017-2778-x. [DOI] [PMC free article] [PubMed] [Google Scholar]
- 14.Morgan J.R., Servidone M., Easterbrook P., Linas B.P. Economic evaluation of HCV testing approaches in low and middle income countries. BMC Infect Dis. 2017;17(suppl 1):697. doi: 10.1186/s12879-017-2779-9. [DOI] [PMC free article] [PubMed] [Google Scholar]
- 15.Inflation, GDP deflator (annual %). The World Bank. https://data.worldbank.org/indicator/NY.GDP.DEFL.KD.ZG
- 16.Scott N., McBryde E., Thompson A., Doyle J.S., Hellard M.E. Treatment scale-up to achieve global HCV incidence and mortality elimination targets: a cost-effectiveness model. Gut. 2017;66:1507–1515. doi: 10.1136/gutjnl-2016-311504. [DOI] [PubMed] [Google Scholar]
- 17.Health service delivery costs. World Health Organization. https://www.who.int/choice/cost-effectiveness/inputs/health_service/en/
- 18.CHOosing Interventions that are Cost Effective (WHO-CHOICE). World Health Organization. https://www.who.int/choice/toolkit/en/
- 19.McAdam-Marx C., McGarry L.J., Hane C.A., Biskupiak J., Deniz B., Brixner D.I. All-cause and incremental per patient per year cost associated with chronic hepatitis C virus and associated liver complications in the United States: a managed care perspective. J Manag Care Pharm. 2011;17(7):531–546. doi: 10.18553/jmcp.2011.17.7.531. [DOI] [PMC free article] [PubMed] [Google Scholar]
- 20.Macroeconomics and health: investing in health for economic development. Report of the Commission on Macroeconomics and Health. World Health Organization. http://apps.who.int/iris/bitstream/10665/42435/1/924154550X.pdf
- 21.Bertram M.Y., Lauer J.A., De Joncheere K. Cost-effectiveness thresholds: pros and cons. Bull World Health Organ. 2016;94(12):925–930. doi: 10.2471/BLT.15.164418. [DOI] [PMC free article] [PubMed] [Google Scholar]
- 22.Hutin Y., Nasrullah M., Easterbrook P. Access to treatment for hepatitis B virus infection – worldwide, 2016. MMWR Morb Mortal Wkly Rep. 2018;67(28):773–777. doi: 10.15585/mmwr.mm6728a2. [DOI] [PMC free article] [PubMed] [Google Scholar]
- 23.Progress report on access to hepatitis C treatment. World Health Organization. http://apps.who.int/iris/bitstream/handle/10665/260445/WHO-CDS-HIV-18.4-eng.pdf?sequence=1
- 24.FIND and Forum for Collaborative HIV Research High-priority target product profile for hepatitis C diagnosis in decentralized settings: Report of a consensus meeting. April 22, 2015. Vienna, Austria. https://www.finddx.org/wp-content/uploads/2019/03/HCV-TPP-Report_FIND-2015.pdf
- 25.Lemoine M., Shimakawa Y., Njie R. Acceptability and feasibility of a screen-and-treat programme for hepatitis B virus infection in The Gambia: the Prevention of Liver Fibrosis and Cancer in Africa (PROLIFICA) study. Lancet Glob Health. 2016;4(8):e559–e567. doi: 10.1016/S2214-109X(16)30130-9. [DOI] [PubMed] [Google Scholar]
- 26.Nayagam S., Conteh L., Sicuri E. Cost-effectiveness of community-based screening and treatment for chronic hepatitis B in The Gambia: an economic modelling analysis. Lancet Glob Health. 2016;4(8):e568–e578. doi: 10.1016/S2214-109X(16)30101-2. [DOI] [PubMed] [Google Scholar]
- 27.Shiha G., Metwally A.M., Soliman R., Elbasiony M., Mikhail N.N.H., Easterbrook P. An educate, test, and treat programme towards elimination of hepatitis C infection in Egypt: a community-based demonstration project. Lancet Gastroenterol Hepatol. 2018;3(11):778–789. doi: 10.1016/S2468-1253(18)30139-0. [DOI] [PubMed] [Google Scholar]
- 28.World Health Organization A healthier humanity. The WHO investment case for 2019-2023. http://apps.who.int/iris/bitstream/handle/10665/274710/WHO-DGO-CRM-18.2-eng.pdf
- 29.Bertram M.Y., Stenberg K., Brindley C. Disease control programme support costs: an update of WHO-CHOICE methodology, price databases and quantity assumptions. Cost Eff Resour Alloc. 2017;15:21. doi: 10.1186/s12962-017-0083-6. [DOI] [PMC free article] [PubMed] [Google Scholar]
- 30.Hecht R., Hiebert L., Spearman W.C. The investment case for hepatitis B and C in South Africa: adaptation and innovation in policy analysis for disease program scale-up. Health Policy Plan. 2018;33(4):528–538. doi: 10.1093/heapol/czy018. [DOI] [PMC free article] [PubMed] [Google Scholar]
- 31.Hiebert L., Hecht R., Soe-Lin S. A stepwise approach to a national hepatitis C screening strategy in Malaysia to meet the WHO 2030 targets: proposed strategy, coverage, and costs. Value Health Reg Issues. 2019;18:112–120. doi: 10.1016/j.vhri.2018.12.005. [DOI] [PubMed] [Google Scholar]
- 32.Pedrana A., Howell J., Schröder S. Eliminating viral hepatitis: the investment case. Report of the WISH Viral Hepatitis Forum 2018. https://www.wish.org.qa/wp-content/uploads/2018/11/IMPJ6078-WISH-2018-Viral-Hepatitis-181026.pdf
- 33.Chhatwal J., Chen Q., Wang X. Assessment of the feasibility and cost of hepatitis C elimination in Pakistan. JAMA Netw Open. 2019;2(5) doi: 10.1001/jamanetworkopen.2019.3613. [DOI] [PMC free article] [PubMed] [Google Scholar]
- 34.Trickey A., Hiebert L., Perfect C. Hepatitis C virus elimination in Indonesia: epidemiological, cost, and cost-effectiveness modelling to advance advocacy and strategic planning. Liver Int. 2020;40(2):286–297. doi: 10.1111/liv.14232. [DOI] [PubMed] [Google Scholar]
Associated Data
This section collects any data citations, data availability statements, or supplementary materials included in this article.