The use of high-throughput screening (HTS) in the discovery of drug leads is now a widespread practice in pharmaceutical firms.1 Extending the concept to the discovery of asymmetric catalytic reactions requires protocols that rapidly determine enantiomeric excess (ee).2 The most commonly used techniques involve HPLC or GC.3 However, these techniques are not optimal for HTS because of the time and labor involved in their use. Further, during the measurement of ee using these methods, one does not commonly also determine concentration. In contrast, optical techniques are faster, less expensive, and easily amenable to concentration determination.4 Our group has pioneered the use of indicator-displacement assays for the creation of fast optical techniques.5 Here we report an even simpler optical strategy, one that not only quantitates ee and concentration in one measurement, but also differentiates between analytes.
CD spectroscopy is used routinely in organic chemistry and biochemistry to determine structural differences arising from changes in chirality.6 Common organic functional groups overlap each other in approximately the 190–220 nm region of the CD spectra, and therefore interferences make CD measurements directly on crude samples not readily amenable to ee quantitation. To adapt CD techniques to HTS protocols of reaction samples, we sought an analyte binding event that would induce CD spectra at wavelengths longer than 320 nm, where the analytes themselves are CD silent. Although exciton-coupled CD is commonly used in this regard,6a,7 we explored the use of metal-to-ligand charge transfer (MLCT) bands of a simple inorganic coordination complex. Our analytes were chiral and achiral vicinal diamines, such as those for which the Chin group has recently reported asymmetric protocols.8
CD active MLCT bands can arise from achiral complexes upon chiral analyte binding.9 However, we choose to use a chiral metal complex with its own inherent CD spectra as a means to differentiate achiral analytes from chiral analytes.
To create a chiral metal complex that has CD active MLCT transitions we turned to Cu(I) and the ligand BINAP ((R)- or (S)-2,2′-bis (diphenylphosphino)-1,1′-dinaphthyl).10 Cu(I) was used because it is readily oxidized to Cu(II) during MLCT to the BINAP ligand, and because the bisphosphine ligand stabilizes the Cu(I) oxidation state, even in air. Therefore we prepared both enantiomers of [Cu(I)(BINAP)(MeCN)2]PF6 (1), (see Supporting Information).11 Both R and S complexes show MLCT bands around 340 nm, and the enantiomers give opposite Cotton effects (Supporting Information, Figure S2). There are no CD signals above 300 nm for the chiral diamine analytes, copper alone with the diamines, nor of free BINAP. Therefore, any signals above this wavelength would be indicative of the chirality, identity, and concentration of an analyte.
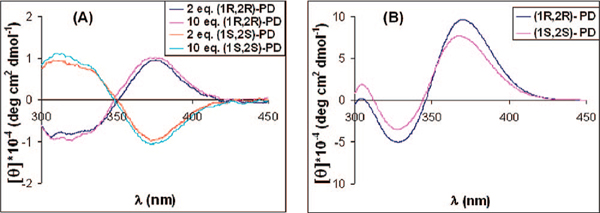
We first focused upon differentiating chirality and thereby analyzed a racemic mixture of 1 with the enantiomers of 1,2-diphenylethylenediamine (PD). With the addition of the two enantiomers of PD, the CD showed that the MLCT bands of 1 were sensitive to the analyte, and that the enantiomeric analytes gave equal and opposite CD spectra (Figure 1A). The rest of the studies discussed below employ (R)-1 so that meso analytes can be differentiated.
Figure 1.
(A) CD spectrum of (Rac)-1 [0.4 mM] with PD (2 equiv [0.8 mM] and 10 equiv [4 mM]); (B) CD spectrum for (R)-1 [0.4 mM] and 2 equiv of the enantiomers of PD [0.8 mM].
To demonstrate the ability to distinguish enantiomers as well as chemical identity, we studied the interaction of the analytes shown in Scheme 1A-D with (R)-1. Each diamine, as well as the enantiomers thereof, leads to different CD active MLCT bands (see Supporting Information, Figure S3). As representative examples, the CD spectra produced by the addition of 2 equiv of either (1R,2R)-PD or (1S, 2S)-PD to a solution of (R)-1 in acetonitrile are shown in Figure 1B.
Scheme 1.
Diamines Employed as Analytesa a (A) 1,2-diphenylethylenediamine (PD), (B) 1,2-diaminocyclohexane (DC), (C) 1,2-diaminopropane (DP), (D) bis-(4-methoxyphenyl)-1,2-diaminoethane (MD).
The greatest difference between the CD spectra of the enantiomeric complexes with (R)-1 was DC > PD > MD ∼ DP, thereby reflecting the ordering of enantiodiscrimination (see a representative titration in Figure S4). Discrimination of all the analytes involved recording the CD spectra of each at 0.8 mM concentration, and to ensure reproducibility each experiment was performed five times. The data was analyzed at four different wavelengths (320, 335, 360, 373 nm), and subjected to linear discriminate analysis (LDA) for fingerprinting.12
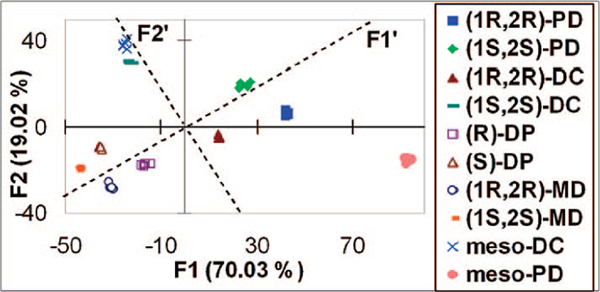
The LDA plot shows excellent discrimination for all the diamines and their enantiomers (Figure 2). The responses are clustered into tight distinct groupings. Because we used a chiral host, we could also discriminate diastereomeric analytes, such as meso-DC and PD, from their chiral analogues. A rotation of the PC axes (dashed lines in Figure 2) defines chemoselectivity along F1′, and chirality along F2′, with negative and positive scores for (R)- and (S)-diamines, respectively. Using the enantiomeric receptor (S)-1 leads to similar chemoselective responses, but opposite enantioselectivity (Figure S5), and as expected, the same response was found for the meso-diamines. The accuracy of the LDA classification was examined using a jackknife analysis,13 and 100% accuracy in chemo- and enantiodiscrimination was found.
Figure 2.
Response patterns for all the analytes using (R)-1 receptor obtained by LDA.
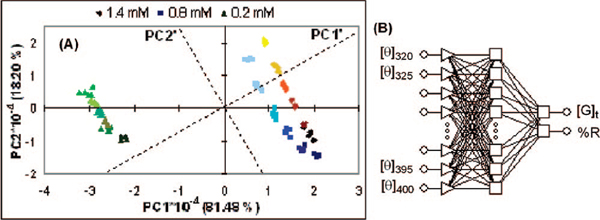
Having found chemo- and enantioselectivity, the next goal was to explore the ability to simultaneously quantitate concentration and enantiomeric excess (ee) for a known analyte. For this purpose we recorded CD spectra of (R)-1 at three different total concentrations of PD ([G]t: 0.2, 0.8, and 1.4 mM), along with six ee values at each concentration (1, 0.6, 0.2, −0.2, −0.6, and −1; expressed as %R in the data). Five replicates were done at each ee and [G]t. This data was analyzed using PCA (Figure 3A).12 A slightly rotated axis shows concentration along PC1′ and ee along PC2′. Clearly the CD technique described allows for chemo- and enantiodis-crimination, as well as concentration determination. Given this success, we moved to creating a screening technique.
Figure 3.
(A) Two-dimensional PCA plot of PD with three ee trainings sets at three different [G]t values: 0.2, 0.8, and 1.4 mM. (B) Structure of the MLP used to analyze the data of PD represented in the PCA plot.
We employed multilayer perceptron (MLP) artificial neural networks (ANN)14 as the protocol for HTS.5d,15 To quickly test the viability of an ANN approach, the data used to generate Figure 3A was used for the input layer, consisting of 17 ellipticities from CD320 to CD400 at 5 nm intervals, while the hidden layer consisted of 14 nodes (see Figure 3B). Two unknown samples, prepared completely separate and independent of the training set, were subjected to the ANN. The calculated values of [G]t and %R were off by 11.8% and 15.8%, respectively (see Supporting Information, Table S1). These encouraging results prompted us to immediately proceed to creating a technique amenable to HTS.
For HTS we moved to a robotically controlled 96-well plate CD reader (JASCO ASU-605). A subset of the wells was designated as the ANN training set, defined again as seventeen ellipticities from CD320 to CD400 at 5 nm intervals. These wells were loaded with 0.4 mM (R)-1 in acetronitrile and charged with three concentrations of PD (0.2 mM, 0.8 mM, 1.4 mM), and for each concentration 11 ee values (1, 0.8, 0.6, 0.4, 0.2, 0, −0.2, −0.4, −0.6, −0.8, and −1, expressed as %R in the data). The same plate was loaded with four unknowns created independent of the training set. The training set data resulted in a MLP-ANN with nine hidden layers. The four unknowns were computed, and the values of [G]t and %R had average errors of only 7.7% and 2.6%, respectively (Table S2).
In summary, we described a technique that fingerprints chemical identity, chirality, and concentration, a heretofore-unachieved result. In our final analysis, thirty-three training sets and four unknowns were read in approximately 74 min. It takes just under two minutes for the CD-spectrometer/robot to complete all operations: sample loading, reading, and washing. If the entire 96-well plate were utilized, again with 33 wells dedicated as the training set, it would allow for the determination of 63 ee values, along with their associated concentrations, in approximately 2 hours. Relative to conventional HPLC and GC, this improvement in speed is clearly amenable to high-throughput screening.
Supplementary Material
Acknowledgment.
This work was supported by the National Institutes of Health, Grant GM77437 and the Welch Foundation. The authors thank James Canary and Brad Holliday for helpful suggestions. S.N. thanks the Spanish Ministry of Education and Science for a postdoctoral fellowship.
Footnotes
Supporting Information Available: Experimental procedures, and crystallographic data (CIF). This material is available free of charge via the Internet at http://pubs.acs.org.
References
- (1)(a).Marchelli R; Dossena A; Palla G. Trends Food Sci. Technol 1996, 7, 113. [Google Scholar]; (b) Reetz MT Angew. Chem., Int. Ed 2001, 40, 284. [PubMed] [Google Scholar]
- (2)(a).Wahler D; Reymond J-L Curr. Opin. Biotechnol 2001, 12, 535. [DOI] [PubMed] [Google Scholar]; (b) Stambuli JP; Hartwig JF Curr. Opin. Chem. Biol 2003, 7, 420. [DOI] [PubMed] [Google Scholar]; (c) Gennari C; Piarulli U. Chem. ReV 2003, 103, 3071. [DOI] [PubMed] [Google Scholar]
- (3)(a).Welch CJ; Grau B; Moore J; Mathre DJ J. Org. Chem 2001, 66, 6836. [DOI] [PubMed] [Google Scholar]; (b) Sigman MS; Jacobsen EN J. Am. Chem. Soc 1998, 120, 4901. [Google Scholar]; (c) Wolf C; Hawes PA J. Org. Chem 2002, 67, 2727. [DOI] [PubMed] [Google Scholar]
- (4)(a).Lin J; Zhang HC; Pu L. Org. Lett 2002, 4, 3297. [DOI] [PubMed] [Google Scholar]; (b) Lee SJ; Lin WJ Am. Chem. Soc 2002, 124, 4554. [DOI] [PubMed] [Google Scholar]; (c) Ahn KH; Ku H-Y; Kim Y; Kim S-G; Kim YK; Son HS; Ku JK Org. Lett 2003, 5, 1419. [DOI] [PubMed] [Google Scholar]; (d) Corradini R; Paganuzzi C; Marchelli R; Pagliari S; Sforza S; Dossena A; Galaverna G; Duchateau A. J. Mater. Chem 2005, 15, 2741. [DOI] [PubMed] [Google Scholar]
- (5)(a).Zhu L; Anslyn EV J. Am. Chem. Soc 2004, 126, 3676. [DOI] [PubMed] [Google Scholar]; (b) Folmer-Andersen JF; Lynch VM; Anslyn EV J. Am. Chem. Soc 2005, 127, 7986. [DOI] [PubMed] [Google Scholar]; (c) Zhu L; Zhong Z; Anslyn EV J. Am. Chem. Soc 2005, 127, 4260. [DOI] [PubMed] [Google Scholar]; (d) Zhu L; Shabbir SH; Anslyn EV Chem. Eur. J 2006, 13, 99. [DOI] [PubMed] [Google Scholar]; (e) Folmer-Andersen JF; Kitamura M; Anslyn EV J. Am. Chem. Soc 2006, 128, 5652. [DOI] [PubMed] [Google Scholar]
- (6)(a).Nakanishi K; Berova N; Woody RW Circular Dichroism. Principles and Applications VCH Publishers, Inc.: New York, 1994. [Google Scholar]; (b) Beychok S. Science 1966, 154, 1288. [DOI] [PubMed] [Google Scholar]
- (7)(a).See for example: Zahn S; Canary JW Science 2000, 288, 1404. [DOI] [PubMed] [Google Scholar]; (b) Holmes AE; Debasis D; Canary JW J. Am. Chem. Soc 2007, 129, 1506. [DOI] [PubMed] [Google Scholar]
- (8)(a).Chin J; Mancin F; ThavaBeriva N; Lee D; Lough A; Chung DS J. Am. Chem. Soc 2003, 125, 15276. [DOI] [PubMed] [Google Scholar]; (b) Kim H-J; Kim H; Jeong EJ; Thavarajah N; Studnicki L; Koprianiuk A; Lough AJ; Suh J; Chin JJ Am. Chem. Soc 2005, 127, 16370. [DOI] [PubMed] [Google Scholar]
- (9).Rodger A; Patel KK; Sanders KJ; Datt M; Sacht C; Hannon MJJ Chem. Soc., Dalton Trans 2002, 3656. [Google Scholar]
- (10).Noyori R. AdV. Synth. Catal. 2003, 15, 345. [Google Scholar]
- (11)(a).Ferraris D; Young B; Dudding T; Lectka TJ Am. Chem. Soc 1998, 120, 4548. [Google Scholar]; (b) Ferraris D; Young B; Cox C; Drury WJ III; Dudding T; Lectka TJ Org. Chem 1998, 63, 6090. [DOI] [PubMed] [Google Scholar]
- (12).Jurs PC; Baken GA; McClelland HE Chem. ReV 2000, 100, 2649. [DOI] [PubMed] [Google Scholar]
- (13).Gong GJ Am. Stat. Assoc 1986, 81, 108. [Google Scholar]
- (14).Burns JA; Whitesides GM Chem. ReV 1993, 93, 2583. [Google Scholar]
- (15)(a).Wiskur SL; Floriano PN; Anslyn EV; McDevitt JT Angew. Chem., Int. Ed 2003, 42, 2070. [DOI] [PubMed] [Google Scholar]; (b) McCleskey SC; Floriano PN; Wiskur SL; Anslyn EV; McDevitt JT Tetrahedron 2003, 59, 10089. [Google Scholar]
Associated Data
This section collects any data citations, data availability statements, or supplementary materials included in this article.


