

Abstract
The floral fragrance of plants is an important indicator in their evaluation. The aroma of sweet cherry flowers is mainly derived from their essential oil. In this study, based on the results of a single-factor experiment, a Box–Behnken design was adopted for ultrasound- and microwave-assisted extraction of essential oil from sweet cherry flowers of the Brooks cultivar. With the objective of extracting the maximum essential oil yield (w/w), the optimal extraction process conditions were a liquid–solid ratio of 52 mL g−1, an extraction time of 27 min, and a microwave power of 435 W. The essential oil yield was 1.23%, which was close to the theoretical prediction. The volatile organic compounds (VOCs) of the sweet cherry flowers of four cultivars (Brooks, Black Pearl, Tieton and Summit) were identified via headspace solid phase microextraction (SPME) and gas chromatography–mass spectrometry (GC–MS). The results showed that a total of 155 VOCs were identified and classified in the essential oil from sweet cherry flowers of four cultivars, 65 of which were shared among the cultivars. The highest contents of VOCs were aldehydes, alcohols, ketones and esters. Ethanol, linalool, lilac alcohol, acetaldehyde, (E)-2-hexenal, benzaldehyde and dimethyl sulfide were the major volatiles, which were mainly responsible for the characteristic aroma of sweet cherry flowers. It was concluded that the VOCs of sweet cherry flowers were qualitatively similar; however, relative content differences were observed in the four cultivars. This study provides a theoretical basis for the metabolism and regulation of the VOCs of sweet cherry flowers.
Subject terms: Plant sciences, Chemistry
Introduction
Volatile organic compounds (VOCs) represent an important part of the plant metabolome and attract agronomic and biological interest due to their contribution to fruit aroma and flavor and, therefore, to fruit quality. Analysis of the composition of VOCs in plant flowers is a prerequisite for the application of their extracts1,2. The extraction/isolation techniques of VOCs include simultaneous distillation and solvent extraction (SDE), supercritical fluid extraction (SFE), hydrodistillation (HD), microwave-assisted hydrodistillation (MAHD), cold-press (CP), headspace (HS) extraction, and solid phase microextraction (SPME)3–6. Gas chromatography–mass spectrometry (GC–MS) is commonly employed to detect VOCs. Conventional extraction methods (such as SDE, HD, etc.) have problems such as a low extraction rate and weak extract activity, which restrict the development and application of plant extracts. Therefore, microwave, oscillation, and ultrasonication extraction methods have also been proposed. The purpose of using the combined ultrasound- and microwave-assisted extraction (UMAE) technique for the extraction is to alternative conventional extraction techniques, because UMAE is inexpensive, simple, rapid, green and efficient. Generally, UMAE will not affect the quality of essential oil extraction and the extraction yield was significantly increased via the UMAE method instead of conventional extraction methods7–10. e.g. UMAE was usually employed to extract essential oils, total flavonoids, dihydroquercetin etc. from seed, flower, bark, xylem of plant11–13. As a viable extraction technique, this method combined with GC/MS or UPLC/MS can be used as a routine analysis strategy for essential oil in plant. Due to the rapid development of analytical instruments and sample preparation techniques, floral fragrance research has gradually intensified. By the detection and analysis of HS-SPME/GC–MS, the VOCs of many common plant flowers have been initially identified14.
Many plants and flowers in nature emit aromas, and many aroma components are mixed to form a floral fragrance; different aroma components and their content differences provide their unique characteristics15. Floral fragrance is one of the important traits that are considered in evaluating ornamental plants. The fragrances of plant flowers are derived from various volatiles released from petals or flowers. Studies have shown that aroma is derived from the secondary metabolites of flowers, and major components are volatile small molecule compounds, such as terpenes, phenylpropionic acids and fatty acid derivatives16,17. During the flowering process, the types, contents and proportions of aroma components have a strong influence in attracting pollinators to forage. By volatilization, the smell of some flowers not only generates a signal to stimulate the immune response to self-heal but also has an important role in plant resistance to various stresses18. The VOCs of many plants possess obvious aromatic effects and medicinal value. The research focus on floral fragrance gives attention to the aroma of flowers with metabolomics and genomics19,20 and focuses on the relationship between aroma components and regulatory mechanisms21,22.
Sweet cherry (Prunus avium L.), which is also known as large cherry, is a fleshy stone fruit that belongs to the genus Prunus, and it is grown in specific regions with temperate climates23. The color of sweet cherry fruit is bright, and the fruit is sweet, delicious, and rich in nutrients24. In southern China, the introduction and cultivation of sweet cherries has experienced problems, such as a low rate of fruit set, serious fruit drop, unstable yield and fruit malformation, which have seriously affected the development of the sweet cherry industry in the region. Some scholars have explained the effect of temperature on the flowering and fruiting of sweet cherry introduced in the southern region from the aspects of cold demand, flower bud differentiation process and rate, embryo development, and quality and fruit setting25. Lech et al.26 analyzed the flowering of several sweet cherry cultivars in the climatic conditions of southern Poland. In addition, Legua et al.27 investigated the bioactive and volatile compounds in sweet cherry fruits. However, related research on the VOCs of sweet cherry flowers is lacking. The aroma of sweet cherry flowers is mainly derived from its essential oil. In this experiment, sweet cherry flowers from four cultivars were utilized as the research object; their essential oils were extracted, which provide a reference for the utilization of the essential oil of sweet cherry flowers. The identification of their VOCs will provide a scientific basis for elucidating the floral fragrance formation mechanism, metabolism and regulation.
Materials and methods
Plant material
The samples (blooming flowers were gathered in early April) of the sweet cherry cultivars Brooks, Black Pearl, Tieton and Summit were collected in 2020 from the Baiyi fruit tree experimental base of Guiyang Wudang at the Guizhou Institute of Fruit Tree Science (27°03′3.89″N and 106°25′47.23″E). The trees were 5 years old, and they were grafted onto “Gisela 6” root stock and planted under rain-shelter conditions in March 2015. All trees were managed with the same practical techniques. Identification of plant material was initially performed using morphological features and then confirmed by Prof. Xiang Wang at the Kaili University. A voucher specimen (No. 1033) has been deposited in the herbarium of our laboratory. The samples (well-developed flowers from the base of the shoots) from the same location were harvested from each tree. After they were washed with distilled water, the fresh samples were immediately loaded into a sampling bottle with a 50 mL-vial volume, in which the flower sample was placed. The fresh samples were tested two hours after they were transported to a laboratory.
Extraction method
The 5.000 g flower sample of the Brooks sweet cherry cultivar was placed in a special flask for UMAE. Methanol:chloroform:ddH2O (5:2:2, v/v/v) mixed solution was added, and the flask was placed in the UMAE apparatus. The microwave extraction power was adjusted; the ultrasonic power was set to 50 W; the extraction time was set; the filter was vacuumed the filter residue was discarded; and then the collected extracting solution was poured into a rotary evaporator. The next step was to retrieve solvents by reduced pressure distillation, and the extracts were obtained at the same time.
A simultaneous UMAE apparatus (XO-SM, Nanjing Xianou Instrument Manufacturing Co., Ltd., China) shown in Fig. 1 was applied for sample extraction.
Figure 1.

Schematic diagram of simultaneous ultrasound- and microwave-assisted extracting apparatus.
The parameter of UMAE show in Table 1; Rotary Evaporator; model R-201D, produced by Shanghai Yike Instrument Co., Ltd. (Shanghai, China); and 7890B-5977B GC–MS, Agilent Technologies Co. Ltd. (California, USA). Methanol (CAS: 67-56-1) and chloroform (CAS: 67-66-3) were purchased from Tianjin Sayfo Technology Co., Ltd. (Tianjin, China).
Table 1.
Parameter of ultrasound- and microwave-assisted extracting apparatus.
| Model | Ultrasonic power | Ultrasonic frequency | Microwave power | Microwave frequency | Capacity | Ultrasonic probe diameter |
|---|---|---|---|---|---|---|
| XO-SM | 0–900 W | 25 kHz | 0–700 W | 2450 MHz | 0.5–500 mL | Φ 6 mm |
Single-factor experiment
The purpose of this single-factor experiment was to investigate the effects of three factors (liquid–solid ratio, extraction time, and microwave power) on the yield (w/w) of sweet cherry flower essential oil (Table 2).
Table 2.
Factors and levels in the single-factor experiment.
| Factors | Level | |||||
|---|---|---|---|---|---|---|
| 1 | 2 | 3 | 4 | 5 | 6 | |
|
A Liquid–solid ratio/mL g−1 |
10 | 20 | 30 | 40 | 50 | 60 |
|
B Extraction time/min |
5 | 10 | 15 | 20 | 25 | 30 |
|
C Microwave power/W |
100 | 200 | 300 | 400 | 500 | 600 |
Response surface methodology experiments
For the response surface methodology and experimental design scheme, three factors were selected as independent variables, namely, the liquid–solid ratio, extraction time and microwave power, and the yield of sweet cherry flower essential oil was the response value.
HS-SPME/GC–MS conditions
According to the best process parameters obtained by optimizing the extraction of Brooks flower essential oil, Black Pearl, Tieton and Summit flower essential oils were extracted. After sampling, the 1 mL samples were immediately submitted to the HS-SPME/GC–MS system. Volatiles were isolated by SPME (50 °C), which included oscillation for 15 min and extraction for 30 min (250 RPM) using the CTC triad automatic sampler (Extractor head: 50/30 μm DVB/CAR on PDMS). Gas chromatography was performed on a DBwax (30 m × 0.25 mm × 0.25 µm) to separate the volatile compounds at a constant flow of 1 mL min−1 helium. The injection temperature was 260 °C. The temperatures of the column and ion source were 40 °C and 230 °C, respectively. The temperature-rise program was followed by an initial temperature of 5 °C for 5 min, 20 °C min−1 with a maximum rate of 250 °C and then held constant for 2.5 min. Mass spectrometry (EI+, 70 eV) was determined by a full-scan method with a range from 200 to 400 (m z−1). The classification was referred from NIST 201428–30.
Statistical analyses
Statistical analysis was performed using the SPSS Statistics Version 21.0 software (Chicago, IL, USA). Duncan’s multiple comparisons test (p < 0.05) was performed to assess the statistically significant differences between the mean values (means) of three replications. Origin 9.1 (Origin Lab, Northampton, MA, USA) was employed to construct the graphs.
Results and discussion
Selection of factors and their levels by single-factor analysis
With an extraction time of 20 min and a microwave power of 400 W, the influence of the liquid–solid ratio on yield was investigated; the results are shown in Fig. 2. As the amount of solvent increases, the yield of sweet cherry flower essential oil increases and then becomes stable. When the liquid–solid ratio is 60 mL g−1, the yield approaches the maximum, perhaps because as the amount of solvent increases, the contact area between the solvent and the raw material increases, and the essential oil can be fully dissolved. However, when the amount of solvent is too high, the solvent absorbs more microwave energy, and the absorption of microwave energy by the raw material decreases, which causes a decrease in the ability of the microwave to damage raw material cells, and the yield of essential oils only slightly changes31. After comprehensive consideration, a liquid–solid ratio of 40 mL g−1 is selected.
Figure 2.

Effect of the liquid–solid ratio, extraction time and microwave power on the yield of sweet cherry flower essential oil.
With a liquid–solid ratio of 40 mL g−1 and microwave power of 400 W, the effect of extraction time on the yield of essential oils was investigated. It can be seen from Fig. 2 that with an extension of extraction time, the yield increases and then gradually becomes stable with minimal change after 20 min. In a certain period, with an extended microwave treatment time, the raw material absorbs more microwave energy; the cell rupture is more sufficient; and the essential oil dissolves more. Thus, the yield continues to rise. However, as the microwave treatment time continues to increase, the essential oil inside the raw material is completely extracted, and further increases in the extraction time have a minimal effect on the yield32. Therefore, 20 min is an appropriate extraction time.
With a liquid–solid ratio of 40 mL g−1 and an extraction time of 20 min, the influence of microwave power on yield was investigated. The results are shown in Fig. 2. As the microwave power increases, the yield gradually increases and reaches a maximum at 400 W. At a power greater than 400 W, the yield decreases slightly. A microwave extracts essential oils by desorption. With an increase in microwave power, the heating rate increases; the cell wall quickly ruptures; and a large amount of essential oils dissolves. However, when the microwave power is too high, the heat-sensitive compounds in the essential oil will oxidize and decompose, which causes a decrease in yield. The experimental results of this study are consistent with the viewpoint of Routray and Valérie33. Usually, the microwave extraction yield will increase with the temperature, and after a certain optimum temperature is reached, further heating will not increase the yield. This result may be due to the increase in molecular migration and solute dissolution rate during the heating process. However, if the temperature is too high, the energy consumption will increase, and the extraction yield will not increase significantly. Therefore, the optimum microwave power is 400 W.
Model fitting and effect of UMAE factors on yield
Based on the results of a single-factor experiment, three factors were selected as independent variables: the liquid–solid ratio (A), extraction time (B), and microwave power (C). The essential oil yield (Y) was the response value. The factors and levels are shown in Table 3. The Box–Behnken design and results are shown in Table 4. The binary polynomial regression model equation fitted by the software is:
| 1 |
Table 3.
Factors and levels in the response surface design.
| Factors | Level | ||
|---|---|---|---|
| − 1 | 0 | 1 | |
|
A Liquid–solid ratio/mL g−1 |
40 | 50 | 60 |
|
B Extraction time/min |
20 | 25 | 30 |
|
C Microwave power/W |
300 | 400 | 500 |
Table 4.
Box–Behnken experimental design and results.
| No | A Liquid–solid ratio |
B Extraction time |
C Microwave power |
Y Yield/% (w/w) |
No | A Liquid–solid ratio |
B Extraction time |
C Microwave power |
Y Yield/% (w/w) |
|---|---|---|---|---|---|---|---|---|---|
| 1 | 60 | 25 | 500 | 1.20 | 10 | 50 | 25 | 400 | 1.23 |
| 2 | 60 | 25 | 300 | 1.08 | 11 | 50 | 30 | 300 | 1.13 |
| 3 | 40 | 20 | 400 | 1.14 | 12 | 50 | 20 | 500 | 1.16 |
| 4 | 60 | 30 | 400 | 1.18 | 13 | 50 | 25 | 400 | 1.23 |
| 5 | 50 | 20 | 300 | 1.11 | 14 | 60 | 20 | 400 | 1.12 |
| 6 | 50 | 25 | 400 | 1.25 | 15 | 50 | 25 | 400 | 1.22 |
| 7 | 40 | 25 | 300 | 1.00 | 16 | 40 | 25 | 500 | 1.13 |
| 8 | 50 | 25 | 400 | 1.24 | 17 | 50 | 30 | 500 | 1.19 |
| 9 | 40 | 30 | 400 | 1.13 |
A variance analysis was performed using the regression model equation, and a significance analysis was performed using the model coefficients. As shown in the Table 5 model variance analysis results, the Model P-value of 0.0025 implies that the model is significant. The probability of this large “Model F-Value” is due to noise. Values of “Prob > F” less than 0.05 indicate that the model terms are significant. R2 = 0.9318 and Adj R2 = 0.8442 are near 1, which means that a 93.18% variation in the yield (w/w) of sweet cherry flower essential oil can be explained by the model. The quadratic polynomial regression model employed in the experiment shows a high degree of significance, which indicates that the experimental data fit the regression mathematical model and can better predict the actual values of various indicators34.
Table 5.
Analysis of variance for the regression model.
| Source | Sum of squares | Degrees of freedom of variation | Mean square | F value | Prob > F |
|---|---|---|---|---|---|
| Model | 0.065 | 9 | 7.25E−03 | 10.63 | 0.0025 |
| A-Liquid–solid ratio | 4.05E−03 | 1 | 4.05E−03 | 5.94 | 0.0449 |
| B-Extraction time | 1.25E−03 | 1 | 1.25E−03 | 1.83 | 0.2177 |
| C-Microwave power | 0.016 | 1 | 0.016 | 23.77 | 0.0018 |
| AB | 1.23E−03 | 1 | 1.23E−03 | 1.8 | 0.2219 |
| AC | 2.50E−05 | 1 | 2.50E−05 | 0.037 | 0.8535 |
| BC | 2.50E−05 | 1 | 2.50E−05 | 0.037 | 0.8535 |
| A2 | 0.02 | 1 | 0.02 | 28.78 | 0.001 |
| B2 | 2.28E−03 | 1 | 2.28E−03 | 3.34 | 0.1103 |
| C2 | 0.017 | 1 | 0.017 | 24.72 | 0.0016 |
| Residual | 4.77E−03 | 7 | 6.81E−04 | ||
| Lack of fit | 4.25E−03 | 3 | 1.42E−03 | 10.9 | 0.0215 |
| Pure error | 5.20E−04 | 4 | 1.30E−04 | ||
| Cor toal | 0.07 | 16 | |||
| R2 | 0.9318 | ||||
| Adj R2 | 0.8442 | ||||
| Pred R2 | 0.0166 | ||||
| C.V.% | 2.25 |
Values of “Prob > F” less than 0.05 indicate that the model terms are significant, and values greater than 0.10 indicate that the model terms are not significant.
Design Expert 8.0 software was utilized to perform quadratic multiple regression fitting of the data in Table 4. The response surface results of the quadratic regression equation are shown in Fig. 3. As shown in Fig. 3a, as the liquid–solid ratio increased, the yield appears to increase and then decrease in certain microwave power conditions. As shown in Fig. 3e, in certain liquid–solid ratio conditions, with an increase in the microwave power, the yield also appears to increase and then decrease. In this case, A, C, A2, and C2 are significant model terms, and B, AB, AC, BC, and B2 are nonsignificant model terms. By the response surface analysis of the regression model, with the goal of maximizing the yield of sweet cherry flower essential oil, the optimal extraction conditions for UMAE are a liquid–solid ratio of 52.06 mL g−1, an extraction time of 26.83 min, and microwave power of 435.94 W. In these extraction conditions, the regression equation model predicts the yield of sweet cherry flower essential oil to be 1.24667%. Considering the feasibility of the actual operating conditions, the extraction condition parameters were revised to a liquid–solid ratio of 52 mL g−1, an extraction time of 27 min, and microwave power of 435 W. The actual yield of essential oils measured by 3 parallel experiments is 1.23%, which is near the predicted value and indicates that the regression equation model can better simulate and predict the yield of sweet cherry flower essential oils.
Figure 3.

Response surface (a,c,e) and contours (b,d,f) of the effects of the liquid–solid ratio, extraction time and microwave power.
Identification of VOCs of sweet cherry flower essential oil
The extraction of VOCs from samples is a key link in the analysis of aromatic components. In the past, solvent extraction was employed to extract aromatic compounds, but due to its defects, this method could not completely extract VOCs from the samples, which affects the accuracy of the analysis results35–37. In this study, the HS-SPME was utilized to enrich the volatile and semivolatile components in the sample, combined with GC–MS technology to analyze, identify, and compare the aroma components of sweet cherry flower essential oil. This method offers high sensitivity and simple operation and is convenient and fast. The total ion chromatogram of the sweet cherry flower essential oils by HS-SPME/GC–MS separation analysis is shown in Fig. 4 The total ion chromatogram in four cultivars is similar, but the peak area with the same retention time is different. In this study, a total of 155 VOCs (Table 6) of 11 different chemical groups were separated and identified in the Brooks, Black Pearl, Tieton and Summit sweet cherry cultivars. Sweet cherry flower essential oils from different cultivars have different numbers and relative contents of VOCs.
Figure 4.

Total ion chromatogram of sweet cherry flower essential oils.
Table 6.
Volatile organic compounds identified in four sweet cherry cultivar flower essential oils by HS-SPME/GC–MS.
| Peak no | Compound | Molecular formula | RT/min | Relative content/% | |||
|---|---|---|---|---|---|---|---|
| Brooks | Black pearl | Tieton | Summit | ||||
| 1 | Acetaldehyde | C2H4O | 1.94 | 5.68 | 5.57 | 6.13 | 4.47 |
| 2 | Dimethyl sulfide | C2H6S | 2.11 | 5.56 | 5.54 | 5.78 | 5.92 |
| 3 | Trimethylene oxide | C3H6O | 2.29 | – | 1.09 | – | – |
| 4 | Octane | C8H18 | 2.36 | 1.59 | 1.67 | 1.71 | 1.79 |
| 5 | Propanal, 2-methyl- | C4H8O | 2.43 | 2.40 | 2.55 | 2.72 | 3.01 |
| 6 | Ethyl ether | C4H10O | 2.52 | – | – | 0.82 | – |
| 7 | 2-Propenal | C3H4O | 2.68 | – | 0.13 | – | 0.13 |
| 8 | Cyclotrisiloxane, hexamethyl- | C6H18O3Si3 | 2.76 | 0.81 | 0.59 | 0.48 | 0.48 |
| 9 | Butanal | C4H8O | 2.97 | 0.14 | 0.15 | 0.10 | 0.12 |
| 10 | CH3C(O)CH2CH2OH | C4H8O2 | 3.11 | 1.55 | 1.40 | 1.78 | 1.45 |
| 11 | Furan, 3-methyl- | C5H6O | 3.19 | – | 0.22 | 0.19 | 0.18 |
| 12 | Butanal, 2-methyl- | C5H10O | 3.45 | 2.21 | 2.73 | 2.55 | 3.38 |
| 13 | Butanal, 3-methyl- | C5H10O | 3.51 | 2.17 | 2.66 | 2.47 | 2.96 |
| 14 | Ethanol | C2H6O | 4.07 | 13.67 | 13.68 | 20.67 | 15.42 |
| 15 | Cyclohexene, 1-methyl- | C6H9CH3 | 4.16 | – | – | – | 1.96 |
| 16 | Heptane, 2,2,4,6,6-pentamethyl- | C12H26 | 4.35 | – | 0.71 | 0.70 | 0.56 |
| 17 | 2-Ethylacrolein | C5H8O | 4.43 | – | – | – | 0.31 |
| 18 | Propanoic acid, 2-methyl-, ethyl ester | C6H12O2 | 4.48 | 0.88 | 0.85 | 0.56 | 0.81 |
| 19 | 3-Pentanone | C5H10O | 4.70 | – | 1.83 | 0.72 | – |
| 20 | Decane | C10H22 | 5.34 | 0.11 | 0.04 | 0.17 | 0.04 |
| 21 | trans-4-Dimethylamino-4′-methoxychalcone | C18H19NO2 | 5.68 | 0.45 | – | – | – |
| 22 | (1R)-2,6,6-Trimethylbicyclo[3.1.1]hept-2-ene | C10H16 | 5.80 | 0.55 | – | 0.21 | 0.37 |
| 23 | 2-Butanol | C4H10O | 6.22 | 0.09 | – | – | 0.07 |
| 24 | 2-Butenal, (E)- | C4H6O | 6.34 | 1.49 | 0.89 | 1.90 | 0.58 |
| 25 | 1-Propanol | C3H8O | 6.60 | 0.41 | 0.30 | 0.31 | 0.32 |
| 26 | Butanoic acid, 2-methyl-, ethyl ester | C7H14O2 | 6.89 | 0.14 | 0.14 | 0.12 | 0.14 |
| 27 | Butanoic acid, 3-methyl-, ethyl ester | C7H14O2 | 7.37 | 0.14 | 0.28 | 0.14 | 0.15 |
| 28 | Hexanal | C6H12O | 7.71 | 2.36 | 2.78 | 2.49 | 2.25 |
| 29 | 2-Butenal, 2-methyl- | C5H8O | 7.99 | 0.20 | 0.20 | 0.21 | 0.45 |
| 30 | .beta.-Pinene | C10H16 | 8.14 | – | – | – | 0.08 |
| 31 | Tetrasiloxane, decamethyl- | C10H30O3Si4 | 8.48 | – | – | – | 0.07 |
| 32 | 1-Propanol, 2-methyl- | C4H10O | 8.61 | 0.11 | 0.09 | 0.12 | 0.24 |
| 33 | 1-Butanol, 3-methyl-, acetate | C7H14O2 | 8.94 | 0.03 | 0.04 | 0.04 | 0.14 |
| 34 | 2-Pentenal, (E)- | C5H8O | 9.17 | – | 0.32 | 0.11 | 0.36 |
| 35 | o-Xylene | C8H10 | 9.20 | – | – | 0.12 | – |
| 36 | 3-Hexenal | C6H10O | 9.42 | – | 0.62 | 0.32 | – |
| 37 | .alpha.-Phellandrene | C10H16 | 9.88 | 0.03 | – | – | – |
| 38 | .beta.-Myrcene | C10H16 | 10.01 | 0.46 | 0.19 | 0.32 | 0.24 |
| 39 | 2-Butenoic acid, ethyl ester, (E)- | C6H10O2 | 10.27 | – | – | 0.36 | – |
| 40 | 1-Butanol | C4H10O | 10.37 | 0.10 | 0.09 | 0.11 | – |
| 41 | 1-Penten-3-ol | C5H10O | 10.74 | – | 0.29 | – | – |
| 42 | Heptanal | C7H14O | 10.90 | 0.09 | 0.10 | 0.08 | 0.15 |
| 43 | d-Limonene | C10H16 | 10.98 | 0.15 | 0.06 | 0.12 | – |
| 44 | Limonene | C10H16 | 11.04 | – | – | – | 0.07 |
| 45 | Cyclopentasiloxane, decamethyl- | C10H30O5Si5 | 11.10 | 0.64 | 0.94 | 0.72 | 0.76 |
| 46 | Dodecane | C12H26 | 11.21 | 0.25 | – | 0.28 | 0.18 |
| 47 | .beta.-Phellandrene | C10H16 | 11.27 | 0.12 | – | 0.15 | – |
| 48 | (2R,5R)-2-Methyl-5-(prop-1-en-2-yl)-2-vinyltetrahydrofuran | C10H16O | 11.67 | 0.17 | 0.15 | 0.12 | 0.13 |
| 49 | (E)-2-Hexenal | C6H10O | 12.12 | 8.51 | 16.50 | 10.10 | 10.78 |
| 50 | 1-Butanol, 3-methyl- | C5H12O | 12.17 | 2.23 | – | 2.32 | 2.53 |
| 51 | Furan, 2-pentyl- | C9H14O | 12.32 | 0.57 | 1.00 | 0.43 | 1.16 |
| 52 | trans-.beta.-Ocimene | C10H16 | 12.42 | 0.68 | 0.30 | 0.55 | 0.41 |
| 53 | Hexanoic acid, ethyl ester | C8H16O2 | 12.58 | 0.09 | 0.18 | 0.17 | 0.12 |
| 54 | (2R,5S)-2-Methyl-5-(prop-1-en-2-yl)-2-vinyltetrahydrofuran | C10H16O | 12.77 | 0.17 | 0.12 | 0.13 | 0.22 |
| 55 | .beta.-Ocimene | C10H16 | 12.96 | 0.52 | 0.08 | 0.38 | 0.13 |
| 56 | 1,3,5,7-Cyclooctatetraene | C8H8 | 13.08 | 0.03 | – | 0.03 | 0.04 |
| 57 | 3-Octanone | C8H16O | 13.16 | – | 0.04 | 0.05 | – |
| 58 | 3-Buten-1-ol, 3-methyl- | C5H10O | 13.27 | – | – | – | 0.06 |
| 59 | 1-Pentanol | C5H12O | 13.39 | – | – | – | 0.12 |
| 60 | Benzene, 1-methyl-3-(1-methylethyl)- | C10H14 | 13.42 | – | 0.09 | 0.13 | – |
| 61 | Acetic acid, hexyl ester | C8H16O2 | 13.75 | – | 0.03 | 0.03 | – |
| 62 | 2-Hexanol | C6H14O | 14.20 | – | – | – | 0.61 |
| 63 | Tridecane | C13H28 | 14.50 | – | – | 0.09 | – |
| 64 | cis-2-(2-Pentenyl)furan | C9H12O2 | 14.53 | 0.08 | 0.15 | – | 0.22 |
| 65 | (E)-4,8-Dimethylnona-1,3,7-triene | C11H18 | 14.68 | 0.68 | 0.42 | 0.65 | 0.28 |
| 66 | 2-Heptenal, (E)- | C7H12O | 15.21 | – | – | 0.03 | 0.03 |
| 67 | 3-Octanone, 2-methyl- | C9H18O | 15.30 | 0.35 | 0.89 | – | – |
| 68 | 2-Penten-1-ol, (Z)- | C5H10O | 15.40 | – | 0.06 | – | – |
| 69 | 2,3-Octanedione | C8H14O2 | 15.47 | – | – | – | 0.05 |
| 70 | 5-Hepten-2-one, 6-methyl- | C8H14O | 15.66 | 0.08 | 0.06 | – | 0.09 |
| 71 | 1,6-Dioxaspiro[4.4]nonane, 2-ethyl- | C9H16O2 | 16.16 | 0.02 | – | 0.02 | – |
| 72 | 1-Hexanol | C6H14O | 16.36 | 1.30 | 1.83 | 1.51 | 1.53 |
| 73 | 2,4,6-Octatriene, 2,6-dimethyl-, (E,Z)- | C10H16 | 16.56 | 0.20 | 0.05 | 0.08 | – |
| 74 | 3-Hexen-1-ol, (E)- | C6H12O | 16.61 | – | 0.20 | 0.16 | 0.15 |
| 75 | 3-Hexen-1-ol | C6H12O | 17.16 | – | – | – | 0.06 |
| 76 | Nonanal | C9H18O | 17.21 | 0.35 | 0.37 | 0.47 | 0.31 |
| 77 | 2,4-Hexadienal, (E,E)- | C6H8O | 17.31 | 0.15 | 0.32 | 0.21 | 0.24 |
| 78 | Furan, 2-ethyl- | C6H8O | 17.43 | – | 0.93 | 0.64 | 0.66 |
| 79 | 1,3-Hexadiene, 3-ethyl-2-methyl- | C9H16 | 17.77 | 0.02 | 0.04 | 0.03 | 0.05 |
| 80 | Furan, 3-(4-methyl-3-pentenyl)- | C10H14O | 17.89 | 0.02 | – | – | 0.02 |
| 81 | Sulfurous acid, cyclohexylmethyl tridecyl ester | C23H46O3S | 18.09 | – | – | – | 0.02 |
| 82 | 2-Octenal, (E)- | C8H14O | 18.17 | 0.05 | – | – | 0.07 |
| 83 | Benzene, 1-methyl-4-(1-methylethenyl)- | C10H12 | 18.32 | 0.06 | 0.03 | 0.05 | 0.02 |
| 84 | Octanoic acid, ethyl ester | C10H20O2 | 18.41 | 0.09 | 0.10 | 0.11 | 0.09 |
| 85 | 2,6,10-Trimethyltridecane | C16H34 | 18.59 | 0.46 | 0.28 | 0.52 | 0.36 |
| 86 | Methional | C4H8OS | 18.80 | 0.18 | 0.32 | 0.28 | 0.23 |
| 87 | Acetic acid | C2H4O2 | 18.93 | 0.10 | 0.18 | 0.13 | 0.17 |
| 88 | 3-Furaldehyde | C5H4O2 | 19.04 | 0.03 | – | – | – |
| 89 | Cyclotetrasiloxane, octamethyl- | C8H24O4Si4 | 19.31 | – | 0.04 | – | – |
| 90 | Ethyl 2-(5-methyl-5-vinyltetrahydrofuran-2-yl)propan-2-yl carbonate | C13H22O4 | 19.44 | – | – | 0.02 | – |
| 91 | 2,4-Heptadienal, (E,E)- | C7H10O | 19.84 | 0.08 | 0.10 | 0.09 | 0.13 |
| 92 | 2-Ethyl-1-hexanol | 19.98 | – | 0.05 | 0.03 | 0.05 | |
| 93 | Pentadecane | C15H32 | 20.14 | – | 0.03 | 0.01 | – |
| 94 | trisiloxane, 1,1,1,5,5,5-hexamethyl-3-[(trimethylsilyl)oxy]- | C9H27O3Si4 | 20.18 | 0.08 | 0.11 | – | – |
| 95 | Benzaldehyde | C7H6O | 20.57 | 13.04 | 8.49 | 10.05 | 10.03 |
| 96 | 2-Nonenal, (E)- | C9H16O | 20.94 | 0.34 | 0.45 | 0.31 | 0.41 |
| 97 | Lilac aldehyde B | C10H16O2 | 21.10 | 1.18 | 0.90 | 0.58 | 1.01 |
| 98 | Propanoic acid | C3H6O2 | 21.21 | 0.08 | 0.10 | 0.12 | – |
| 99 | Linalool | C10H18O | 21.41 | 5.50 | 3.15 | 4.17 | 3.43 |
| 100 | Dimethyl sulfoxide | C2H6OS | 22.04 | 0.12 | 0.10 | 0.12 | 0.10 |
| 101 | 2,6-Nonadienal, (E,Z)- | C9H14O | 22.19 | – | 0.49 | 0.38 | – |
| 102 | Lilac aldehyde C | C10H16O2 | 22.22 | 0.99 | – | 0.34 | 0.97 |
| 103 | 3-Cyclohexene-1-acetaldehyde, .alpha.,4-dimethyl- | C10H16O | 22.93 | 0.05 | – | – | – |
| 104 | 1-Cyclohexene-1-carboxaldehyde, 2,6,6-trimethyl- | C10H16O | 22.99 | – | 0.05 | 0.02 | 0.04 |
| 105 | Butyrolactone | C4H6O2 | 23.07 | – | – | 0.03 | 0.02 |
| 106 | Ethanol, 2-(2-ethoxyethoxy)- | C6H14O3 | 23.15 | 0.03 | 0.03 | – | – |
| 107 | Benzeneacetaldehyde | C8H8O | 23.43 | – | – | 0.27 | 0.43 |
| 108 | Decanoic acid, ethyl ester | C12H24O2 | 23.53 | 0.14 | 0.20 | 0.17 | 0.17 |
| 109 | Silanediol, dimethyl- | C2H8O2Si | 23.92 | 0.38 | – | 0.21 | 0.39 |
| 110 | 1-Nonanol | C9H20O | 24.11 | 0.25 | – | 0.35 | 0.35 |
| 111 | Benzaldehyde, 2-hydroxy- | C7H6O2 | 24.26 | 0.12 | 0.11 | 0.08 | 0.17 |
| 112 | Butanoic acid, 3-methyl- | C5H10O2 | 24.42 | – | 0.16 | – | – |
| 113 | 3-Pyridinecarboxaldehyde | C6H5NO | 24.94 | 0.47 | 0.18 | 0.14 | 0.18 |
| 114 | 1-Propanol, 3-(methylthio)- | C4H10OS | 25.33 | 0.04 | 0.06 | 0.04 | 0.08 |
| 115 | Lilac alcohol B | C10H18O2 | 25.97 | 4.91 | – | – | – |
| 116 | Benzene, 1-methoxy-2-(methoxymethyl)- | C9H12O2 | 26.18 | 0.06 | – | 0.03 | – |
| 117 | Lilac alcohol formate B | C11H18O3 | 26.33 | – | – | – | 0.06 |
| 118 | Oxime-, methoxy-phenyl-_ | C8H9NO2 | 26.55 | – | 2.18 | 1.60 | 1.55 |
| 119 | Lilac alcohol C | C10H18O2 | 26.95 | 3.09 | 1.28 | 2.00 | 3.75 |
| 120 | Dodecanoic acid, methyl ester | C13H26O2 | 27.24 | – | – | – | 0.17 |
| 121 | Tris(tert-butyldimethylsilyloxy)arsane | C18H45AsO3Si3 | 27.69 | – | 0.19 | – | – |
| 122 | 3,5-Dimethoxytoluene | C9H12O2 | 28.08 | 0.70 | 3.49 | 0.14 | 1.21 |
| 123 | Dodecanoic acid, ethyl ester | C14H28O2 | 28.13 | – | – | 0.15 | – |
| 124 | Hexanoic acid | C6H12O2 | 28.38 | 0.19 | 0.07 | 0.10 | – |
| 125 | Benzyl alcohol | C7H8O | 28.73 | – | – | – | 0.03 |
| 126 | Phenylethyl alcohol | C8H10O | 29.47 | 0.51 | 0.35 | 0.36 | 1.01 |
| 127 | 3-Buten-2-one, 4-(2,6,6-trimethyl-1-cyclohexen-1-yl)- | C13H20O | 30.05 | – | 0.03 | – | 0.02 |
| 128 | 2-Cyclopenten-1-one, 3-methyl-2-(2-pentenyl)-, (Z)- | C11H16O | 30.14 | – | – | 0.02 | – |
| 129 | Benzaldehyde, 2-methoxy- | C8H8O2 | 30.40 | – | 0.01 | – | – |
| 130 | Phenol | C6H6O | 31.29 | – | – | 0.02 | 0.03 |
| 131 | Methyleugenol | C11H14O2 | 31.48 | – | 0.04 | – | 0.05 |
| 132 | Benzaldehyde, 4-methoxy- | C8H8O2 | 31.64 | 1.50 | 0.45 | 0.42 | 0.86 |
| 133 | Benzene, 1,2,3-trimethoxy-5-methyl- | C10H14O3 | 32.08 | 0.02 | 0.14 | – | 0.04 |
| 134 | Tetradecanoic acid, ethyl ester | C16H32O2 | 32.29 | 0.10 | 0.13 | 0.13 | 0.13 |
| 135 | 2-Propenoic acid, 3-phenyl-, methyl ester, (E)- | C10H10O2 | 32.68 | 0.20 | 0.10 | 0.10 | 0.06 |
| 136 | Benzoic acid, 4-methoxy-, methyl ester | C9H10O3 | 32.97 | 0.17 | 0.14 | 0.13 | 0.08 |
| 137 | Heneicosane | C21H44 | 33.27 | 0.10 | 0.10 | 0.06 | 0.11 |
| 138 | 2-Propenoic acid, 3-phenyl-, ethyl ester, (E)- | C11H12O2 | 33.72 | 0.29 | 0.26 | 0.32 | 0.15 |
| 139 | Benzoic acid, 4-methoxy-, ethyl ester | C10H12O3 | 33.79 | 1.29 | 0.81 | 0.77 | 0.33 |
| 140 | 2,4,6-Cycloheptatrien-1-one, 2-amino- | C7H7NO | 34.31 | 0.40 | 0.12 | 0.02 | 0.02 |
| 141 | 1-Hexadecen-3-ol, 3,5,11,15-tetramethyl- | C20H40O | 35.26 | – | – | 0.16 | – |
| 142 | Hexadecanoic acid, methyl ester | C17H34O2 | 35.42 | – | 0.02 | – | 0.03 |
| 143 | Hexadecanoic acid, ethyl ester | C18H36O2 | 36.11 | 0.08 | 0.11 | 0.12 | 0.14 |
| 144 | 3,5-Dimethoxybenzaldehyde | C9H10O3 | 36.44 | 0.09 | 0.56 | 0.03 | 0.35 |
| 145 | Eicosane | C20H42 | 36.90 | 0.05 | 0.09 | 0.06 | 0.12 |
| 146 | 2,7-Octadiene-1,6-diol, 2,6-dimethyl- | C10H18O2 | 37.07 | 1.44 | 0.87 | 0.24 | 0.57 |
| 147 | Benzoic acid, 3,5-dimethoxy-, methyl ester | C10H12O4 | 38.48 | – | 0.03 | – | – |
| 148 | Coumarin | C9H6O2 | 39.24 | – | 0.09 | 0.04 | 0.54 |
| 149 | 9,12-Octadecadienoic acid, ethyl ester | C20H36O2 | 40.73 | – | 0.02 | 0.02 | 0.02 |
| 150 | Phthalic acid, isobutyl trans-hex-3-enyl ester | C18H24O4 | 40.86 | 0.03 | 0.02 | 0.02 | – |
| 151 | Vanillin | C8H8O3 | 41.16 | – | 0.07 | – | 0.06 |
| 152 | 1,4,7,10,13,16-Hexaoxacyclooctadecane | C12H24O6 | 42.47 | 0.01 | – | – | – |
| 153 | Dibutyl phthalate | C16H22O4 | 42.74 | 0.07 | – | – | – |
| 154 | 2-[2-[2-[2-[2-[2-[2-(2-Methoxyethoxy)ethoxy]ethoxy]ethoxy]ethoxy]ethoxy]ethoxy]ethanol | C17H36O9 | 43.47 | – | – | 0.14 | – |
| 155 | 2-[2-[2-[2-[2-[2-(2-Methoxyethoxy)ethoxy]ethoxy]ethoxy]ethoxy]ethoxy]ethanol | C15H32O8 | 43.83 | – | – | 0.10 | – |
RT retention time.
The VOCs possessed by plant flowers are secondary metabolites, which have a vital role in the pollination process of plants. Lilac alcohol, dimethyl sulfide, acetaldehyde, 3-methyl-1-butanol, 3-methyl butanal, (E)-2-hexenal, benzaldehyde, etc. in the VOCs of sweet cherry flowers can be employed in natural floral flavors. Among them, lilac alcohol has a lilac fragrance. Dimethyl sulfide is one of the key odorants in the production of corn, tomato, potatoes, dairy product, and pineapple38. In addition, 3-methylbutanal is mainly employed to formulate various fruit flavors. Ethanol, linalool, 4-methoxy-benzaldehyde and lilac aldehyde have been shown to have certain pharmacological effects39. A large amount of ethanol is observed in the flowers of sweet cherry during the full bloom period, which is caused by the change in carbon metabolism during the glycolysis of flowers. As the flower matures, respiration increases, and pyruvate, which is the intermediate product of glycolysis, enters the tricarboxylic acid cycle. The remaining part is converted to ethanol, which causes an accumulation of ethanol. The large amount of ethanol not only harms the flowers but also weakens the tolerance and disease resistance of the plant and increases the occurrence of decay. Linalool has many pharmacological activities, such as analgesic, sedative hypnosis, antianxiety and antitumor activities40,41. Moreover, 4-methoxy-benzaldehyde is employed in medicine as an intermediate for antihistamine drugs, such as the antibiotic hydroxyaminobenzyl penicillin. The types, contents and proportions of VOCs of sweet cherry flowers have a strong influence in attracting pollinators to forage (e.g., the noctuid moth Hadena bicruris relies on lilac aldehyde to find its host plant)39.
Classification analysis of VOCs
To identify the main aroma compounds in sweet cherry flower essential oil, the differences in the VOCs of the essential oils of the flours of the four sweet cherry cultivars were compared. The VOCs were grouped according to their chemical families as alcohols, aldehydes, esters, ether, furan, alkane, olefin, terpenes, ketones, organic acids, and other VOCs.
As shown in Fig. 5, in the Brooks, Black Pearl, Tieton, and Summit cultivars, 97 compounds, 107 compounds, 112 compounds and 111 compounds, respectively, were detected. Among the 155 VOCs, ethanol, linalool, dimethyl sulfide, acetaldehyde, (E)-2-hexenal, and benzaldehyde are the main compounds that comprise the aroma of the sweet cherry flower essential oil from the four cultivars.
Figure 5.
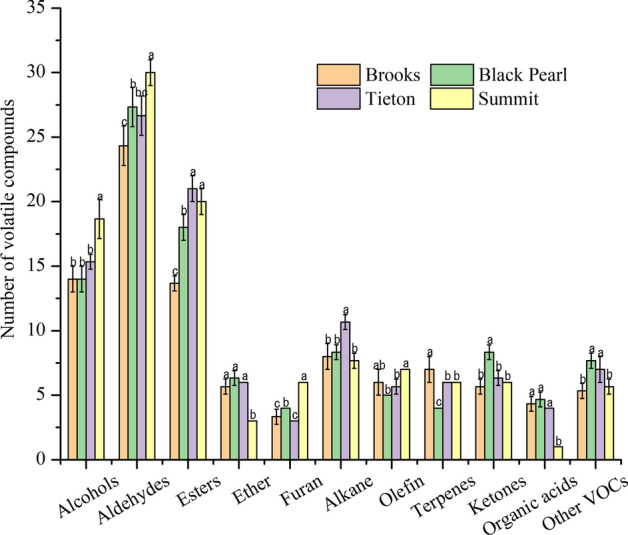
Number of volatile organic compounds of sweet cherry flower essential oils. The vertical bars represent the standard deviation of the means (n = 3). Different letters (for the same compound) indicate significant differences (p < 0.05).
It can be seen from Fig. 6 that the aldehyde content is the largest in the VOCs, followed by alcohols. These two substances are the main sources of sweet cherry flower aroma. Benzaldehyde was detected in four sweet cherry cultivar flowers and hyacinth, citronella, cinnamon, iris and rose. Moreover, (E)-2-hexenal has a fresh green leaf fragrance and can be used as a blending fragrance for essential oils and various floral fragrances42. Acetaldehyde is also present in the aroma of four sweet cherry cultivar flowers and naturally exists in round pomelo, pear, apple, raspberry, strawberry, pineapple, coffee, and orange juice43. After dilution, acetaldehyde has a fruity, coffee, wine, green fragrance. Benzaldehyde and benzeneacetaldehyde are important aldehyde flavor ingredients44, and benzaldehyde has the aroma of bitter almond, cherry and nut. Benzaldehyde, which is a common component of plant volatiles45, attracts many pest species. A recent study has indicated that benzaldehyde can be recognized by adult A. lucorum and can affect its behavior46,47. Benzaldehyde is produced by enzymolysis of amygdalin in flowers, and the importance of this substance has been emphasized in previous studies48. In this study, the concentrations of benzaldehyde and its derivative benzyl alcohol in the essential oil of the four sweet cherry cultivar flowers are relatively high, which shows the best fragrance of the flowers. This result confirms the importance of benzaldehyde to the sweet cherry flower aroma. Hexanal is a fatty acid that is produced under the catalytic action of lipoxygenase (LOX)49. Hexanal has the fragrance of grass and can increase the perceived intensity of fruit aroma. Linalool and phenylethyl alcohol are important alcohol flavor ingredients, among which linalool is extensively applied in cosmetic flavors and food fruit flavors with antibacterial and antiviral effects. Phenylethyl alcohol is one of the two main aroma components of rose essential oil50. The fresh, sweet smell of phenylethyl has calming and soothing effects and anti-inflammatory and antibacterial effects. Lilac alcohol isomers (lilac alcohol B and lilac alcohol C) and lilac aldehyde isomers (lilac aldehyde B and lilac aldehyde C) in sweet cherry flowers are the characteristic aroma components. Most esters can impart plant fruit fragrance. 4-Methoxybenzoic acid ethyl ester is the main ester component of sweet cherry flowers, with aromas similar to fruits and anise. Among the olefins, beta-pinene, myrcene, trans-beta-ocimene, and β-ocimene are the main components, and beta-pinene is only detected in the Summit cultivar51. Ocimene has a certain role in the prevention and treatment of cancer. An antidepressant experiment in mice has also shown that ocimene can effectively reduce depression traits in mice52. Ethers and ketones are relatively rare in flowers. Ketones are also typical aromatic components, and 4-hydroxy-2-butanone is typical of sweet cherry flowers. These VOCs provide the unique aromatic quality of sweet cherry flowers, which indicates that sweet cherry flowers are an important natural spice raw material, which has important scientific value and excellent development prospects.
Figure 6.

Relative contents of volatile organic compounds of sweet cherry flower essential oils.
Conclusions
Ultrasound- and microwave-assisted extraction is an effective method that is suitable for the extraction of essential oil from sweet cherry flowers. Response surface methodology, as part of the experimental design and optimization, showed that the liquid–solid ratio and microwave power had a notable influence on the extraction yield. HS-SPME/GC–MS is an accurate, fast and effective method for determining the aromatic components of sweet cherry flower essential oil. The analysis results concluded that the detected VOCs in the Brooks, Black Pearl, Tieton and Summit sweet cherry cultivars were similar. However, significant variations in the contributions of these compounds to each cultivar were observed. Regardless of the cultivar, the most abundant alcohols and aldehyde compounds were ethanol and benzaldehyde, respectively. The principal volatiles were ethanol, linalool, lilac alcohol, acetaldehyde, (E)-2-hexenal, benzaldehyde and dimethyl sulfide, and their concentrations were highly dependent on each cultivar. These VOCs are the main sources of the aroma of sweet cherry flowers. Ethanol, linalool, 4-methoxy-benzaldehyde and lilac aldehyde have various biological activities. The research results provide a basis for the health benefits of sweet cherry flowers.
Acknowledgements
The authors are grateful to the Natural Science Foundation of China (No. 31760191), Research Project of Young and Middle-aged Teachers in Ningde Normal University (2017Q103) and Innovation Talent Program of Guizhou Province, P. R. China (2016-4010).
Author contributions
H.M.Z. and X.P. W. conceived the idea and designed the experiment. H.G. Y. and Q. L. performed the experiments. H.M.Z. and H. L. analyzed the data and wrote the manuscript. All authors approved the final manuscript.
Competing interests
The authors declare no competing interests.
Footnotes
Publisher's note
Springer Nature remains neutral with regard to jurisdictional claims in published maps and institutional affiliations.
References
- 1.Pino JA, Mesa J. Contribution of volatile compounds to mango (Mangifera indica L.) aroma. Flavour Fragrance J. 2006;21:207–213. doi: 10.1002/ffj.1703. [DOI] [Google Scholar]
- 2.Yang DS, Lee K, Jeong O, Kim K, Kays SJ. Characterization of volatile aroma compounds in cooked black rice. J. Agric. Food Chem. 2008;56:235–240. doi: 10.1021/jf072360c. [DOI] [PubMed] [Google Scholar]
- 3.Ning L, Fuping Z, Haitao C, Siyuan L, Chen G, Zhenyang S, Baoguo S. Identification of volatile components in Chinese Sinkiang fermented camel milk using SAFE, SDE, and HS-SPME-GC/MS. Food Chem. 2011;129:1242–1252. doi: 10.1016/j.foodchem.2011.03.115. [DOI] [PubMed] [Google Scholar]
- 4.Nekoei M, Mohammadhosseini M. Application of HS-SPME, SDME and cold-press coupled to GC/MS to analysis the essential oils of Citrus sinensis CV. Thomson Navel and QSRR study for prediction of retention indices by stepwise and genetic algorithm-multiple linear regression approaches. Anal. Chem. Lett. 2014;4:93–103. doi: 10.1080/22297928.2013.770670. [DOI] [Google Scholar]
- 5.Nekoei M, Mohammadhosseini M. Chemical compositions of the essential oils from the aerial parts of Achillea wilhelmsii using traditional hydrodistillation, microwave assisted hydro- distillation and solvent-free microwave extraction methods: Comparison with the volatile compounds obtained by headspace solid-phase microextraction. J. Essent. Oil Bear. Plants. 2016;19:59–75. doi: 10.1080/0972060X.2014.890077. [DOI] [Google Scholar]
- 6.Mohammadhosseini M, Akbarzadeh A, Flamini G. Profiling of compositions of essential oils and volatiles of Salvia limbata using traditional and advanced techniques and evaluation for biological activities of their extracts. Chem. Biodivers. 2017;14:e1600361. doi: 10.1002/cbdv.201600361. [DOI] [PubMed] [Google Scholar]
- 7.Wang J, Zhang Y, Wang H, Huo S. Evaluation of extraction technologies and optimization of microwave and ultrasonic assisted consecutive extraction of phenolic antioxidants from winery byproducts. J. Food Process Eng. 2019;42:e13064.1–e13064.13. [Google Scholar]
- 8.Hashemi-Moghaddam, H., Mohammadhosseini, M., & Azizi, Z. Impact of amine- and phenyl-functionalized magnetic nanoparticles impacts on microwave-assisted extraction of essential oils from root of Berberis integerrima Bunge. J. Appl. Res. Med. Aromat. Plants10, 1–8 (2018).
- 9.Mohammadhosseini M. Essential oils extracted using microwave-assisted hydrodistillation from aerial parts of eleven Artemisia species: Chemical compositions and diversities in different geographical regions of Iran. Records Nat. Prod. 2017;11:114–129. [Google Scholar]
- 10.Zanousi MBP, Nekoei M, Mohammadhosseini M. Composition of the essential oils and volatile fractions of Artemisia absinthium by three different extraction methods: Hydrodistillation, solvent-free microwave extraction and headspace solid-phase microextraction combined with a novel QSRR evaluation. J. Essent. Oil Bear. Plants. 2016;19:1561–1581. doi: 10.1080/0972060X.2014.1001139. [DOI] [Google Scholar]
- 11.Ma C, Yang L, Wang W, Yang F, Zhao C, Zu Y. Extraction of dihydroquercetin from Larix gmelinii with ultrasound-assisted and microwave-assisted alternant digestion. Int. J. Mol. Sci. 2012;13:8789–8804. doi: 10.3390/ijms13078789. [DOI] [PMC free article] [PubMed] [Google Scholar]
- 12.Xiang Z, Wu X. Ultrasonic-microwave assisted extraction of total flavonoids from Scutellaria baicalensis using response surface methodology. Pharm. Chem. J. 2017;51:318–323. doi: 10.1007/s11094-017-1606-3. [DOI] [Google Scholar]
- 13.Xiao G, Lv L, Jing L, Sen L. Effects of ultrasonic-microwave-assisted technology on hordein extraction from barley and optimization of process parameters using response surface methodology. J. Food Qual. 2018;2018:1–8. [Google Scholar]
- 14.Liu Q, Sun G, Wang S, Lin Q, Zhang J, Li X. Analysis of the variation in scent components of Hosta flowers by HS-SPME and GC–MS. Sci. Hortic. 2014;175:57–67. doi: 10.1016/j.scienta.2014.06.001. [DOI] [Google Scholar]
- 15.Johnson TS, et al. Lilium floral fragrance: A biochemical and genetic resource for aroma and flavor. Phytochemistry. 2016;122:103–112. doi: 10.1016/j.phytochem.2015.11.010. [DOI] [PubMed] [Google Scholar]
- 16.Bergougnoux V, et al. Both the adaxial and abaxial epidermal layers of the rose petal emit volatile scent compounds. Planta. 2007;226:853–866. doi: 10.1007/s00425-007-0531-1. [DOI] [PubMed] [Google Scholar]
- 17.Ruddigkeit L, Awale M, Reymond J. Expanding the fragrance chemical space for virtual screening. J. Cheminform. 2014;6:27–27. doi: 10.1186/1758-2946-6-27. [DOI] [PMC free article] [PubMed] [Google Scholar]
- 18.Schwab W, Fischer TC, Giri AK, Wust M. Potential applications of glucosyltransferases in terpene glucoside production: Impacts on the use of aroma and fragrance. Appl. Microbiol. Biotechnol. 2015;99:165–174. doi: 10.1007/s00253-014-6229-y. [DOI] [PubMed] [Google Scholar]
- 19.Dhandapani S, Jin J, Sridhar V, Rajani S. Integrated metabolome and transcriptome analysis of Magnolia champaca identifies biosynthetic pathways for floral volatile organic compounds. BMC Genomics. 2017;18:463. doi: 10.1186/s12864-017-3846-8. [DOI] [PMC free article] [PubMed] [Google Scholar]
- 20.Ionescu IA, et al. Transcriptome and metabolite changes during hydrogen cyanamide-induced floral bud break in sweet cherry. Front. Plant Sci. 2017;8:1233. doi: 10.3389/fpls.2017.01233. [DOI] [PMC free article] [PubMed] [Google Scholar]
- 21.Jiao F, Liu Q, Sun G, Li X, Zhang J. Floral fragrances of Hemerocallis L. (daylily) evaluated by headspace solid-phase microextraction with gas chromatography-mass spectrometry. J. Hortic. Sci. Biotechnol. 2016;91:573–581. doi: 10.1080/14620316.2016.1193427. [DOI] [Google Scholar]
- 22.Colquhoun TA, Clark DG. Unraveling the regulation of floral fragrance biosynthesis. Plant Signal. Behav. 2011;6:378–381. doi: 10.4161/psb.6.3.14339. [DOI] [PMC free article] [PubMed] [Google Scholar]
- 23.Hayaloglu AA, Demir N. Phenolic compounds, volatiles, and sensory characteristics of twelve sweet cherry (Prunus avium L.) cultivars grown in Turkey. J. Food Sci. 2016;81:7–18. doi: 10.1111/1750-3841.13175. [DOI] [PubMed] [Google Scholar]
- 24.Usenik V, Fabcic J, Stampar F. Sugars, organic acids, phenolic composition and antioxidant activity of sweet cherry (Prunus avium L.) Food Chem. 2008;107:185–192. doi: 10.1016/j.foodchem.2007.08.004. [DOI] [Google Scholar]
- 25.Wang J, Zhai Y, Liu W, Zhu D, Pappu HR, Liu Q. Complete genomic characterization of Plum bark necrosis stem pitting-associated virus infecting sweet cherry in China. Genome Announc. 2016;4:e00413–e416. doi: 10.1128/genomeA.00413-16. [DOI] [PMC free article] [PubMed] [Google Scholar]
- 26.Lech W, Małodobry M, Dziedzic E, Bieniasz M, Doniec S. Analysis of flowering of several sweet cherry cultivars in the climatic conditions of southern poland. Acta Hort. 2012;21:143–148. doi: 10.17660/ActaHortic.2012.932.21. [DOI] [Google Scholar]
- 27.Legua P, et al. Bioactive and volatile compounds in sweet cherry cultivars. J. Food Nutr. Res. 2017;5:844–851. doi: 10.12691/jfnr-5-11-8. [DOI] [Google Scholar]
- 28.Kong WL, Rui L, Ni H, Wu XQ. Antifungal effects of volatile organic compounds produced by Rahnella aquatilis JZ-GX1 against Colletotrichum gloeosporioides in Liriodendron chinense × tulipifera. Front. Microbiol. 2020;11:1114. doi: 10.3389/fmicb.2020.01114. [DOI] [PMC free article] [PubMed] [Google Scholar]
- 29.Matok N, Lachowicz S, Gorzelany J, Balawejder M. Influence of drying method on some bioactive compounds and the composition of volatile components in dried pink rock rose (Cistus creticus L.) Molecules. 2020;25:2596. doi: 10.3390/molecules25112596. [DOI] [PMC free article] [PubMed] [Google Scholar]
- 30.Emelda A. Ongo, Giuseppe Montevecchic, Andrea Antonellic, Veronica Sberveglierid, Fortunato Sevilla III. Metabolomics fingerprint of Philippine coffee by SPME-GC-MS for geographical and varietal classification. Food Res. Int. 2020;134:109227. doi: 10.1016/j.foodres.2020.109227. [DOI] [PubMed] [Google Scholar]
- 31.Mason TJ, Chemat F, Vinatoru M. The extraction of natural products using ultrasound or microwaves. Curr. Org. Chem. 2011;15:237–247. doi: 10.2174/138527211793979871. [DOI] [Google Scholar]
- 32.Kittiphoom S, Sutasinee S. Effect of microwaves pretreatments on extraction yield and quality of mango seed kernel oil. Int. Food Res. J. 2015;22:960–964. [Google Scholar]
- 33.Routray W, Orsat V. Microwave-assisted extraction of flavonoids: A review. Food Bioprocess Technol. 2012;5:409–424. doi: 10.1007/s11947-011-0573-z. [DOI] [Google Scholar]
- 34.Gan CY, Latiff AA. Optimisation of the solvent extraction of bioactive compounds from Parkia speciosa pod using response surface methodology. Food Chem. 2011;124:1277–1283. doi: 10.1016/j.foodchem.2010.07.074. [DOI] [Google Scholar]
- 35.Aros D, et al. Volatile emissions of scented Alstroemeria genotypes are dominated by terpenes, and a myrcene synthase gene is highly expressed in scented Alstroemeria flowers. J. Exp. Bot. 2012;63:2739–2752. doi: 10.1093/jxb/err456. [DOI] [PMC free article] [PubMed] [Google Scholar]
- 36.Xu D, et al. Ultrasound-assisted extraction of natural antioxidants from the flower of Limonium sinuatum: Optimization and comparison with conventional methods. Food Chem. 2017;217:552–559. doi: 10.1016/j.foodchem.2016.09.013. [DOI] [PubMed] [Google Scholar]
- 37.Bartak P, Bednař P, Cap L, Ondrakova L, Stranský Z. SPME—A valuable tool for investigation of flower scent. J. Sep. Sci. 2003;26:715–721. doi: 10.1002/jssc.200301381. [DOI] [Google Scholar]
- 38.Lejish V, et al. Significant emissions of dimethyl sulfide and monoterpenes by big-leaf mahogany trees: Discovery of a missing dimethyl sulfide source to the atmospheric environment. Atmos. Chem. Phys. 2020;20:375–389. doi: 10.5194/acp-20-375-2020. [DOI] [Google Scholar]
- 39.Dotterl S, et al. Linalool and lilac aldehyde/alcohol in flower scents: Electrophysiological detection of lilac aldehyde stereoisomers by a moth. J. Chromatogr. A. 2006;1113:231–238. doi: 10.1016/j.chroma.2006.02.011. [DOI] [PubMed] [Google Scholar]
- 40.Lavy M, et al. Linalool and linalool oxide production in transgenic carnation flowers expressing the Clarkia breweri linalool synthase gene. Mol. Breed. 2002;9:103–111. doi: 10.1023/A:1026755414773. [DOI] [Google Scholar]
- 41.Usuki T, Munakata K. Extraction of essential oils from the flowers of Osmanthus fragrans var. aurantiacus using an ionic liquid. Bull. Chem. Soc. Jpn. 2017;90:1105–1110. doi: 10.1246/bcsj.20170202. [DOI] [Google Scholar]
- 42.Wakai J, et al. Effects of trans-2-hexenal and cis-3-hexenal on post-harvest strawberry. Sci. Rep. 2019;9:101–112. doi: 10.1038/s41598-019-46307-4. [DOI] [PMC free article] [PubMed] [Google Scholar]
- 43.Podd LA, Van Staden J. The role of ethanol and acetaldehyde in flower senescence and fruit ripening: A review. Plant Growth Regul. 1998;26:183–189. doi: 10.1023/A:1006131517539. [DOI] [Google Scholar]
- 44.Dong L, et al. Analysis of volatile compounds from a malting process using headspace solid-phase micro-extraction and GC-MS. Food Res. Int. 2013;51:783–789. doi: 10.1016/j.foodres.2013.01.052. [DOI] [Google Scholar]
- 45.Knudsen JT, Eriksson R, Gershenzon J, Stahl B. Diversity and distribution of floral scent. Bot. Rev. 2006;72:1–120. doi: 10.1663/0006-8101(2006)72[1:DADOFS]2.0.CO;2. [DOI] [Google Scholar]
- 46.Blum MS, Padovani F, Curley A, Hawk RE. Benzaldehyde: Defensive secretion of a harvester ant. Comp. Biochem. Physiol. 1969;29:461–465. doi: 10.1016/0010-406X(69)91766-6. [DOI] [PubMed] [Google Scholar]
- 47.Lee B, Choi W, Lee S, Park B. Fumigant toxicity of essential oils and their constituent compounds towards the rice weevil, Sitophilus oryzae (L.) Crop Prot. 2001;20:317–320. doi: 10.1016/S0261-2194(00)00158-7. [DOI] [Google Scholar]
- 48.Sun Y, Yu H, Zhou J, Pickett JA, Wu K. Plant volatile analogues strengthen attractiveness to insect. PLoS ONE. 2014;9:e99142. doi: 10.1371/journal.pone.0099142. [DOI] [PMC free article] [PubMed] [Google Scholar]
- 49.Márczy JS, Németh ÁS, Samu Z, et al. Production of hexanal from hydrolyzed sunflower oil by lipoxygenase and hydroperoxid lyase enzymes. Biotechnol. Lett. 2002;24:1673–1675. doi: 10.1023/A:1020657618363. [DOI] [Google Scholar]
- 50.Qadri M, et al. An endophyte of Picrorhiza kurroa Royle ex. Benth, producing menthol, phenylethyl alcohol and 3-hydroxypropionic acid, and other volatile organic compounds. World J. Microbiol. Biotechnol. 2015;31:1647–1654. doi: 10.1007/s11274-015-1910-6. [DOI] [PubMed] [Google Scholar]
- 51.Roeder S, Hartmann AM, Effmert U, Piechulla B. Regulation of simultaneous synthesis of floral scent terpenoids by the 1,8-cineole synthase of Nicotiana suaveolens. Plant Mol. Biol. 2007;65:107–124. doi: 10.1007/s11103-007-9202-7. [DOI] [PubMed] [Google Scholar]
- 52.Diniz TC, et al. Anticonvulsant, sedative, anxiolytic and antidepressant activities of the essential oil of Annona vepretorum in mice: Involvement of GABAergic and serotonergic systems. Biomed. Pharmacother. 2019;111:1074–1087. doi: 10.1016/j.biopha.2018.12.114. [DOI] [PubMed] [Google Scholar]