Abstract
Keratins (KRTs), the intermediate filament-forming proteins of epithelial cells, are extensively used as diagnostic biomarkers in cancers and associated with tumorigenesis and metastasis in multiple cancers. However, the diverse expression patterns and prognostic values of KRTs in melanoma have yet to be elucidated. In the current study, we examined the transcriptional and clinical data of KRTs in patients with melanoma from GEO, TCGA, ONCOMINE, GEPIA, cBioPortal, TIMER and TISIDB databases. We found that the mRNA levels of KRT1/2/5/6/8/10/14/15/16/17 were significantly differential expressed between primary melanoma and metastatic melanoma. The expression levels of KRT1/2/5/6/10/14/15/16/17 were correlated with advanced tumor stage. Survival analysis revealed that the high transcription levels of KRT1/5/6/14/15/16/17 were associated with low overall survival in melanoma patients. GSEA analysis indicated that the most involved hallmarks pathways were P53 pathway, KRAS signaling, estrogen response early and estrogen response late. Furthermore, we found some correlations among the expression of KRTs and the infiltration of immune cells. Our study may provide novel insights for the selection of prognostic biomarkers for melanoma.
Subject terms: Cancer, Computational biology and bioinformatics, Genetics, Molecular biology, Biomarkers, Oncology
Introduction
Skin cutaneous melanoma (SKCM) is one of the most deadly types of skin cancers as well as one of the most life-threatening malignancies damaging human health. Each year, melanoma accounts for over 80% of skin cancer-related deaths in the world1. The pathogenesis of SKCM, according to Clark model, gives the assumption that the progression from melanocytes to SKCM needs multiple steps, including formation of banal nevi, dysplastic nevi, melanoma in situ, and invasive melanoma2. Surgical resection is mostly preferred for the primary melanoma; however, metastatic melanoma is not sensitive with chemotherapy and radiotherapy3. Recently, immunotherapies and targeted therapies show promise for improving the prognosis of patients with advanced melanoma, such as immune checkpoint inhibitors that target PD-L1 and BRAF inhibitor; but only a small amount of SKCM patients can benefit from it4,5. Therefore, early diagnosis in melanoma progression and identification of biomarkers is essential for the effective and rapid intervention and treatment of melanoma patients.
There are countless molecular mechanisms involved in the occurrence, development, and metastasis of SKCM. One such family of proteins believed to be closely related to the development and metastasis of SKCM is the keratin family. Keratins (KRTs), the intermediate filament (IF)-forming proteins of epithelial cells, are extensively used as diagnostic biomarkers in cancers6,7. KRTs family are closely associated with tumorigenesis and metastasis of multiple tumor types including lung8, breast9, and colon cancers10. The aberrant expression of keratin proteins has also been reported in melanoma. For example, overexpression of KRT8 was observed in advanced melanomas11. However, the biological roles played by keratin proteins in melanoma is not fully understood, nor has there been any systematic attempt to assess the expression of these genes in melanoma or to assess how their expression relates to the clinical progression of this cancer.
In the present study, we analyzed publicly available gene and protein expression datasets to investigate the differential expression of KRTs and their relations with clinical parameters in SKCM patients. Furthermore, we also analyzed the predicted functions and pathways of the mutations in KRTs. The aim of the study was to provide insights into the molecular mechanisms of SKCM and to reveal potential novel therapeutic targets for this disease.
Methods
Data collection and processing
The gene expression dataset GSE46517 (Platform: Affymetrix Human Genome U133A Array) was obtained from the Gene Expression Omnibus (GEO) database (https://www.ncbi.nlm.nih.gov/geo/), which included 31 primary melanomas and 73 metastatic melanomas12. The TCGA SKCM dataset contains 475 tumor samples, including 104 primary and 371 metastatic samples, which included raw counts of RNAseq expression data and corresponding clinical information. Gene expression and clinical profiles of TCGA SKCM patients were downloaded from UCSC Xena (http://xena.ucsc.edu).
Oncomine database
Then, transcriptional expression of KRTs in 20 common neoplasms was analyzed using the Oncomine online database (http://www.oncomine.com)13. Differentially expressed mRNAs were selected using the cut-off criteria: P = 0.01 (Student’s t-test), fold difference in expression 1.5, and differentially expressed gene rank ≤ 10%.
Statistical analysis
Phenotype and transcriptional expression profiles in melanoma patients from TCGA were analyzed and displayed by using Graphpad Prism (version 8.0). We compared the T1-2 and T3-4 among KRTs in TCGA SKCM patients. P < 0.05 was considered statistically significant.
Survival analysis
Gene Expression Profiling Interactive Analysis (GEPIA, http://gepia.cancer-pku.cn/) is a useful online tool that provide customizable and quick functionalities based on data from The Cancer Genome Atlas (TCGA; https://tcga-data.nci.nih.gov/tcga/) and the Genotype-Tissue Expression project (GTEx; https://www.gtexportal.org/home/index.html)14. GEPIA performs survival analysis based on gene expression levels, using log-rank test for the hypothesis evaluation. The horizontal axis (x-axis) represented time in days, and the vertical axis (y-axis) showed the probability of surviving or the proportion of people surviving. The lines presented survival curves of two groups. The blue curve represented the low expression of KRTs and the red curve represented the high expression of KRTs.
The Human Protein Atlas database
The Human Protein Atlas (https://www.proteinatlas.org/) is a database of immunohistochemistry (IHC)‐based protein expression profiles in different cancers, normal tissue as well as cell lines15. KRT protein expression IHC images in clinical specimens of SKCM patients and normal skin tissues were obtained from this database.
cBioPortal for cancer genomics dataset
The cBioPortal (http://cbioportal.org) is a straightforward online tool that can search for multidimensional cancer genomics datasets and provides access to data for more than 5000 tumor samples from over 20 cancer studies16. To study the KRTs mutation in SKCM, the cBioPortal database was used. Genomic alteration types and alteration frequency in SKCM were analyzed. The genomic alterations of KRTs included copy number amplification, mRNA upregulation, deep deletion, missense mutation with unknown significance, and so on.
Protein–protein interaction (PPI) network construction
In the current study, STRING (http://string-db.org; version 11.0) was used to describe protein co-regulation of KRTs and measure functional interactions among nodes17. The interaction specificity score > 0.4 (the default threshold in the STRING database) was considered statistically significant. The Database for Annotation, Visualization and Integrated Discovery (DAVID, https://david.ncifcrf.gov/) can provide systematic and integrative functional annotation tools for users to investigate biological meaning behind the list of genes. Gene ontology (GO) analysis including the biological process (BP), cellular component (CC) and molecular function (MF) enrichment analysis were conducted for the selected KRTs by DAVID18,19, and then visualized in bubble chart. P value < 0.05 was considered statistically significant. Furthermore, GO:BP,CC,MF and KEGG functional enrichment were analyzed and plotted using ClueGO (version 2.5.3) and CluePedia (version 1.5.3)20.
Gene set enrichment analysis (GSEA)
GSEA tool (version 2.10.1) was applied to predict associated up-regulated and down-regulated genes and the significantly changed pathways based on the expression profile from TCGA database21. In each separate analysis, Student’s-t-test statistical score is conducted in consistent pathways and the mean of the differentially expressed genes is calculated. A permutation test with 1000 times is utilized to detect the significantly involved hallmark pathways. The adj. P using Benjamini and Hochberg (BH) and false discovery rate (FDR) method by default is used to correct for the occurrence of false positive results. Significant involved genes are defined with an adj. P < 0.01 and FDR < 0.25.
Results
Transcriptional levels of KRTs in patients with SKCM
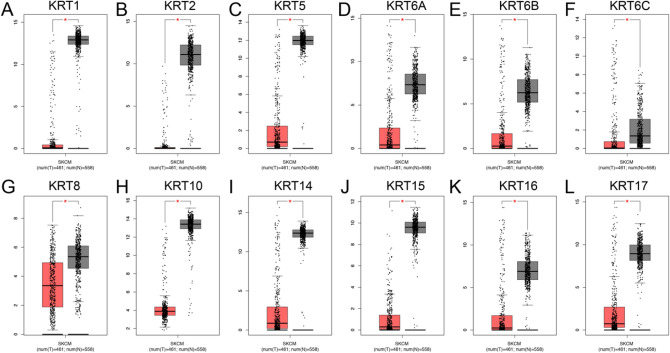
After overlapping the GSE46517 and TCGA, we identified that KRT1, KRT2, KRT5, KRT6A, KRT6B, KRT6C, KRT8, KRT10, KRT14, KRT15, KRT16 and KRT17 were the most significantly differential expressed keratin family members between primary and metastatic melanoma, displayed in Supplementary Fig. 1 and Supplementary Fig. 2 in detail. KRT1, KRT2, KRT5, KRT6A, KRT6B, KRT6C, KRT10, KRT14, KRT15, KRT16 and KRT17 were all highly expressed in primary melanoma in both TCGA and GSE47517 cohort (P < 0.001); however, KRT8 was overexpressed in metastatic melanoma in TCGA cohort. Next, we validated the expression of KRTs by using GEPIA. As shown in Fig. 1, all the KRTs are downregulated in melanoma compared to normal tissues.
Figure 1.
Transcriptional expression of distinct KRTs family members. (A–L) KRTs were down-regulated melanoma compared to normal skin (*P < 0.05).
Expression pattern and survival analysis of KRTs in pan-cancer perspective
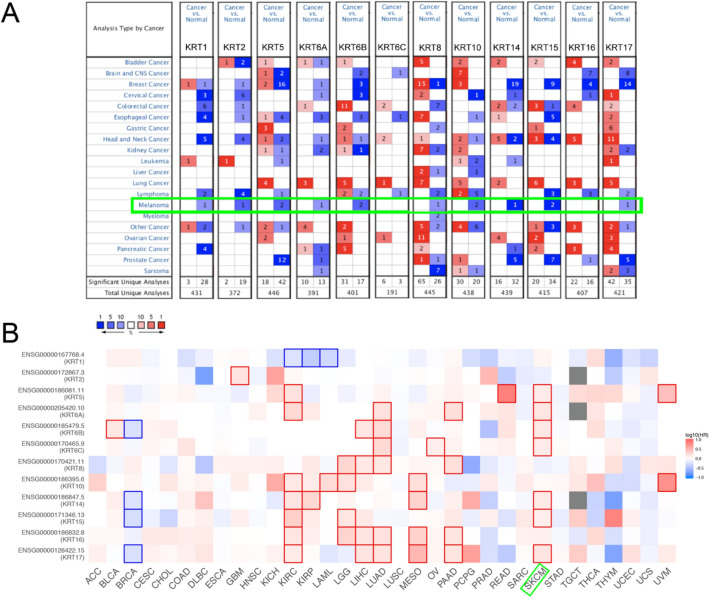
As shown in Fig. 2 and Table 1, there was an apparent heterogeneity between different types of tumors. The mRNA expression levels of KRT1, KRT2, KRT5, KRT6A, KRT6B, KRT8, KRT10, KRT14, KRT15 and KRT17 were significantly downregulated in patients with SKCM. In Riker’s dataset, the transcription levels of KRT1 and KRT2 in normal skin are higher than those in melanoma tissues, and those fold changes are − 6.313 and − 17.664, respectively22. The mRNA expression of KRT5 in cutaneous melanoma decreases with a fold change of − 8.039(P < 0.005) in Riker’s dataset22 and − 71.976(P < 0.005) in Talantov’s datasets23. KRT6A is significantly downregulated in cutaneous melanoma, with fold changes of − 36.532 in Talantov’s dataset23. The transcriptional levels of KRT6B in cutaneous melanoma (fold change = − 19.758) significantly differ from those in the normal samples in Talantov’s dataset23. A similar trend is showed in KRT10 in Riker’s22 and Talantov’s datasets23. In Riker’s dataset, the mRNA expression of KRT8 and KRT15 are found lower expressed in cutaneous melanoma with a fold change of − 2.794 (P < 0.005) and − 22.903 (P < 0.005)22. In Talantov’s dataset, KRT14, KRT15 and KRT17 are significantly downregulated in melanoma, with fold changes of − 234.928, − 219.782 and − 15.727, respectively23. Next, Kaplan–Meier curve as well as log-rank test analyses were performed to show the overall survival (OS). Results was shown graphically in Fig. 2B, seven members of KRTs were greatly related to OS in SKCM patients.
Figure 2.
Expression level and survival analysis of KRTs. (A) Difference of transcriptional expression was compared by Students’ t-test. Cut-off of P value and fold change were as following: P value = 0.01, Fold Change = 1.5, gene rank = 10%, data type: mRNA. (B) Summary of hazard ratios (HR) illustrating cancer-KRT pairs with altered prognosis. (ACC, Adrenocortical Carcinoma; BLCA, Bladder Urothelial Carcinoma; BRCA, Breast Invasive Carcinoma; CESC, Cervical Squamous Cell Carcinoma and Endocervical Adenocarcinoma; CHOL, Cholangiocarcinoma; COAD, Colon Adenocarcinoma; DLBC, Lymphoid Neoplasm Diffuse Large B-cell Lymphoma; ESCA, Esophageal Carcinoma; HNSC, Head and Neck Squamous Cell Carcinoma; KICH, Kidney Chromophobe; KIRC, Kidney Renal Clear Cell Carcinoma; KIRP, Kidney Renal Papillary Cell Carcinoma; LAML, Acute Myeloid Leukemia; LGG, Brain Lower Grade Glioma; LIHC, Liver Hepatocellular Carcinoma; LUAD, Lung Adenocarcinoma; LUSC, Lung Squamous Cell Carcinoma; MESO, Mesothelioma; OV, Ovarian Serous Cystadenocarcinoma; PAAD, Pancreatic Adenocarcinoma; PCPG, Pheochromocytoma and Paraganglioma; PRAD, Prostate Adenocarcinoma; READ, Rectum Adenocarcinoma; SARC, Sarcoma; SKCM, Skin Cutaneous Melanoma; STAD, Stomach Adenocarcinoma; TGCT, Testicular Germ Cell Tumors; THCA, Thyroid carcinoma; THYM, Thymoma; UCEC, Uterine Corpus Endometrial Carcinoma; UCS, Uterine Carcinosarcoma; UVM, Uveal Melanoma).
Table 1.
Significant changes of KRTs expression in transcription level between SKCM and normal skin tissues (ONCOMINE).
| Types of SKCM versus Normal skin | Fold Change | P value | t-test | Ref |
|---|---|---|---|---|
| KRT1 | ||||
| Cutaneous melanoma versus normal | − 6.313 | 0.004 | − 3.085 | Riker Melanoma22 |
| KRT2 | ||||
| Cutaneous melanoma versus normal | − 17.664 | 4.96E−05 | − 5.432 | Riker Melanoma22 |
| KRT5 | ||||
| Cutaneous melanoma versus normal | − 8.039 | 0.004 | − 3.11 | Riker Melanoma22 |
| Cutaneous melanoma versus normal | − 71.976 | 2.09E−11 | − 11.142 | Talantov Melanoma23 |
| KRT6A | ||||
| Cutaneous melanoma versus normal | − 36.532 | 2.37E−05 | − 6.518 | Talantov Melanoma23 |
| KRT6B | ||||
| Cutaneous melanoma versus normal | − 19.758 | 6.35E−09 | − 9.366 | Talantov Melanoma23 |
| KRT8 | ||||
| Cutaneous melanoma versus normal | − 2.794 | 0.003 | − 4.348 | Riker Melanoma22 |
| KRT10 | ||||
| Cutaneous melanoma versus normal | − 3.28 | 3.83E−04 | − 4.182 | Riker Melanoma22 |
| Cutaneous melanoma versus normal | − 7.43 | 1.04E−05 | − 8.863 | Talantov Melanoma23 |
| KRT14 | ||||
| Cutaneous melanoma versus normal | − 234.928 | 1.52E−20 | − 15.085 | Talantov Melanoma23 |
| KRT15 | ||||
| Cutaneous melanoma versus normal | − 219.782 | 2.15E−18 | − 17.132 | Talantov Melanoma23 |
| Cutaneous melanoma versus normal | − 22.903 | 0.002 | − 3.707 | Riker Melanoma22 |
| KRT17 | ||||
| Cutaneous melanoma versus normal | − 15.727 | 1.08E−05 | − 5.769 | Talantov Melanoma23 |
Relationship between the mRNA levels of KRTs and the clinicopathological parameters of patients with SKCM
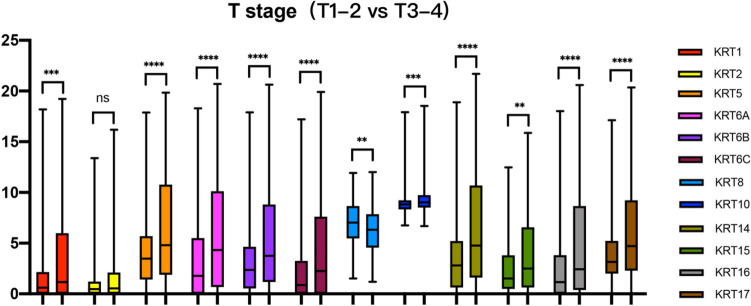
In Fig. 3, except KRT2, elevated expression patterns of KRT1, KRT5, KRT6A, KRT6B, KRT6C, KRT8, KRT10, KRT14, KRT15, KRT16 and KRT17 were significantly associated with T stage (T1-T2 vs. T3-T4).
Figure 3.
Relationship between transcriptional expressions of distinct KRTs family members and T stage of SKCM patients. Except KRT2, KRT1/5/6/10/14/15/16/17 all showed significant correlations with SKCM patients (ns: no significance,*P < 0.05, **P < 0.01, ***P < 0.001).
Relationship between the mRNA levels of KRTs and the survival outcomes of patients with SKCM
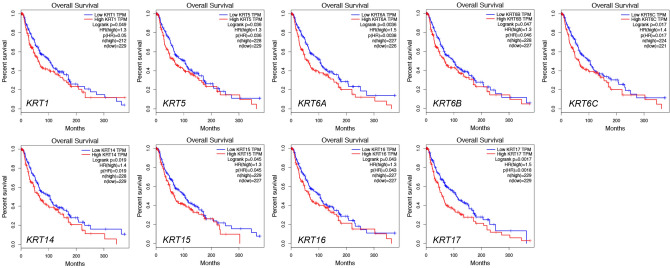
We further explored the critical efficiency of KRTs in the survival of patients with SKCM. GEPIA was used to analyze the correlation between the mRNA levels of KRTs and the survival of patients with SKCM. The Kaplan–Meier curve and log-rank test analyses revealed that the increased KRT1, KRT5, KRT6A, KRT6B, KRT6C, KRT14, KRT15, KRT16 and KRT17 mRNA levels were significantly associated with the overall survival (OS) of melanoma patients (Fig. 4).
Figure 4.
Kaplan–Meier survival analyses on differential KRTs expression groups with OS in the TCGA SKCM patients. High expression of KRT1/5/6/14/15/16/17 were significantly correlated with poor OS.
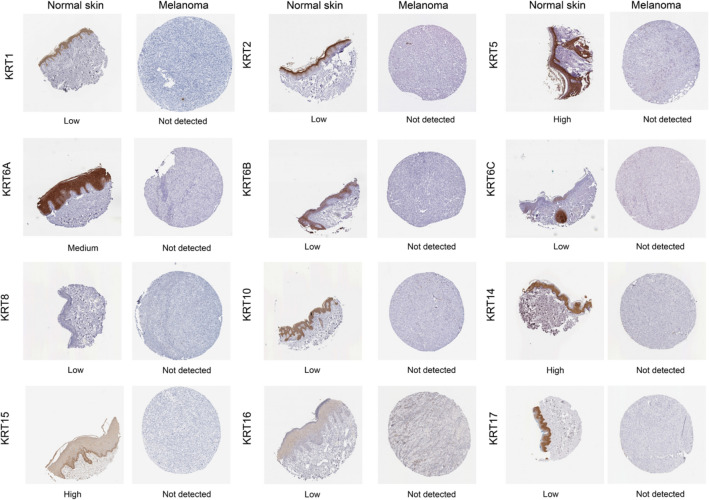
Protein expression levels of KRTs in patients with SKCM
Next, to determine the differentially expression of KRT protein in melanoma tissues, IHC staining images for the KRT proteins in melanoma as well as normal skin tissues were obtained from the Human Protein Atlas database (Fig. 5). Consistent with the above results of KRTs mRNA expression, the results showed that KRTs protein levels were lower in melanoma than normal skin tissue.
Figure 5.
Immunohistochemical staining for protein expression of KRTs in tissues from patients with SKCM and normal tissues.
Genetic alterations and predicted interaction networks and signaling pathways of KRTs
High tumor mutation burden was reported to be a response biomarker for PD-1/PD-L1 blockade in melanoma24. Therefore, we analyzed the KRTs alterations and correlations by using the cBioPortal online tool for TCGA SKCM cohort. In the current study, different genetic alterations of KRTs, including missense mutation, truncating mutation, mRNA high and amplification, was shown in Fig. 6. KRTs were altered in 203 samples out of 444 SKCM patients (45.72%). KRT5 (15%) was the most frequently altered genes among the KRTs genes, including amplification, fusion, and missense mutations. The missense mutation, which can change the polypeptide and therefore can change the function of the overall protein, is the most found mutation in all the KRTs.
Figure 6.
Genetic alterations in KRTs family members (cBioPortal). A visual summary of alteration based on a query of 12 KRTs, which was altered in 203 (45.72%) of 444 sequenced cases/patients.
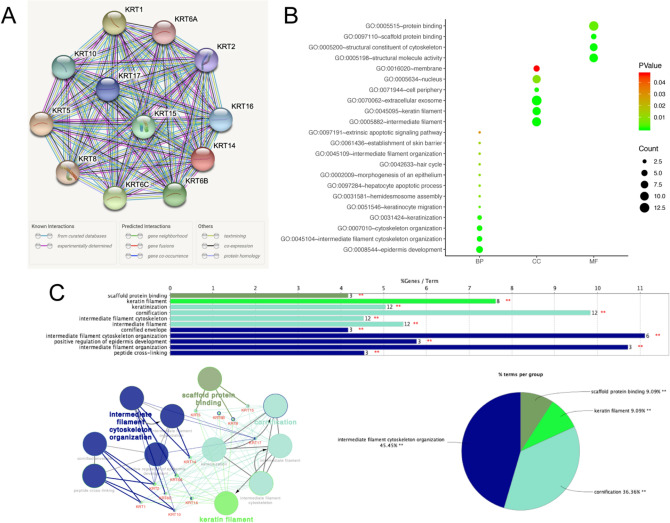
Next, we conducted a PPI network analysis of differentially expressed KRTs with STRING to explore the potential interactions among them. As expected, several nodes of 12 and several edges of 66 were obtained in the PPI network (Fig. 7A). The functions of KRTs were predicted by analyzing Gene Ontology (GO) in the DAVID, visualized in bubble charts (Fig. 7B). GO enrichment analysis predicted the functional roles of target host genes on the basis of three aspects, including biological processes, cellular components, and molecular functions. We found that the biological processes of KRTs were significantly enriched in epidermis development, intermediate filament cytoskeleton organization, cytoskeleton organization, keratinization, keratinocyte migration and hepatocyte apoptotic process. Changes in cellular component were mostly enriched in intermediate filament, extracellular exosome, keratin filament and nucleus. As for molecular function, changes were primarily enriched in protein binding, structural molecule activity, structural constituent of cytoskeleton and scaffold protein binding. Then, ClueGO and CluePedia functional annotations revealed a network of the KRTs genes (Fig. 7C). The GO and Kyoto Encyclopedia of Genes and Genomes (KEGG) enrichment analysis of the KRTs are shown in different colors. The detailed functional notes and classification pie charts are listed in Fig. 7C; 45.45% terms belong to intermediate filament cytoskeleton organization, 36.36% to cornification, 9.09% to keratin filament, and 9.09% to scaffold protein binding.
Figure 7.
Functions enrichment and signaling pathways analysis of the mutations in KRTs in SKCM patients. (A) A PPI network analysis of differentially expressed KRTs with STRING was conducted to explore the potential interactions among them (B) Functional and pathway enrichment analyses of KRTs were performed using DAVID and visualized in bubble chart. (C) The functional annotation analysis of KRTs was constructed using ClueGO, a plug-in of Cytoscape.
Subsequently, a total of 100 significant genes were obtained from GSEA, and the genes with positive correlation were plotted. GSEA analysis, including KRT1, KRT2, KRT5, KRT6A, KRT6B, KRT6C, KRT10, KRT14, KRT15, KRT16 and KRT17 indicated that the most involved hallmarks pathways were P53 pathway, KRAS signaling, estrogen response early and estrogen response late; whereas the most involved hallmarks of KRT8 were inflammatory response, KRAS signaling, estrogen response early and estrogen response late. The details were illustrated in Fig. 8.
Figure 8.
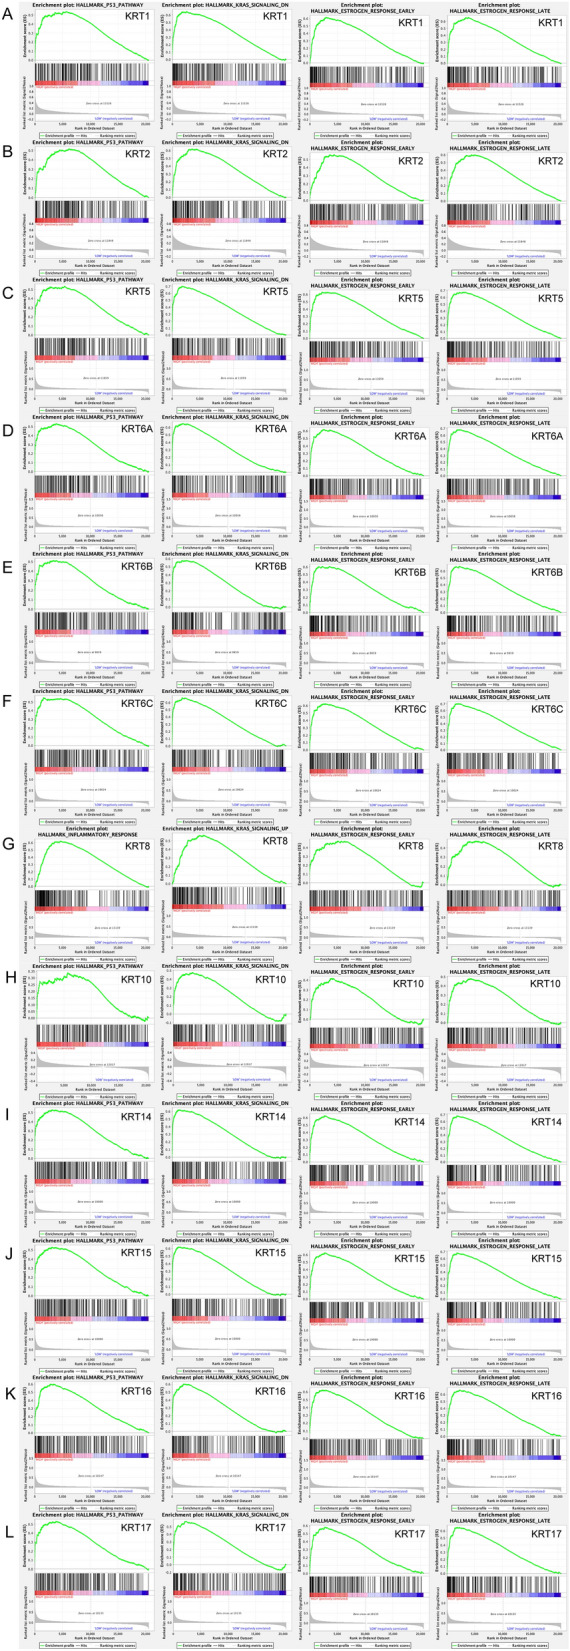
GSEA was used to perform hallmark signaling analysis in KRTs, respectively. A total of 100 significant genes were obtained from GSEA with positive and negative correlation. GSEA analysis, including KRT1, KRT2, KRT5, KRT6A, KRT6B, KRT6C, KRT10, KRT14, KRT15, KRT16 and KRT17 indicated that the most involved hallmarks pathways were P53 pathway, KRAS signaling, estrogen response early and estrogen response late; whereas the most involved hallmarks of KRT8 were inflammatory response, KRAS signaling, estrogen response early and estrogen response late.
Discussion
Keratin (KRT) is a family of intermediate filament proteins which expressed in various types of epithelial cells25,26. KRTs play significant roles in the occurrence, progression and metastasis of multiple cancers. For example, KRT5, KRT14, and KRT17 overexpression are related to poor survival across different types of cancers, especially breast cancers27,28. However, reports about the function of keratin in melanoma are limited29. In this study, our results revealed that KRTs are heterogeneous in different types of tumors. According to the expression profiling analysis and survival analysis of TCGA, KRTs family members were significantly associated with the prognosis and clinical characteristic of SKCM patients.
Interestingly, we found that for all the differential expressed KRTs in the current study, they had the same trend that KRTs are highly expressed in primary melanoma while high expression of KRTs indicated poor prognosis. There are several assumptions to explain the results. Firstly, we think that melanoma in metastatic status might attract and activate more immune cells to fight against the tumor cells which leads to the lower expression; and because of the participation of immune cells, the survival outcomes of patients might get better. Secondly, the mutations in metastatic patients are much more complicated which might cause the increase of immunogenicity and activate the immune response contributing to a better prognosis. Thirdly, data from TCGA is not always accurate, therefore we need to further validate the results based on functional analysis experiments and more cases from prospective cohort studies in the future.
As a member of the keratin family, KRT1 exists in the upper layer of the epidermis and the surface of endothelial cells, and plays a key role in the structural integrity of the skin. KRT1 can produce intermediate filaments to enhance skin strength in the upper layer of the epidermis30. Soudy et al.31 found that KRT1 protein was high expressed in breast cancer and showed great potential in the development of anti-tumor drugs. In our study, GEO and TCGA datasets revealed that the expression of KRT1 was higher in primary melanoma than in metastatic melanoma. KRT1 expression was significantly correlated with the clinical characteristics of the patients with SKCM. Using the GEPIA, we determined the prognostic value of KRT1 in patients with SKCM. A high KRT1 expression was significantly associated with poor OS in melanoma patients.
KRT2 is one of the most abundant structural proteins of the epidermis; however, its biological significance remains unclear32. Cui et al.33 reported that KRT2 can promote melanin production by transfecting KRT2 to alpaca melanocytes. In our report, the expression of KRT2 in primary melanoma tissues was higher than that in metastatic tissues. We also demonstrated that KRT2 expression was significantly correlated with tumor stage in patients with SKCM. However, the expression of KRT2 did not show much correlation with OS in melanoma patients.
KRT5 is specifically expressed in basal layer of epidermis and plays an important role in protecting epithelial cells34. Elevated expression of KRT5 was detected in recurrent and metastasized melanoma cell. In addition, researchers believed that KRT5 participated in melanoma cell structure, metastasis and recurrence29,35, which is consistent with our findings. In the present study, we demonstrated that the expression of KRT5 was lower in metastatic melanoma than in primary melanoma, and this expression was markedly correlated with tumor stage and T stage in patients with SKCM. High expression of KRT5 could predict poor prognosis in melanoma patients.
KRT6A and KRT6B both play important roles in the collective migration of keratinocytes36. Previous studies revealed that KRT6A silencing can suppress cell invasion and metastasis of nasopharyngeal carcinoma37. KRT6C was found to be closely related to the prognosis and metastasis of lung adenocarcinoma38. However, few studies discuss the role of them in melanoma. We first found that KRT6A/B/C are overexpressed in primary melanoma compared to metastatic melanoma. Increased expression of KRT6A/B/C are all significantly associated with the poor prognosis in SKCM patients.
KRT8 and KRT18, the hallmark keratin pair of all simple epithelia, usually collaborate with each other to work39. KRT8 and KRT18 both can regulate protein synthesis, participate in cell movement and inhibit apoptosis. Previous studies suggested that the abnormal expression of KRT8/18 are associated with invasiveness and poor prognosis in cancers40. In melanoma, KRT8/18 was thought to be related to increased invasiveness and metastasis. Safadi et al.41 reported that expression of KRT8/18 in metastatic melanoma are higher than that of primary cutaneous and mucosal melanoma. In addition, some researchers co-transfected a low invasive human melanoma cell line with c-DNAs for KRT8/18 to a more invasive resultant42. Interestingly, the increased expression of KRT8/18 in adenocarcinoma is related with a better prognosis43,44. In our study, we found that the expression of KRT8 was higher in metastatic melanoma than primary melanoma in TCGA cohort, whereas it showed converse results in GSE46517 cohort. As for KRT18, both TCGA and GEO datasets showed no difference in the expression of KRT18. Therefore, further confirmation is needed.
KRT10, expressed in the spinous and corneal layer45, is closely associated with hereditary skin diseases46–48. Chen et al.49 found that KRT10 can increased tumor susceptibility of epithelial cells. However, few research showed its role in melanoma. In our study, we found that KRT10 is highly expressed in primary melanoma than metastatic melanoma. Increased expression of KRT10 is correlated with the T stage as well as the tumor stage in melanoma.
KRT14 is usually found in keratinocytes of the basal layer. In nodular melanoma, KRT14 was found strongly present in basal layer as well as in suprabasal cells50. Bilandzic et al.51 demonstrated that KRT14 showed great invasive potential in ovarian cancer and can act as a novel target in anti-tumor therapies. Papafotiou et al.52 suggested KRT14 played a pivotal role in regeneration and tumorigenesis in bladder cancer. In our study, high expression of KRT14 is closely related to tumor stage and poor prognosis in melanoma patients, which may provide new clues for the diagnosis and treatment of malignant melanoma.
KRT15 is found to be related to the development of many tumors, including breast and lung cancer53–56. In addition, KRT15 was observed to be coordinately expressed with melanoma-associated chondroitin sulfate proteoglycan57. In our study, the expression of KRT15 is higher in primary melanoma than in metastatic melanoma. KRT15 also correlates with the tumor stage and poor survival in melanoma patients.
KRT16, located at chr.17q21.2, encodes for the type I cytoskeletal 16 protein58. Increased expression of KRT16 is significantly associated with poor prognosis in squamous cell carcinoma59. In addition, KRT16 contributes to the immune response to tumors and in tumor cell development60. Moreover, the levels of KRT16 expression may discriminate metastasis from primary melanoma61. In the present study, we found that KRT16 is overexpressed in primary melanoma compared to metastatic melanoma and showed significant difference in different T stage and pathological stage. Increased expression of KRT16 is associated with the poor prognosis in SKCM patients. Importantly, there was a negative correlation between the expression of KRT16 and the infiltration of CD8+ T cells, CD4+ T cells, macrophages, neutrophils, and dendritic cells, which is consistent with previous findings and might provide insights into the immunotherapy of melanoma patients.
KRT17 is mainly present in the epithelial appendages, such as hair follicles, sebaceous glands and other glands. KRT17 was found to be overexpressed in several cancers, including breast cancer and cervical cancer62. In addition, KRT17 can regulate proliferation of cancer cell, and induce the proliferation of squamous cell carcinoma cells63. Kung et al.64 found that the tumor suppressor protein P53 negatively regulates KRT17 and repressed KRT17 transcription. The same results were observed in our study. In the current study, we found that KRT17 significantly overexpressed in primary melanoma than metastatic melanoma, and their expression levels were markedly correlated with the tumor stage of the SKCM patients. Interestingly, the high KRT17 expression was significantly but inversely, correlated with poor OS in melanoma patients.
In this study, GO analysis showed that the biological processes of KRTs were significantly enriched in epidermis development, intermediate filament cytoskeleton organization, cytoskeleton organization, keratinization, keratinocyte migration and hepatocyte apoptotic process. GSEA analysis indicated that the most involved hallmarks pathways were P53 pathway, KRAS signaling, estrogen response early and estrogen response late, which all played significant roles in the progression of the malignant phenotype of melanoma.
Our study is the first to investigate the possible prognostic utility of KRTs in SKCM. While the preceding discussion illustrates the potential involvement of KRTs in the development of many cancers and human diseases, it is noteworthy that little is known about their involvement in SKCM. In this study, we demonstrated the significant upregulation of KRTs in SKCM and its correlation with T stage and OS. Interestingly, we also showed that genetic alteration of KRTs is present in 45.72% of SKCM patients. However, further validation studies and prospective cohort studies are needed to verify these findings. Future research will explore the mechanistic differences between the KRTs in SKCM and other carcinomas.
Conclusion
In conclusion, our study is the first to demonstrate that KRT1/2/5/6/8/10/14/15/16/17 expression is elevated in primary melanoma compared with metastatic, and that high KRT1/5/6/14/15/16/17 mRNA levels predict poor prognosis. These novel findings not only shed light on the molecular alterations in SKCM but also provide the foundation for further research in this area.
Supplementary information
Author contributions
S.G.L. developed the idea, designed the research and revised the writing. H.W., H.C. and F.Z.J. analyzed the data, drafted the manuscript. All authors read and approved the submitted version.
Competing interests
The authors declare no competing interests.
Footnotes
Publisher's note
Springer Nature remains neutral with regard to jurisdictional claims in published maps and institutional affiliations.
These authors contributed equally: Wei Han, Chan Hu and Zhao-Jun Fan.
Supplementary Information
The online version contains supplementary material available at 10.1038/s41598-020-80336-8.
References
- 1.Schadendorf D, et al. Melanoma. Lancet. 2018;392:971–984. doi: 10.1016/s0140-6736(18)31559-9. [DOI] [PubMed] [Google Scholar]
- 2.Wallace H, et al. A study of tumor progression: The precursor lesions of superficial spreading and nodular melanoma. Hum. Pathol. 1984;15:1147–1165. doi: 10.1016/S0046-8177(84)80310-X. [DOI] [PubMed] [Google Scholar]
- 3.Gadeliya Goodson A, Grossman D. Strategies for early melanoma detection: Approaches to the patient with nevi. J. Am. Acad. Dermatol. 2009;60:719–735. doi: 10.1016/j.jaad.2008.10.065. [DOI] [PMC free article] [PubMed] [Google Scholar]
- 4.Flaherty KT, Hodi FS, Fisher DE. From genes to drugs: Targeted strategies for melanoma. Nat. Rev. Cancer. 2012;12:349–361. doi: 10.1038/nrc3218. [DOI] [PubMed] [Google Scholar]
- 5.Bajor DL, et al. Long-term outcomes of a phase I study of agonist CD40 antibody and CTLA-4 blockade in patients with metastatic melanoma. Oncoimmunology. 2018;7:e1468956. doi: 10.1080/2162402x.2018.1468956. [DOI] [PMC free article] [PubMed] [Google Scholar]
- 6.Sharma P, Alsharif S, Fallatah A, Chung BM. Intermediate filaments as effectors of cancer development and metastasis: A focus on keratins, vimentin, and nestin. Cells. 2019 doi: 10.3390/cells8050497. [DOI] [PMC free article] [PubMed] [Google Scholar]
- 7.Karantza V. Keratins in health and cancer: More than mere epithelial cell markers. Oncogene. 2010;30:127–138. doi: 10.1038/onc.2010.456. [DOI] [PMC free article] [PubMed] [Google Scholar]
- 8.Fujioka M, et al. Dimethylarsinic acid (DMA) enhanced lung carcinogenesis via histone H3K9 modification in a transplacental mouse model. Arch. Toxicol. 2020 doi: 10.1007/s00204-020-02665-x. [DOI] [PubMed] [Google Scholar]
- 9.Joosse SA, et al. Changes in keratin expression during metastatic progression of breast cancer: Impact on the detection of circulating tumor cells. Clin. Cancer Res. 2012;18:993–1003. doi: 10.1158/1078-0432.CCR-11-2100. [DOI] [PubMed] [Google Scholar]
- 10.Misiorek JO, et al. Keratin 8-deletion induced colitis predisposes to murine colorectal cancer enforced by the inflammasome and IL-22 pathway. Carcinogenesis. 2016;37:777–786. doi: 10.1093/carcin/bgw063. [DOI] [PubMed] [Google Scholar]
- 11.Wang Z, Dooley TP, Curto EV, Davis RL, VandeBerg JL. Cross-species application of cDNA microarrays to profile gene expression using UV-induced melanoma in Monodelphis domestica as the model system. Genomics. 2004;83:588–599. doi: 10.1016/j.ygeno.2003.10.007. [DOI] [PubMed] [Google Scholar]
- 12.Kabbarah O, et al. Human melanoma samples comparing nevi and primary and metastatic melanoma. PLoS ONE. 2010;5:10770. doi: 10.1371/journal.pone.0010770. [DOI] [PMC free article] [PubMed] [Google Scholar]
- 13.Rhodes DR, et al. ONCOMINE: A cancer microarray database and integrated data-mining platform. Neoplasia. 2004;6:1–6. doi: 10.1016/s1476-5586(04)80047-2. [DOI] [PMC free article] [PubMed] [Google Scholar]
- 14.Tang Z, et al. GEPIA: A web server for cancer and normal gene expression profiling and interactive analyses. Nucleic Acids Res. 2017;45:W98–W102. doi: 10.1093/nar/gkx247. [DOI] [PMC free article] [PubMed] [Google Scholar]
- 15.Ponten F, Jirstrom K, Uhlen M. The human protein atlas—A tool for pathology. J Pathol. 2008;216:387–393. doi: 10.1002/path.2440. [DOI] [PubMed] [Google Scholar]
- 16.Cerami E, et al. The cBio cancer genomics portal: An open platform for exploring multidimensional cancer genomics data: Figure 1. Cancer Discov. 2012;2:401–404. doi: 10.1158/2159-8290.Cd-12-0095. [DOI] [PMC free article] [PubMed] [Google Scholar]
- 17.Franceschini A, et al. STRING v9.1: Protein–protein interaction networks, with increased coverage and integration. Nucleic Acids Res. 2013;41:D808–815. doi: 10.1093/nar/gks1094. [DOI] [PMC free article] [PubMed] [Google Scholar]
- 18.Huang DW, et al. The DAVID gene functional classification tool: A novel biological module-centric algorithm to functionally analyze large gene lists. Genome Biol. 2007;8:R183. doi: 10.1186/gb-2007-8-9-r183. [DOI] [PMC free article] [PubMed] [Google Scholar]
- 19.Ashburner M, et al. Gene ontology: Tool for the unification of biology. The Gene Ontology Consortium. Nat. Genet. 2000;25:25–29. doi: 10.1038/75556. [DOI] [PMC free article] [PubMed] [Google Scholar]
- 20.Bindea G, Galon J, Mlecnik B. CluePedia Cytoscape plugin: Pathway insights using integrated experimental and in silico data. Bioinformatics. 2013;29:661–663. doi: 10.1093/bioinformatics/btt019. [DOI] [PMC free article] [PubMed] [Google Scholar]
- 21.Subramanian A, et al. Gene set enrichment analysis: A knowledge-based approach for interpreting genome-wide expression profiles. Proc. Natl. Acad. Sci. USA. 2005;102:15545–15550. doi: 10.1073/pnas.0506580102. [DOI] [PMC free article] [PubMed] [Google Scholar]
- 22.Riker AI, et al. The gene expression profiles of primary and metastatic melanoma yields a transition point of tumor progression and metastasis. BMC Med. Genomics. 2008;1:13. doi: 10.1186/1755-8794-1-13. [DOI] [PMC free article] [PubMed] [Google Scholar]
- 23.Talantov D, et al. Novel genes associated with malignant melanoma but not benign melanocytic lesions. Clin. Cancer Res. 2005;11:7234–7242. doi: 10.1158/1078-0432.CCR-05-0683. [DOI] [PubMed] [Google Scholar]
- 24.Goodman AM, et al. Tumor mutational burden as an independent predictor of response to immunotherapy in diverse cancers. Mol. Cancer Ther. 2017;16:2598–2608. doi: 10.1158/1535-7163.MCT-17-0386. [DOI] [PMC free article] [PubMed] [Google Scholar]
- 25.Chu PG, Weiss LM. Keratin expression in human tissues and neoplasms. Histopathology. 2002;40:403–439. doi: 10.1046/j.1365-2559.2002.01387.x. [DOI] [PubMed] [Google Scholar]
- 26.Moll R, Franke WW, Schiller DL, Geiger B, Krepler R. The catalog of human cytokeratins: Patterns of expression in normal epithelia, tumors and cultured cells. Cell. 1982;31:11–24. doi: 10.1016/0092-8674(82)90400-7. [DOI] [PubMed] [Google Scholar]
- 27.Laakso M, Loman N, Borg A, Isola J. Cytokeratin 5/14-positive breast cancer: True basal phenotype confined to BRCA1 tumors. Mod. Pathol. 2005;18:1321–1328. doi: 10.1038/modpathol.3800456. [DOI] [PubMed] [Google Scholar]
- 28.van de Rijn M, et al. Expression of cytokeratins 17 and 5 identifies a group of breast carcinomas with poor clinical outcome. Am. J. Pathol. 2002;161:1991–1996. doi: 10.1016/S0002-9440(10)64476-8. [DOI] [PMC free article] [PubMed] [Google Scholar]
- 29.Katagata Y, Kondo S. Keratin expression and its significance in five cultured melanoma cell lines derived from primary, recurrent and metastasized melanomas. FEBS Lett. 1997;407:25–31. doi: 10.1016/s0014-5793(97)00290-1. [DOI] [PubMed] [Google Scholar]
- 30.Fuchs E, Cleveland DW. A structural scaffolding of intermediate filaments in health and disease. Science. 1998;279:514–519. doi: 10.1126/science.279.5350.514. [DOI] [PubMed] [Google Scholar]
- 31.Rania S, Etayash H, Bahadorani K, Lavasanifar A, Kamaljit K. Breast cancer targeting peptide binds keratin 1: A new molecular marker for targeted drug delivery to breast cancer. Mol. Pharm. 2017;14:593–604. doi: 10.1021/acs.molpharmaceut.6b00652. [DOI] [PubMed] [Google Scholar]
- 32.Fischer H, et al. Loss of keratin K2 expression causes aberrant aggregation of K10, hyperkeratosis, and inflammation. J. Invest. Dermatol. 2014;134:2579–2588. doi: 10.1038/jid.2014.197. [DOI] [PubMed] [Google Scholar]
- 33.Cui YC, et al. The expression of KRT2 and its effect on melanogenesis in alpaca skins. Acta Histochem. 2016;118:505–512. doi: 10.1016/j.acthis.2016.05.004. [DOI] [PubMed] [Google Scholar]
- 34.Guo L, et al. A novel heterozygous nonsense mutation of keratin 5 in a Chinese family with Dowling-Degos disease. J. Eur. Acad. Dermatol. Venereol. 2012;26:908–910. doi: 10.1111/j.1468-3083.2011.04115.x. [DOI] [PubMed] [Google Scholar]
- 35.Palmieri G, et al. Main roads to melanoma. J. Transl. Med. 2009;7:86. doi: 10.1186/1479-5876-7-86. [DOI] [PMC free article] [PubMed] [Google Scholar]
- 36.Wang FR, Chen S, Liu HB, Parent CA, Coulombe PA. Keratin 6 regulates collective keratinocyte migration by altering cell–cell and cell–matrix adhesion. J. Cell Biol. 2018;217:4314–4330. doi: 10.1083/jcb.201712130. [DOI] [PMC free article] [PubMed] [Google Scholar]
- 37.Chen CJ, Shan HG. Keratin 6A gene silencing suppresses cell invasion and metastasis of nasopharyngeal carcinoma via the β-catenin cascade. Mol. Med. Rep. 2019;19:3477–3484. doi: 10.3892/mmr.2019.10055. [DOI] [PMC free article] [PubMed] [Google Scholar]
- 38.Hu HB, Yang XP, Zhou PX, Yang XA, Yin B. High expression of keratin 6C is associated with poor prognosis and accelerates cancer proliferation and migration by modulating epithelial-mesenchymal transition in lung adenocarcinoma. Genes Genom. 2020;42:179–188. doi: 10.1007/s13258-019-00889-5. [DOI] [PubMed] [Google Scholar]
- 39.Gonias SL, Hembrough TA, Sankovic M. Cytokeratin 8 functions as a major plasminogen receptor in select epithelial and carcinoma cells. Front. Biosci. 2001;6:D1403–1411. doi: 10.2741/gonias. [DOI] [PubMed] [Google Scholar]
- 40.Tiwari R, et al. Depletion of keratin 8/18 modulates oncogenic potential by governing multiple signaling pathways. FEBS J. 2018;285:1251–1276. doi: 10.1111/febs.14401. [DOI] [PubMed] [Google Scholar]
- 41.Safadi RA, Bader DH, Abdullah NI, Sughayer MA. Immunohistochemical expression of keratins 6, 7, 8, 14, 16, 18, 19, and MNF-116 pancytokeratin in primary and metastatic melanoma of the head and neck. Oral Surg. Oral Med. Oral Pathol. Oral Radiol. 2016;121:510–519. doi: 10.1016/j.oooo.2015.11.016. [DOI] [PubMed] [Google Scholar]
- 42.Chu YW, Seftor EA, Romer LH, Hendrix MJ. Experimental coexpression of vimentin and keratin intermediate filaments in human melanoma cells augments motility. Am. J. Pathol. 1996;148:63–69. [PMC free article] [PubMed] [Google Scholar]
- 43.Buhler H, Schaller G. Transfection of keratin 18 gene in human breast cancer cells causes induction of adhesion proteins and dramatic regression of malignancy in vitro and in vivo. Mol. Cancer Res. 2005;3:365–371. doi: 10.1158/1541-7786.Mcr-04-0117. [DOI] [PubMed] [Google Scholar]
- 44.Pankov R, Simcha I, Zöller M, Oshima RG, Ben-Ze'ev A. Contrasting effects of K8 and K18 on stabilizing K19 expression, cell motility and tumorigenicity in the BSp73 adenocarcinoma. J. Cell Sci. 1997;110:965–974. doi: 10.1242/jcs.110.8.965. [DOI] [PubMed] [Google Scholar]
- 45.Rezze GG, Fregnani JH, Duprat J, Landman G. Cell adhesion and communication proteins are differentially expressed in melanoma progression model. Hum. Pathol. 2011;42:409–418. doi: 10.1016/j.humpath.2010.09.004. [DOI] [PubMed] [Google Scholar]
- 46.Chen PJ, et al. S159P mutation of keratin 10 gene causes severe form of epidermolytic hyperkeratosis. J. Eur. Acad. Dermatol. Venereol. 2016;30:e102–e104. doi: 10.1111/jdv.13345. [DOI] [PubMed] [Google Scholar]
- 47.Mirza H, et al. Mutations affecting keratin 10 surface-exposed residues highlight the structural basis of phenotypic variation in epidermolytic ichthyosis. J. Invest. Dermatol. 2015;135:3041–3050. doi: 10.1038/jid.2015.284. [DOI] [PubMed] [Google Scholar]
- 48.Kalinska-Bienias A, et al. Coexistence of mutations in keratin 10 (KRT10) and the mitochondrial genome in a patient with ichthyosis with confetti and Leber's hereditary optic neuropathy. Am. J. Med. Genet. A. 2017;173:3093–3097. doi: 10.1002/ajmg.a.38403. [DOI] [PubMed] [Google Scholar]
- 49.Chen JL, Cheng X, Merched-Sauvage M, Caulin C, Roop DR, Koch PJ. An unexpected role for keratin 10 end domains in susceptibility to skin cancer. J. Cell Sci. 2006;119:5067–5076. doi: 10.1242/jcs.03298. [DOI] [PubMed] [Google Scholar]
- 50.Kodet O, et al. Melanoma cells influence the differentiation pattern of human epidermal keratinocytes. Mol. Cancer. 2015;14:1. doi: 10.1186/1476-4598-14-1. [DOI] [PMC free article] [PubMed] [Google Scholar]
- 51.Bilandzic M, et al. Keratin-14 (KRT14) positive leader cells mediate mesothelial clearance and invasion by ovarian cancer cells. Cancers. 2019 doi: 10.3390/cancers11091228. [DOI] [PMC free article] [PubMed] [Google Scholar]
- 52.Papafotiou G, et al. KRT14 marks a subpopulation of bladder basal cells with pivotal role in regeneration and tumorigenesis. Nat. Commun. 2016;7:11914. doi: 10.1038/ncomms11914. [DOI] [PMC free article] [PubMed] [Google Scholar]
- 53.Waseem A, et al. Keratin 15 expression in stratified epithelia: Downregulation in activated keratinocytes. J. Invest. Dermatol. 1999;112:362–369. doi: 10.1046/j.1523-1747.1999.00535.x. [DOI] [PubMed] [Google Scholar]
- 54.Cimino D, et al. Identification of new genes associated with breast cancer progression by gene expression analysis of predefined sets of neoplastic tissues. Int. J. Cancer. 2008;123:1327–1338. doi: 10.1002/ijc.23660. [DOI] [PubMed] [Google Scholar]
- 55.Chong LY, et al. Keratin 15, transcobalamin I and homeobox gene Hox-B13 expression in breast phyllodes tumors: Novel markers in biological classification. Breast Cancer Res. Treat. 2012;132:143–151. doi: 10.1007/s10549-011-1555-6. [DOI] [PubMed] [Google Scholar]
- 56.Boyero L, et al. Survival, classifications, and desmosomal plaque genes in non-small cell lung cancer. Int. J. Med. Sci. 2013;10:1166–1173. doi: 10.7150/ijms.5747. [DOI] [PMC free article] [PubMed] [Google Scholar]
- 57.Ghali L, et al. Epidermal and hair follicle progenitor cells express melanoma-associated chondroitin sulfate proteoglycan core protein. J. Invest. Dermatol. 2004;122:433–442. doi: 10.1046/j.0022-202X.2004.22207.x. [DOI] [PubMed] [Google Scholar]
- 58.Liu YH, et al. TFAP2A induced KRT16 as an oncogene in lung adenocarcinoma via EMT. Int. J. Biol. Sci. 2019;15:1419–1428. doi: 10.7150/ijbs.34076. [DOI] [PMC free article] [PubMed] [Google Scholar]
- 59.Huang WC, et al. A novel miR-365-3p/EHF/keratin 16 axis promotes oral squamous cell carcinoma metastasis, cancer stemness and drug resistance via enhancing β5-integrin/c-met signaling pathway. J. Exp. Clin. Cancer Res. 2019;38:89. doi: 10.1186/s13046-019-1091-5. [DOI] [PMC free article] [PubMed] [Google Scholar]
- 60.Wang LX, Li Y, Chen GZ. Network-based co-expression analysis for exploring the potential diagnostic biomarkers of metastatic melanoma. PLoS ONE. 2018;13:e0190447. doi: 10.1371/journal.pone.0190447. [DOI] [PMC free article] [PubMed] [Google Scholar]
- 61.Metri R, et al. Identification of a gene signature for discriminating metastatic from primary melanoma using a molecular interaction network approach. Sci. Rep. 2017 doi: 10.1038/s41598-017-17330-0. [DOI] [PMC free article] [PubMed] [Google Scholar]
- 62.Chivu-Economescu M, et al. Knockdown of KRT17 by siRNA induces antitumoral effects on gastric cancer cells. Gastric Cancer. 2017;20:948–959. doi: 10.1007/s10120-017-0712-y. [DOI] [PubMed] [Google Scholar]
- 63.Yang L, Zhang S, Wang G. Keratin 17 in disease pathogenesis: From cancer to dermatoses. J. Pathol. 2019;247:158–165. doi: 10.1002/path.5178. [DOI] [PubMed] [Google Scholar]
- 64.Kung CP, Murphy ME. The role of the p53 tumor suppressor in metabolism and diabetes. J. Endocrinol. 2016;231:R61–R75. doi: 10.1530/joe-16-0324. [DOI] [PMC free article] [PubMed] [Google Scholar]
Associated Data
This section collects any data citations, data availability statements, or supplementary materials included in this article.


