Abstract
Hepatocellular carcinoma (HCC) is nowadays the sixth cause of tumour-related deceases worldwide, estimated to become the third in Western countries by 2030. New drugs for HCC treatment still have many adverse effects. Several lines of evidence indicate that plant metabolites offer concrete opportunities for developing new therapeutic strategies for many diseases, including cancer. We previously reported that ethyl acetate extract of a spontaneous edible plant harvested in Apulia, Crithmum maritimum, significantly inhibited cell growth in HCC cells. By 1H-NMR spectroscopy, here we show that Crithmum maritimum ethyl acetate extract counteracts the Warburg effect, by reducing intracellular lactate, inhibits protein anabolism, by decreasing amino acid level, and affects membrane biosynthesis by lowering choline and phosphocholine. Also, we observed an effect on lipid homeostasis, with a reduction in triglycerides, cholesterol, monounsaturated fatty acids (MUFA), and diunsaturated fatty acids (DUFA), and an increase in polyunsaturated fatty acids (PUFA). Taken together, these data demonstrate that Crithmum maritimum-induced cytostasis is exerted through a multi-effect action, targeting key metabolic processes in HCC cells. Overall, our findings highlight the role of Crithmum maritimum as a promising tool for the prevention and the improvement of the therapeutic options for HCC and other types of tumours.
Subject terms: Hepatocellular carcinoma, Biochemical networks, Preclinical research, NMR spectroscopy
Introduction
Hepatocellular carcinoma (HCC) is currently the sixth principal cause of tumour-related deceases worldwide and it is expected to grow into the third one in the Western world by 2030, regardless of the reduced incidence of chronic hepatitis infections1. This trend finds the basis in the increased prevalence of metabolic diseases, such as metabolic syndrome (MetS), diabetes, obesity, and non-alcoholic fatty liver disease (NAFLD)2. The therapy of HCC is mainly based upon surgery and pharmacology employing tyrosine-kinase inhibitors, such as sorafenib, regorafenib, and levantinib2, often in combination with immunotherapeutic agents, for instance, pembrolizumab and nivolumab3. Such pharmacological approaches result in many unfavourable consequences and are not tolerated by patients in the long range4,5. Thus, innovative and effective therapeutic strategies, with fewer side effects, are extremely needed for HCC.
Plant-derived products and extracts are gaining consideration for therapeutic purposes, and noteworthy effects have been described concerning many pathologies6,7, including cancer8. We previously demonstrated that ethyl acetate extract of a spontaneous edible plant harvested in Apulia, Crithmum maritimum L., exerted a significant inhibitory effect on cell growth in HCC cells by affecting cell cycle regulation and apoptosis9. Metabolomics offers a trustable and effective tool to investigate the behaviour of biological systems by analysing their metabolic fingerprint10. Many applications have been described so far in the characterisation of the metabolic profile of plants11,12, as well as in the assessment of changes of the metabolic signature after a selected treatment, such as plant-derived medicines and conventional drugs13, or plant-derived metabolites14. Here, we aimed at further characterising the effect of Crithmum maritimum in HCC cells by using a metabolomic approach. We, therefore, characterised the effect of the ethyl acetate extract of Crithmum maritimum on the metabolic profile in two HCC cell lines, Huh7 and HepG2, by analysing, with 1NMR-spectroscopy, cell pellets (aqueous and lipid fractions) and cell culture media. Moreover, we analysed the whole plant powder and the four extracts to determine their metabolite composition. Our results show that ethyl acetate extract of Crithmum maritimum substantially changes the metabolic profile in both HCC cell lines. In particular, in the aqueous fraction, we observed a decrease in intracellular lactate, many amino acids, choline, and phosphocholine. Interestingly, the decrease of intracellular lactate in the aqueous fraction was paralleled by the increase in cell culture media, where an increase of glucose was also measured. Notably, we also found that ethyl acetate extract of Crithmum maritimum modulates lipid homeostasis, by decreasing triglycerides, cholesterol, and monounsaturated fatty acids (MUFA) and di-unsaturated fatty acids (DUFA), and increasing polyunsaturated fatty acids (PUFA). Moreover, the metabolite composition of the whole plant powder and the ethyl acetate extract offers interesting insights for a better understanding of the broad effect shown by Crithmum maritimum. Overall, our findings show for the first time the multitarget action of Crithmum maritimum extract in inhibiting HCC cell growth as well as the reversion of the pathologic metabolic profile of HCC cells towards normal patterns.
Results
Preparation of Crithmum maritimum extracts and their effect on cell proliferation in HCC cell lines
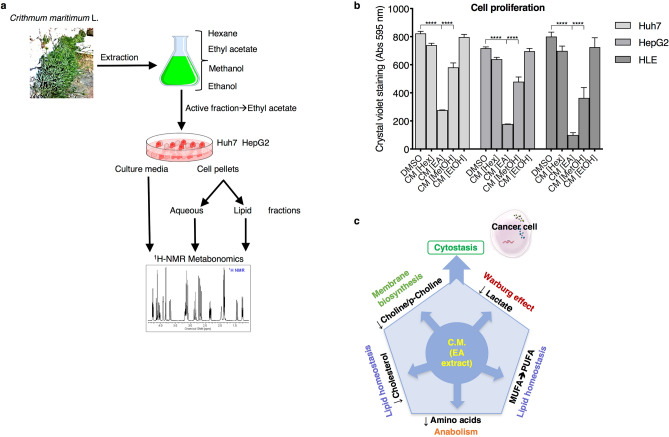
As a first step, we prepared extracts from Crithmum maritimum lyophilized powder, as described in the Materials and Methods section. The workflow from plant lyophilized powder preparation to 1H-NMR analysis is summarised in Fig. 1a. We preliminary analysed the effect of the four different extracts (hexane, ethyl acetate, methanol and ethanol) on cell proliferation in three different HCC cell lines (HepG2, Huh7, HLE) by treating the cells for 72 h with 0.5 μM extract concentration. Results show that the ethyl acetate extract was the most effective in inhibiting cell growth (Fig. 1b). Thus, we focused on this extracts for the following 1H-NMR experiments on cell extracts and cell culture media. To corroborate the effect of Crithmum maritimum in other tumour histotypes, we carried out the same experiment in a non-HCC cell line, namely HeLa, and observed a similar antiproliferative effect (see Supplementary Fig. S1 online). Also, since it has been shown that the extracellular acidic pH characterising most cancers can hamper the effectiveness of many anti-tumour drug15,16, we verified the effect of the four different extracts on cell proliferation under acidic pH conditions. We found that the effect of Crithmum maritimum was preserved under these conditions, although HepG2 cells displayed a slight resistance compared with Huh7 (see Supplementary Fig. S2 online).
Figure 1.
(a) Cartoon outline of the experimental workflow (b) Effect of the different Crithmum maritimum extracts on cell proliferation in three different HCC cell lines (Huh7, HepG2, HLE) as determined by crystal violet staining. Cells were treated for 72 h with the four different Crithmum maritimum extracts at 0.5 μM. **** p < 0.0001, *** p < 0.001 as determined by 2-way ANOVA analysis followed by Dunnett’s multiple comparisons tests. (c) Cartoon showing the proposed multi-target effect exerted by Crithmum maritimum ethyl acetate extract on HCC cells. DMSO Vehicle treatment, CM Crithmum maritimum treatment, [Hex] Hexane, [EA] Ethyl Acetate, [MetOH] Methanol, [EtOH] Ethanol. Results are expressed as the mean ± s.e.m. of at least three independent biological replicates, each conducted in triplicate.
The combined multi-target action exerted by Crithmum maritimum ethyl acetate extracts resulting in the cytostatic effect on HCC cells is illustrated in Fig. 1c.
1H-NMR characterisation of Crithmum maritimum ethyl acetate extract
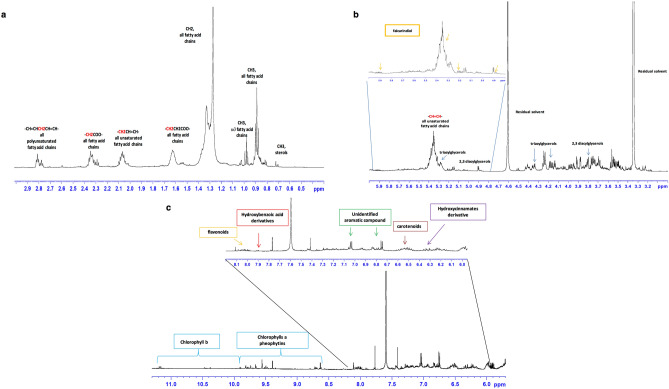
Then, we characterised by 1H-NMR Crithmum maritimum ethyl acetate extract. Visual inspection of the 1H-NMR spectrum revealed the presence of different classes of metabolites (Fig. 2). These include fatty acids, polyacetylenes, and in the aromatic overcrowded region, phenolic compounds, and photosynthetic pigments (Fig. 2). Characteristic signals of sterols, tri- and diacylglycerols, and fatty acids were identified (Fig. 2a). The presence of sterols was assessed based on diagnostic resonances of CH3-groups at 0.7 and 0.71 ppm, clearly differentiated from the other signals. In particular, signals at 0.71 (CH3-18) and 1.01 (CH3-25) were assigned to β-sitosterol, as also confirmed by the carbons at 12.2 ppm and 19.1 ppm, respectively. The 1H resonance at 0.70 ppm was identified as stigmasterol17, while the smaller signal observed at 0.55 ppm was assigned to a sterol molecule. Crithmum maritimum and halophytes in general are known to be important sources of phytosterols18.
Figure 2.
1H-NMR typical spectrum (600 MHz, CD3OD:CDCl3) of Crithmum maritimum ethyl acetate extract sample in (a) high, (b) middle, and (c) low-frequency regions, showing the main metabolite classes associated with principal peaks.
Terminal methyl groups (CH3) of all fatty acid chains were observed at 0.88 ppm. A more de-shielded signal at 0.98 ppm was assigned to ω3-fatty acids methyl groups. Broad signals in the range 1.26–1.39, 1.59–1.67, and 2.25–2.41 ppm were detected and identified as characteristic for methylene (n-CH2), β-methylene, and α-methylene (-CH2COO-) protons adjacent to the carbonyl group of all fatty acids. The unsaturated fatty acids were identified by the diagnostic resonances of allylic (–CH2CH=CH–) and olefinic (–CH=CH–) protons at 2–2.10 and 5.29–5.45 ppm respectively. The presence of polyunsaturated fatty acids such as linoleic (C18:2 ω6) and linolenic (C18:3 ω3) was assessed by the presence of bis-allylic protons (–CH=CHCH2CH=CH–) at 2.74–2.82 ppm. Unsaturated fatty acids are highly represented in wild plants and a significant amount of ω3 and ω6 series was previously reported in Crithmum maritimum leaves19,20. Several signals characterized the region between 3.5 and 4.6 ppm (Fig. 2b). Among them, the resonances at 4.17 and 4.35 ppm were assigned to glycerol 1–3 protons of triacylglycerols. Partially overlapped with olefinic (–CH=CH–) protons was identified at 5.28 ppm. A doublet at 4.90 ppm (J 3.78 Hz) coupled with a proton signal at 3.80 and a 13C at 99 ppm in the HSQC spectrum was assigned to the anomeric proton typical of glycodiacylglycerols sugar moiety. Digalactosyldiacylglycerol is known to be the major glycerolipids of plastids in plants17.
Based on 2D experiments and by comparison with previously reported data21,22, diagnostic resonances at 5.91 CH(2), 5.22 CH(1), and 4.90 CH(3), together with the spin system at 0.88 (–CH3), 1.26–1.39 (n-CH2–), 5.29–5.45 (–CH=CH–) were assigned to falcarindiol. Interestingly, these resonances were not observed in the 1H-NMR spectra of the other three fractions (Supplementary Fig. S4-S6 online). Polyacetylene molecules are widely distributed within the Apiaceae family and show many biological and bio-functional activities, such as antibacterial, cytotoxic, and antimutagenic21,23.
In the aromatic region (Fig. 2c), a complex pattern of resonances, with several weak signals, in the range 6.4–6.6 ppm was assigned to the conjugated double bonds of carotenoids17,22. Despite a lower content for the other Apiaceae species, Crithmum maritimum is considered a good source of carotenoids, known for their important antioxidant properties20. Characteristic signals for the vinyl protons at 6.32 ppm (J = 15 Hz) and 7.60 ppm (J = 15 Hz) are compatible with caffeoyl moieties of hydroxycinnamic acids, such as chlorogenic acid, reported to be major phenolic compounds in Crithmum maritimum aerial parts20,24,25. Interestingly, strongly coupled doublets at 7.0 and 6.78 ppm were not observed in the methanol extract (see Supplementary Fig. S5 online). Hydroxybenzoic acid derivatives, whose presence was already reported in the phenolic profile of Crithmum maritimum infusions and decoctions25, were also identified based on coupled signals at 7.90 and 6.85 ppm. The J-resolved spectrum showed a singlet at 6.61 ppm that identified epigallocatechin H2 and H6 aromatic protons. This flavonol was reported to be one of the main flavonoids found in Crithmum maritimum leaves20. According to the literature, other flavonoids derivatives, characterized by signals at 8.08 and 6.30, were ascribed to rutin, apigenin, catechin, epicatechin, and quercetin20,25. Signals from chlorophylls and their metal-free derivatives, such as pheophytins, were identified at the downfield region of the spectrum, between 11.2–8.5 ppm26. Observed peaks were attributed to the tetrapyrrole ring N–H protons signals17. In particular, signals at 11.16, 11.18, 10.47, 10.37, and in the range 9.95–9.6 ppm were assigned to chlorophyll b, while chlorophyll a and its pheophytins derivatives resonances were observed in the range 9.6–9.32 ppm and 8.53–8.1 ppm26,27.
By using 1H-NMR, we also analysed the metabolite profile of Crithmum maritimum powder and the other three fractions obtained by hexane, methanol, and ethanol extraction. Results are shown in Supplementary Figures S3-S6 online (Figs. 3 and 4).
Figure 3.
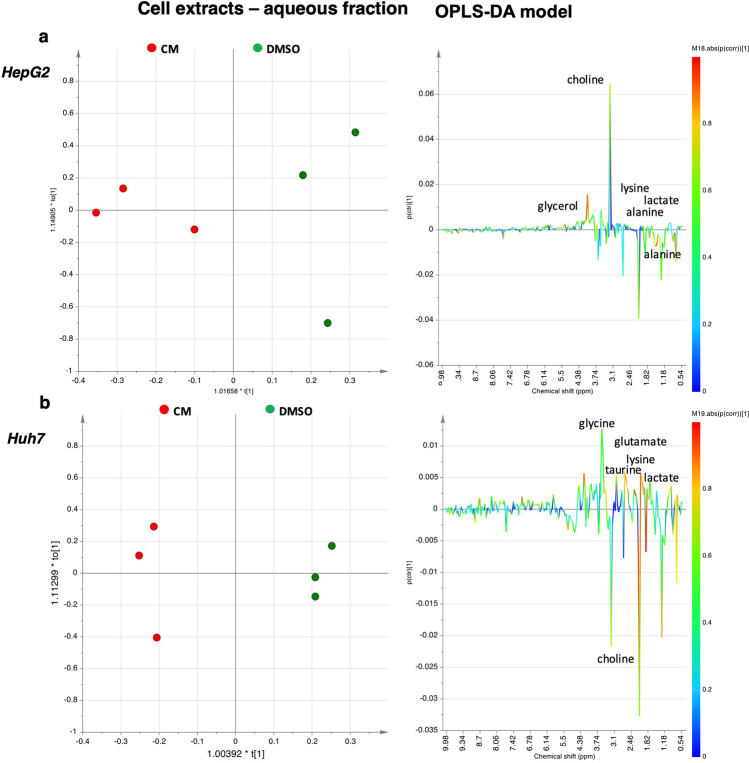
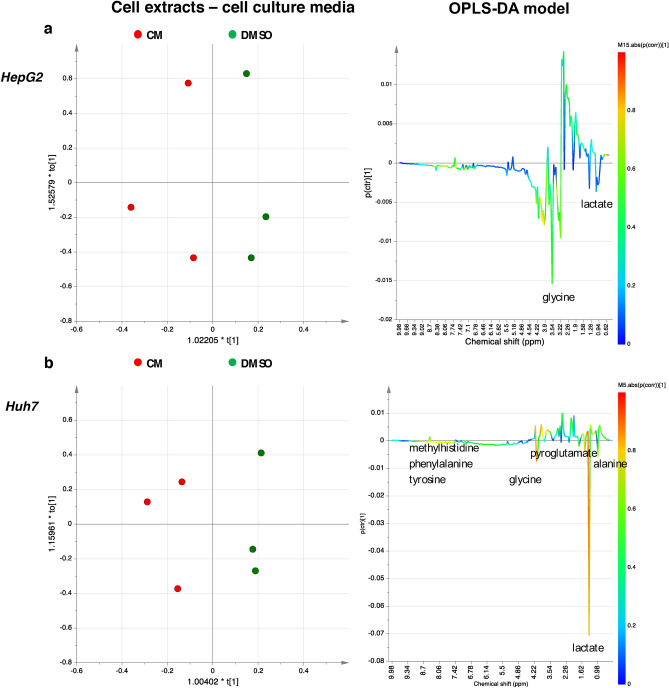
OPLS-DA scores plots (left panel) and corresponding coefficient loading plots (right panel) derived from the 1H-NMR spectra of HepG2 (a) and Huh7 (b) cell extracts aqueous fraction obtained from different groups. DMSO Vehicle treatment, CM Crithmum maritimum treatment.
Figure 4.
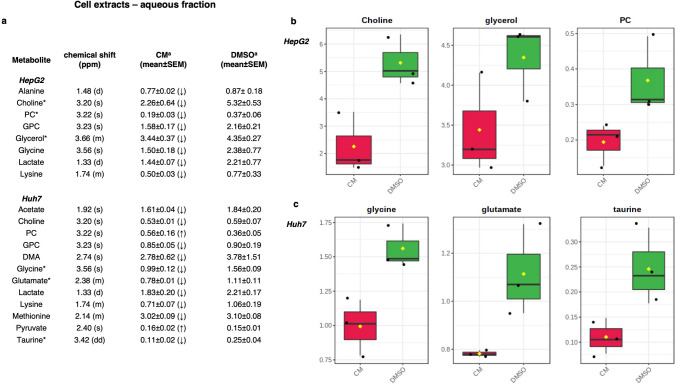
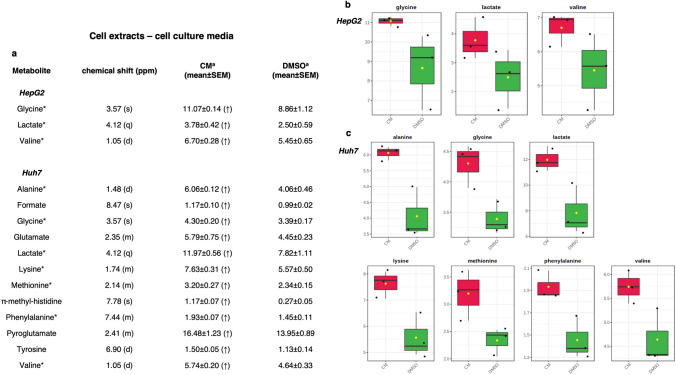
(a) Quantitative comparison of metabolites found in the aqueous cell extract. Mean and relative standard error mean refers to the relative integrals of metabolites, determined from cell extract 1D 1H-NMR spectra of each group (CM and DMSO treatments). Letters in parentheses indicate peak multiplicities (s, singlet; d, doublet, dd, doublet of doublet; m, multiplet). DMA dimethylamine, PC O-phosho-choline, GPC sn-glycero-3-phoshocholine. *A p-value threshold of 0.05 was obtained from t-test analysis. (b,c) Box-and-Whisker plots illustrating the trend of significant metabolites grouped according to CM: Crithmum maritimum treatment; DMSO: Vehicle treatment, derived from the 1H NMR spectra of (b) HepG2 and (c) Huh7 aqueous cell extracts. DMSO Vehicle treatment, CM Crithmum maritimum treatment.
Crithmum maritimum ethyl acetate extract modifies metabolite profile in aqueous cell extracts as evaluated by 1H-NMR spectroscopy
We next evaluated by 1H-NMR spectroscopy the effect of Crithmum maritimum ethyl acetate extract on metabolite profile in two HCC cell lines (Huh7 and HepG2). Cells were treated for 48 h with the extract at the concentration of 0.5 μM, which was used in our previous work. Cell culture media were collected for further analyses. Then, cells were harvested and the pellet obtained after centrifugation was used for the analysis performed on both aqueous and lipid fractions.
For both cell extracts (aqueous and lipid fractions) and cell culture media, 1D and 2D COSY, HSQC, HMBC, and J-resolved NMR spectra were used to accurately identify and assign metabolites according to literature data28–32. Then, a multivariate analysis (MVA) was performed. In a first step, a general overview for both the HepG2 and Huh7 cell lines was obtained by unsupervised PCA (Principal Components Analysis) analyses, while supervised OPLS-DA models were used to elucidate the most reliable class-discriminating variables that were highly diagnostic for CM and DMSO group separation. OPLS-DA models (both obtained with one predictive and one orthogonal component, R2X = 0.71, R2Y = 0.89, Q2 = 0.61, and R2X = 0.43, R2Y = 0.99, Q2 = 0.66), clearly evidenced differences in the concentrations of polar metabolites of the two cell lines for the treated compared with untreated samples (Fig. 3). In particular, by examining the color-coded coefficient loadings (S-line plots) for the OPLS-DA model reported in Fig. 3a, a decrease in levels of alanine (1.5 ppm), choline/phosphocholine (3.22 ppm), glycerol (3.66 ppm), glycine (3.56 ppm), lactate (1.33 ppm) and lysine (1.74 ppm) was observed for extracts of HepG2 cells treated with CM compared with vehicle (DMSO). On the other hand, relative low levels of acetate (1.92 ppm), methionine (2.14 ppm), choline (3.20 ppm), lactate (1.34 ppm), lysine (1.74 ppm), taurine (3.42 ppm), glycine (3.56 ppm) and glutamate (2.38 ppm) levels were observed in Huh7 extracts treated with CM compared to vehicle (DMSO). Moreover, the discriminant metabolites between CM treated and vehicle (DMSO) for both HepG2 and Huh7 cells were evaluated by the integration of the corresponding unbiased selected NMR signals. The t-test analysis was performed on the normalized peak integral areas of metabolites discriminating the two groups, with levels of statistical significance at least at p-values < 0.05 with a 95% confidence level (see Supplementary Table S1 online). For metabolites defined in the 1H-NMR spectra by multiple patterns of signals, the non-overlapping signals were chosen, and relevant data obtained were expressed as normalised integrals for the discriminating metabolites (Figs. 4a–c, 5 and 6).
Figure 5.
OPLS-DA scores plots (left panel) and corresponding coefficient loading plots (right panel) derived from the 1H-NMR spectra of HepG2 (a) and Huh7 (b) cell culture media samples obtained from different groups. DMSO Vehicle treatment, CM Crithmum maritimum treatment.
Figure 6.
(a) Quantitative comparison of metabolites found in cell culture media. Mean and relative standard error mean refers to the relative integrals of metabolites, determined from cell culture media 1D 1H-NMR spectra of each group (CM and DMSO treatments). Letters in parentheses indicate peak multiplicities (s, singlet; d, doublet, dd, doublet of doublet; q, quartet, m, multiplet). * A p-value threshold of 0.05 was obtained from t-test analysis. (b,c) Box-and-Whisker plots illustrating the significant metabolites trend grouped according to CM Crithmum maritimum treatment, DMSO Vehicle treatment, derived from the 1H-NMR spectra of (a) HepG2 and (b) Huh7 cell culture media.
Crithmum maritimum ethyl acetate extract modifies metabolite profile in cell culture media as evaluated by 1H-NMR spectroscopy
Similarly, the corresponding OPLS-DA models were obtained for cell culture media samples (Fig. 5a,b). Both models were obtained with one predictive and one orthogonal component, R2X = 0.89, R2Y = 0.80, Q2 = 0.25 and R2X = 0.78, R2Y = 0.94, Q2 = 0.65. Data evidence a specific trend in the level of metabolites in Crithmum maritimum-treated samples when compared with the vehicle (DMSO). In HepG2 cell culture media only glycine, lactate, and valine were increased in Crithmum maritimum-treated samples. On the other hand, in Huh7 samples, relatively higher levels of alanine, formate, glycine, glutamate, lactate, lysine, methionine, methylhistidine, pyroglutamate, phenylalanine, tyrosine, and valine were detected. Relevant metabolites found by MVA were evaluated by the integration of the unbiased signal in the 1H-NMR spectra, and t-test analysis was used to determine statistical significance. Results, expressed as normalized integrals for the discriminating metabolites, are reported in Figs. 6a–c, 7 and 8.
Figure 7.
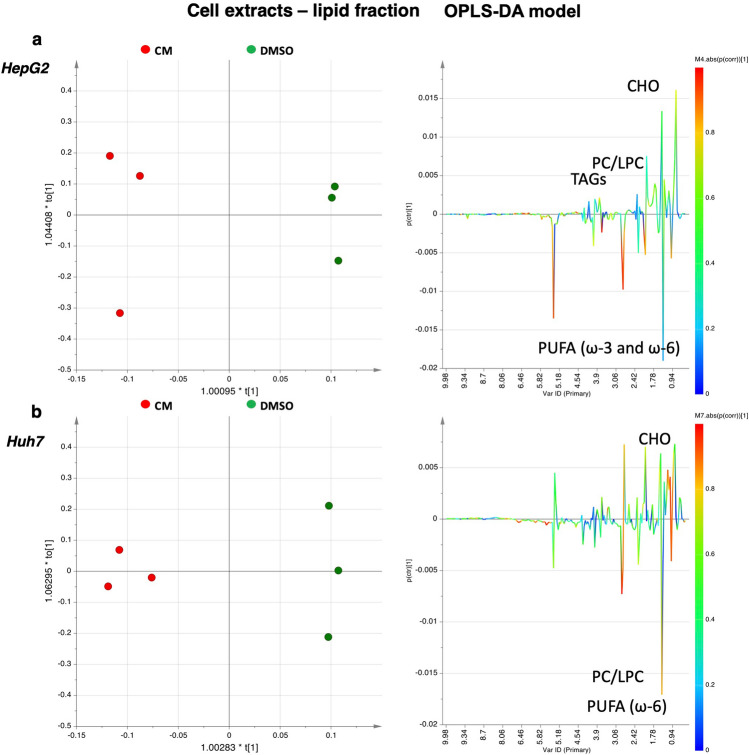
OPLS-DA scores plots (left panel) and corresponding coefficient loading plots (right panel) derived from the 1H-NMR spectra of (a) HepG2 and (b) Huh7 cell lipid extracts obtained from different groups. DMSO Vehicle treatment, CM Crithmum maritimum treatment.
Figure 8.
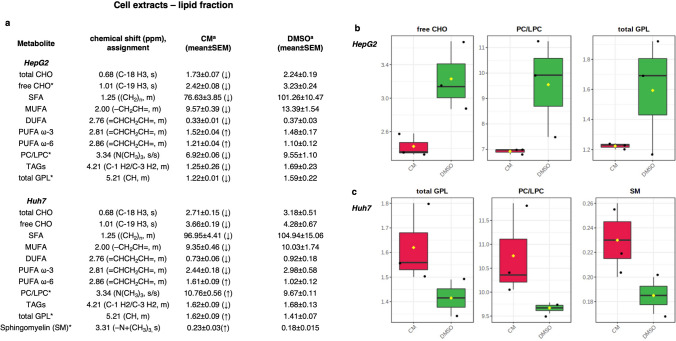
(a) Quantitative comparison of metabolites found in cell lipid extracts. Mean and relative standard error mean refers to the relative integrals of metabolites, determined from lipid cell extract 1D 1H-NMR spectra of each group (CM and DMSO treatments). Letters in parentheses indicate the peak multiplicities (s singlet, d doublet, dd doublet of doublet, q quartet, m multiplet). *A p-value threshold of 0.05 was obtained from t-test analysis. (b,c) Box-and-Whisker plots illustrating the significant metabolites trend grouped according to CM Crithmum maritimum treatment, DMSO DMSO treatment, derived from the 1H-NMR spectra of (a) HepG2 and (b) Huh7 cell lipid extracts.
Crithmum maritimum ethyl acetate extract modifies metabolite profile in lipid cell extracts as evaluated by 1H-NMR spectroscopy
Finally, we analysed the lipid fraction in Crithmum maritimum-treated HepG2 and Huh7 cells compared with vehicle (DMSO) samples. Non-polar extracts were characterized by the presence of esterified lipids (TAGs, PUFA, DUFA, MUFA, SFA) and minor components, such as sterols (i.e., cholesterol, 0.68 ppm for total cholesterol and 1.01 ppm for free cholesterol) and phospholipids (partially overlapping singlets at 3.34 due to the N(CH3)3 groups of phosphatidylcholine (PC) and lysophosphatidylcholine (LPC). As shown by the OPLS-DA models (Fig. 7), both obtained with one predictive and one orthogonal component, R2X = 0.77, R2Y = 0.99, Q2 = 0.84 and R2X = 0.66, R2Y = 0.98, Q2 = 0.71, a trend can be detected in both HepG2 and Huh7 samples treated with Crithmum maritimum when compared to vehicle (DMSO). A moderate relative higher content of fatty acids (particularly PUFA ω-3 and ω-6, and MUFA) was observed in Crithmum maritimum-treated extracts of HepG2 cells if compared to vehicle (DMSO). Indeed, relatively lower levels of cholesterol (both free and total), SFA, DUFA, TAGs, and phospholipids (PC, LPC, GPL) were detected in Crithmum maritimum-treated HepG2 cells. A similar trend was observed in Huh7 cells, except for PUFA ω-3. Relevant metabolites found by MVA were evaluated by the integration of the unbiased signal in the 1H-NMR spectra, and the t-test accounted for the significance of variation. Results, expressed as normalized integrals for the discriminating metabolites, are reported in Fig. 8a–c.
Discussion
Studying the effects of plants for the prevention and cure of different diseases is a growing area of interest for the scientific community33. Several plant-derived compounds are under evaluation as potential anti-cancer drugs34, and some are being tested in clinical trials35. Scientific evidence supports the view that beneficial effect on health lies in the complex blend of compounds characteristic of each plant, rather than to the action of a single or few molecules36,37. Indeed, the anticancer effect of a mixture of compounds from desert plant extracts has been described in HCC cells38. Also, some reports demonstrated the effectiveness of the ethyl acetate extract of three traditional plants on cervical cancer39 and HCC40,41.
We have previously shown that Crithmum maritimum ethyl acetate extract exerts an evident cytostatic effect in HCC cell lines9. In this study, we extended the analysis using a metabolomic approach to obtain additional insights for a better understanding of the mechanism of action of this plant extract. Our results clearly show that the metabolite signature notably changed in both cell lines upon treatment with the Crithmum maritimum ethyl acetate extract. This offers an interesting framework, which outlines a multi-target effect on key metabolites (Fig. 1c) that are altered in HCC. Regarding metabolites found in the aqueous fraction, lactate is well-known to be increased in tumours, as a consequence of the Warburg effect42. We observed a significant decrease in intracellular lactate production in both cell lines, which was mirrored by a considerable increase in cell culture media. We also found a substantial decrease in several amino acids, such as valine, tyrosine, phenylalanine, leucine, isoleucine, and glycine in both HCC cell lines. Indeed, it was reported that the level of these amino acids was increased in sera from HCC patients compared to healthy subjects43. This trend was confirmed in another metabonomic study which compared HCC tissues and contiguous healthy liver tissue44. The same study also reported a significant increase of lactate, glycerol, choline, and phosphocholine, and key amino acids, namely leucine, valine, alanine, glutamate, and glutamine in HCC tissues44. The increased level of choline and phosphocholine, described in HCC in vivo by magnetic resonance spectroscopy (MRS)45,46, can be explained by the increased demand for membrane phospholipids due to the accelerated proliferative rate in cancer cells.
As for the lipid fraction, upon treatment with Crithmum maritimum ethyl acetate extract, we found an important decrease of saturated fatty acids (SFAs), triglycerides (TAGs), total cholesterol (total CHO), and mono- and di-unsaturated fatty acids (MUFA and DUFA). Moreover, we observed a significant decrease in free cholesterol and an increase in ω-6 PUFA in both cell lines. ω-3 PUFA were increased in HepG2 cells and slightly decreased instead in Huh7. Recent studies have underlined the role of lipid homeostasis for tumour development and progression. In a study performed in 20 patients, the level of PUFA was significantly lower compared to healthy liver tissue47. More recently, cholesterol was also found to be essential for cancer cell metabolism and was proposed as a promising therapeutic target48. We also observed a slight difference in terms of response to the Crithmum maritimum ethyl acetate extract between the two employed cell lines, which may be due to their different genetic background which accounts for HCC heterogeneity49. Indeed, our study shows that the multi-target action of Crithmum maritimum ethyl acetate extract is effective upon this heterogeneity. This supports the idea of employing a blend of plant-derived bioactive compounds against cancer. This view is further corroborated by the observation that the effect of Crithmum maritimum is still maintained upon extracellular acidic pH conditions. Moreover, since we observed that Crithmum maritimum is also effective in a non-HCC cell line, further investigations should be extended to other malignancies.
Overall, our data demonstrate that Crithmum maritimum ethyl acetate extract normalise the metabolic profile of HCC cells by modulating key metabolic processes. Such pathways were reported to contribute to the tumorigenic phenotype of HCC. As depicted in Fig. 1c, this effect is exerted through a multi-target synergistic effect, which acts on several key "leverage points" of HCC cells, such as glucose metabolism by counteracting the Warburg effect, protein anabolism by decreasing amino acid level, and membrane biosynthesis by reducing choline and phosphocholine. Lipid homeostasis was also affected by lowering the levels of cholesterol, MUFA, and DUFA, and by increasing PUFA. Taken together, these effects provide a biochemical basis for the observed cytostatic effect of Crithmum maritimum in HCC cells.
Our findings identify a metabolic basis for Crithmum maritimum-mediated cytostasis and pave the way for further investigations on the multiple mechanisms by which this plant exerts such effect. This is in line with the need of developing systems pharmacology approaches for improving the treatment of tumours. Plant secondary metabolites have evolved for defence purposes against different categories of aggressors. For this reason, these metabolites are thought to interact with a plethora of targets in biological systems. The synergistic action of many phytochemicals may provide effective tools in disease management, including cancer50,51. In the case of Crithmum maritimum, the synergy of several secondary metabolites, such as phytosterols, glycerolipids, polyacetylenes, hydroxycinnamic acids, and hydroxybenzoic acid derivatives accounts for the observed cytostatic effect in HCC. A systems pharmacology approach using Crithmum maritimum will offer concrete opportunities for developing new effective therapeutic opportunities for HCC by integrating established drug protocols with plant-derived formulations.
Materials and methods
Chemicals
All of the solvents employed for the extraction procedure and analytical determinations were of analytical grade and HPLC grade. Hexane was purchased from Honeywell, ethyl acetate, methanol, and ethanol from Sigma-Aldrich. Dimethyl sulfoxide (DMSO) was purchased from Corning [cat. # 25-950-CQC].
All chemical reagents used for 1H-NMR analyses were of analytical grade. CDCl3, CD3OD (99.8 atom%D), TMS (0.03% v/v) were purchased from Armar Chemicals (Döttingen, Switzerland).
Plant material and extraction procedure
Crithmum maritimum L. was harvested on the Apulian coast in the Bari metropolitan area (Bari S. Spirito). The extraction procedure was performed as previously described9. Briefly, after the whole plant was desiccated at 60 °C, the powder was obtained by mechanical trituration. The average yield of extraction obtained was ≈ 96% fresh/dried plant material. The powder was then subjected to the first extraction with hexane, by adding 150 mL of hexane to 150 mg plant powder in a conical flask and leaving the mixture under gentle orbital shaking for 48 h. Then, after filtration, the extract was let to evaporate at room temperature under a chemical hood. The extraction protocol described above was then repeated for ethyl acetate, methanol, and ethanol. Obtained extracts were then solubilised in cell culture-grade DMSO. The concentration of the extract was determined by high-pressure liquid chromatography (HPLC) as previously described9.
Cell culturing
Huh7 and HepG2 cell lines were purchased from JCRB cell bank [cat. # JCRB0403 and cat. # JCRB1054, respectively]. HeLa cell line was purchased from ATCC cell bank [cat. # ATCC CCL-2). All of the three cell lines were grown in Dulbecco's modified Eagle's medium (DMEM) with 1 g/L glucose, 4 mM glutamine, 1 mM sodium pyruvate [Corning cat. #10-014-CVR], supplemented with 1X MEM-Nonessential Amino Acids [Corning cat. # 25-025-CIR], 20 mM Hepes Buffer [Aurogene cat. # AU-L0180-500], 1X Antibiotic–Antimycotic solution [Corning cat. # 30-004-CI] and 10% Foetal Bovine Serum (FBS) [Corning cat. # 35-079-CV]. Cells were grown under standard culturing conditions (humidified atmosphere, 37 °C, and 5% CO2).
For 1H-NMR experiments, cells were treated with Crithmum maritimum ethyl acetate extract 0.5 μM for 48 h. Then, 1 mL of cell culture media was harvested from vehicle- and Crithmum maritimum-treated cells. Cell pellets were obtained after centrifugation of scraped and harvested cells. For cell proliferation experiments, cells were treated with the four different Crithmum maritimum extracts at 0.5 μM for 72 h and then processed for crystal violet staining as described below in this section. Cell proliferation experiments in acidic pH conditions were performed using DMEM medium acidified at pH 6.8 with 1 M HCl as previously reported52. Cells were plated in the acidified DMEM, treated with the four different Crithmum maritimum extracts at 0.5 μM for 72 h, and then processed for crystal violet staining.
Sample preparation for 1H-NMR analysis
Cell samples: NMR samples were obtained from Huh7 and HepG2 cell pellets and cell culture medium (CCM). Cell extracts were prepared according to a modified Bligh and Dyer two-step method53–55 with a methanol/chloroform/water mixture, which was further treated to separate polar and lipophilic fractions. The hydrophilic and lipophilic phases were separated and dried using a SpeedVac concentrator. Lipid fractions were dissolved in 600 µL CDCl3 and transferred to a 5-mm NMR tube. Polar fractions and CCM samples were resuspended in a D2O phosphate buffer (0.1 M K2HPO4, 2 mM sodium azide, pH 7.4)29,55.
For Crithmum m. extract: to obtain a satisfactory dissolution of polar and non-polar analytes, the ethyl acetate extract was resuspended in a 1:1 CD3OD:CDCl3 (containing tetramethylsilane, TMS 0.03 v/v %) mixture. 600 μL of the mixture was transferred into a 5-mm NMR tube and immediately subjected to NMR analysis.
1H-NMR measurements
Cell samples
For each aqueous sample a 1D sequence with pre-saturation and composite pulse for selection (zgcppr Bruker standard pulse sequence) was acquired, with 256 transients, 16 dummy scans, 5 s relaxation delay, size of fid of 64 K data points, a spectral width of 12,019.230 Hz (20.0276 ppm) and an acquisition time of 2.73 s, and with chemical shift referencing to trimethylsilyl propionic-2,2,3,3-d 4 acid sodium salt (TSP) signal (δ = 0.00 ppm). The resulting FIDs were multiplied by an exponential weighting function corresponding to a line broadening of 0.3 Hz before Fourier transformation, automated phasing, and baseline correction. For each lipid extract a one-dimensional experiment (zg Bruker pulse program) was run with 128 scans, 64 K time domain, spectral width 20.0276 ppm (12,019.230 Hz), 5 s delay, p1 8 µs and 2.73 s acquisition time. All spectra were referenced to the tetramethylsilane (TMS) signal (δ = 0.00 ppm). Metabolites were assigned based on 2D NMR spectra analysis (2D 1H Jres, 1H COSY, 1H-13C HSQC, and HMBC) and by comparison with published data29–31,56,57.
Crithmum maritimum ethyl acetate extract: Sample characterisation was performed by acquiring a 1H-NMR spectrum with water signal suppression (Bruker pulseprogram zgcppr), in a spectral window of 20.0276 ppm (12,019.230 Hz), 128 scans, and a 90° pulse of 7.55 µs, 64 K time domain, spectral width 20.0276 ppm (12,019.230 Hz), 5 s delay, and 2.73 s acquisition time. After the acquisition, the standard FID processing procedures were carried out, by using TopSpin 3.5 (Bruker, Biospin, Italy), such as the Fourier transform (a mathematical operation that converts signals into a frequency spectrum), the phase and baseline correction, and 0.3 Hz line broadening. All the 1H-NMR spectra were calibrated to the internal standard TMS (δ = 0.00 ppm). Characterization of metabolites was performed by the analysis of two-dimensional homo- and heteronuclear NMR spectra (2D 1H J-resolved, 1H COSY, 1H-13C HSQC, and HMBC) and by comparison with published data17,21,22,24–27,58.
All measurements were performed on a Bruker Avance III 600 Ascend NMR spectrometer (Bruker, Bruker, Ettlingen, Germany) operating at 600.13 MHz for 1H observation, equipped with a z-axis gradient coil and automatic tuning-matching (ATM). Experiments were acquired at 300 K in automation mode after loading individual samples on a Bruker Automatic Sample Changer, interfaced with the software IconNMR (Bruker).
Multivariate data analysis
To account for variations of the overall concentrations of samples, NMR spectra were processed using Topspin 3.6.1 and Amix 3.9.13 software (Bruker, Biospin, Italy) for simultaneous visual inspection and the successive bucketing process. NMR spectra were segmented in rectangular buckets of fixed 0.04 ppm width and integrated. For aqueous cell fractions, spectral regions between 5.00–4.50 ppm were discarded because of the residual peak of water signal, while for CCM NMR spectra, signals of Hepes and DMSO and its affected neighbouring regions between 3.87–3.77 and 3.20–2.55 ppm were discarded. For lipid extract, 1H-NMR spectra—regions between 7.75–6.75, 3.48–3.25, and 1.70–1.44 ppm—were excluded before analysis due to the residual peaks of solvents (chloroform, methanol, and residual water signals). For each of the resulting data sets, a matrix was obtained, made of the bucketed 1H-NMR spectra values (columns) measured for each sample (rows). The mean centred and Pareto scaling procedures were applied to the data before multivariate statistical analyses, to attenuate the effect of dominant variables and noise while amplifying weak signals to the largest possible32,59,60.
Quantitative analysis of metabolites performed by 1H-NMR spectroscopy
By 1H-NMR spectroscopy, metabolites of interest were quantified by analysing the integrals of selected distinctive unbiased NMR signals. Integral values for metabolite quantitative analysis were referred to as the internal standard (TSP and TMS for aqueous and lipid extracts, respectively). Results, represented as mean intensities and standard error mean of the selected NMR signals, were validated by the univariate t-test61–63. Levels of statistical significance were at least at p-values < 0.05 with a 95% confidence level. The univariate analysis made on the integral area of metabolites between groups was performed using MeTPA MetaboAnalyst software64.
Cell proliferation assays
End-point proliferation was assessed by crystal violet staining 72 h after plant extract addition. Crystal violet [Sigma-Aldrich cat. #C3886] was diluted in EtOH/H2O 10% v/v to obtain a 1 mg/mL solution. Before Crystal violet addition, cells were fixed in 4% paraformaldehyde. Colour elution was performed with 10% acetic acid and absorbance was measured at λ = 595 nm using an iMark plate reader [Bio-Rad cat. #168–1135].
Statistical analyses
Concerning 1H-NMR, relevant metabolites detected by MVA were evaluated by the integration of the unbiased signal in the 1H-NMR spectra, and statistical significance, set at p < 0.05, was assessed by t-test.
Cell proliferation data were analysed by Two-way ANOVA, followed by Dunnett’s multiple comparisons test. For data not normally distributed, the Kruskal–Wallis test followed by Dunn’s multiple comparisons test was employed.
Supplementary Information
Acknowledgements
This work was supported by Agenzia Regionale Strategica per la Salute ed il Sociale – ARESS Puglia—in accordance with the project "The Apulian Lifestyle"—Delibera di Giunta n. 556 (18/04/2017). We are grateful to Ms. Loredana Acquaro for her technical support.
Author contributions
D.G. planned and performed the experiments, and wrote the manuscript. L.D. performed metabolomic experiments and analysed data. C.G. performed metabolomic experiments and analysed data. F.C. contributed to performing the experiments. G.C. contributed in designing the project. C.S. revised the manuscript. F.P.F. supervised metabolomic experiments, analysed data, and wrote the manuscript. A.M. conceived and supervised the project, planned the experiments, and wrote the manuscript.
Competing interests
The authors declare no competing interests.
Footnotes
Publisher's note
Springer Nature remains neutral with regard to jurisdictional claims in published maps and institutional affiliations.
Contributor Information
Francesco Paolo Fanizzi, Email: fp.fanizzi@unisalento.it.
Antonio Mazzocca, Email: antonio.mazzocca@uniba.it.
Supplementary Information
The online version contains supplementary material available at 10.1038/s41598-020-78867-1.
References
- 1.de Lope CR, Tremosini S, Forner A, Reig M, Bruix J. Management of HCC. J. Hepatol. 2012;56(1):S75–87. doi: 10.1016/S0168-8278(12)60009-9. [DOI] [PubMed] [Google Scholar]
- 2.Forner A, Reig M, Bruix J. Hepatocellular carcinoma. Lancet. 2018 doi: 10.1016/S0140-6736(18)30010-2. [DOI] [PubMed] [Google Scholar]
- 3.Kudo M. Systemic therapy for hepatocellular carcinoma: Latest advances. Cancers (Basel) 2018 doi: 10.3390/cancers10110412. [DOI] [PMC free article] [PubMed] [Google Scholar]
- 4.Waidmann O. Recent developments with immunotherapy for hepatocellular carcinoma. Exp. Opin. Biol. Ther. 2018;18:905–910. doi: 10.1080/14712598.2018.1499722. [DOI] [PubMed] [Google Scholar]
- 5.Wu Z, Lai L, Li M, Zhang L, Zhang W. Acute liver failure caused by pembrolizumab in a patient with pulmonary metastatic liver cancer: A case report. Medicine. 2017;96:e9431. doi: 10.1097/MD.0000000000009431. [DOI] [PMC free article] [PubMed] [Google Scholar]
- 6.Butler MS, Newman DJ. Mother Nature's gifts to diseases of man: The impact of natural products on anti-infective, anticholestemics and anticancer drug discovery. Prog. Drug Res. 2008;65(1):3–44. doi: 10.1007/978-3-7643-8117-2_1. [DOI] [PubMed] [Google Scholar]
- 7.Newman DJ. Natural products as leads to potential drugs: An old process or the new hope for drug discovery? J. Med. Chem. 2008;51:2589–2599. doi: 10.1021/jm0704090. [DOI] [PubMed] [Google Scholar]
- 8.Coseri S. Natural products and their analogues as efficient anticancer drugs. Mini Rev. Med. Chem. 2009;9:560–571. doi: 10.2174/138955709788167592. [DOI] [PubMed] [Google Scholar]
- 9.Gnocchi D, et al. Inhibition of hepatocellular carcinoma growth by ethyl acetate extracts of Apulian Brassica oleracea L. and Crithmum maritimum L. Plant Foods Hum. Nutr. 2019 doi: 10.1007/s11130-019-00781-3. [DOI] [PubMed] [Google Scholar]
- 10.Dona AC, et al. A guide to the identification of metabolites in NMR-based metabonomics/metabolomics experiments. Comput. Struct. Biotechnol. J. 2016;14:135–153. doi: 10.1016/j.csbj.2016.02.005. [DOI] [PMC free article] [PubMed] [Google Scholar]
- 11.Liu Y, et al. Metabolic discrimination of sea buckthorn from different Hippophae species by (1)H NMR based metabolomics. Sci. Rep. 2017;7:1585. doi: 10.1038/s41598-017-01722-3. [DOI] [PMC free article] [PubMed] [Google Scholar]
- 12.Ryu S, et al. NMR-based metabolic profiling and comparison of Japanese persimmon cultivars. Sci. Rep. 2019;9:15011. doi: 10.1038/s41598-019-51489-y. [DOI] [PMC free article] [PubMed] [Google Scholar]
- 13.Jiang M, et al. Comparative metabonomics of Wenxin Keli and Verapamil reveals differential roles of gluconeogenesis and fatty acid beta-oxidation in myocardial injury protection. Sci. Rep. 2017;7:8739. doi: 10.1038/s41598-017-09547-w. [DOI] [PMC free article] [PubMed] [Google Scholar]
- 14.Chen C, et al. NMR-based metabolomic techniques identify the toxicity of emodin in HepG2 cells. Sci. Rep. 2018;8:9379. doi: 10.1038/s41598-018-27359-4. [DOI] [PMC free article] [PubMed] [Google Scholar]
- 15.Pillai SR, et al. Causes, consequences, and therapy of tumors acidosis. Cancer Metastasis Rev. 2019;38:205–222. doi: 10.1007/s10555-019-09792-7. [DOI] [PMC free article] [PubMed] [Google Scholar]
- 16.Spugnini E, Fais S. Proton pump inhibition and cancer therapeutics: A specific tumor targeting or it is a phenomenon secondary to a systemic buffering? Semin Cancer Biol. 2017;43:111–118. doi: 10.1016/j.semcancer.2017.01.003. [DOI] [PubMed] [Google Scholar]
- 17.Sobolev AP, Brosio E, Gianferri R, Segre AL. Metabolic profile of lettuce leaves by high-field NMR spectra. Magn. Reson. Chem. 2005;43:625–638. doi: 10.1002/mrc.1618. [DOI] [PubMed] [Google Scholar]
- 18.Ksouri R, et al. Medicinal halophytes: Potent source of health promoting biomolecules with medical, nutraceutical and food applications. Crit. Rev. Biotechnol. 2012;32:289–326. doi: 10.3109/07388551.2011.630647. [DOI] [PubMed] [Google Scholar]
- 19.Guil JL, Torija ME, Gimenez JJ, Rodriguez I. Identification of fatty acids in edible wild plants by gas chromatography. J. Chromatogr. A. 1996;719:229–235. doi: 10.1016/0021-9673(95)00414-9. [DOI] [PubMed] [Google Scholar]
- 20.Renna M. Reviewing the prospects of sea fennel (Crithmum maritimum L.) as emerging vegetable crop. Plants (Basel) 2018 doi: 10.3390/plants7040092. [DOI] [PMC free article] [PubMed] [Google Scholar]
- 21.Meot-Duros L, et al. New antibacterial and cytotoxic activities of falcarindiol isolated in Crithmum maritimum L. leaf extract. Food Chem. Toxicol. 2010;48:553–557. doi: 10.1016/j.fct.2009.11.031. [DOI] [PubMed] [Google Scholar]
- 22.Tomassini A, et al. (1)H NMR-based metabolomics reveals a pedoclimatic metabolic imprinting in ready-to-drink carrot juices. J. Agric. Food Chem. 2016;64:5284–5291. doi: 10.1021/acs.jafc.6b01555. [DOI] [PubMed] [Google Scholar]
- 23.Christensen LP, Brandt K. Bioactive polyacetylenes in food plants of the Apiaceae family: Occurrence, bioactivity and analysis. J. Pharm. Biomed. Anal. 2006;41:683–693. doi: 10.1016/j.jpba.2006.01.057. [DOI] [PubMed] [Google Scholar]
- 24.Meot-Duros L, Magne C. Antioxidant activity and phenol content of Crithmum maritimum L. leaves. Plant Physiol. Biochem. 2009;47:37–41. doi: 10.1016/j.plaphy.2008.09.006. [DOI] [PubMed] [Google Scholar]
- 25.Pereira CG, et al. Searching for new sources of innovative products for the food industry within halophyte aromatic plants: In vitro antioxidant activity and phenolic and mineral contents of infusions and decoctions of Crithmum maritimum L. Food Chem. Toxicol. 2017;107:581–589. doi: 10.1016/j.fct.2017.04.018. [DOI] [PubMed] [Google Scholar]
- 26.Valverde J, This H. 1H NMR quantitative determination of photosynthetic pigments from green beans (Phaseolus vulgaris L.) J. Agric. Food Chem. 2008;56:314–320. doi: 10.1021/jf070277j. [DOI] [PubMed] [Google Scholar]
- 27.Stabili L, et al. Screening of Chaetomorpha linum lipidic extract as a new potential source of bioactive compounds. Mar. Drugs. 2019 doi: 10.3390/md17060313. [DOI] [PMC free article] [PubMed] [Google Scholar]
- 28.Barrilero R, et al. LipSpin: A new bioinformatics tool for quantitative (1)H NMR lipid profiling. Anal. Chem. 2018;90:2031–2040. doi: 10.1021/acs.analchem.7b04148. [DOI] [PubMed] [Google Scholar]
- 29.Kostidis S, Addie RD, Morreau H, Mayboroda OA, Giera M. Quantitative NMR analysis of intra- and extracellular metabolism of mammalian cells: A tutorial. Anal. Chim. Acta. 2017;980:1–24. doi: 10.1016/j.aca.2017.05.011. [DOI] [PubMed] [Google Scholar]
- 30.Nicholson JK, Foxall PJ, Spraul M, Farrant RD, Lindon JC. 750 MHz 1H and 1H–13C NMR spectroscopy of human blood plasma. Anal. Chem. 1995;67:793–811. doi: 10.1021/ac00101a004. [DOI] [PubMed] [Google Scholar]
- 31.Tukiainen T, et al. A multi-metabolite analysis of serum by 1H NMR spectroscopy: Early systemic signs of Alzheimer's disease. Biochem. Biophys. Res. Commun. 2008;375:356–361. doi: 10.1016/j.bbrc.2008.08.007. [DOI] [PubMed] [Google Scholar]
- 32.Xing YX, et al. Anti-cancer effects of emodin on HepG2 cells as revealed by (1)H NMR based metabolic profiling. J. Proteome Res. 2018;17:1943–1952. doi: 10.1021/acs.jproteome.8b00029. [DOI] [PubMed] [Google Scholar]
- 33.Wurtzel ET, Kutchan TM. Plant metabolism, the diverse chemistry set of the future. Science. 2016;353:1232–1236. doi: 10.1126/science.aad2062. [DOI] [PubMed] [Google Scholar]
- 34.Gordaliza M. Natural products as leads to anticancer drugs. Clin. Transl. Oncol. 2007;9:767–776. doi: 10.1007/s12094-007-0138-9. [DOI] [PubMed] [Google Scholar]
- 35.Saklani A, Kutty SK. Plant-derived compounds in clinical trials. Drug Discov. Today. 2008;13:161–171. doi: 10.1016/j.drudis.2007.10.010. [DOI] [PubMed] [Google Scholar]
- 36.Karna P, et al. Benefits of whole ginger extract in prostate cancer. Br. J. Nutr. 2012;107:473–484. doi: 10.1017/S0007114511003308. [DOI] [PMC free article] [PubMed] [Google Scholar]
- 37.Liu RH. Health benefits of fruit and vegetables are from additive and synergistic combinations of phytochemicals. Am. J. Clin. Nutr. 2003;78:517S–520S. doi: 10.1093/ajcn/78.3.517S. [DOI] [PubMed] [Google Scholar]
- 38.Thoppil RJ, Harlev E, Mandal A, Nevo E, Bishayee A. Antitumor activities of extracts from selected desert plants against HepG2 human hepatocellular carcinoma cells. Pharm. Biol. 2013;51:668–674. doi: 10.3109/13880209.2012.749922. [DOI] [PubMed] [Google Scholar]
- 39.Ma JF, et al. The ethyl acetate extract of Gynura formosana Kitam. Leaves inhibited cervical cancer cell proliferation via induction of autophagy. Biomed. Res. Int. 2018 doi: 10.1155/2018/4780612. [DOI] [PMC free article] [PubMed] [Google Scholar]
- 40.Cao Z, et al. Ethyl acetate extraction from a Chinese herbal formula, Jiedu Xiaozheng Yin, inhibits the proliferation of hepatocellular carcinoma cells via induction of G0/G1 phase arrest in vivo and in vitro. Int. J. Oncol. 2013;42:202–210. doi: 10.3892/ijo.2012.1703. [DOI] [PubMed] [Google Scholar]
- 41.Chen XZ, et al. Ethyl acetate extract from Jiedu Xiaozheng Yin inhibits the proliferation of human hepatocellular carcinoma cells by suppressing polycomb gene product Bmi1 and Wnt/beta-catenin signaling. Oncol. Rep. 2014;32:2710–2718. doi: 10.3892/or.2014.3541. [DOI] [PubMed] [Google Scholar]
- 42.Luc R, Tortorella SM, Ververis K, Karagiannis TC. Lactate as an insidious metabolite due to the Warburg effect. Mol. Biol. Rep. 2015;42:835–840. doi: 10.1007/s11033-015-3859-9. [DOI] [PubMed] [Google Scholar]
- 43.Huang Q, et al. Metabolic characterization of hepatocellular carcinoma using nontargeted tissue metabolomics. Cancer Res. 2013;73:4992–5002. doi: 10.1158/0008-5472.CAN-13-0308. [DOI] [PubMed] [Google Scholar]
- 44.Yang Y, et al. Metabonomic studies of human hepatocellular carcinoma using high-resolution magic-angle spinning 1H NMR spectroscopy in conjunction with multivariate data analysis. J. Proteome Res. 2007;6:2605–2614. doi: 10.1021/pr070063h. [DOI] [PubMed] [Google Scholar]
- 45.Chen CY, et al. Early response of hepatocellular carcinoma to transcatheter arterial chemoembolization: Choline levels and MR diffusion constants–initial experience. Radiology. 2006;239:448–456. doi: 10.1148/radiol.2392042202. [DOI] [PubMed] [Google Scholar]
- 46.Kuo YT, et al. In vivo proton magnetic resonance spectroscopy of large focal hepatic lesions and metabolite change of hepatocellular carcinoma before and after transcatheter arterial chemoembolization using 30-T MR scanner. J. Magn. Reson. Imaging. 2004;19:598–604. doi: 10.1002/jmri.20046. [DOI] [PubMed] [Google Scholar]
- 47.Li Z, et al. Aberrant lipid metabolism in hepatocellular carcinoma revealed by liver lipidomics. Int. J. Mol. Sci. 2017 doi: 10.3390/ijms18122550. [DOI] [PMC free article] [PubMed] [Google Scholar]
- 48.Gu L, Saha ST, Thomas J, Kaur M. Targeting cellular cholesterol for anticancer therapy. FEBS J. 2019;286:4192–4208. doi: 10.1111/febs.15018. [DOI] [PubMed] [Google Scholar]
- 49.Kim J, et al. Wild-type p53 promotes cancer metabolic switch by inducing PUMA-dependent suppression of oxidative phosphorylation. Cancer Cell. 2019;35:191–203. doi: 10.1016/j.ccell.2018.12.012. [DOI] [PubMed] [Google Scholar]
- 50.Efferth T, Koch E. Complex interactions between phytochemicals. The multi-target therapeutic concept of phytotherapy. Curr. Drug Targets. 2011;12:122–132. doi: 10.2174/138945011793591626. [DOI] [PubMed] [Google Scholar]
- 51.Efferth T, et al. Integration of phytochemicals and phytotherapy into cancer precision medicine. Oncotarget. 2017;8:50284–50304. doi: 10.18632/oncotarget.17466. [DOI] [PMC free article] [PubMed] [Google Scholar]
- 52.Kondo A, et al. Extracellular acidic pH activates the sterol regulatory element-binding protein 2 to promote tumor progression. Cell. Rep. 2017;18:2228–2242. doi: 10.1016/j.celrep.2017.02.006. [DOI] [PubMed] [Google Scholar]
- 53.Beckonert O, et al. Metabolic profiling, metabolomic and metabonomic procedures for NMR spectroscopy of urine, plasma, serum and tissue extracts. Nat. Protoc. 2007;2:2692–2703. doi: 10.1038/nprot.2007.376. [DOI] [PubMed] [Google Scholar]
- 54.Bligh EG, Dyer WJ. A rapid method of total lipid extraction and purification. Can. J. Biochem. Physiol. 1959;37:911–917. doi: 10.1139/o59-099. [DOI] [PubMed] [Google Scholar]
- 55.De Castro F, et al. Response of cisplatin resistant Skov-3 cells to [Pt(O, O'-Acac)(gamma-Acac)(DMS)] treatment revealed by a metabolomic (1)H-NMR study. Molecules. 2018 doi: 10.3390/molecules23092301. [DOI] [PMC free article] [PubMed] [Google Scholar]
- 56.Adosraku RK, Choi GT, Constantinou-Kokotos V, Anderson MM, Gibbons WA. NMR lipid profiles of cells, tissues, and body fluids: Proton NMR analysis of human erythrocyte lipids. J. Lipid Res. 1994;35:1925–1931. doi: 10.1016/S0022-2275(20)39939-9. [DOI] [PubMed] [Google Scholar]
- 57.Marks V, Munoz A, Rai P, Walls JD. (1)H NMR studies distinguish the water soluble metabolomic profiles of untransformed and RAS-transformed cells. PeerJ. 2016;4:e2104. doi: 10.7717/peerj.2104. [DOI] [PMC free article] [PubMed] [Google Scholar]
- 58.Wan C, Li S, Liu L, Chen C, Fan S. Caffeoylquinic acids from the aerial parts of Chrysanthemum coronarium L. Plants (Basel) 2017 doi: 10.3390/plants6010010. [DOI] [PMC free article] [PubMed] [Google Scholar]
- 59.Craig A, Cloarec O, Holmes E, Nicholson JK, Lindon JC. Scaling and normalization effects in NMR spectroscopic metabonomic data sets. Anal Chem. 2006;78:2262–2267. doi: 10.1021/ac0519312. [DOI] [PubMed] [Google Scholar]
- 60.van den Berg RA, Hoefsloot HC, Westerhuis JA, Smilde AK, van der Werf MJ. Centering, scaling, and transformations: Improving the biological information content of metabolomics data. BMC Genom. 2006;7:142. doi: 10.1186/1471-2164-7-142. [DOI] [PMC free article] [PubMed] [Google Scholar]
- 61.Casadei-Gardini A, et al. (1)H-NMR based serum metabolomics highlights different specific biomarkers between early and advanced hepatocellular carcinoma stages. Cancers (Basel) 2020 doi: 10.3390/cancers12010241. [DOI] [PMC free article] [PubMed] [Google Scholar]
- 62.Del Coco L, et al. (1)H NMR spectroscopy and MVA to evaluate the effects of caulerpin-based diet on diplodus sargus lipid profiles. Mar. Drugs. 2018 doi: 10.3390/md16100390. [DOI] [PMC free article] [PubMed] [Google Scholar]
- 63.Del Coco L, et al. NMR-based metabolomic approach tracks potential serum biomarkers of disease progression in patients with type 2 diabetes mellitus. J. Clin. Med. 2019 doi: 10.3390/jcm8050720. [DOI] [PMC free article] [PubMed] [Google Scholar]
- 64.Xia J, Wishart DS. MetPA: A web-based metabolomics tool for pathway analysis and visualization. Bioinformatics. 2010;26:2342–2344. doi: 10.1093/bioinformatics/btq418. [DOI] [PubMed] [Google Scholar]
Associated Data
This section collects any data citations, data availability statements, or supplementary materials included in this article.


