Abstract
In the present paper, with using diverse methods (including the SEM, the XRD, the TPO, the FTIR, and the TGA) , the authors analysed samples of the major coal seam in Dahuangshan Mining area with different particle sizes and with different heated temperatures (from 50 to 800 °C at regular intervals of 50 °C). The results from SEM and XRD showed that high temperature and high number of pores, fissures, and hierarchical structures in the coal samples could facilitate oxidation reactions and spontaneous combustion. A higher degree of graphitization and much greater number of aromatic microcrystalline structures facilitated spontaneous combustion. The results from TPO showed that the oxygen consumption rate of the coal samples increased exponentially with increasing temperature. The generation rates of different gases indicated that temperatures of 90 °C or 130 °C could accelerate coal oxidation. With increasing temperature, the coal oxidation rate increased, and the release of gaseous products was accelerated. The FTIR results showed that the amount of hydroxide radicals and oxygen-containing functional groups increased with the decline in particle size, indicating that a smaller particle size may facilitate the oxidation reaction and spontaneous combustion of coal. The absorbance and the functional group areas at different particle sizes were consistent with those of the heated coal samples, which decreased as the temperature rose. The results from TGA showed that the characteristic temperature T3 declined with decreasing particle size. After the sample with 0.15–0.18 mm particle size was heated, its carbon content decreased, and its mineral content increased, inhibiting coal oxidation. This result also shows that the activation energy of the heated samples tended to increase at the stage of high-temperature combustion with increasing heating temperature.
Subject terms: Natural hazards, Engineering
Introduction
Coal spontaneous combustion (CSC) is a potential disastrous event related to coal mining. It is known that the coal is rich in the Xinjiang region of China, which has experienced severe coal spontaneous combustions events. These events not only pose a serious threat to the safe production of coal mines but also lead impacts on the regional ecological environment1,2. The occurrence of CSC is results from the combined action of internal and external factors. The evolution patterns of the coal oxidation microstructure under different temperatures and oxygen conditions have been compared and analysed by X-ray diffraction (XRD) and Fourier transform infrared (FTIR) spectroscopy3. Wang et al. studied this issue from a micro-perspective, relying on quantum chemistry theory and infrared spectroscopy: they investigated the molecular structure of coal and several oxidation mechanisms4. Researchers have analysed the microstructures and functional group reactions and examined the change in the main oxygen-containing functional groups during a low-temperature coal oxidation process5–7.Nimaje and Tripathy investigated the spontaneous combustion characteristics of Indian coal samples8, while Avila et al. studied the effect of coal rock composition on coal spontaneous combustion9. Bhoi et al. simulated and investigated the combustion and pyrolysis process of brown coal10. Zhang et al. used infrared spectroscopy to monitor the methyl and methylene molecular groups, and their reaction kinetic parameters, during a low-temperature oxidation of different coal grades11. Zhang et al. conducted a temperature-programmed oxidation (TPO) experiment to analyse the rate of coal consumption and the intensity of heat release from three coal samples12. Using thermogravimetry (TG), Krzysztof et al. investigated the pyrolysis behaviour of 11 solid fuels of 11 different grades to ascertain the relationship between the activation energy and pre-exponential factor13. Qi et al. tested the thermodynamic properties associated with the reaction process occurring at low oxygen concentrations and analysed the corresponding kinetic factors14. Bai et al. investigated the effects of ionic liquids (ILs) on coal macrostructures, and characteristic parameters of coal samples during low-temperature oxidation were observed and evaluated by FTIR and TG-DSC15,16. These studies mainly focused on the effects of internal and external factors (e.g., the coal microstructures, the volatile components, the coal rock components, the indicator gases, the functional groups, and the ambient temperature) on the spontaneous combustion of coal, but few studies have focused on spontaneous combustion in major coal seams in the Xinjiang region, a region that contains more than 40 percent of the coal resources in China and still poses a serious risk of coal fire induced by CSC.
Considering the severe risk of CSC in this region, the authors attempted to investigate the thermodynamic characteristics of the major coal seam in the Dahuangshan mining area using diverse methods to reveal the macro- and micro-scale change characteristics of coal oxidation processes and provide a basis for the prevention and control of CSC in the Dahuangshan mining area.
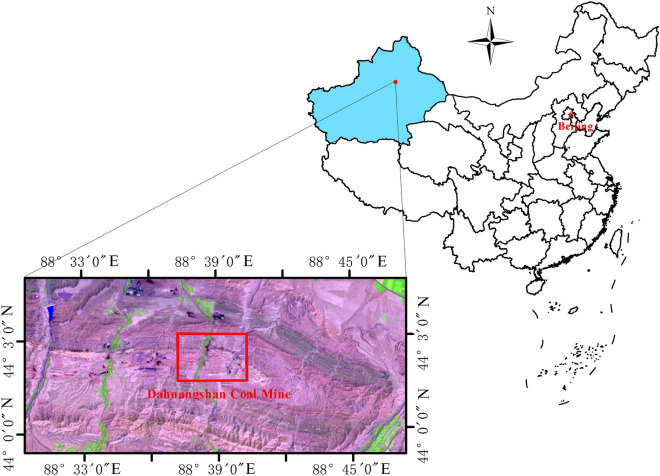
The Dahuangshan Mining area is situated in east of the southern Junggar coalfield (see Fig. 1). The major mineable coal seam is A5, with a thickness of approximately 30 m. According to the mining experience of this coal seam, residual coal in gob has been found to be very prone to spontaneous combustion. In fact, coal fires in the Dahuangshan Mining area were extinguished in the mid-1990s with continuous 4 years efforts of extinction. In recent years, with the increase of mining activities in this coal mining area, there is still a risk of CSC in this mining area.
Figure 1.
Location of the study area.
Materials and methods
Coal Samples
Collected raw coal was crushed and grilled into samples with particle sizes of 0.25–0.38 mm, 0.15–0.18 mm, 0.109–0.12 mm, 0.08–0.096 mm, and < 0.075 mm. Some of the samples with particle sizes of 0.15–0.18 mm was heated in a muffle furnace at the temperatures of 50 °C, 100 °C, 150 °C, 200 °C, 250 °C, 300 °C, 350 °C, 400 °C, 450 °C, 500 °C, 550 °C, 600 °C, 650 °C, 700 °C, 750 °C, and 800 °C. Table 1 shows the proximate and ultimate values of the coal. The ash was also analysed, as showed in Table 2.
Table 1.
Proximate and ultimate values for the A5 coal seam.
| Mad (%) | Aad (%) | Vad (%) | FCad (%) | Cad (%) | Had (%) | Oad (%) | Nad (%) | St, ad (%) | Mt (%) |
|---|---|---|---|---|---|---|---|---|---|
| 1.74 | 10.30 | 38.24 | 49.72 | 71.51 | 4.82 | 10.35 | 1.04 | 0.24 | 2.6 |
Table 2.
Oxides in the ash residue of the coal sample.
| SiO2 (%) | Al2O3 (%) | TiO2 (%) | K2O (%) | Na2O (%) | MnO2 (%) | Fe2O3 (%) | CaO (%) | MgO (%) | SO3 (%) | P2O5 (%) |
|---|---|---|---|---|---|---|---|---|---|---|
| 46.57 | 7.55 | 1.39 | 0.37 | 1.34 | 0.47 | 17.35 | 10.33 | 3.37 | 2.80 | 0.01 |
The ash residue contained SiO2, Fe2O3, CaO, Al2O3, MgO, SO3, TiO2, Na2O and so on. The oxides in the ash residue of coal sample were divided into acidic and basic oxides. The acidic oxides included SiO2, Al2O3, TiO2, and the basic oxides included Fe2O3, Na2O, CaO, MgO and K2O. The amount of SiO2 (46.57%) was in the range of 45–60%, and SiO2 has a high ash fusibility, which will reduce the coal combustibility.
Methods
Scanning electron microscope analysis
Coal samples were scanned using a Hitachi Su8000 (Japan) high-resolution field emission electron microscope. Changes of microstructure in coal samples (such as pores, fissures and surface morphology) were investigated before and after heating.
XRD analysis
A 18-Kw X-ray powder diffractometer (MacScience, Japan) was used for the XRD analysis, which involved the use of Cu–Ka radiation (step = 0.02034°, counting time = 19.2 s per step, voltage = 40 kV, current = 40 mA, and scanning range = 5–80°).
Temperature-programmed oxidation (TPO) analysis
The five coal samples with particle sizes of 0.25–0.38 mm, 0.15–0.18 mm, 0.109–0.12 mm, 0.08–0.096 mm, and < 0.075 mm were mixed. Then, the mixed sample was tested on a BPG-907a experiment platform (XUST, China). The TPO analysis was performed at a heating rate of 0.3 °C per min, heating range of 30–170 °C, and an airflow rate of 120 mL per min. After each 10 °C increment, the exit gas was collected and analysed for quantifying composition and concentration. The composition and concentration of gases include O2, CO, CO2, and CnHm. When the temperature of the coal sample exceeded that of the furnace chamber, the TPO test was finished.
Infrared spectroscopy analysis
A Vertex 70 Fourier infrared spectrometer (Bruker, Germany) was used for this type of analysis. The experimental conditions were as follows: RES = 4.0 cm−1, scans = 120, and wavelength = 400–4000 cm−1.
TGA
A Hitachi STA 7300 thermal analyser (Japan) was used with nitrogen gas. The experimental conditions included a heating rate = 10 °C per min, flow rate = 200 mL per min, and temperature that ranged from ambient room temperature to 1000 °C.
Data processing
Calculation of the microcrystalline structure parameters
Based on the XRD diffraction pattern of coal, the following microcrystalline structure parameters can be accurately calculated using the Bragg equation and the Scherer formula: the distances between the aromatic monolayers (d002 and d100; 10–1 nm), the diameter of the aromatic layer (La; 10–1 nm), and the average stacking thickness of the aromatic layers (Lc; 10–1 nm). d002 was calculated using the Bragg angle Eq. (1), while Lc and La were calculated using the Scherrer equation17:
| 1 |
| 2 |
| 3 |
where λ denotes the wavelength of the incident X-ray, (nm), θ002 and θ100 denote the Bragg angles corresponding to Peak 002 and Peak 100, respectively, (°) ; β002 and β100 denote the half widths of Peak 002 and Peak 100, respectively, (rad); and K1 and K2 are the microcrystalline shape factors of coal, respectively, (k1 = 0.94, k2 = 1.84). The coal interlayer spacing (d002) ranged between the values typical of cellulose and graphite (3.975 × 10⁻¹ nm and 3.354 × 10⁻¹ nm, respectively). Analogously, the degree of graphitisation, the degree of graphitization (P) can be used to represent the stacking structure of aromatic layers in coal and assess the relative contents of stacking structures in the aromatic and fat layers based on the following equation18:
| 4 |
where P denotes the degree of graphitization, dm denotes the distance between the aromatic layers (nm), dc denotes the distance between the microcrystalline structure layers of graphite (dc = 3.975 × 10⁻¹ nm), and dg denotes the distance between the microcrystalline structure layers of the fibre bundles (dg = 3.354 × 10⁻¹ nm).
Characteristic temperatures
Based on the TGA data, the TG curve were plotted and shown in Fig. 2.
Figure 2.
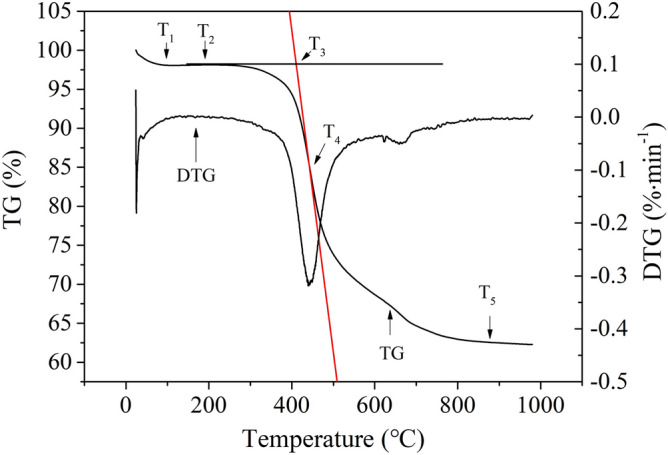
TG curves of the coal samples.
The values of T1–T5 in Fig. 2 denote the characteristic temperatures of coal at different stages of the TG test: T1 denotes the corner point temperature (at which the coal sample gained weight, after water loss and oxygen uptake), T2 denotes the initial temperature of pyrolysis, T3 denotes the ignition temperature, T4 denotes the temperature at which the burning rate was maximized, and T5 denotes the burn-out temperature.
Calculation of the activation energy
The activation energy was calculated using the Coats–Redfern integral method. Here, the coal–oxygen combustion reaction was viewed as a first-order reaction. According to the Arrhenius law, the reaction rate of coal combustion can be calculated based on the following equation:
| 5 |
where k denotes the coal–oxygen reaction rate constant, A denotes the frequency factor, E denotes the activation energy (kJ/mol), T denotes the reaction temperature (K), and R denotes the gas constant (R = 8.314 J/(mol⋅K)).
The mass conversion rate during the coal–oxygen reaction process was calculated as follows:
| 6 |
where α denotes the mass conversion rate during the coal combustion process, m0 is the mass of the coal sample at the start of the TGA experiment, mt is the mass of the coal sample in the reaction equipment at moment t (after the start of the TGA experiment), and m∞ is the mass of the coal sample in the reaction equipment at the end of the TGA experiment. The reaction rate was calculated as follows:
| 7 |
where k denotes the chemical reaction rate and t is the time.
Then, an integral operation was performed with the Coats–Redfern approximation, yielding the following equations:
| 8 |
| 9 |
Considering the general reaction temperature range and the activation energy (E), the E/RT was ≥ 1, and 1–2RT/E ~ 1. For n = 1, Eq. (8) could be rewritten as follows:
| 10 |
The above equation was employed to calculate the kinetic parameters of the coal–oxygen reaction in the coal samples. A diagram was generated considering 1n[ − 1n(1 − α)/T2] for the vertical axis and 1/T for the horizontal axis. A linear fitting was then performed on the diagram, and the activation energy was determined according to the slope of the fitting line.
Results and discussions
Coal micromorphology
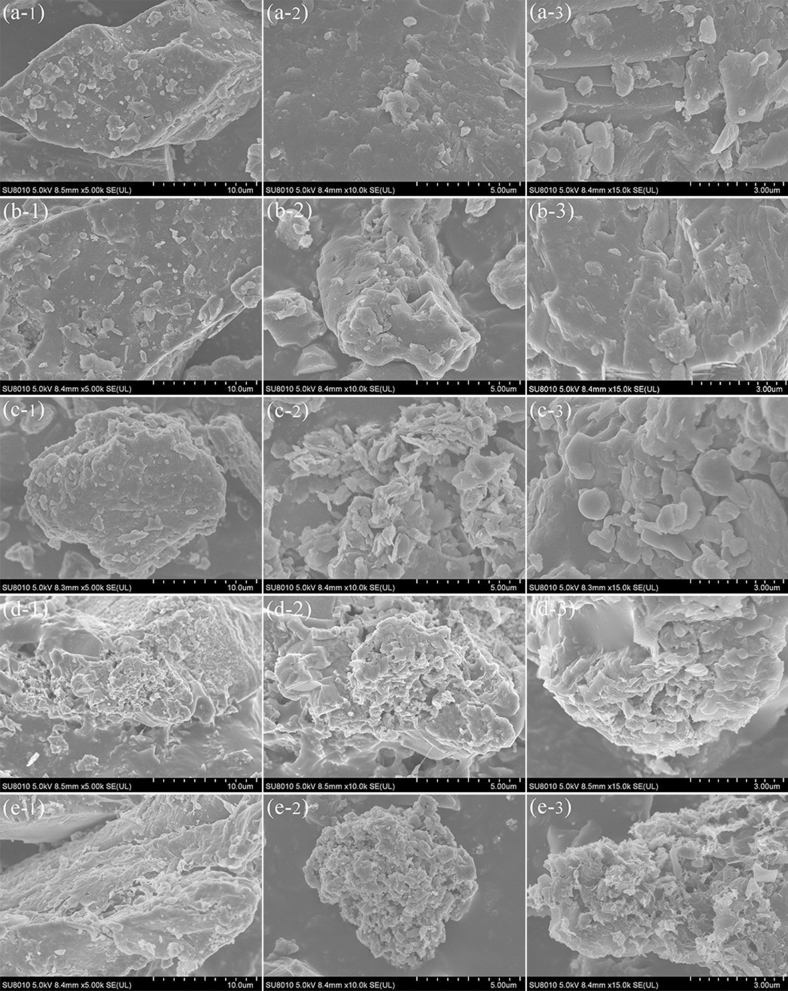
The raw coal sample with particle sizes between 0.15 and 0.18 mm was scanned before and after it was heated to 200 °C, 400 °C, 600 °C, and 800 °C. Figure 3 shows the scan images captured at 5000×; 10,000×; and 15,000× magnification.
Figure 3.
SEM images of the coal sample with particle sizes of 0.15–0.18 mm before and after heating.
As shown in Fig. 3, the initial raw coal sample presented a smooth surface and few pores or fissures; moreover, most of the fissures were on the non-stratified surface. After the coal sample was heated to 200 °C, its surface was still non-stratified and presented few pores or fissures; after it was heated to 400 °C, a few stratifications and scraps appeared; after it was heated to 600 °C, its surface became rough, the number of pores and fissures increased, and its specific surface area increased; finally, after it was heated to 800 °C, its surface showed obvious stratification, and many pores and laminations could be observed. Overall, a high heating temperature, a high number of pores and fissures, and a larger superficial area apparently facilitated the extension and connection of microfissures in the coal sample, promoting its oxidation.
Microcrystalline structure analysis
Microcrystalline structures
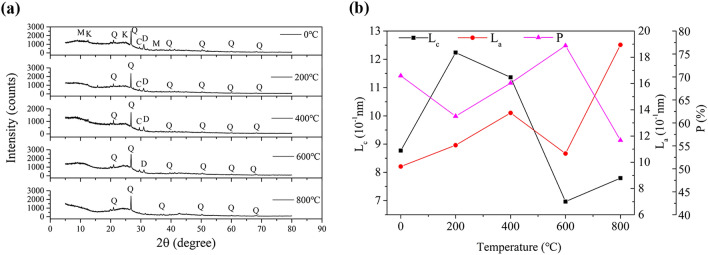
Coal contains both elementary macromolecular and secondary reticular structures. Reticular structures result from the cross-linking of stacked aromatic nuclei, aliphatic side chains, hydrogen-bonding cations connected through oxygen-containing functional groups, and electric charges. The XRD spectrum of the experimental coal sample with 0.15–0.18 mm particle sizes (Fig. 4a) shows a certain regularity and contains two obvious peaks: Peak 002 (at ~ 25°) and Peak 100 (at ~ 44°). Peak 002 resulted from the superposition of the γ and 002 bands and became narrower and more intense as the coal metamorphic grade increased. Peak 100 reflected the condensation degree of the aromatic nuclei (i.e., the size of the carbon net layer in the aromatic nuclei) and was particularly obvious in the case of high metamorphic grade (i.e., degree of graphitization), suggesting a better directional arrangement of the aromatic layers in the coal molecules.
Figure 4.
Results from XRD experiments [a XRD spectrum at different temperatures; b microcrystalline structure parameters (Q–quartz, K– kaolinite, D–dolomite, C–calcite, M–muscovite)].
Through the analysis of the XRD spectrum and related calculation, the microcrystalline structure of the aromatic series (i.e., structural alignment, size, bond length, and atom distribution) could be determined (see Table 3).
Table 3.
Microcrystalline structure parameters and degree of graphitization of the coal sample with particle sizes between 0.15 and 0.18 mm at different temperatures.
| Coal sample (℃) | d002 (10–1 nm) | Lc (10–1 nm) | La (10–1 nm) | P (%) |
|---|---|---|---|---|
| 0 | 3.5387 | 8.7686 | 9.6753 | 70.26 |
| 200 | 3.5934 | 12.2366 | 11.2979 | 61.45 |
| 400 | 3.5485 | 11.3625 | 13.7598 | 68.67 |
| 600 | 3.4980 | 6.9673 | 10.6618 | 76.81 |
| 800 | 3.6258 | 7.7958 | 18.9448 | 56.23 |
An increase in the heating temperature was accompanied by an increase in the diameter (La) of the aromatic layers. Under the same conditions, the average stacking thickness (Lc) first increased and then decreased; meanwhile, the graphitization degree first decreased, then increased, and finally decreased (Fig. 4b). Overall, a higher degree of graphitization led to the development of a higher number of aromatic microcrystalline structures.
Mineral components
As showed in Fig. 4a, the raw coal sample with 0.15–0.18 mm particle sizes included several mineral components (i.e., quartz, dolomite, kaolinite, calcite, and muscovite). After being heated to 200 °C, the sample contained quartz, kaolinite, calcite and dolomite; after being heated to 400 °C, the sample contained quartz, dolomite, kaolinite and calcite; after being heated to 600 °C, the sample contained quartz, calcite and dolomite; finally, after being heated to 800 °C, the sample contained almost exclusively quartz. These results showed that the variety of mineral components in the coal sample decreased as the heating temperature increased; additionally, quartz was observed under all the tested heating temperatures.
TPO experimental data
During the adiabatic TPO experiment, the critical temperature of coal samples with different particle sizes and the concentrations of O2, COn, and CnHm in relation to the reaction temperature during low-temperature oxidation were measured (see Table 4).
Table 4.
Data obtained from the TPO experiment.
| Parameter | Oven temperature (℃) | Coal temperature (℃) | O2 (%) | N2 (%) | CO (ppm) | CO2 (ppm) | CH4 (ppm) | C2H6 (ppm) | C2H4 (ppm) |
|---|---|---|---|---|---|---|---|---|---|
| 30 | 30.00 | 20.86 | 74 | 5.57 | 872 | 1633 | 5.661 | ||
| 40 | 40.00 | 20.51 | 77.39 | 3.391 | 1189 | 2019 | 131.4 | ||
| 50 | 50.00 | 20.25 | 74.97 | 4.997 | 1545 | 2115 | 163.4 | ||
| 60 | 60.00 | 20.14 | 73.45 | 16.17 | 2855 | 2290 | 138.9 | ||
| 70 | 70.00 | 19.76 | 72.56 | 38.96 | 3918 | 3038 | 141.8 | ||
| 80 | 80.00 | 19.19 | 74.56 | 83.62 | 4147 | 4512 | 162.6 | ||
| 90 | 90.00 | 18.58 | 75.24 | 176.9 | 4492 | 6376 | 175.2 | ||
| 100 | 100.00 | 17.65 | 76.08 | 377.3 | 5411 | 7436 | 185.9 | ||
| 110 | 110.00 | 16.7 | 77.25 | 682.8 | 6659 | 9144 | 200.4 | ||
| 120 | 120.00 | 16.05 | 78.19 | 1215 | 7034 | 10,890 | 210.1 | ||
| 130 | 130.00 | 15.82 | 80.64 | 1522 | 8880 | 12,710 | 215.6 | ||
| 140 | 140.26 | 16.6 | 83.27 | 2276 | 11,680 | 12,480 | 220.1 | ||
| 150 | 150.00 | 15.5 | 74.71 | 3421 | 13,672 | 13,280 | 215.8 | ||
| 160 | 160.00 | 12.89 | 82.94 | 4752 | 16,580 | 14,540 | 257.4 | ||
| 170 | 170.00 | 10.11 | 82.3 | 5013 | 19,180 | 17,450 | 259.4 | 56.19 |
The oxygen consumption rate, an index of coal oxidation, could be calculated based on oxygen concentration. The plot in Fig. 5a shows the relationship between the oxygen consumption rate and temperature: as temperature rose, the oxygen consumption rate of the coal sample increased continuously and exponentially. At low temperature, the interior of the coal body underwent a physicochemical adsorption reaction; as the reaction reached a balanced state and the temperature rose, the coal–oxygen chemical reaction became dominant, leading to the formation of numerous oxygen-consuming functional groups and continuously raising the oxygen consumption rate. Overall, a higher concentration of carbon corresponded to a higher graphitization degree and to a more stable molecular coal structure (lowering the chance of oxidation).
Figure 5.
Results from TPO experiments (a oxygen consumption and gas generation rates; b concentrations of oxygen and gases concentration).
As shown in Fig. 5a, the generation rates of CO and CO2 increased as the temperatures increased, while that of CH4 varied only slightly under the same conditions. Additionally, the concentrations of CO and CO2 increased slowly until the temperature reached 90 °C and then increased rapidly, indicating an acceleration of the oxidation reaction. Subsequently, after the temperature exceeded 130 °C, the concentrations of CO and CO2 increased sharply, indicating a further acceleration of the oxidation reaction.
As shown in Fig. 5b, the concentration of O2 tended to decrease as the temperature increased; meanwhile, the concentrations of CO, CO2, and CH4 increased, and that of C2H6 varied only slightly. Notably, C2H4 was not detected before the heating temperature reached 170 °C; this gas should have been released only once the heating temperature reached a certain threshold. These results indicate that a temperature rise may boost the low-temperature oxidation rate of coal and accelerate the release of gaseous products. Throughout the whole TPO experiment, no C2H2 was detected: the generation of C2H2 likely requires temperatures > 180 °C.
Functional groups analysis
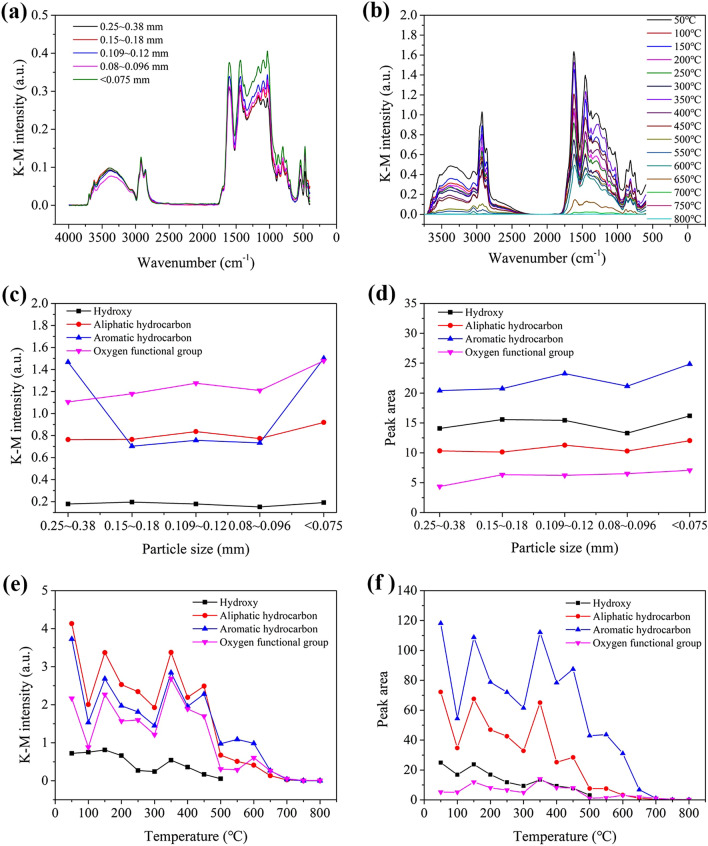
Table 5 lists the functional groups detected through the in situ infrared analysis of coal samples19. Figure 6a,b show the spectra of the samples with different particle sizes and of a sample heated to different temperatures, respectively. Moreover, Fig. 6c,d show the infrared spectral absorbance and the absorption peak areas, respectively, of samples with different particle sizes. Figure 6e,f show the absorbance and absorption peak areas of a sample heated to different temperatures.
Table 5.
Absorption peak characteristics of the coal samples.
| Spectral peak no. | Position of the spectral peak (cm−1) | Functional group | Assignment of the spectral peak |
|---|---|---|---|
| 1 | 3697–3625 | –OH | Free hydroxyl |
| 2 | 3624–3613 | –OH | Intra-molecular hydrogen bonds |
| 3 | 3500–3200 | –OH | Hydroxyl stretching vibrations of phenols, alcohols, carboxylic acids, peroxides, and water |
| 4 | 3085–3030 | –CH | Aromatics CH stretching vibration |
| 5 | 2975–2915 | –CH2, –CH3 | Benzene ring and aliphatic methyl, methylene antisymmetric stretching vibration |
| 6 | 2875–2858 | –CH2, –CH3 | Methyl symmetrical stretching vibration |
| 7 | 1625–1575 | C=C | Aromatic ring C=C stretching vibration |
| 8 | 1470–1430 | –CH2–CH3 | Methyl antisymmetric stretching vibration |
| 9 | 1379–1373 | –CH3 | Methylene shear vibration |
| 10 | 1350–1130 | C–O | Phenol, alcohol, ether, and ester oxygen bond |
| 11 | 1100–1000 | Si–O | Si–O ether bond |
| 12 | 900–700 | –CH | Outer bending vibration of various substituted |
| 13 | 540 | –S–S– | Characteristic peak of disulphide bond |
| 14 | 475 | –SH | SH absorption peak of organic sulphur |
Figure 6.
Results from FTIR experiments: (a the infrared spectra with different particle sizes; b the infrared spectra with heated samples; c,d the absorbance and peak areas of the functional groups with different particle sizes respectively; e,f the absorbance and peak areas of functional groups of heated samples respectively).
The coal samples with different particle sizes shared the same variety of functional groups; however, the concentrations of these functional groups were different and followed a certain trend (Fig. 6a).Wavenumbers of 3697–3625 cm−1, 3624–3613 cm−1, and 3500–3200 cm−1 corresponded to the OH (i.e., free hydroxide), –OH (i.e., intramolecular hydrogen bonds) and –OH (i.e., hydroxyl stretching vibrations of phenols, alcohols, carboxylic acids, peroxides, and water) functional groups, respectively. The coal sample with particle sizes of 0.15–0.18 mm showed the highest infrared absorption peak, followed by the samples with particle sizes of < 0.075 mm, 0.25–0.38 mm, 0.109–0.12 mm, and 0.08–0.096 mm. Wavenumbers of 3085–3030 cm−1 corresponded to the –CH (aromatics CH stretching vibration) functional group, while those of 2975–2915 cm−1 were associated with –CH2 and –CH3 groups (benzene ring and aliphatic methyl, methylene antisymmetric stretching vibration), and those of 2875–2858 cm−1 were associated with –CH2 and –CH3 groups(methyl symmetrical stretching vibration). Overall, the absorption peaks of methyl and methylene were stronger in the coal samples with particle sizes of < 0.075 mm or 0.109–0.12 mm, and were weaker in those with particle sizes of 0.08–0.096 mm. Wavenumbers of 1625–1575 cm−1 were associated with the functional group C=C (aromatic ring C=C stretching vibration). The highest absorption peaks were observed for the coal samples with particle sizes < 0.075 mm, while the lowest were observed for those with particle sizes of 0.25–0.38 mm. Wavenumbers of 1449–1439 cm−1 were associated with the functional group –CH2–CH3 (methyl antisymmetric stretching vibration), those of 1379–1373 cm−1 with –CH3 groups (methylene shear vibration), and those of 1350–1130 cm−1 with C–O groups (phenol, alcohol, ether, and ester oxygen bond). The concentrations of methyl and methylene generally increased with the particle size. The coal sample with particle sizes < 0.075 mm showed the highest methyl and methylene infrared absorption peaks, followed by the coal samples with particle sizes of 0.109–0.12 mm, 0.08–0.096 mm, 0.15–0.18 mm, and 0.25–0.38 mm. Wavenumbers of 900–700 cm−1 were associated with the functional group –CH (i.e., outer bending vibration of various substituted aromatic hydrocarbons). A decrease in the coal sample particle size resulted in an increasingly distinct infrared absorption spectrum and to increasingly stronger absorption peaks. Wavenumbers of 540 cm−1 and 475 cm−1 were associated with the functional groups –S–S– (i.e., with the characteristic peak of disulphide bond) and –SH (i.e., with the SH absorption peak of organic sulphur), respectively. A decline in particle size corresponded first to an increase, then to a decrease, and finally to another increase of the absorption peak intensity.
As shown in Fig. 6b, hydroxide radicals were present in the raw coal samples, as well as in those heated to temperatures of 50–500 °C. At temperatures of 500–800 °C, the absorption peak of the hydroxide radicals could be ignored, while those of the –OH functional groups, free hydroxyl groups, and intramolecular hydrogen bonds decreased with rising temperature. The absorption peaks corresponding to the hydroxyl stretching vibrations of phenols, alcohols, carboxylic acids, peroxides, and water decreased at temperatures from 50 to 100 °C, increased from 100 to 150 °C, decreased from 150 to 300 °C, increased from 300 to 350 °C, and finally decreased from 350 to 500 °C. The absorption peak corresponding to the aromatics CH stretching vibration decreased from 50 to 100 °C, increased from 100 to 150 °C, decreased from 150 to 300 °C, increased from 300 to 350 °C, decreased from 350 to 400 °C, increased from 400 to 450 °C, and finally decreased from 450 to 800 °C. The absorption peaks corresponding to the benzene ring and aliphatic methyl, methylene antisymmetric stretching vibration and methyl symmetrical stretching vibration of –CH2 and –CH3 (at 2920 cm−1 and 2850 cm−1, respectively) decreased from 50 to 100 °C, increased from 100 to 150 °C, decreased from 150 to 300 °C, increased from 300 to 350 °C, decreased from 350 to 400 °C, increased from 400 to 450 °C, and finally decreased from 450 to 550 °C. At temperatures of 550 to 800 °C, the functional group could be ignored; moreover, methyl and methylene facilitated the composite reaction of oxygen (a higher absorbance of these compounds enhanced the spontaneous combustion oxidation of coal). The aromatic ring C=C stretching vibration corresponded to 1604 cm−1, that of –CH2–CH3 (i.e., methyl antisymmetric stretching vibration) to 1449–1439 cm−1, that of –CH3 (i.e., methylene shear vibration) to 1379–1373 cm−1, that of C–O (i.e., phenol, alcohol, ether, and ester oxygen bond) to 1350–1130 cm−1, and those of Si–O, Si–O–Si, and Si–O–C (i.e., Si–O ether bond) to 1100–1000 cm−1. The intensities of their respective absorption peaks increased as followed: 50 °C > 350 °C > 150 °C > 450 °C > 400 °C > 200 °C > 250 °C > 100/300 °C > 500/550 °C > 600 °C > 650 °C. At temperatures of 650–800 °C, these functional groups could be ignored, and the peak corresponding to C=C was overlapped with those corresponding to the other functional groups: the intensity of the C=C spectral peak increased significantly. As the coal metamorphic grade (i.e., the temperature stability) increased, the intensity of the above spectral peaks gradually declined. The outer bending vibration of various substituted aromatic hydrocarbons corresponded to the interval 900–700 cm−1. The corresponding absorption peaks tended to decrease with rising temperature; in addition, this functional group could be ignored at temperatures between 700 and 800 °C.
As shown in Fig. 6c,d, the absorbance of the functional groups in the coal samples tended to increase with the particle size, while the concentration of aromatic hydrocarbons first decreased sharply and then increased. Moreover, the peak area of the functional groups increased with the particle size, and the maximum concentration of functional groups was found in the coal sample with particle sizes < 0.075 mm. The concentrations of hydroxide radicals and oxygen-containing functional groups increased with the decline in particle size, indicating that the presence of small particles enhanced the oxidation and spontaneous combustion of coal.
As shown in Fig. 6e,f, the absorbance and peak areas of the functional groups in the coal sample heated to different temperatures followed the same trend: they both decreased with rising temperature. Their concentrations followed this order: aromatic hydrocarbons > aliphatic hydrocarbons > hydroxide radicals > oxygen-containing functional groups. Hydroxide radicals and oxygen-containing functional groups are important indicators of coal spontaneous combustion. When the heating temperature was > 500 °C, the hydroxide radicals and the oxygen-containing functional groups participated in the oxidation reaction. Compared to that in the unheated coal samples, the reactivity of the functional groups in the heated coal samples was reduced, and these groups did not enhance the oxidation reaction.
TG analysis
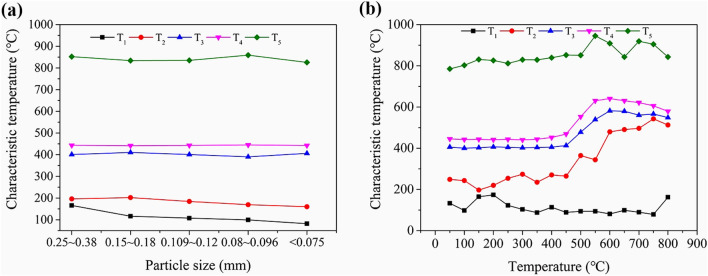
Based on the TG data, the characteristic temperatures (T1, T2, T3, T4, and T5) were determined. Figure 7a,b show the variation in these temperatures depending on the coal sample particle sizes and heating temperatures.
Figure 7.
Results from TG experiments (a the characteristic temperatures with different particle sizes; b the characteristic temperatures of heated samples).
As shown in Fig. 7a, a decrease in particle size did not translate into a significant variation of T3 or T4, while T1, T2, and T5 declined; the highest characteristic temperatures were observed for the samples with the largest particle sizes. T3 declined with the decrease in particle size: lower particle sizes corresponded to lower ignition temperatures (i.e., the coal sample was more likely to combust spontaneously). As shown in Fig. 7b, T1 fluctuated as the temperature increased, while T2, T3, T4, and T5 showed an overall increase; meanwhile, the coal content per unit mass decreased and the mineral content per unit mass increased, impeding the coal oxidation reaction.
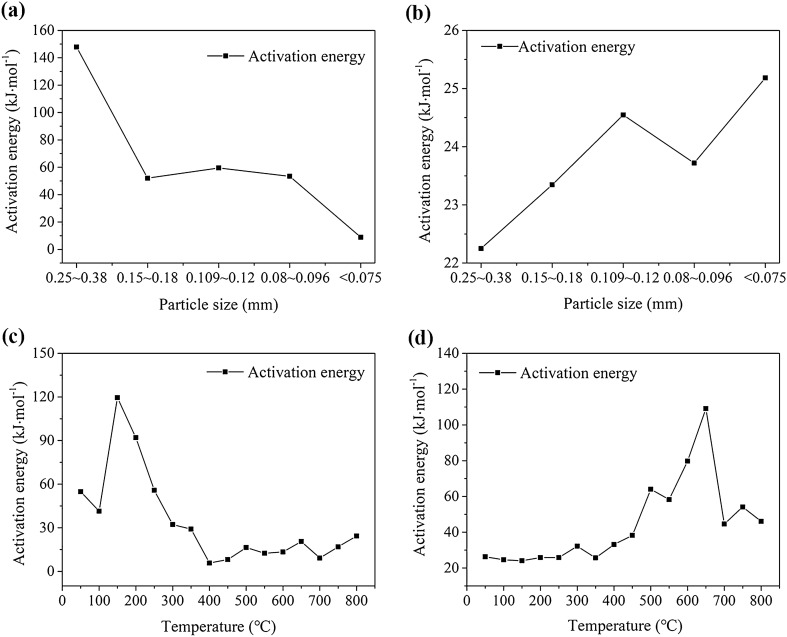
Based on the TG data, the activation energies for the stages of T1–T2 and T3–T5 were calculated using the Coats–Redfern integral method. Figure 8 shows their variation.
Figure 8.
Results from TG experiments (a,b the activation energy with different particle sizes in stages T1–T2 and T3–T5 respectively; c,d the activation energy of heated samples in stages T1–T2 and T3–T5 respectively).
As shown in Fig. 8a, the activation energies of the coal samples in the T1–T2 stage generally decreased with the particle size. The activation energies of the coal samples with different particle sizes varied in the following order: coal sample with particle sizes of 0.25–0.38 mm > coal sample with particle sizes of 0.109–0.12 mm > coal sample particle sizes of 0.08–0.096 mm > coal sample particle sizes of 0.15–0.18 mm > coal sample with particle sizes < 0.075 mm. The activation energies of the coal samples in stage T3–T5 increased with decreasing particle size (Fig. 8b). The activation energies of the coal samples with different particle sizes varied as follows: coal sample with particle sizes < 0.075 mm > coal sample with particle sizes of 0.109–0.12 mm > coal sample with particle sizes of 0.08–0.096 mm > coal sample with particle sizes of 0.15–0.18 mm > coal sample with particle sizes of 0.25–0.38 mm. These results suggest that both lower coal activation energy and higher infrared absorption peaks facilitated the coal–oxygen reaction of the samples.
The reaction activation energy (in stage T1–T2) of the coal sample heated to different temperatures first increased, then decreased, and finally increased (Fig. 8c,d): at the stage of low-temperature oxidation, the coal sample was more likely to combust spontaneously under rising temperature. The reaction activation energy in stage T3–T5 first increased and then decreased, but it showed a general increasing trend. Finally, at temperatures from 450 to 800 °C, the reaction activation energy increased. One of the primary reasons for this increase could be that after the coal sample was heated to a certain temperature, the carbon content decreased and the ash content increased moderately, reducing the overall reactivity of the coal sample.
Conclusions
Based on the above analysis of coal samples with different particle sizes and of a coal sample heated to different temperatures, the following conclusions were obtained:
The pores and roughness of coal samples increased with the heating temperature; meanwhile, the degree of graphitization decreased, then increased, and finally decreased again. Higher degrees of graphitization and the development of aromatic microcrystalline structures facilitated the spontaneous combustion of coal.
Under rising temperature, the oxygen consumption rate of coal samples being tested increased continuously and exponentially, while the low-temperature oxidation rate of the coal increased, and the release of gaseous products was accelerated. Based on the generating rates of different gases, it can be inferred that temperatures of 90 °C and 130 °C accelerated the oxidation reaction.
The amount of hydroxide radicals and oxygen-containing functional groups increased with decreasing particle size: smaller particle sizes likely facilitated the oxidation and the spontaneous combustion of coal. After the coal sample was heated to different temperatures, the absorbance and peak areas of the functional groups followed the same trend: they both decreased under rising temperature. Hydroxide radicals and oxygen-containing functional groups were important indicators of coal spontaneous combustion.
With decreasing particle size, the characteristic temperatureT4 varied slightly, while T1, T2, T3, and T5 all tended to decrease. In particular, T3 decreased with the particle size: the smaller the particle size, the lower was the ignition temperature of the coal sample. Additionally, with increasing temperature, the carbon content of coal samples decreased, and their mineral content increased, inhibiting the coal oxidation reaction. As the heating temperatures increased, the activation energies of the coal samples tended to increase at the stages of low-temperature oxidation and high-temperature combustion.
Acknowledgements
This work was supported by the International Cooperation Research Program of Xinjiang Provincial Department of Science and Technology (Grant no. 2018E01011); the Key Research & Development Program of Ministry of Science and Technology of China (Grant no. 2018YFC0807901-2); the National Natural Science Foundation of China (Grant no. 51974275) and the Natural Science Program of Xinjiang Provincial Department of Education (Grant no. XJEDU2018I007).
Author contributions
L.S. analysed the data of experiments and draft the manuscript. Q.Z. designed this study and revised the draft manuscript, including financial support for this research.
Competing interests
The authors declare no competing interests.
Footnotes
Publisher's note
Springer Nature remains neutral with regard to jurisdictional claims in published maps and institutional affiliations.
References
- 1.Zeng Q. Study on the thermal dynamic characteristics of combustion system for coal fires in Xinjiang region. China Univ. Min. Technol. 2012;20:20. [Google Scholar]
- 2.Kong B, Li ZH, Yang YL. A review on the mechanism, risk evaluation, and prevention of coal spontaneous combustion in China. Environ. Sci. Pollut. Res. Int. 2017;24:23453–23470. doi: 10.1007/s11356-017-0209-6. [DOI] [PubMed] [Google Scholar]
- 3.Pan RK, Li C, Yu MG. Evolution patterns of coal micro-structure in environments with different temperatures and oxygen conditions. Fuel. 2020;261:20. [Google Scholar]
- 4.Wang JR, Deng CB. The spontaneous combustion theory of coal microcosmic structure and component differences in quantity and quality. J. China Coal Soc. 2007;32:1291–1296. [Google Scholar]
- 5.Liang YT, Tian FCh, Lou HZh, Tang H. Characteristics of coal re-oxidation based on micro-structural and spectral observation. Int. J. Min. Sci. Technol. 2015;25:749–754. doi: 10.1016/j.ijmst.2015.07.008. [DOI] [Google Scholar]
- 6.Qu LN, Song DZh, Tan B. Research on the critical temperature and stage characteristics for the spontaneous combustion of different metamorphic grades of coal. Int. J. Coal Prep. Util. 2018;38:221–236. doi: 10.1080/19392699.2016.1226170. [DOI] [Google Scholar]
- 7.Xu Q, Yang ShQ, Cai JW, Zhou BZh, Xin YN. Risk forecasting for spontaneous combustion of coals at different ranks due to free radicals and functional groups reaction. Process Saf. Environ. Prot. 2018;118:195–202. doi: 10.1016/j.psep.2018.06.040. [DOI] [Google Scholar]
- 8.Nimaje DS, Tripathy DP. Characterization of some Indian coals to assess their liability to spontaneous combustion. Fuel. 2016;163:139–147. doi: 10.1016/j.fuel.2015.09.041. [DOI] [Google Scholar]
- 9.Avila C, Wu T, Lester E. Petrographic characterization of coals as a tool to detect spontaneous combustion potential. Fuel. 2014;125:173–182. doi: 10.1016/j.fuel.2014.01.042. [DOI] [Google Scholar]
- 10.Bhoi S, Banerjee T, Mohanty K. Molecular dynamic simulation of spontaneous combustion and pyrolysis of brown coal using ReaxFF. Fuel. 2014;136:326–333. doi: 10.1016/j.fuel.2014.07.058. [DOI] [Google Scholar]
- 11.Zhang YL, et al. Kinetic study on changes in methyl and methylene groups during low-temperature oxidation of coal via in-situ FTIR. Int. J. Coal Geol. 2016;154–155:155–164. doi: 10.1016/j.coal.2016.01.002. [DOI] [Google Scholar]
- 12.Zhang YN, et al. Analysis of kinetics of coal oxidation based on programmed temperature-rising experiment. Coal Mine Saf. 2018;49:31–3439. [Google Scholar]
- 13.Krzyztof C, Kisiela A, Moron W, Ferens W, Rybak W. Pyrolysis of solid fuels: Thermochemical behaviour, kinetics, and compensation effect. Fuel Process. Technol. 2016;142:42–53. doi: 10.1016/j.fuproc.2015.09.027. [DOI] [Google Scholar]
- 14.Qi XY, Li QZh, Zhang HJ, Xin HH. Thermodynamic characteristics of coal reaction under low oxygen concentration conditions. J. Energy Inst. 2017;90:544–555. doi: 10.1016/j.joei.2016.05.007. [DOI] [Google Scholar]
- 15.Bai ZJ, Wang CP, Deng J, Kang FR, Shu ChM. Experimental investigation on using ionic liquid to control spontaneous combustion of lignite. Process Saf. Environ. Protect. 2020;20:20. [Google Scholar]
- 16.Bai ZJ, Wang CP, Deng J, Kang FR, Shu ChM. Effects of ionic liquids on the chemical structure and exothermic properties of lignite. J. Mol. Liquids. 2020;20:20. [Google Scholar]
- 17.Dai GL. Research on microcrystalline structure change regularity in the coal low temperature oxidation process. J. China Coal Soc. 2011;36:322–325. [Google Scholar]
- 18.Liang DCh, et al. Microcrystalline structure and morphology of chars derived from medium-temperature pyrolysis of coals with different metamorphisms. J. China Univ. Min. Technol. 2016;45:799–806. [Google Scholar]
- 19.Deng J, Bai ZJ, Xiao Y, Shu CM, Laiwang B. Effects of imidazole ionic liquid on macroparameters and microstructure of bituminous coal during low-temperature oxidation. Fuel. 2019;246:160–168. doi: 10.1016/j.fuel.2019.02.066. [DOI] [Google Scholar]


