

Summary
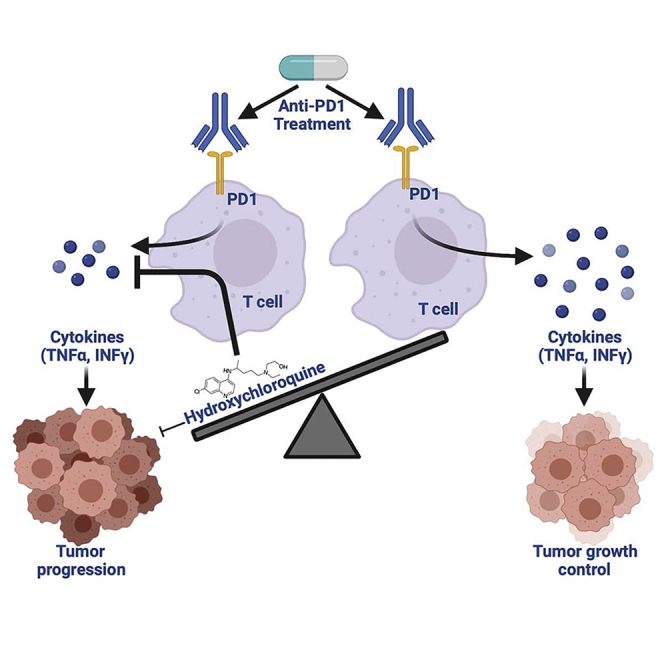
Hydroxychloroquine (HCQ) is a well-known anti-inflammatory drug but is also known as an anti-inflammatory drug. Here, we evaluate the influence of HCQ treatment on the effect of anti-PD1 tumor immunotherapy. Anti-PD1 therapy-sensitive tumor lines MC38, CT26, and RIL-175 were used to investigate the impact of HCQ on anti-PD1 therapy efficacy. In vitro assays demonstrated that HCQ directly inhibited tumor cell growth in all the tested tumor cell lines. HCQ treatment impaired both antigen-specific and nonspecific T-cell production of TNFα and IFNγ in vitro and in vivo. Importantly, in all the three tumor models, HCQ treatment significantly impaired the response to anti-PD1 treatment, accompanying diminished in vivo T-cell activation and reduced tumor-infiltrating, antigen-specific CD8+ T cells. This study shows that HCQ treatment can result in immunotherapy failure due to its immunosuppressive effects that offset both increased MHC-I expression by tumor cell and direct cytotoxicity.
Subject areas: Cancer, Immunology
Graphical abstract
Highlights
-
•
HCQ inhibits both antigen-specific and nonspecific CD4+ and CD8+ T function
-
•
HCQ inhibits tumor cell growth in vitro
-
•
HCQ impairs anti-PD1 therapy
Cancer; Immunology
Introduction
Hydroxychloroquine (HCQ) is an established anti-malarial medication and a pH-dependent autophagy inhibitor. Recently, its anti-tumor function has been described wherein HCQ treatment reversed immune evasion of pancreatic ductal adenocarcinoma by upregulating MHC-I surface expression on tumor cells and promoted tumor recognition by cytotoxic CD8+ T cells, resulting in responsiveness to anti-CTLA4 + anti-PD1 therapy (Yamamoto et al., 2020). Furthermore, IL-2 alone is an efficient immunotherapy in an advanced murine metastatic liver tumor model. IL-2 inhibits tumor growth by enhancing immune cell proliferation and infiltration in the liver and spleen; however, the anti-tumor effects of IL-2 immunotherapy significantly heighten when coupled with administration of autophagy inhibitor, chloroquine (CQ) (Liang et al., 2012). Similarly, in renal cell carcinoma, CQ is used to improve IL-2-mediated anti-tumor immunity by enhancing dendritic cell, T-cell, and natural killer cell function and limiting ATP production through inhibition of oxidative phosphorylation and promotion of apoptosis (Lotze et al., 2012). More importantly, an interaction between autophagy and immune checkpoints has been identified. In both in vitro melanoma and ovarian cancer models and using in vivo NSG (Non-obese diabetic scid gamma) mouse models, PD-L1 attenuated autophagy by blunting the ability of autophagy inhibitors to limit tumor proliferation (Clark et al., 2016). Furthermore, PD-L1 attenuation elevated mammalian target of rapamycin complex 1 (mTORC1) activity and enhanced the anti-proliferative effects of the mTORC1 inhibitor rapamycin, an autophagy inhibitor (Clark et al., 2016). These findings suggest that HCQ may enhance ICI therapy against cancer.
However, HCQ is known to cause immunosuppression (Hu et al., 2017). Indeed, it is widely used for treating autoimmune diseases such as systemic lupus erythematosus and rheumatoid arthritis. The mechanisms of HCQ-induced immunosuppression in these diseases are well known (Jeong and Jue, 1997; Mok, 2017; Weber and Levitz, 2000; Zhu et al., 1993). In the context of cancer, autophagy limits immune cell-mediated cytotoxicity (Rao et al., 2014), and the loss of autophagy genes promote tumor inflammation (Degenhardt et al., 2006; Guo et al., 2013). Most immune checkpoint inhibitors (ICIs) under investigation block one of three immune checkpoint molecules (PD-1, PD-L1, or CTLA4) on cancer or immune cells. This way, ICIs unleash the adaptive immune system and lead to an effective anti-tumor immune response (Wei et al., 2018). This mechanism may be impaired by the immunosuppressive actions of HCQ.
Of note, HCQ has gained a significant amount of interest during the coronavirus disease 2019 (COVID-19) health crisis (Gautret et al., 2020; Liu et al., 2020). Early studies during the pandemic suggested that HCQ can decrease viral fusion and release of viral RNA from the endosome, thus potentially lowering viral spread within the patient (Al-Bari, 2015; Liu et al., 2020). However, a recent randomized trial failed to show prophylactic effects in patients exposed to severe acute respiratory syndrome coronavirus-2. Nevertheless, it is still used to treat COVID-19, along with many immunologic and rheumatologic diseases (Guan et al., 2020; Zhou et al., 2020).
This study addresses the timely and clinically relevant question of whether HCQ treatment may affect anti-PD1 treatment efficacy. We show that HCQ treatment impairs tumor cell growth in vitro. In contrast, HCQ impaired the response of mouse tumor models to anti-PD1 treatment. These findings suggest that the immunosuppressive effects of HCQ counteract both the upregulated presentation of tumor antigens and its direct anti-tumor effects.
Results
HCQ treatment impairs T-cell function under tumor-free conditions
Anti-PD1 activates T-cell responses in patients with cancer, so we studied the effect of HCQ on T-cell function. Splenocytes from naive mice were stimulated with PMA (Phorbol myristate acetate)/ionomycin in the presence of HCQ for 4 hr to test the immediate effects of HCQ on T-cell function (Figures 1A–1D). IFNγ and TNFα production by T cells were measured by intracellular flow cytometry. HCQ caused a dose-dependent reduction of IFNγ and TNFα production in both CD4+ and CD8+ T cells (Figures 1A–1D, exemplary gating strategy shown in Figure S1A). At the 20μM concentration, we observed a strong inhibition of T-cell cytokine production. Next, we studied the effect of 2 hr (h) of HCQ pretreatment on T-cell stimulation (Figures 1E–1H). Again, HCQ pretreatment reduced TNFα production in CD4+ T cells (Figure 1F) and CD8+ T cells (Figure 1H) in a dose-dependent manner. The inhibition of IFNγ was present in CD4+ T cells but not in CD8+ T cells (Figures 1E and 1G). We repeated these experiments using murine peripheral blood mononuclear cells (PBMCs). Again, we observed a consistent inhibition of IFNγ and TNFα production by CD4+ and CD8+ T cells when PBMCs were stimulated and simultaneously treated with HCQ (Figures S1C–S1F). Pretreatment of PBMCs with HCQ led to a decrease of TNFα but not IFNγ production (Figures S1G–S1J).
Figure 1.

HCQ treatment impairs T-cell function
(A–D) Percentage of IFNγ+ (A) and TNFα+ (B) in CD4+ T cells and IFNγ+ (C) and TNFα+ (D) in CD8+ T cells (n = 7 per group). Splenocytes were stimulated with PMA and ionomycin (2μL/ml) and simultaneously treated with HCQ for 4h. Data represent mean ± SEM. ns = non-significant; ∗p < 0.05, ∗∗p < 0.01, ∗∗∗p < 0.001, ∗∗∗∗p < 0.0001; student's t-test.
(E–H) Percentage of IFNγ+ (E) and TNFα+ (F) in CD4+ T cells and IFNγ+ (G) and TNFα+ (H) in CD8+ T cells (n = 4–8 per group). Splenocytes were treated with HCQ for 2h, washed, and then stimulated with PMA and ionomycin (2μL/ml) for 4h. Data represent mean ± SEM. ns = non-significant; ∗p < 0.05, ∗∗p < 0.01, ∗∗∗p < 0.001, ∗∗∗∗p < 0.0001; student's t-test.
(I and J) IFNγ (J) and TNFα (K) concentration (pg/mL) in the supernatant of splenocytes treated with HCQ for 2h, washed and then stimulated with PMA and ionomycin (2μL/ml) for 4 h (pre-treatment) or stimulated with PMA and ionomycin (2μL/ml), and simultaneously treated with HCQ for 4 h (co-stimulation) (n = 3 per group). Data represent mean ± SEM. ns = non-significant; ∗p < 0.05, ∗∗∗p < 0.001, ∗∗∗∗p < 0.0001; student's t-test.
(K) Representative FLOW histogram of the effect of HCQ treatment on OT-1 proliferation (gating strategy: CD3+CD8+CFSE+) in the CFSE assay.
(L) Dilution of CFSE-labeled OT-1 and OT-2 splenic cells after HCQ treatment for 48 hr (OT-1, n = 5) and 72 hr (OT-2, n = 5). Cells were stimulated with OVA I or -II peptide. Data represent mean ± SEM.
(M) IFNγ concentration (pg/mL) in the supernatant of OT-1 and OT-2 splenic cells after HCQ treatment for 48 hr (OT-1) and 72 hr (OT-II). Cells were stimulated with OVA I or -II peptide (n = 3 per group). Data represent mean ± SEM; student's t-test.
(N) Experimental setup: Mouse model of healthy C57BL/6 mice treated with HCQ by daily gavage and received anti-PD-1 (200μg/mouse at indicated time points).
(O–R) Percentage of IFNγ+ (O) and TNFα+ (P) in CD8+ T cells and TNFα+ (Q) and IFNγ+ (R) in CD4+ T cells (n = 10 per group) after in vivo treatment of mice with HCQ. Splenocytes were stimulated ex vivo stimulation for 4 h. Two groups are shown: control treatment (control) vs HCQ treatment. Data represent mean ± SEM. ns = non-significant; ∗p < 0.05; student's t-test.
ELISA (Enzyme-linked immunosorbent assay) analysis of IFNγ and TNFα production by stimulated splenocytes treated with HCQ or pre-treated with HCQ confirmed the decrease in IFNγ and TNFα in both experimental settings (Figures 1I and 1J).
Next, we studied the effect of HCQ on antigen-specific T-cell responses. To test the MHC-I-restricted CD8+ T-cell response, we used OT-1 cells, whereas OT-2 cells were used to test MHC-II-restricted CD4+ T-cell response. CFSE (Carboxyflourescein succinimidyl ester)-labeled OT-1 or OT-2 cells were stimulated in vitro with their cognate peptide, and we measured cell proliferation. Consistently, HCQ reduced the proliferation of both OT-1 and OT-2 T cells, and the effect was more prominent in CD4+ OT-2 T cells (Figures 1K and 1L). Also, the concentration of IFNγ in the supernatant of the stimulated OT-1 and OT-2 splenocytes was lower upon HCQ treatment (Figure 1M).
To confirm HCQ-induced T-cell inhibition occurs in vivo, we treated naive C57BL/6 mice with HCQ at a dose suggested for treating patients with COVID-19 (Figure 1N). Splenocytes isolated from HCQ treated or control mice were stimulated with PMA/ionomycin followed by intracellular cytokine flow cytometry analysis. Similarly, the production of IFNγ and TNFα in CD8+ T cells and TNFα in CD4+ T cells (Figures 1O–1Q) were significantly reduced. IFNγ production by CD4+ T cells was not affected (Figure 1R). Our results demonstrate that HCQ effectively impaired T-cell function, which has a potential negative impact on anti-PD1 therapy.
HCQ treatment directly inhibits tumor cell growth
Next, we studied the effect of HCQ treatment on the in vitro cell growth of murine and human tumor cell lines. Using an MTT (3-(4,5-dimethylthiazol-2-yl)-5-(3-carboxymethoxyphenyl)-2-(4-sulfophenyl)-2H-tetrazolium) assay, we observed dose-dependent growth inhibition of murine colorectal carcinoma cell lines, CT26 and MC38, murine hepatocellular carcinoma cell line, RIL-175, murine cholangiocarcinoma cell line, SB1, as well as human cholangiocarcinoma cell lines, EGI-1 and TFK-1 (Figures 2A–2F). Consistent with this finding, Ki67 expression was impaired in these cell lines after HCQ treatment (Figures S2A–S2E). Next, we studied the effect of HCQ treatment on molecules associated with tumor immune evasion.
Figure 2.

The effects of HCQ treatment on tumor cells
(A–F) OD value of CT26 (A), MC38 (B), RIL-175 (C), SB1 (D), EGI-1 (E), and TFK-1 (F) after HCQ treatment for 72 hr (n = 5–6 per group). MTT assay was used to measure cell viability. Data represent mean ± SEM.
(G).Representative histograms plot of surface MHC-I expression on tumor cells (CT26, MC38, SB1, RIL-175) after 48 hr of 20μM HCQ and control measured by flow cytometry.
(H).Cell surface expression of MHC-I, PD-L1, and PD-L2 on tumor cells after 20μM HCQ treatment or control for 48 hr measured by flow cytometry (n = 3–5 per group). Data represent mean ± SEM; ns = non-significant; ∗p < 0.05; ∗∗p < 0.01, ∗∗∗p < 0.001, ∗∗∗∗p < 0.0001; student's t-test.
Different tumor cell lines were treated with HCQ for 48hr, and MHC-I, PD-L1, and PD-L2 were tested by flow cytometry. Interestingly, MHC-I was upregulated in CT26, SB1, and MC38 but not RIL-175 as measured by median fluorescence intensity (MFI) (Figures 2G and 2I). The MHC-I upregulation in HCQ-treated CT26, SB1, and MC38 was confirmed by immunofluorescence staining (Figures S2F–S2J). As expected, autophagy inhibition due to HCQ treatment was confirmed by increased LAMP-1 staining(Mauthe et al., 2018) (Figures S2F–S2J). Additionally, our results show that together with surface MHC-I upregulation, CT26 and SB1 cell lines have increased surface expression of PD-L1 and PD-L2 as measured by MFI (Figure 2I). Similar increases of surface MHC-I expression measured by MFI were observed in human cell lines, EGI-1 and TFK-1 (Figures S2K and S2L). The direct anti-tumor function of HCQ and the upregulation of surface MHC-I, PDL1, and PDL2 suggest the potential anti-tumor benefits of HCQ treatment when combined with anti-PD1 therapy.
HCQ treatment impairs anti-PD1 response in tumor-bearing mice
The counteracting effects of HCQ between tumor cells and T cells prompted us to investigate whether HCQ treatment impacts anti-PD1 efficacy in anti-PD1-sensitive tumors. Three tumor-bearing mouse models including MC38 and RIL-175 in C57BL/6 mice and CT26 in BALB/c mice were chosen based on previous publications and our results (Brown et al., 2018; Yu et al., 2019; Homet Moreno et al., 2016). Tumor cells were injected subcutaneously, and HCQ treatment was started when tumors were established (5 days). Mice received three doses of anti-PD1 (day 7, 10, and 15), and tumor growth was followed until day 19 (Figure 3A). Consistent with previous reports, anti-PD1 treatment effectively impaired tumor growth in all three subcutaneous tumor models (Figures 3B–3G). A single treatment of HCQ promoted tumor size growth of subcutaneous MC38 tumor but had no significant effect on subcutaneous CT-26 or RIL-175 tumor (Figures 3B–3D). The increased size of the MC38 tumor was confirmed by tumor weights at the endpoint (Figure 3G). Importantly, in all three models, HCQ and anti-PD1 combination treatment led to higher tumor weights compared to anti-PD1 single treatment (Figures 3E–3G). Using three tumor lines in two mouse strains, our results clearly demonstrate that HCQ treatment can impair the efficacy of anti-PD1 therapy.
Figure 3.

HCQ impairs anti-PD1 treatment response in mice in subcutaneous tumors
(A) Experimental setup: Mouse model of C57BL/6 (MC38 and RIL-175 tumor cells) and BALB/c (CT26 tumor cells) mice with subcutaneous injection of 106 tumor cells. HCQ and anti-PD1 treatment (aPD1, 200μg/mouse at indicated time points).
(B–D).Tumor growth of subcutaneous CT26 (B, n = 12), RIL-175 (C, n = 8), and MC38 (D, n = 12) tumors over time. Four groups are shown: control treatment (control) vs HCQ treatment (HCQ) vs anti-PD1 treatment (aPD1) vs combination (HCQ + aPD1). Tumor growth is shown as largest tumor diameter in mm. Data represent mean ± SEM; ns = non-significant; ∗p < 0.05; ∗∗p < 0.01, ∗∗∗p < 0.001, ∗∗∗∗p < 0.0001; student's t-test.
(E–G) Weight of CT26 (E, n = 12 per group), RIL-175 (F, n = 8), MC38 (G, n = 12) and subcutaneous tumors comparing control treatment (control) vs HCQ treatment (HCQ) vs anti-PD1 treatment (aPD1) vs combination (HCQ + aPD1). Representative pictures of subcutaneous CT26, RIL-175, and MC38 tumors. Data represent mean ± SEM; ns = non-significant; ∗p < 0.05; ∗∗p < 0.01, ∗∗∗p < 0.001, ∗∗∗∗p < 0.0001; student's t-test.
HCQ treatment impairs anti-PD1-enhanced anti-tumor immune responses
Since HCQ treatment has direct cell growth inhibitory function against MC38, CT26, and RIL-175 (Figures 2A–2C), the impaired anti-PD1 treatment efficacy in combination therapy is likely due to the T-cell function inhibition as suggested in Figure 1. To support this hypothesis, we isolated and analyzed splenocytes from MC38 tumor-bearing mice treated with anti-PD1 ± HCQ. The expression of activation marker CD69 on both CD4+ and CD8+ T cells was greatly increased in the anti-PD1 treatment group (Figures 4A and 4B, exemplary gating strategy is shown in Figure S1B). The addition of HCQ treatment completely blocked the CD69 increase when compared to combination treatment. T-cell function was further analyzed using intercellular cytokine flow cytometry analysis after ex vivo PMA/ionomycin stimulation. Upon anti-PD1 treatment, both CD4+ and CD8+ T cells produced significantly more IFNγ and TNFα (Figures 4C–4F). Anti-PD1 in combination with HCQ did not reduce IFNγ and TNFα production in CD8+ T cells (Figures 4C and 4D). In CD4+ T cells, the combination therapy decreased IFNγ but not TNFα production (Figures 4E and 4F).
Figure 4.

HCQ treatment impairs T-cell activation in tumor-bearing mice
(A and B) Percentage of splenic CD69+CD4+ (A) and CD8+ (B) T cells of MC38 tumor-bearing mice after HCQ and anti-PD1 treatment (n = 7–8 per group). Experimental setup is shown in Figure 3A and group setup as in Figure 3B. Data represent mean ± SEM; ns = non-significant; ∗p < 0.05; ∗∗p < 0.01; ∗∗∗p < 0.001; student's t-test.
(C–F) Percentage of splenic IFNγ + (C) and TNFα+ (D) and CD8+ IFNγ + (E) and TNFα+ (F) CD4+ T cells of MC38 tumor-bearing mice after HCQ and anti-PD1 treatment (n = 11–12 per group). Experimental setup is shown in Figure 3A and group setup as in Figure 3B. Data represent mean ± SEM; ns = non-significant; ∗p < 0.05; ∗∗p < 0.01; ∗∗∗p < 0.001; student's t-test.
Tumor-infiltrating lymphocytes (TILs) were analyzed in CT26 tumors, and anti-PD1 treatment caused a robust increase of CD4+ and CD8+ TILs (Figures 5A and 5B). Additionally, HCQ treatment greatly reduced the anti-PD1 treatment-dependent accumulation of CD4+ and CD8+ TILs. Furthermore, we used an AH-1 tetramer to quantify tumor antigen-specific CD8+ T cells in CT26 tumors34. Again, the absolute number of AH-1 tetramer+ CD8+ TIL cells was significantly higher with anti-PD1 alone treatment but dropped to baseline in the combination group (Figures 5C and 5D). Together, our results suggest that HCQ impairs the anti-PD1 treatment-induced anti-tumor T-cell response and subsequently leads to reduced anti-tumor effects.
Figure 5.

Effects of HCQ treatment on tumor-infiltrating lymphocytes
(A and B) Tumor-infiltrating CD4+ (A) and CD8+ (B) T cells per gram of CT26 tumor after HCQ and anti-PD1 treatment (n = 6–7 per group). Experimental setup is shown in Figure 3A and group setup as in Figure 3B. Data represent mean ± SEM; ns = non-significant; ∗p < 0.05; student's t-test.
(C) Tumor-infiltrating AH-1+CD8+ T cells per gram of CT26 tumor after HCQ and anti-PD1 treatment (n = 6–7 per group). Experimental setup is shown in Figure 3A and group setup as in Figure 3B. Data represent mean ± SEM; ns = non-significant; ∗p < 0.05; student's t-test.
(D) Representative contour plot and frequencies of tumor-infiltrating antigen-specific AH-1+CD8+ cells in CT26 tumors after HCQ and anti-PD1 treatment (gating strategy: CD3+CD8+AH1+). Experimental setup is shown in Figure 3A and group setup as in Figure 3B.
Discussion
HCQ is an immunosuppressive drug utilized in treating various autoimmune diseases, such as systemic lupus erythematosus and rheumatoid arthritis (Lee et al., 2011; Schrezenmeier and Dörner, 2020). In the context of autoimmune disease, HCQ inhibits immune function through many mechanisms such as alterations in autophagy and lysosomal pH (Hu et al., 2017). For example, autophagy and lysosomal function in dendritic cells is an important mechanism by which MHC-II antigens are processed and presented. The blockage of autophagy and rising lysosomal pH impairs MHC-II presentation and thus the function of CD4+ T cells (Schmidt et al., 2017). In the context of cancer, MHC-II antigen presentation and CD4+ T cells response are an important component of anti-tumor immunity, as well as response to ICIs. Furthermore, HCQ can inhibit the secretion of important cytokines such as IFNγ, TNFα, and IL-6 (Alspach et al., 2019). These studies suggest that the use of HCQ may inhibit anti-tumor response, especially when using ICIs.
Autophagy inhibition is being increasingly recognized as an important anti-tumor approach to improve traditional chemotherapy (Boone et al., 2015; Briceño et al., 2007). Two recent reports showed that CQ improves the efficacy of chemotherapy by inhibition of autophagy (Kinsey et al., 2019; Bryant et al., 2019). Both of these studies investigated the effects of CQ in KRAS-mutated pancreatic ductal adenocarcinoma and found that CQ had synergistic effects with KRAS pathway inhibitors. Other studies show that CQ and HCQ can be used to improve chemotherapy by inhibiting autophagy and raising lysosomal pH (Goldberg et al., 2012; Chen et al., 2018).
While there is compelling evidence to suggest that HCQ and CQ can improve the efficacy of chemotherapy, little is known about the immunosuppressive properties of HCQ and CQ in relation to immunotherapies such as ICIs. Studies in mice have shown that CQ and HCQ can induce a shift from immunosuppressive M2-tumor-associated macrophages (TAMs) to immune-promoting M1-TAMs, which may sensitize glioblastoma to anti-PD1 treatment (Hsu et al., 2020; Li et al., 2018). A recent report showed that inhibiting autophagy reversed the downregulation of MHC-I surface expression on pancreatic cancer cells. Moreover, CQ sensitized otherwise ICI therapy-insensitive pancreas cancer to dual treatment with anti-PD1 and anti-CTLA4 (Yamamoto et al., 2020), suggesting that CQ can potentially improve ICIs. However, the study did not test the direct effect of CQ on anti-tumor immunity and did not address its influence on ICI therapy-sensitive cancer. Of note, the study observed that CQ failed to boost anti-PD1 monotherapy against pancreatic cancer. Other reports using tumor models without downregulated MHC-I expression showed that genetic inhibition of autophagy or the use of HCQ had no improved function of T cells in tumor-bearing mice (Starobinets et al., 2016). Taken together, these studies paint an unclear picture of how the immunosuppressive drugs, HCQ and CQ, affect the adaptive immune response in the context of ICIs.
At a time when there is increasing interest in HCQ for the treatment of cancer, as well as COVID-19, this study addresses whether HCQ affects anti-PD1 therapy. Our results show that HCQ diminishes the anti-tumor effects of anti-PD1 in solid tumor mouse models. We demonstrate that HCQ impairs the production of proinflammatory cytokines in mice bearing various tumor types. We also show that HCQ reduces the number of macrophages and dendritic cells, which likely impairs a robust T-cell response. Finally, we found that MHC-I surface expression was only increased in a subset of tumor cell types, indicating significant heterogeneity within different tumor cell lines. Of note, HCQ-treated tumors showed accelerated MC38 tumor growth compared to control. Taken together, these results suggest that the immunosuppressive properties of HCQ outweigh its anti-tumor properties in tumor-bearing mice treated with anti-PD1.
These results suggest that HCQ should not be used as an autophagy inhibitor in combination with anti-PD1 in patients with cancer. Furthermore, patients with COVID-19 treated with ICIs should be excluded from the administration of HCQ.
Limitations of the study
Subcutaneous mouse models are useful in elucidating in vivo treatment effects, yet orthotopic models provide in-depth analysis regarding the organ-specific tumor microenvironment. Our study demonstrates that HCQ impairs anti-PD1 treatment through an associated decrease in tumor-infiltrating, antigen-specific lymphocytes. In vitro and in vivo models suggest that CD4+ and CD8+ T cells produce proinflammatory cytokines, yet we do not demonstrate definite molecular mechanisms describing the immune suppressive effects of HCQ. The in vivo data are consistent between three tumor cell lines and two mouse strains, yet the absence of human data limits the study's immediate translatability. Finally, HCQ is being explored as an adjuvant to several chemotherapy regimens. The anti-tumor effects of HCQ through autophagy inhibition are apparent, and future studies are needed to successfully utilize HCQ, while also mitigating its immune suppression functions.
Resource availability
Lead contact
Further requests should be directed to and will be fulfilled by the Lead Contact: Tim Greten (tim.greten@nih.gov).
Material availability
No new unique reagents were generated in this study.
Data and code availability
No unpublished custom code, software, algorithm, or data sets were used in this study.
Methods
All methods can be found in the accompanying Transparent methods supplemental file.
Acknowledgments
We would like to thank the NIH tetramer facility for providing 48146 H-2L(d)/AH1-tetramer and Dr. Jonathan Hernandez for providing EGI-1 and TFK-1 cell lines. The graphical abstract was created with BioRender.com. S.W. was supported by the Deutsche Forschungsgemeinschaft (WA-4610/1-1). T.F.G. is supported by the Intramural Research Program of the NIH, NCI (ZIA BC 011345, ZO1 BC010870).
Author contributions
S.W., C.M., J.D.M., and T.F.G. contributed in project design; S.W., B.R., O.K., and J.D.M. completed all experiments; S.W., J.C.M., C.M., B.R., L.D., B.H., and T.F.G. contributed in data analysis and interpretation; S.W., J.C.M., and T.F.G. wrote the original draft; and all authors contributed in reviewing and editing.
Declaration of interests
The authors declare no potential conflicts of interest.
Published: January 22, 2021
Footnotes
Supplemental information can be found online at https://doi.org/10.1016/j.isci.2020.101990.
Supplemental information
References
- Al-Bari M.A. Chloroquine analogues in drug discovery: new directions of uses, mechanisms of actions and toxic manifestations from malaria to multifarious diseases. J. Antimicrob. Chemother. 2015;70:1608–1621. doi: 10.1093/jac/dkv018. [DOI] [PMC free article] [PubMed] [Google Scholar]
- Alspach E., Lussier D.M., Miceli A.P., Kizhvatov I., Dupage M., Luoma A.M., Meng W., Lichti C.F., Esaulova E., Vomund A.N. MHC-II neoantigens shape tumour immunity and response to immunotherapy. Nature. 2019;574:696–701. doi: 10.1038/s41586-019-1671-8. [DOI] [PMC free article] [PubMed] [Google Scholar]
- Boone B.A., Bahary N., Zureikat A.H., Moser A.J., Normolle D.P., Wu W.C., Singhi A.D., Bao P., Bartlett D.L., Liotta L.A. Safety and biologic response of pre-operative autophagy inhibition in combination with gemcitabine in patients with pancreatic adenocarcinoma. Ann. Surg. Oncol. 2015;22:4402–4410. doi: 10.1245/s10434-015-4566-4. [DOI] [PMC free article] [PubMed] [Google Scholar]
- Briceño E., Calderon A., Sotelo J. Institutional experience with chloroquine as an adjuvant to the therapy for glioblastoma multiforme. Surg. Neurol. 2007;67:388–391. doi: 10.1016/j.surneu.2006.08.080. [DOI] [PubMed] [Google Scholar]
- Brown Z.J., Yu S.J., Heinrich B., Ma C., Fu Q., Sandhu M., Agdashian D., Zhang Q., Korangy F., Greten T.F. Indoleamine 2,3-dioxygenase provides adaptive resistance to immune checkpoint inhibitors in hepatocellular carcinoma. Cancer Immunol. Immunother. 2018;67:1305–1315. doi: 10.1007/s00262-018-2190-4. [DOI] [PMC free article] [PubMed] [Google Scholar]
- Bryant K.L., Stalnecker C.A., Zeitouni D., Klomp J.E., Peng S., Tikunov A.P., Gunda V., Pierobon M., Waters A.M., George S.D. Combination of ERK and autophagy inhibition as a treatment approach for pancreatic cancer. Nat. Med. 2019;25:628–640. doi: 10.1038/s41591-019-0368-8. [DOI] [PMC free article] [PubMed] [Google Scholar]
- Chen D., Xie J., Fiskesund R., Dong W., Liang X., Lv J., Jin X., Liu J., Mo S., Zhang T. Chloroquine modulates antitumor immune response by resetting tumor-associated macrophages toward M1 phenotype. Nat. Commun. 2018;9:873. doi: 10.1038/s41467-018-03225-9. [DOI] [PMC free article] [PubMed] [Google Scholar]
- Clark C.A., Gupta H.B., Sareddy G., Pandeswara S., Lao S., Yuan B., Drerup J.M., Padron A., Conejo-Garcia J., Murthy K. Tumor-intrinsic PD-L1 signals regulate cell growth, pathogenesis, and autophagy in ovarian cancer and melanoma. Cancer Res. 2016;76:6964–6974. doi: 10.1158/0008-5472.CAN-16-0258. [DOI] [PMC free article] [PubMed] [Google Scholar]
- Degenhardt K., Mathew R., Beaudoin B., Bray K., Anderson D., Chen G., Mukherjee C., Shi Y., Gelinas C., Fan Y. Autophagy promotes tumor cell survival and restricts necrosis, inflammation, and tumorigenesis. Cancer Cell. 2006;10:51–64. doi: 10.1016/j.ccr.2006.06.001. [DOI] [PMC free article] [PubMed] [Google Scholar]
- Gautret P., Lagier J.C., Parola P., Hoang V.T., Meddeb L., Mailhe M., Doudier B., Courjon J., Giordanengo V., Vieira V.E. Hydroxychloroquine and azithromycin as a treatment of COVID-19: results of an open-label non-randomized clinical trial. Int. J. Antimicrob. Agents. 2020:105949. doi: 10.1016/j.ijantimicag.2020.105949. [DOI] [PMC free article] [PubMed] [Google Scholar] [Retracted]
- Goldberg S.B., Supko J.G., Neal J.W., Muzikansky A., Digumarthy S., Fidias P., Temel J.S., Heist R.S., Shaw A.T., Mccarthy P.O. A phase I study of erlotinib and hydroxychloroquine in advanced non-small-cell lung cancer. J. Thorac. Oncol. 2012;7:1602–1608. doi: 10.1097/JTO.0b013e318262de4a. [DOI] [PMC free article] [PubMed] [Google Scholar]
- Guan W.J., Liang W.H., Zhao Y., Liang H.R., Chen Z.S., Li Y.M., Liu X.Q., Chen R.C., Tang C.L., Wang T. Comorbidity and its impact on 1590 patients with Covid-19 in China: a nationwide analysis. Eur. Respir. J. 2020;55:2000547. doi: 10.1183/13993003.00547-2020. [DOI] [PMC free article] [PubMed] [Google Scholar]
- Guo J.Y., Karsli-Uzunbas G., Mathew R., Aisner S.C., Kamphorst J.J., Strohecker A.M., Chen G., Price S., Lu W., Teng X. Autophagy suppresses progression of K-ras-induced lung tumors to oncocytomas and maintains lipid homeostasis. Genes Dev. 2013;27:1447–1461. doi: 10.1101/gad.219642.113. [DOI] [PMC free article] [PubMed] [Google Scholar]
- Homet Moreno B., Zaretsky J.M., Garcia-Diaz A., Tsoi J., Parisi G., Robert L., Meeth K., Ndoye A., Bosenberg M., Weeraratna A.T. Response to programmed cell death-1 blockade in a murine melanoma syngeneic model requires costimulation, CD4, and CD8 T cells. Cancer Immunol. Res. 2016;4:845–857. doi: 10.1158/2326-6066.CIR-16-0060. [DOI] [PMC free article] [PubMed] [Google Scholar]
- Hsu S.P.C., Chen Y.C., Chiang H.C., Huang Y.C., Huang C.C., Wang H.E., Wang Y.S., Chi K.H. Rapamycin and hydroxychloroquine combination alters macrophage polarization and sensitizes glioblastoma to immune checkpoint inhibitors. J. Neurooncol. 2020;146:417–426. doi: 10.1007/s11060-019-03360-3. [DOI] [PMC free article] [PubMed] [Google Scholar]
- Hu C., Lu L., Wan J.P., Wen C. The pharmacological mechanisms and therapeutic activities of hydroxychloroquine in rheumatic and related diseases. Curr. Med. Chem. 2017;24:2241–2249. doi: 10.2174/0929867324666170316115938. [DOI] [PubMed] [Google Scholar]
- Jeong J.Y., Jue D.M. Chloroquine inhibits processing of tumor necrosis factor in lipopolysaccharide-stimulated RAW 264.7 macrophages. J. Immunol. 1997;158:4901–4907. [PubMed] [Google Scholar]
- Kinsey C.G., Camolotto S.A., Boespflug A.M., Guillen K.P., Foth M., Truong A., Schuman S.S., Shea J.E., Seipp M.T., Yap J.T. Publisher Correction: protective autophagy elicited by RAF→MEK→ERK inhibition suggests a treatment strategy for RAS-driven cancers. Nat. Med. 2019;25:861. doi: 10.1038/s41591-019-0433-3. [DOI] [PubMed] [Google Scholar]
- Lee S.J., Silverman E., Bargman J.M. The role of antimalarial agents in the treatment of SLE and lupus nephritis. Nat. Rev. Nephrol. 2011;7:718–729. doi: 10.1038/nrneph.2011.150. [DOI] [PubMed] [Google Scholar]
- Li Y., Cao F., Li M., Li P., Yu Y., Xiang L., Xu T., Lei J., Tai Y.Y., Zhu J. Hydroxychloroquine induced lung cancer suppression by enhancing chemo-sensitization and promoting the transition of M2-TAMs to M1-like macrophages. J. Exp. Clin. Cancer Res. 2018;37:259. doi: 10.1186/s13046-018-0938-5. [DOI] [PMC free article] [PubMed] [Google Scholar]
- Liang X., De Vera M.E., Buchser W.J., Romo De Vivar Chavez A., Loughran P., Beer Stolz D., Basse P., Wang T., Van Houten B., Zeh H.J., 3rd, Lotze M.T. Inhibiting systemic autophagy during interleukin 2 immunotherapy promotes long-term tumor regression. Cancer Res. 2012;72:2791–2801. doi: 10.1158/0008-5472.CAN-12-0320. [DOI] [PMC free article] [PubMed] [Google Scholar]
- Liu J., Cao R., Xu M., Wang X., Zhang H., Hu H., Li Y., Hu Z., Zhong W., Wang M. Hydroxychloroquine, a less toxic derivative of chloroquine, is effective in inhibiting SARS-CoV-2 infection in vitro. Cell Discov. 2020;6:16. doi: 10.1038/s41421-020-0156-0. [DOI] [PMC free article] [PubMed] [Google Scholar]
- Lotze M.T., Buchser W.J., Liang X. Blocking the interleukin 2 (IL2)-induced systemic autophagic syndrome promotes profound antitumor effects and limits toxicity. Autophagy. 2012;8:1264–1266. doi: 10.4161/auto.20752. [DOI] [PubMed] [Google Scholar]
- Mauthe M., Orhon I., Rocchi C., Zhou X., Luhr M., Hijlkema K.J., Coppes R.P., Engedal N., Mari M., Reggiori F. Chloroquine inhibits autophagic flux by decreasing autophagosome-lysosome fusion. Autophagy. 2018;14:1435–1455. doi: 10.1080/15548627.2018.1474314. [DOI] [PMC free article] [PubMed] [Google Scholar]
- Mok C.C. Therapeutic monitoring of the immuno-modulating drugs in systemic lupus erythematosus. Expert Rev. Clin. Immunol. 2017;13:35–41. doi: 10.1080/1744666X.2016.1212659. [DOI] [PubMed] [Google Scholar]
- Rao S., Yang H., Penninger J.M., Kroemer G. Autophagy in non-small cell lung carcinogenesis: a positive regulator of antitumor immunosurveillance. Autophagy. 2014;10:529–531. doi: 10.4161/auto.27643. [DOI] [PMC free article] [PubMed] [Google Scholar]
- Schmidt R.L., Jutz S., Goldhahn K., Witzeneder N., Gerner M.C., Trapin D., Greiner G., Hoermann G., Steiner G., Pickl W.F. Chloroquine inhibits human CD4(+) T-cell activation by AP-1 signaling modulation. Sci. Rep. 2017;7:42191. doi: 10.1038/srep42191. [DOI] [PMC free article] [PubMed] [Google Scholar]
- Schrezenmeier E., Dörner T. Mechanisms of action of hydroxychloroquine and chloroquine: implications for rheumatology. Nat. Rev. Rheumatol. 2020;16:155–166. doi: 10.1038/s41584-020-0372-x. [DOI] [PubMed] [Google Scholar]
- Starobinets H., Ye J., Broz M., Barry K., Goldsmith J., Marsh T., Rostker F., Krummel M., Debnath J. Antitumor adaptive immunity remains intact following inhibition of autophagy and antimalarial treatment. J. Clin. Invest. 2016;126:4417–4429. doi: 10.1172/JCI85705. [DOI] [PMC free article] [PubMed] [Google Scholar]
- Weber S.M., Levitz S.M. Chloroquine interferes with lipopolysaccharide-induced TNF-alpha gene expression by a nonlysosomotropic mechanism. J. Immunol. 2000;165:1534–1540. doi: 10.4049/jimmunol.165.3.1534. [DOI] [PubMed] [Google Scholar]
- Wei S.C., Duffy C.R., Allison J.P. Fundamental mechanisms of immune checkpoint blockade therapy. Cancer Discov. 2018;8:1069–1086. doi: 10.1158/2159-8290.CD-18-0367. [DOI] [PubMed] [Google Scholar]
- Yamamoto K., Venida A., Yano J., Biancur D.E., Kakiuchi M., Gupta S., Sohn A.S.W., Mukhopadhyay S., Lin E.Y., Parker S.J. Autophagy promotes immune evasion of pancreatic cancer by degrading MHC-I. Nature. 2020;581:100–105. doi: 10.1038/s41586-020-2229-5. [DOI] [PMC free article] [PubMed] [Google Scholar]
- Yu G., Wu Y., Wang W., Xu J., Lv X., Cao X., Wan T. Low-dose decitabine enhances the effect of PD-1 blockade in colorectal cancer with microsatellite stability by re-modulating the tumor microenvironment. Cell Mol. Immunol. 2019;16:401–409. doi: 10.1038/s41423-018-0026-y. [DOI] [PMC free article] [PubMed] [Google Scholar]
- Zhou F., Yu T., Du R., Fan G., Liu Y., Liu Z., Xiang J., Wang Y., Song B., Gu X. Clinical course and risk factors for mortality of adult inpatients with COVID-19 in Wuhan, China: a retrospective cohort study. Lancet. 2020;395:1054–1062. doi: 10.1016/S0140-6736(20)30566-3. [DOI] [PMC free article] [PubMed] [Google Scholar]
- Zhu X., Ertel W., Ayala A., Morrison M.H., Perrin M.M., Chaudry I.H. Chloroquine inhibits macrophage tumour necrosis factor-alpha mRNA transcription. Immunology. 1993;80:122–126. [PMC free article] [PubMed] [Google Scholar]
Associated Data
This section collects any data citations, data availability statements, or supplementary materials included in this article.
Supplementary Materials
Data Availability Statement
No unpublished custom code, software, algorithm, or data sets were used in this study.