Abstract
Background
The innovation of immune checkpoint blockade (ICB) represents a promising shift in the treatment of advanced hepatocellular carcinoma (HCC). However, response to ICB has varied largely due to the high tumor heterogeneity and complex tumor microenvironment (TME). The competitive endogenous RNA (ceRNA) network also plays an important role in tumor occurrence and progression, but its relation with tumor-infiltrating immune cells (TICs) remains largely unexplored in HCC. The overriding objective of our study was thus to construct a prognosis-related risk model and to further evaluate the relationship between ceRNA networks and TICs.
Methods
Differentially expressed gene (DEG) analysis was performed to identify the differentially expressed RNAs. Lasso and multivariable Cox regression analyses were used to construct risk models, which were assessed by the area under the receiver operating characteristic curve (AUC of ROC) and Kaplan-Meier (K-M) curves. Then, a single-sample gene set enrichment analysis (ssGSEA) algorithm was adopted to dissect the TICs in HCC samples. Nomograms were constructed and calibration curves were used to verify the discrimination and accuracy of the nomograms. Finally, integration analysis was performed to validate the correlation of ceRNA and TICs.
Results
In the study, 7 differentially expressed RNAs [5 messenger RNA s (mRNAs) and 2 micro RNAs (miRNAs)] were incorporated to construct a ceRNA risk model. The AUC of the 1-, 3-, and 5-year overall survival (OS) were 0.784, 0.685, and 0.691 respectively. Likewise, 7 types TICs were in the TICs signature model and the AUC of the 1-, 3-, and 5-year OS were 0.706, 0.731, and 0.721 respectively. The integration analysis showed that 7 pairs of mRNA-TICs and 1 pair of miRNA-TICs had a close relation (all correlation coefficients >0.2, P<0.001).
Conclusions
Through constructing two risk models based on ceRNA network and TICs, we identified the hub RNAs and key TICs in the progression and prognosis of HCC, and further explored the relationship between ceRNA and TME. Importantly, targeting these hub RNAs may facilitate the remodeling of the TME and be a potential therapeutic alternative to enhancing the response to ICB, thus improving the prognosis of HCC patients.
Keywords: Tumor-infiltrating immune cells, ceRNA network, risk model, nomogram, immune checkpoint blockade (ICB)
Introduction
Mainly due to its high heterogeneity and rapid progression, hepatocellular carcinoma (HCC) is one of the most common malignant tumors and the fourth leading cause of human cancer (1). Although various developments in therapeutic strategies and early detection methods have yielded modest success, the prognosis of patients has not dramatically improved. To prolong the survival and improve the quality of life of patients with HCC, it is essential to identify an ideal prognostic biomarker and explore the underlying mechanism of HCC.
Recently, the advent of immune checkpoint blockade (ICB) in cancer therapy has given new hope to advanced cancer patients. However, a satisfactory response to ICB and significant improvement to overall survival (OS) have not yet been definitely achieved (2) due to the intricate tumor microenvironment (TME) and tumor heterogeneity of certain cancers. Long noncoding RNAs (lncRNAs) are well-studied non-protein-coding RNAs with over 200 nucleotides which play an important role in development and progression of various cancers (3-6). To the best of our knowledge, lncRNAs can act as microRNA (miRNA) sponges to regulate the transcriptional expression of mRNA. Therefore, lncRNAs are considered a major component of the competitive endogenous RNA (ceRNA) network (7) and have received increased attention. The relationship between ceRNA network and immunotherapy has been reported in many researched and more attention were paid to hub RNA (miRNA, LncRNA and mRNA) of ceRNA networks. For example, ceRNA networks may identify candidate therapeutic targets and potential prognostic biomarkers in breast cancer and lncRNA OSTN-AS1 serves as a novel immune-related molecule and could be involved in immunotherapy efforts in the future (8). Likewise, in a research of lung cancer, the interaction between these RNAs of ceRNA network may have an important regulatory role in the immune infiltration, thereby affecting the patient’s prognosis and immunotherapy efficacy (8). Therefore, it is important to make a progress in researching ceRNA and immunotherapy in hepatocellular carcinoma. There were some similar researches in ceRNA network and tumor-infiltrating cells (TICs). The researchers focused on bone metastatic researches of Mesothelioma (9,10) and on recurrent soft tissue sarcoma (11). However, there are rare researches that ceRNA network is strongly associated with TICs in HCC. Thus, there is an urgent need to further elucidate this potential relationship and the mechanism which underlies it.
In this study, we conducted a comprehensive analysis to construct two novel and robust models based on ceRNA networks and TICs for HCC survival. First, a ceRNA network was established based on the gene expression profiling of The Cancer Genome Atlas (TCGA) database to explore the potential role of ceRNA network in the occurrence and progression of HCC. In addition, we performed single-sample gene set enrichment analysis (ssGSEA) analysis to determine the profiles of TICs in adjacent and tumorous tissues of HCC. Subsequently, using hub RNAs and key TICs, we constructed two nomograms to aid in predicting the OS of HCC patients. The relationship between the ceRNA network and TICs was further evaluated to identify the potential mechanism of signal pathway in the prognosis and progression of HCC. Clinically, these hub RNAs might be useful biomarkers for predicting outcomes and may further act as therapeutic targets for regulating the tumor immunity landscape and thus improving the unsatisfactory prognosis of HCC patients.
We present the following article in accordance with the MDAR checklist (available at http://dx.doi.org/10.21037/jgo-20-555).
Methods
Data source and differential analysis
Transcriptome profiling (miRNA expression) and RNA sequencing (RNA-seq) [fragments per kilobase of exon per million reads (FPKM)] were performed to map the profiles of 424 samples, which included 50 normal adjacent tissues and 374 cancerous tissues downloaded from TCGA database (https://portal.gdc.cancer.gov/). Meanwhile, corresponding clinical traits and survival information were collected. There are 366 HCC patients with complete follow-up information who were enrolled for survival analysis. Data for a validation cohort consisting of HCC patients from Japan were downloaded from the International Cancer Genome Consortium (ICGC) database (https://icgc.org/). “EdgeR” from R package was used to find the differentially expressed mRNAs, miRNAs, and lncRNAs by comparing normal and tumor samples. The differentially expressed genes (DEGs) (including mRNAs, miRNAs, and lncRNAs) were defined when the adjusted P value <0.05 and |log10(fold change) | >1.
Construction of the ceRNA network
The miRNA-lncRNA and miRNA-mRNA interaction data sets were both derived from the starBase website (http://starbase.sysu.edu.cn/). Then, the interactions of miRNAs with more than two nodes (mRNA or lncRNA) were included while those of miRNAs with only unilateral regulation were excluded. Then, the ceRNA network was constructed and visualized by Cytoscape (version 3.61).
Survival analysis and Cox regression analysis
To validate the relationship of hub genes of the ceRNA network with the OS of HCC patients, survival analysis was performed using Kaplan-Meier (K-M) survival curves. Survival time was considered as the primary endpoint. For every hub gene, HCC patients were divided into low-and high-expression groups based on the median value of gene expression. A log-rank test was used as the statistical method for the K-M curves. Afterwards, the potential prognosis-related biomarkers were further validated by univariable Cox regression analysis, and lasso regression analysis was further adopted to confirm the fitness of the established hub genes. Next, multivariable Cox regression analysis was used to determine the coefficients of every dependent gene and the risk model based on the ceRNA network. Univariate and multivariate Cox regression analyses were conducted by “survival” in R package, and the lasso regression results were analyzed with the “glmnet” package to obtain the most important predictive genes.
Establishment of the model and nomogram
The ceRNA risk score model was established based on the corresponding coefficients, while the risk score of each patient was calculated by multiplying the gene expression and coefficients. Eventually, a nomogram based on the ceRNA risk model was developed to predict the outcome of patients with HCC, and a calibration curve was plotted and concordance was calculated to assess the discrimination and accuracy of the nomogram. Resolution of the nomogram and the 3-year predicted calibration curves were achieved through “rms” package. The TIC model was also constructed using the procedure above. These two independent risk models were assessed by receiver operating characteristic (ROC) curve analysis with “timeROC” package and K-M curves to evaluate the predictive capability.
Profiling of TICs
The TICs abundance profile of 374 HCC patients from TCGA database was estimated by a ssGSEA algorithm (12) and 24 tumor-infiltrating immune cells were evaluated based on TCGA RNA-seq data. These 24 immune cells comprised 18 T-cell subtypes and 6 other immune cell types: B cells, natural killer T (NKT) cells, monocyte cells, macrophage cells, neutrophil cells, and dendritic cells (DCs). Survival analysis was performed to confirm the relationship between the fraction of each TIC and the OS of HCC patients. Univariate and lasso regression analysis was adopted to screen the most influential immune cells, and multivariate COX regression analysis was conducted to construct the TIC-related risk model. Ultimately, the relevance of immune cells and hub genes of the ceRNA network was evaluated by correlation analysis, and the results were visualized by scatter plot.
Statistical analysis
A two-sided P value less than 0.05 was statistically significant. All statistical analyses were conducted in R (version 3.63) and RStudio (version1.2.5). Wilcoxon rank-sum test was used to validate the DEGs between adjacent and tumor tissues of HCC patients, while Kruskal-Wallis test was used to analyze the different fragments of TICs in various HCC grades. Log-rank test was performed to test the OS between two groups, and was visualized by K-M curves. Related R packages including “GDCRNAtools”, “ggplot2”, “edgeR”, “rms”, “glmnet”, “survival”, “survminer”, and “timeROC” were downloaded from the Lanzhou University Open-Source Society.
Results
Flow chart of the study
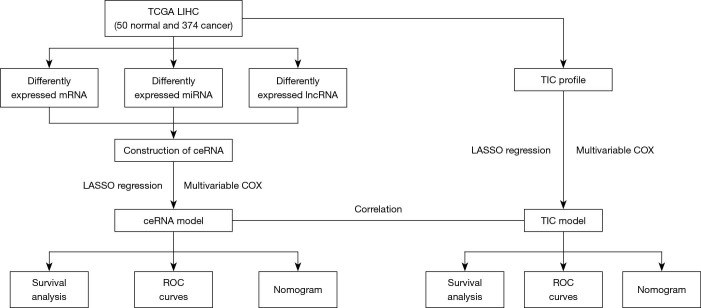
The cohort flow chart for this study is illustrated in the Figure 1. A cohort composed of 374 hepatocellular cancer tissues and 50 normal samples from TCGA database were enrolled. The basic clinical characteristic of the IGCG and TCGA cohorts are summarized in Table 1. The CeRNA network and TICs were analyzed and used to construct a prognostic risk model. Ultimately, the correlation of ceRNA and tumor infiltrating cells was established, and the hub genes of ceRNA were validated in the IGCG-HCC database.
Figure 1.
The main flow chart of the study. TCGA, The Cancer Genome Atlas; LIHC, liver hepatocellular carcinoma; mRNA, messenger RNA; miRNA, micro RNA; LncRNA, long noncoding RNA; TIC, tumor-infiltrating cells; ceRNA, competing endogenous RNA network; Lasso, least absolute shrinkage and selection operator; ROC, receiver operating characteristic.
Table 1. Clinical traits of HCC patients in TCGA and ICGC database.
| Characteristics | TCGA-LIHC | LIRI-JP |
|---|---|---|
| Survival status | ||
| Alive | 248 (66.0%) | 269 (68.3%) |
| Dead | 128 (34.0%) | 79 (20.1%) |
| Age (mean, SD) | 59.5 (13.5) | 64.7 (11.1) |
| Gender | ||
| Female | 122 (32.4%) | 95 (24.1%) |
| Male | 254 (67.6%) | 299 (75.9%) |
| Grade | ||
| G1 | 55 (14.6%) | 59 (15.0%) |
| G2 | 180 (47.9%) | 162 (41.1%) |
| G3 | 123 (32.7%) | 77 (19.5%) |
| G4 | 13 (3.5%) | 43 (10.9%) |
| Unknown | 5 (1.3%) | 53 (13.5%) |
| T stage | ||
| T1 | 185 (49.2%) | NA |
| T2 | 94 (25.0%) | NA |
| T3 | 81 (21.5%) | NA |
| T4 | 13 (3.5%) | NA |
| Unknown | 3 (0.8%) | NA |
| M stage | ||
| M0 | 272 (72.3%) | NA |
| M1 | 4 (1.1%) | NA |
| MX | 100 (26.6%) | NA |
| N stage | ||
| N0 | 257 (68.4%) | NA |
| N1 | 4 (1.1%) | NA |
| NX | 114 (30.3%) | NA |
| Unknown | 1 (0.3%) | NA |
HCC, hepatocellular carcinoma; TCGA, The Cancer Genome Atlas; ICGC, international cancer genome consortium. LIHC, liver hepatocellular carcinoma; LIRI-JP, liver cancer RIKEN Japan.
Identification of differentially expressed mRNA, miRNA, and LncRNA
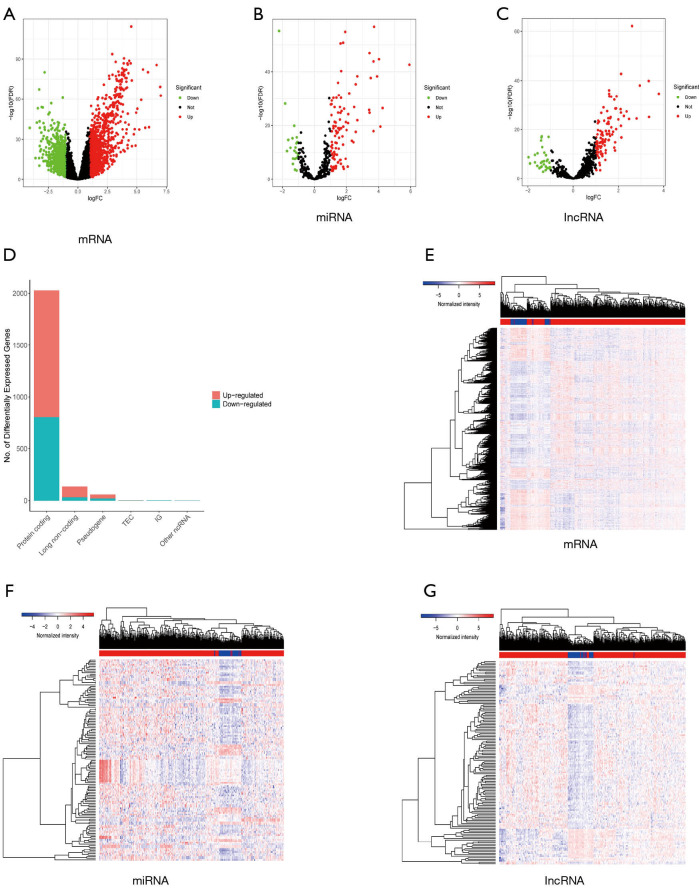
By comparing RNA-seq and miRNA profiling of 50 normal and 374 cancerous tissues, 2,028 mRNAs, 136 lncRNAs, and 128 miRNAs were deemed to be differentially expressed (Figure 2A,B,C). The proportion of differentially expressed mRNAs, miRNAs, and lncRNAs can be seen in Figure 1D, which shows that the protein-coding gene (mRNA) accounts for a larger proportion than the others. From TCGA database, we found that 1222 mRNAs, 107 miRNAs, and 104 lncRNAs were upregulated while 806 mRNAs, 21 miRNAs, and 32 lncRNAs were downregulated (Figure 2D,E,F,G). These DEGs were furthered used to construct a differentially expressed ceRNA network and a prognosis-related risk model.
Figure 2.
Identification of differentially expressed RNAs. (A,B,C) The volcano plots of differentially expressed mRNAs (A), miRNAs (B), and lncRNAs between normal and tumor samples. (A,B,C) We defined the absolute value of logFC >1 and the FDR value <0.05 as the cutoff value. Red points represent upregulated RNAs, green dots represent downregulated RNAs, and black points represent the unchanged RNAs which did not meet the criteria. (D) The bar plot illustrates the differentially expressed RNAs among which 222 mRNAs, 107 miRNAs, and 104 lncRNAs were upregulated (red bar), while 806 mRNAs, 21 miRNAs, and 32 lncRNAs were downregulated (blue bar). (E,F,G) The heatmap also shows the differentially expressed RNAs between adjacent and tumorous tissues. mRNA, messenger RNA; miRNA, microRNA; lncRNA, long noncoding RNA; FDR, false discovery rate.
Establishment of the ceRNA network and evaluation of its relation with HCC outcome
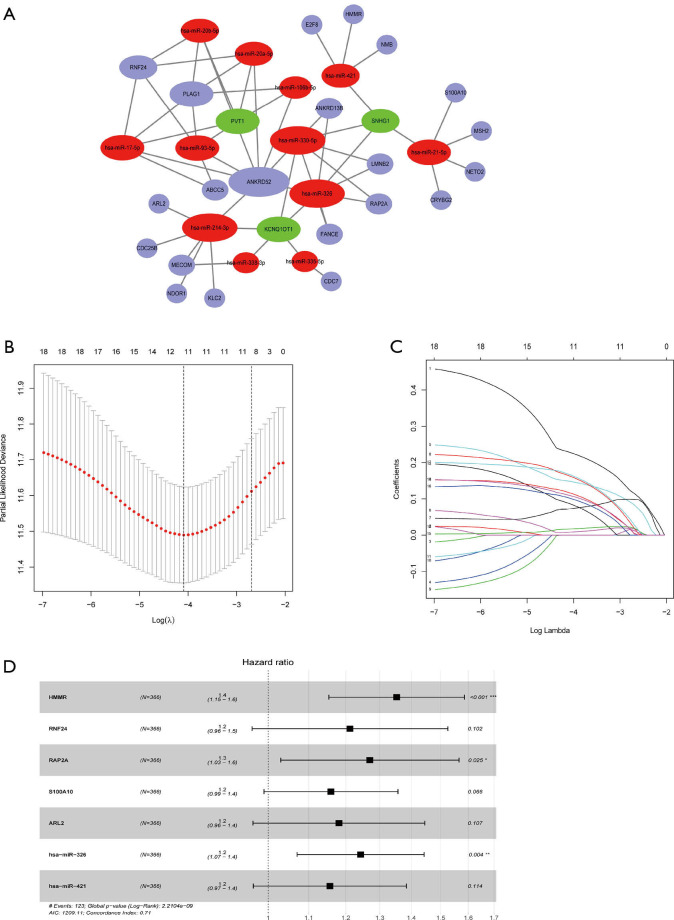
Based on the miRNA-lncRNA and miRNA-mRNA interaction data from the starBase database and inclusion criteria in section of Methods, a ceRNA network composed of 12 miRNAs, 3 lncRNAs, and 21 mRNAs was constructed (Figure 3A). Then, the 36 components involved in the CeRNA network were identified as potential biomarkers in the occurrence of HCC, and K-M curves were drawn to further validate the correlation of the ceRNA network and outcomes of HCC (Figure S1). The results indicated that half of the DEGs (18/36) including 3 miRNAs and 12 mRNAs were confirmed as having strong association with the OS of HCC patients.
Figure 3.
Construction of the ceRNA network and ceRNA risk model. (A) The ceRNA network composed of 12 miRNAs (red balls), 3 lncRNAs (blue balls), and 21 mRNAs (blue balls). (B,C) The lasso coefficient profiles (B) and a partial likelihood deviance plot (C) indicated that 11 hub RNAs of ceRNA networks should be retained. (D) Forest plots indicated 5 mRNAs and 2 miRNAs to be incorporated into multivariate the Cox proportion hazards model to predict the survival of HCC patients. The concordance of the ceRNA risk model was 0.71, indicating a favorable predictive power. ceRNA, competing endogenous RNA network; miRNA, microRNA; mRNA, messenger RNA.
Construction of a risk model based on the prognosis-related ceRNA network
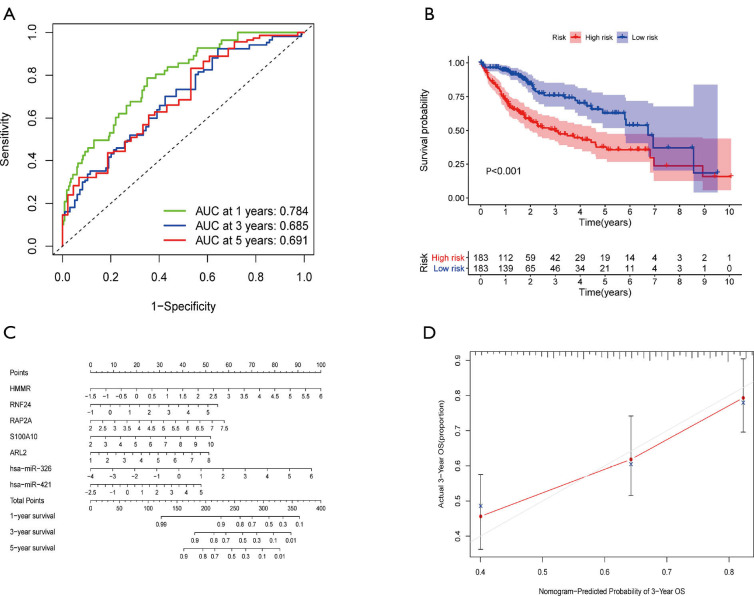
The 18 above-mentioned DEGs were enrolled to construct the risk model by lasso and multivariate Cox regression analysis. The results of lasso regression illustrated that only 11 kinds of genes were retained (Figure 3B,C), and these were then incorporated into a multivariable Cox proportional hazards model. A forest plot was used to display the outcome of multivariate Cox regression analysis (Figure 3D), and 7 key genes composed of 5 mRNAs and 2 miRNAs were reserved. In the multivariate Cox model, the concordance index was 0.71 which demonstrated its accuracy and efficiency (Figure 3D). Meanwhile, the weight coefficient of each hub gene was determined (Table 2), and the ceRNA risk model was calculated as follows: risk score = 0.301812 × HMMR + 0.192152 × RNF24 + 0.238809 × RAP2A + 0.147385 × S100A10 + 0.166123 × ARL2 + 0.217059 × hsa-miR-326 + 0.144815 × hsa-miR-421 . To test the robustness of the risk model, an ROC curve was plotted, and the areas under curve (AUC) of 1-, 3-, and 5-year OS were 0.784, 0.685, and 0.691 respectively (Figure 4A), which suggest the model based on the ceRNA network had favorable accuracy. Then, the HCC patients were stratified into high- and low-risk groups according to the median cutoff value, and the subsequent K-M curves showed that the high-risk cohort had a poorer prognosis than its low-risk counterpart (Figure 4B). The nomogram was adopted to predict the 1-, 3-, and 5-year survival rate of patients with HCC, and a calibration curve was plotted to assess the discrimination and precision of the nomogram. The calibration curve consistently confirmed that the risk model based on the 8 hub genes had a satisfactory predictive effect (Figure 4C,D).
Table 2. Multivariate COX analysis of the ceRNA network.
| Gene | Coefficients | HR | HR.95L | HR.95H | P value |
|---|---|---|---|---|---|
| HMMR | 0.301812 | 1.352307 | 1.153170 | 1.585832 | 0.000204 |
| RNF24 | 0.192152 | 1.211854 | 0.962767 | 1.525386 | 0.101682 |
| RAP2A | 0.238809 | 1.269736 | 1.029844 | 1.565508 | 0.025403 |
| S100A10 | 0.147385 | 1.158800 | 0.990091 | 1.356257 | 0.066370 |
| ARL2 | 0.166123 | 1.180718 | 0.964939 | 1.444750 | 0.106669 |
| has-miR-326 | 0.217059 | 1.242417 | 1.070136 | 1.442433 | 0.004372 |
| hsa-miR-421 | 0.144815 | 1.155826 | 0.965607 | 1.383516 | 0.114454 |
ceRNA, competing endogenous RNA network.
Figure 4.
Evaluation of a ceRNA risk model and construction of a nomogram based on the 7 hub RNAs. (A) ROC curve of the ceRNA model was shown and the AUC of 1-, 3- and 5-year OS were 0.784, 0.685, and 0.691 respectively. (B) The K-M curve showing that the high-risk groups (red curve) had a worse OS than the low-risk (blue curve) according to the median cutoff value of risk scores (P<0.001). (C) A nomogram was established based on the 7 hub RNAs. (D) A calibration diagram demonstrating the discrimination and accuracy of the nomogram. OS, overall survival; ROC, receiver operating characteristic; AUC, area under the curve; ceRNA, competing endogenous RNA network; ROC, receiver operating characteristic; AUC, area under the curve; K-M, Kaplan-Meier.
Profile of TICs and its relationship with HCC
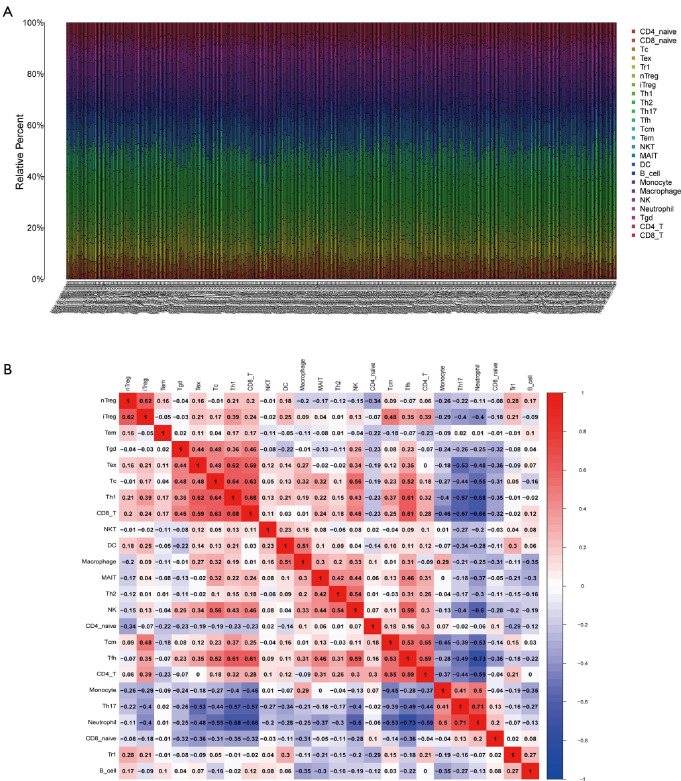
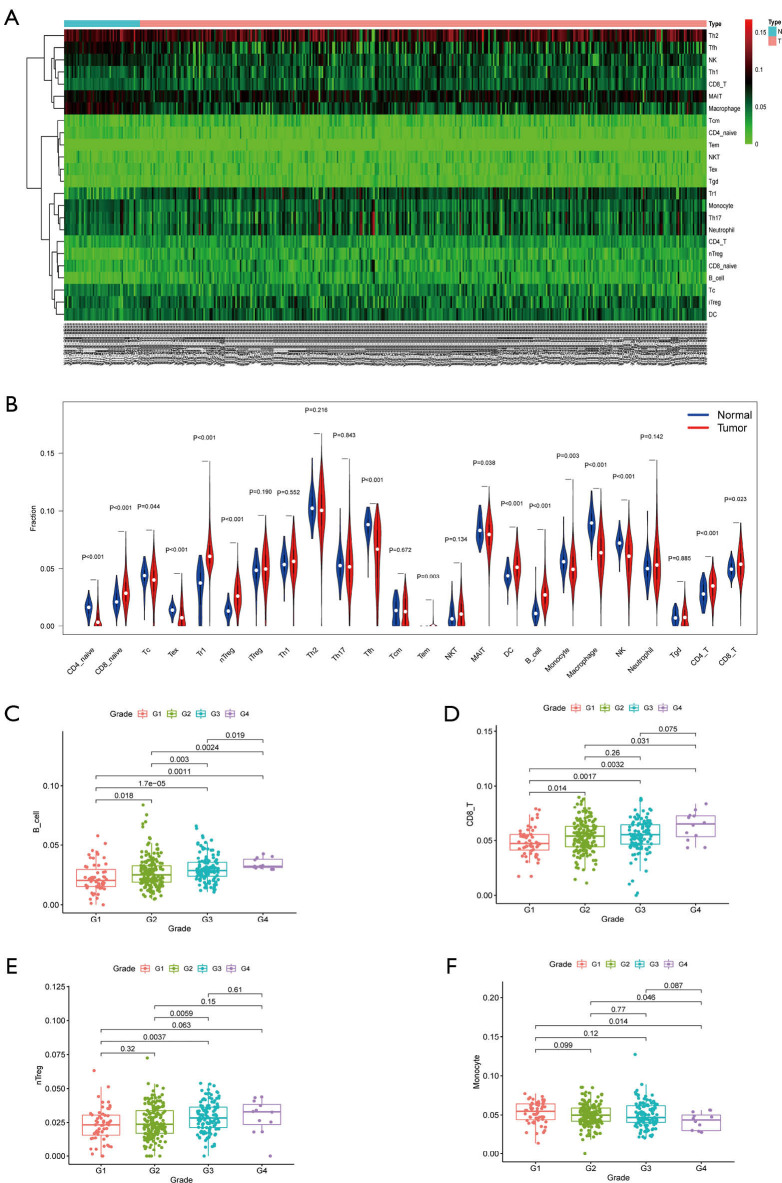
The fragment of 24 TICs in HCC tissues were evaluated by the ssGSEA algorithm as displayed in Figure 5A, and the interaction of which is displayed in Figure 5B. The heatmap in Figure 6A illustrates the differentially expressed TICs between normal and tumor samples. Similarly, the violin plot comparing normal and tumor samples illustrates that there were different fractions of the 16 immune cells (Figure 6B). Furthermore, we found that the fractions of B cells, CD8+ T cells, and natural regulatory T (nTreg) cells was positively associated with clinical grade, while that of monocyte cells was negatively related to clinical grade (Figure 6C,D,E,F).
Figure 5.
Dissection of TICs in HCC samples. (A) A bar diagram showing the proportion of the 24 types of TICs in HCC samples by ssGSEA algorithm. (B) Correlation analysis of each TIC, with a red box indicating a positive association and a blue one representing a negative correlation. TICs, tumor-infiltrating cells; HCC, hepatocellular carcinoma; ssGSEA, single-sample gene set enrichment analysis.
Figure 6.
Relationship between TICs and clinicopathological features. (A) A heatmap showing the differential TICs between normal and cancerous samples. (B) A violin plot illustrating the different proportions of TICs. B cells (C), CD8+ T cells (D), and nTreg cells (E) were found to be positively related with the clinical grade of HCC patients while monocytes (F) had a negative association with grade. TICs, tumor-infiltrating cells.
Construction of a prediction model according to the prognosis-associated immune cells
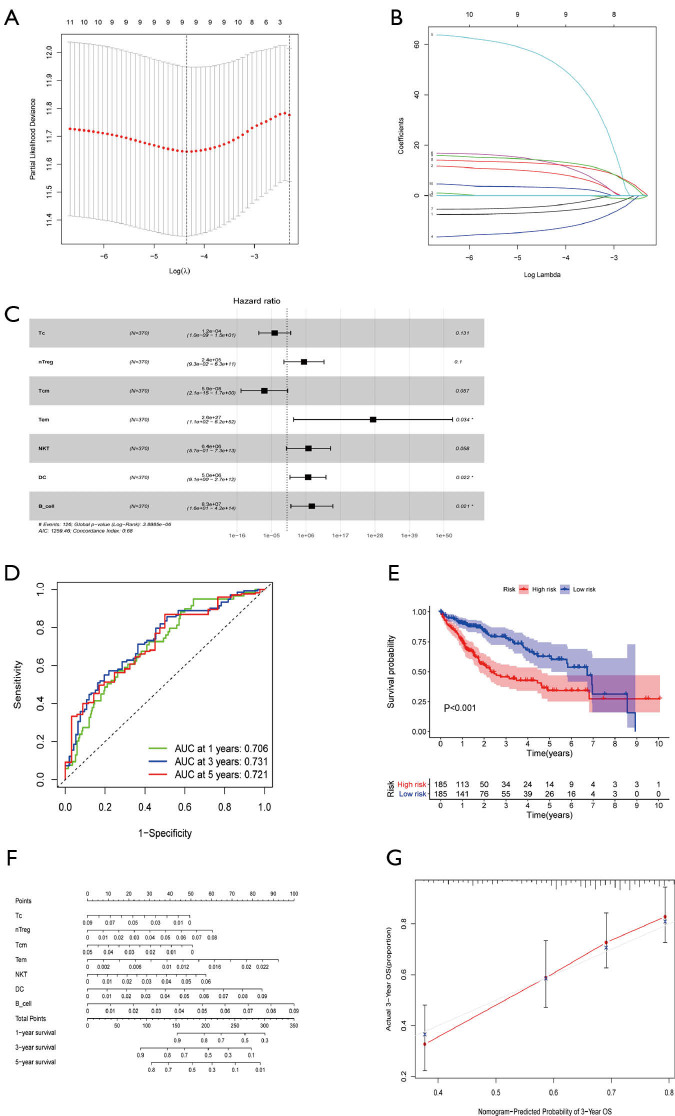
By merging the proportion of different TICs and survival information of HCC patients, K-M curves indicated that B cells, DCs, and macrophage cells contributed to an unfavorable prognosis, while central memory T (Tcm) cells and follicular helper T (Tfh) cells had a positive association with the excellent outcomes of HCC (Figure S2). K-M curves found a further 5 TICs to be prognosis-related cells while univariable Cox analysis suggested that 11 kinds of cells were prone to be statistically correlated with 5-year OS, and these TICs were further incorporated into lasso regression analysis. The lasso analysis indicated that 9 types of TICs were acceptable (Figure 7A,B) and only 7 kinds of TICs were finally identified by multivariable COX regression analysis (Figure 7C, Table 3). The forest diagram based on multivariate Cox analysis shown in Figure 7D indicates a concordance of the model of 0.68. Similarly, the prediction model based on TICs was calculated in the same fashion as that of the ceRNA risk model, with the total score being the sum of the scores derived from multiplying the coefficients and fractions of TICs. According to the median score, two risk groups (high and low) of HCC patients were categorized, with the high-risk group exhibiting a reduced 5-year overall survival rate compared to the low-risk group (Figure 7E). As for the predictive performance of the model, the AUC for 1-, 3-, and 5-year overall survival prediction was 0.706, 0.731, and 0.721, respectively, which demonstrated an excellent predictive value. A nomogram was also constructed (Figure 7F), and the calibration plot showed a good concordance between predicted and actual survival time (Figure 7G).
Figure 7.
Construction of a risk model and nomogram based on TICs. (A,B) Lasso analysis was performed for 24 kinds of TICs, and only 9 immune cells were incorporated with the least partial likelihood deviance. (C) Multivariable Cox proportional hazards model composed of 7 different TIC types. (D) ROC curves to evaluate the predictive power of the TIC signature and all AUC values of 1-, 3-, and 5-year overall survival were larger than 0.7. (E) Low-risk patients had a longer overall survival time than high-risk patients, as revealed by the K-M curve (P<0.001). (F) The nomogram for predicting the 1-, 3-, and 5-year overall survival rate of HCC patients based on the 7 TIC types. (G) A 3-year calibration curve to assess the precision of the nomogram. *P<0.05. TICs, tumor-infiltrating cells; Lasso, least absolute shrinkage and selection operator; ROC, receiver operating characteristic; AUC, area under the curve; K-M, Kaplan-Meier.
Table 3. Multivariate Cox analysis of TICs.
| TICs | Coefficients | HR | HR.95L | HR.95H | P value |
|---|---|---|---|---|---|
| Tc | −9.01924 | 0.000121 | 9.96E-10 | 14.71763 | 0.131090 |
| nTreg | 12.39636 | 241919.5 | 0.092603 | 6.32E+11 | 0.100106 |
| Tcm | −16.6513 | 5.87E-08 | 2.07E-15 | 1.663066 | 0.057189 |
| Tem | 63.14361 | 2.65E+27 | 112.473 | 6.23E+52 | 0.034141 |
| NKT | 15.67896 | 6445909 | 0.571136 | 7.27E+13 | 0.058443 |
| DC | 15.41928 | 4971750 | 9.117111 | 2.71E+12 | 0.022143 |
| B cell | 18.22832 | 82501248 | 16.36414 | 4.16E+14 | 0.020617 |
TICs, tumor-infiltrating cells; DCs, dendritic cells; NKT, natural killer T.
Correlation of tumor immune cells with hub genes of the ceRNA network
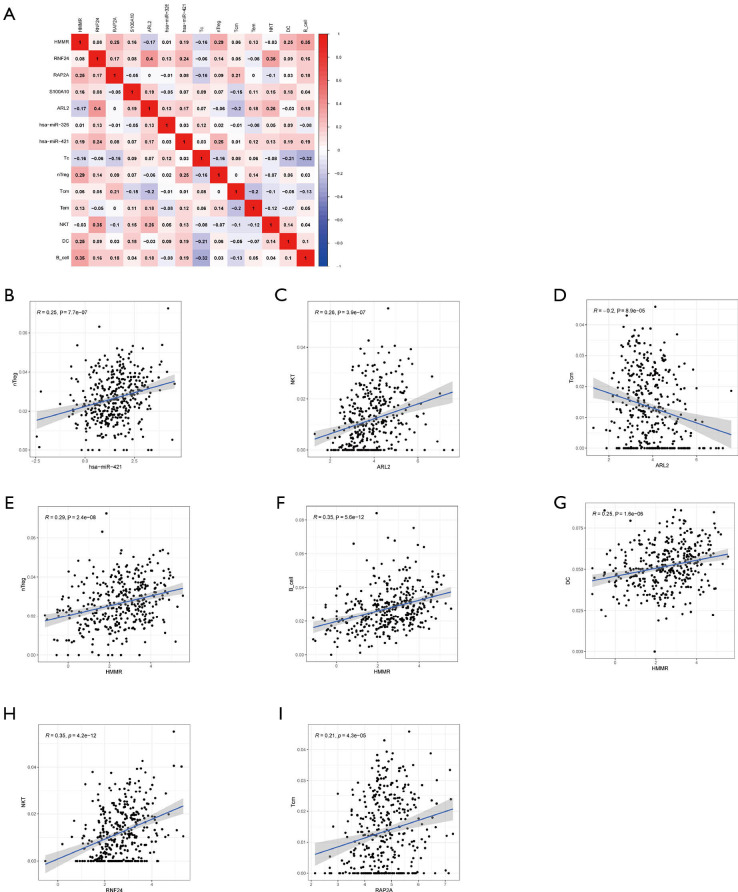
Correlation analysis (Figure 8A), was adopted to explore the 7 types of TICs and the 7 hub genes of the ceRNA network. There were a strong relationship between the ceRNA network and the TICs, with the following correlations being found: hsa-miR-421 and nTreg cells (Figure 8B; R=0.25, R represents relation coefficient calculated by Pearson analysis), ARL2 and NKT cells (Figure 8C; R=0.26), ARL2 and Tcm cells (Figure 8D; R=−0.2), HMMR and nTreg cells (Figure 8E; R=0.29), HMMR and B cells (Figure 8F; R=0.35), HMMR and DCs (Figure 8G; R=0.25), RNF24 and NKT cells (Figure 8H, R=0.35), and RAP2A and Tcm cells (Figure 8I; R=0.21). The P values in all the above-mentioned correlation analyses were less than 0.05 (Figure 8B,C,D,E,F,G,H,I). Taken together, we can speculate that there was strong correlation between the prognosis-related ceRNA molecules and TICs, which indicates that these ceRNA hub genes dynamically regulate the immune landscape of HCC.
Figure 8.
Correlation of ceRNA networks and TICs. (A) Correlation analysis of the model RNAs and TICs and the R value in the figure was calculated by Pearson correlation coefficient. A red box indicates a positive correlation while a blue box indicates a negative correlation. Scatter plots show the relationship between hub genes of ceRNA and TICs. (B) hsa-miR-421 and nTreg cells (R=0.25). (C) mRNA ARL2 and NKT cells (R=0.26). (D) ARL2 and Tcm cells (R=−0.2). (E) HMMR and nTreg cells (R=0.29). (F) HMMR and B cells (R=0.35). (G) HMMR and DCs (R=0.25). (H) RNF24 and NKT cells (R=0.35). (I) RAP2A and Tcm cells (R=0.21). (B,C,D,E,F,G,H,I) All P values <0.001. Tcm, central memory T (cell_; NKT, natural killer T (cell_; DC, dendritic cell; R, correlation coefficient. ceRNA, competing endogenous RNA network; TICs, tumor-infiltrating cells; DCs, dendritic cells; NKT, natural killer T.
Validation of hub genes in the risk model in ICGC database
Due to a lack of miRNA data from the ICGC database, we only validated the hub mRNAs in the ceRNA network. K-M curves illustrated that ARL2 (P=0.008), HMMR (P<0.001), RAP2A (P=0.023), S100A10 (P=0.042), and RNF24 (P=0.087) contributed to a worse OS (Figure S3), which was consistent with the results of the TCGA-HCC analysis.
Discussion
HCC is currently regarded as one of the most devastating and heterogeneous tumor diseases, and the most common form of liver cancer, accounting for up to 90% of primary hepatic malignancies (13). It is widely acknowledged that the bidirectional interactions between cancer cells and their surrounding TME, which is mainly composed of various TICs, Figure prominently in the carcinogenesis and development of cancer (14). Although it has shown initial promise as a cancer therapy, immunotherapy targeting TME has not shown satisfactory clinical benefits for advanced HCC patients, mainly due the complexity and difficult-to-remodel the TME (15). Observable ceRNA including miRNA, lncRNA, and mRNA can reflect the accumulated genetic mutations, which facilitates the forming of neoantigens on tumor tissue. Nevertheless, studies on the correlation of ceRNA and TICs are inadequate, and so our study aimed first at identifying the tumor-related RNAs and immune cells, and then explored their potential correlation in HCC.
In the present study, analyses were conducted on the DEGs, including the differential expression of mRNAs, miRNAs, and lncRNAs betwe en tumorous and adjacent nontumorous tissues. We then constructed a ceRNA network composed of the 12 miRNAs, 3 lncRNAs, and 21 mRNAs. To verify the relationship between the ceRNA network and clinical outcomes, we obtained 18 genes including ABCC5, hsa-miR-326, and RNF24, by exhibiting K-M survival curves . We subsequently performed univariable Cox analysis, lasso regression analysis, and multivariable Cox analysis in sequence to further validate the relevant prognostic signature and the fitness of hub genes, and to ascertain the coefficients. This yielded the following RNA types: HMMR, RNF24, PAP2A, S100A10, ARL2, hsa-miR-326, and hsa-miR-421. We then established the ceRNA risk model accordingly, with the ROC curve plotted to examine its robustness. The nomogram was established for the 1-, 3-, and 5-year OS of HCC patients with the calibration curve as an assessment. Thereafter, we employed a ssGSEA algorithm to identify the differently expressed fragments of 24 TICs, and the correlation analysis concluded that the proportion of B cells, CD8+ T cells, and nTreg cells were positively associated with grade, while that of monocyte cells was negatively related to clinical grade. After synthesizing the K-M curves, univariable Cox analysis, and lasso regression analysis, we analyzed the 7 types cells by multivariable Cox regression analysis, identifying cytotoxic T (Tc) cells, nTreg cells, Tcm cells, effective memory T (Tem) cells, NKT cells, DCs, and B cells. Similarly, the prediction model based on TICs were calculated accordingly, and demonstrated a favorable predictive performance. We attempted to determine with the correlation between the above two parts, that is, the hub genes in ceRNA network and immune cells. Although a strong correlation suggested that these RNAs may influence the fractions of TICs by remodeling the surrounding tumor microenvironments, the underlying mechanism remains unclear and needs to be further explored and verified in basic research.
It has been discovered that Hyaluronan-mediated motility receptor (HMMR), via hyaluronan-mediated signaling, can promote the progression of several tumors, such as basal-like breast cancer (16), gastric cancer (17), and papillary muscle-invasive bladder cancer (18). HMMR is also regarded as a regulator for cell division processes, including mitosis and meiosis (19), which are closely related to the balance of homeostasis and tumorigenesis. Likewise, RNF24 was demonstrated to be a cancer-promoting factor, with its expression being regulated twice in esophageal adenocarcinoma (20) and oral squamous cell carcinoma patients (21). S100 calcium binding protein A10 (S100A10), a member of the S100 protein family, commonly forms a complex with Annexin A2, could accelerate the degradation of extracellular matrix by boosting the formation of plasmin (22), which facilitates progression and metastasis (23). Previous studies have confirmed that S100A10 is upregulated in many cancers and it may lead to a cascade of cell events; it thus may serve as a predictive factor for prognosis and drug resistance (22,23).
Some other relevant RNAs in our study are subjects of controversy in the literature. First, Rap2a is a member of the small GTPase superfamily. For one, previous studies have suggested that it is significantly upregulated in many types of tumor (24), including renal cell carcinoma (25) and HCC (26), and can enhance the migration and invasive ability of cancer cells through upregulating p-Akt (25). More specifically, transcription of Rap2A can directly activate by p53 in a TME, increasing matrix metalloproteinase 2 (MMP2) and MMP9 (24). However, other research has found that the overexpression of Rap2a suppresses glioma migration and invasion through downregulating p-AKT, which can be restrained by PI3K-specific inhibitor (27). Similarly, an earlier study found that a lower level of ARL2 can increase the aggressiveness of primary breast cancers (28), and accumulating evidence supports its role as an oncogene in cervical cancer (29) and its overexpression as a prognostic biomarker in HCC (30). Moreover, ARL2 may regulate progression and metastasis by adjusting the expression of AXL, an essential functional regulator, in glioma cells (31). miR-421, for its part, performs somewhat of a dual role. It is considered to be a diagnostic and prognostic marker in osteosarcoma (32) and plays a role in enhancing the progression and proliferation of non-small cell lung cancer cells through targeting PDCD4 (33) while inhibiting that of colorectal cancer by targeting MTA1 (34). Next, miR-326 is a known tumor suppressor in several malignant tumors, like human prostatic carcinoma and lung cancer, and works by targeting Mucin1 (35) and CCND1, respectively. Other studies have reported that miR-326 has an inhibitory effect on non-small cell lung cancer (36) development. However, in HCC, it serves as a part of the miR-326/SMAD3/ZEB1 signaling pathway, promoting HCC progression once targeted by LncRNA SNHG3 (37). Taken together, the above research findings attest to the complex and ill-defined role of these RNAs in cancer, which can be attributed to the diverse and complicated tissue microenvironment.
Our study also analyzed potential role of TICs in prognosis of HCC. TICs can directly attack tumor cells with antigens by releasing perforin after contact with the target cell, and can also secrete granzyme and induce the apoptosis of target cells. nTreg cells have also been confirmed as having an essential role in controlling immune response to hepatitis B and C liver diseases, modulating the progression of hepatitis to cirrhosis to cancer (38). Similarly, a previous study revealed that the fractions of Tcm cells is predominant in Merkel cell carcinoma via programmed cell death protein 1 (PD-1)/programmed death-ligand 1 (PD-L1) inhibition pathway, revealing its prognostic ability in immunotherapy (39). Furthermore, Tem was found to be phenotypically cytotoxic to cancer cells, although it showed a low expression of perforin (40). Similarly, NKT cells are known as a double-edged sword in tumor immunity. While these cells can suppress the development of tumor by promoting antitumor immunity via type I NKT, they can also inhibit the immune system, thus facilitating the progression of cancer by type II NKT cells; this represents a reciprocal cross-regulation of maintaining the balance via the immunoregulatory axis (41). As the most potent antigen-presenting cells, DCs are adept at generating and linking the innate and adaptive immune system against cancer and have been hailed as the center of immune response (42). Emerging studies on DC vaccination have been aimed at inducing tumor-specific effector T cells and immunological memory based on the bilateral interactions (43). Also, there is a view that immunity and tolerance to tumor cells hinge on the balance of DCs and dying tumor cells (44). B cells are also so pivotal in antitumor immune response; one experiment found that mice with no mature B cells had less T cell infiltration and more severe symptoms after receiving murine hepatoma cells (45). Similarly, a significant decline of B cell activation genes was observed in HCC patients with worse prognosis (46). In contrast, other research has found the evident enrichment in tumor tissue of a special subset of B cells called regulatory B cells, suggesting that they may have a role in promoting various cancer types, including HCC (47). Up to now, there is no solid evidence about main lymphocyte in tumor microenvironment because most TIC had a dual effect in anti-tumor immunity. There were several opinions in main lymphocyte in TME: (I) cytotoxic CD8+ T cells (CTLs) are considered as one of main effector cell types of the adaptive immune system responsible for combating cancer cells (48). (II) NK cells should be considered as a suitable target to modulate the immunosuppressive TME and try to trigger a more potent anti-tumor response (49). (III) B cells are recognized as the main effector cells of humoral immunity which suppress tumor progression by secreting immunoglobulins, promoting T cell response, and killing cancer cells directly (50).
As shown in Figure 8A,B,C,D,E,F,G,H,I, our study found a strong relationship between ceRNA and TICs, specifically between hsa-miR-421 and nTreg cells, ARL2 and NKT cells, ARL2 and Tcm cells, HMMR and nTreg cells, HMMR and B cells, HMMR and DCs, RNF24 and NKT cells, and RAP2A and Tcm cells. A recent study explored how DCs target HMMR for immunotherapy and provided a possible explanation: DCs produce antibodies mediated by CD4+ T cells, which may bind to HMMR and inhibit the signal transduction for cell growth (51).
Collectively, these results suggest that these ceRNA hub genes of may dynamically regulate the immune landscape of HCC. However, a limitation of our study was that we could not clarify the underlying mechanism for this regulation, and this should be investigated by further basic research. Our work here provides novel insights into the function of ceRNA, and we speculate that targeting these hub RNAs may enhance the response to ICB through remodeling the tumor cell environment, thereby improving the prognosis of advanced and ICB-non-responsive HCC patients. Finally, the two nomograms constructed based on ceRNA and TICs might serve as effective prognostic indicators for clinical application.
Acknowledgments
Funding: This study was financed by the National Natural Science Foundation of China (No. 81672751) and the Key Research and Development Program of Shaanxi province (No. 2019SF-010).
Ethical Statement: The authors are accountable for all aspects of the work in ensuring that questions related to the accuracy or integrity of any part of the work are appropriately investigated and resolved. The study was conducted in accordance with the Declaration of Helsinki (as revised in 2013).
Open Access Statement: This is an Open Access article distributed in accordance with the Creative Commons Attribution-NonCommercial-NoDerivs 4.0 International License (CC BY-NC-ND 4.0), which permits the non-commercial replication and distribution of the article with the strict proviso that no changes or edits are made and the original work is properly cited (including links to both the formal publication through the relevant DOI and the license). See: https://creativecommons.org/licenses/by-nc-nd/4.0/.
Reporting Checklist: The authors have completed the MDAR checklist. Available at http://dx.doi.org/10.21037/jgo-20-555
Conflicts of Interest: All authors have completed the ICMJE uniform disclosure form (available at http://dx.doi.org/10.21037/jgo-20-555). The authors have no conflicts of interest to declare.
(English Language Editor: J. Gray)
References
- 1.Bray F, Ferlay J, Soerjomataram I, et al. Global cancer statistics 2018: GLOBOCAN estimates of incidence and mortality worldwide for 36 cancers in 185 countries. CA Cancer J Clin 2018;68:394-424. 10.3322/caac.21492 [DOI] [PubMed] [Google Scholar]
- 2.Amicone L, Marchetti A. Microenvironment and tumor cells: two targets for new molecular therapies of hepatocellular carcinoma. Transl Gastroenterol Hepatol 2018;3:24. 10.21037/tgh.2018.04.05 [DOI] [PMC free article] [PubMed] [Google Scholar]
- 3.Champiat S, Lambotte O, Barreau E, et al. Management of immune checkpoint blockade dysimmune toxicities: a collaborative position paper. Ann Oncol 2016;27:559-74. 10.1093/annonc/mdv623 [DOI] [PubMed] [Google Scholar]
- 4.Shen L, Li C, Liu M, et al. Prognostic and clinicopathological roles of long non-coding RNA XIST in human cancers: a meta-analysis. Transl Cancer Res 2018;7:1624-33. 10.21037/tcr.2018.12.13 [DOI] [Google Scholar]
- 5.Wang SH, Ma F, Tang ZH, et al. Long non-coding RNA H19 regulates FOXM1 expression by competitively binding endogenous miR-342-3p in gallbladder cancer. J Exp Clin Cancer Res 2016;35:160. 10.1186/s13046-016-0436-6 [DOI] [PMC free article] [PubMed] [Google Scholar]
- 6.Wang J, Liu X, Wu H, et al. CREB up-regulates long non-coding RNA, HULC expression through interaction with microRNA-372 in liver cancer. Nucleic Acids Res 2010;38:5366-83. 10.1093/nar/gkq285 [DOI] [PMC free article] [PubMed] [Google Scholar]
- 7.Long J, Bai Y, Yang X, et al. Construction and comprehensive analysis of a ceRNA network to reveal potential prognostic biomarkers for hepatocellular carcinoma. Cancer Cell Int 2019;19:90. 10.1186/s12935-019-0817-y [DOI] [PMC free article] [PubMed] [Google Scholar]
- 8.Wei B, Kong W, Mou X, et al. Comprehensive analysis of tumor immune infiltration associated with endogenous competitive RNA networks in lung adenocarcinoma. Pathol Res Pract 2019;215:159-70. 10.1016/j.prp.2018.10.032 [DOI] [PubMed] [Google Scholar]
- 9.Huang R, Zeng Z, Li G, et al. The Construction and Comprehensive Analysis of ceRNA Networks and Tumor-Infiltrating Immune Cells in Bone Metastatic Melanoma. Front Genet 2019;10:828. 10.3389/fgene.2019.00828 [DOI] [PMC free article] [PubMed] [Google Scholar]
- 10.Huang R, Wu J, Zheng Z, et al. The Construction and Analysis of ceRNA Network and Patterns of Immune Infiltration in Mesothelioma With Bone Metastasis. Front Bioeng Biotechnol 2019;7:257. 10.3389/fbioe.2019.00257 [DOI] [PMC free article] [PubMed] [Google Scholar]
- 11.Huang R, Meng T, Chen R, et al. The construction and analysis of tumor-infiltrating immune cell and ceRNA networks in recurrent soft tissue sarcoma. Aging (Albany NY) 2019;11:10116-43. 10.18632/aging.102424 [DOI] [PMC free article] [PubMed] [Google Scholar]
- 12.Charoentong P, Finotello F, Angelova M, et al. Pan-cancer Immunogenomic Analyses Reveal Genotype-Immunophenotype Relationships and Predictors of Response to Checkpoint Blockade. Cell Rep 2017;18:248-62. 10.1016/j.celrep.2016.12.019 [DOI] [PubMed] [Google Scholar]
- 13.Boland P, Wu J. Systemic therapy for hepatocellular carcinoma: beyond sorafenib. Chin Clin Oncol 2018;7:50. 10.21037/cco.2018.10.10 [DOI] [PubMed] [Google Scholar]
- 14.Meurette O, Mehlen P. Notch Signaling in the Tumor Microenvironment. Cancer Cell 2018;34:536-48. 10.1016/j.ccell.2018.07.009 [DOI] [PubMed] [Google Scholar]
- 15.Nishida N, Kudo M. Immunological Microenvironment of Hepatocellular Carcinoma and Its Clinical Implication. Oncology 2017;92 Suppl 1:40-9. 10.1159/000451015 [DOI] [PubMed] [Google Scholar]
- 16.Liu W, Ma J, Cheng Y, et al. HMMR antisense RNA 1, a novel long noncoding RNA, regulates the progression of basal-like breast cancer cells. Breast Cancer (Dove Med Press) 2016;8:223-9. 10.2147/BCTT.S119997 [DOI] [PMC free article] [PubMed] [Google Scholar]
- 17.Kang HG, Kim WJ, Kang HG, et al. Galectin-3 Interacts with C/EBPβ and Upregulates Hyaluronan-Mediated Motility Receptor Expression in Gastric Cancer. Mol Cancer Res 2020;18:403-13. 10.1158/1541-7786.MCR-19-0811 [DOI] [PubMed] [Google Scholar]
- 18.Yang D, Ma Y, Zhao P, et al. Systematic screening of protein-coding gene expression identified HMMR as a potential independent indicator of unfavorable survival in patients with papillary muscle-invasive bladder cancer. Biomed Pharmacother 2019;120:109433. 10.1016/j.biopha.2019.109433 [DOI] [PubMed] [Google Scholar]
- 19.He Z, Mei L, Connell M, et al. Hyaluronan Mediated Motility Receptor (HMMR) Encodes an Evolutionarily Conserved Homeostasis, Mitosis, and Meiosis Regulator Rather than a Hyaluronan Receptor. Cells 2020;9:819. 10.3390/cells9040819 [DOI] [PMC free article] [PubMed] [Google Scholar]
- 20.Wang XW, Wei W, Wang WQ, et al. RING finger proteins are involved in the progression of barrett esophagus to esophageal adenocarcinoma: a preliminary study. Gut Liver 2014;8:487-94. 10.5009/gnl13133 [DOI] [PMC free article] [PubMed] [Google Scholar]
- 21.Cheong SC, Chandramouli GV, Saleh A, et al. Gene expression in human oral squamous cell carcinoma is influenced by risk factor exposure. Oral Oncol 2009;45:712-9. 10.1016/j.oraloncology.2008.11.002 [DOI] [PubMed] [Google Scholar]
- 22.Christensen MV, Høgdall CK, Jochumsen KM, et al. Annexin A2 and cancer: A systematic review. Int J Oncol 2018;52:5-18. [DOI] [PubMed] [Google Scholar]
- 23.Nymoen DA, Hetland Falkenthal TE, Holth A, et al. Expression and clinical role of chemoresponse-associated genes in ovarian serous carcinoma. Gynecol Oncol 2015;139:30-9. 10.1016/j.ygyno.2015.07.107 [DOI] [PubMed] [Google Scholar]
- 24.Wu JX, Zhang DG, Zheng JN, et al. Rap2a is a novel target gene of p53 and regulates cancer cell migration and invasion. Cell Signal 2015;27:1198-207. 10.1016/j.cellsig.2015.02.026 [DOI] [PubMed] [Google Scholar]
- 25.Wu JX, Du WQ, Wang XC, et al. Rap2a serves as a potential prognostic indicator of renal cell carcinoma and promotes its migration and invasion through up-regulating p-Akt. Sci Rep 2017;7:6623. 10.1038/s41598-017-06162-7 [DOI] [PMC free article] [PubMed] [Google Scholar]
- 26.Zheng X, Zhao W, Ji P, et al. High expression of Rap2A is associated with poor prognosis of patients with hepatocellular carcinoma. Int J Clin Exp Pathol 2017;10:9607-13. [PMC free article] [PubMed] [Google Scholar]
- 27.Wang L, Zhan W, Xie S, et al. Over-expression of Rap2a inhibits glioma migration and invasion by down-regulating p-AKT. Cell Biol Int 2014;38:326-34. 10.1002/cbin.10213 [DOI] [PubMed] [Google Scholar]
- 28.Beghin A, Belin S, Hage-Sleiman R, et al. ADP ribosylation factor like 2 (Arl2) regulates breast tumor aggressivity in immunodeficient mice. PLoS One 2009;4:e7478. 10.1371/journal.pone.0007478 [DOI] [PMC free article] [PubMed] [Google Scholar]
- 29.Peng R, Men J, Ma R, et al. miR-214 down-regulates ARL2 and suppresses growth and invasion of cervical cancer cells. Biochem Biophys Res Commun 2017;484:623-30. 10.1016/j.bbrc.2017.01.152 [DOI] [PubMed] [Google Scholar]
- 30.Hass HG, Vogel U, Scheurlen M, et al. Gene-expression Analysis Identifies Specific Patterns of Dysregulated Molecular Pathways and Genetic Subgroups of Human Hepatocellular Carcinoma. Anticancer Res 2016;36:5087-95. 10.21873/anticanres.11078 [DOI] [PubMed] [Google Scholar]
- 31.Wang Y, Guan G, Cheng W, et al. ARL2 overexpression inhibits glioma proliferation and tumorigenicity via down-regulating AXL. BMC Cancer 2018;18:599. 10.1186/s12885-018-4517-0 [DOI] [PMC free article] [PubMed] [Google Scholar]
- 32.Zhou S, Wang B, Hu J, et al. miR-421 is a diagnostic and prognostic marker in patients with osteosarcoma. Tumour Biol 2016;37:9001-7. 10.1007/s13277-015-4578-5 [DOI] [PubMed] [Google Scholar]
- 33.Yang YN, Bian LQ, Ling XD, et al. MicroRNA-421 promotes proliferation and invasion of non-small cell lung cancer cells through targeting PDCD4. Pathol Res Pract 2019;215:152555. 10.1016/j.prp.2019.152555 [DOI] [PubMed] [Google Scholar]
- 34.Xue L, Yang D. MiR-421 inhibited proliferation and metastasis of colorectal cancer by targeting MTA1. J BUON 2018;23:1633-9. [PubMed] [Google Scholar]
- 35.Liang X, Li Z, Men Q, et al. miR-326 functions as a tumor suppressor in human prostatic carcinoma by targeting Mucin1. Biomed Pharmacother 2018;108:574-83. 10.1016/j.biopha.2018.09.053 [DOI] [PubMed] [Google Scholar]
- 36.Sun C, Huang C, Li S, et al. Hsa-miR-326 targets CCND1 and inhibits non-small cell lung cancer development. Oncotarget 2016;7:8341-59. 10.18632/oncotarget.7071 [DOI] [PMC free article] [PubMed] [Google Scholar]
- 37.Zhao Q, Wu C, Wang J, et al. LncRNA SNHG3 Promotes Hepatocellular Tumorigenesis by Targeting miR-326. Tohoku J Exp Med 2019;249:43-56. 10.1620/tjem.249.43 [DOI] [PubMed] [Google Scholar]
- 38.Miroux C, Vausselin T, Delhem N. Regulatory T cells in HBV and HCV liver diseases: implication of regulatory T lymphocytes in the control of immune response. Expert Opin Biol Ther 2010;10:1563-72. 10.1517/14712598.2010.529125 [DOI] [PubMed] [Google Scholar]
- 39.Spassova I, Ugurel S, Terheyden P, et al. Predominance of Central Memory T Cells with High T-Cell Receptor Repertoire Diversity is Associated with Response to PD-1/PD-L1 Inhibition in Merkel Cell Carcinoma. Clin Cancer Res 2020;26:2257-67. 10.1158/1078-0432.CCR-19-2244 [DOI] [PubMed] [Google Scholar]
- 40.Ye SW, Wang Y, Valmori D, et al. Ex-vivo analysis of CD8+ T cells infiltrating colorectal tumors identifies a major effector-memory subset with low perforin content. J Clin Immunol 2006;26:447-56. 10.1007/s10875-006-9040-4 [DOI] [PubMed] [Google Scholar]
- 41.Terabe M, Berzofsky JA. Tissue-Specific Roles of NKT Cells in Tumor Immunity. Front Immunol 2018;9:1838. 10.3389/fimmu.2018.01838 [DOI] [PMC free article] [PubMed] [Google Scholar]
- 42.Constantino J, Gomes C, Falcão A, et al. Dendritic cell-based immunotherapy: a basic review and recent advances. Immunol Res 2017;65:798-810. 10.1007/s12026-017-8931-1 [DOI] [PubMed] [Google Scholar]
- 43.Kalinski P, Muthuswamy R, Urban J. Dendritic cells in cancer immunotherapy: vaccines and combination immunotherapies. Expert Rev Vaccines 2013;12:285-95. 10.1586/erv.13.22 [DOI] [PMC free article] [PubMed] [Google Scholar]
- 44.Dhodapkar MV, Dhodapkar KM, Palucka AK. Interactions of tumor cells with dendritic cells: balancing immunity and tolerance. Cell Death Differ 2008;15:39-50. 10.1038/sj.cdd.4402247 [DOI] [PMC free article] [PubMed] [Google Scholar]
- 45.Garnelo M, Tan A, Her Z, et al. Interaction between tumour-infiltrating B cells and T cells controls the progression of hepatocellular carcinoma. Gut 2017;66:342-51. 10.1136/gutjnl-2015-310814 [DOI] [PMC free article] [PubMed] [Google Scholar]
- 46.Schneider C, Teufel A, Yevsa T, et al. Adaptive immunity suppresses formation and progression of diethylnitrosamine-induced liver cancer. Gut 2012;61:1733-43. 10.1136/gutjnl-2011-301116 [DOI] [PMC free article] [PubMed] [Google Scholar]
- 47.Balkwill F, Montfort A, Capasso M. B regulatory cells in cancer. Trends Immunol 2013;34:169-73. 10.1016/j.it.2012.10.007 [DOI] [PubMed] [Google Scholar]
- 48.Davoodzadeh Gholami M, Kardar GA, Saeedi Y, et al. Exhaustion of T lymphocytes in the tumor microenvironment: Significance and effective mechanisms. Cell Immunol 2017;322:1-14. 10.1016/j.cellimm.2017.10.002 [DOI] [PubMed] [Google Scholar]
- 49.Bassani B, Baci D, Gallazzi M, et al. Natural Killer Cells as Key Players of Tumor Progression and Angiogenesis: Old and Novel Tools to Divert Their Pro-Tumor Activities into Potent Anti-Tumor Effects. Cancers (Basel) 2019;11:461. 10.3390/cancers11040461 [DOI] [PMC free article] [PubMed] [Google Scholar]
- 50.Bindea G, Mlecnik B, Tosolini M, et al. Spatiotemporal dynamics of intratumoral immune cells reveal the immune landscape in human cancer. Immunity 2013;39:782-95. 10.1016/j.immuni.2013.10.003 [DOI] [PubMed] [Google Scholar]
- 51.Fukui M, Ueno K, Suehiro Y, et al. Anti-tumor activity of dendritic cells transfected with mRNA for receptor for hyaluronan-mediated motility is mediated by CD4+ T cells. Cancer Immunol Immunother 2006;55:538-46. 10.1007/s00262-005-0027-4 [DOI] [PMC free article] [PubMed] [Google Scholar]


