Abstract
Background
Numerous epidemiological studies have confirmed that diabetes can promote the development of malignant tumors. However, the relationship between renal cell carcinoma (RCC) and diabetic nephropathy (DN) is still controversial. This study aimed to investigate the genes that are co-expressed in DN and RCC in order to gain a better understanding of the relationship between these diseases, and to identify potential biomarkers and targets for the treatment of DN-related RCC.
Methods
We evaluated the differentially expressed genes (DEGs) that are co-expressed in DN and RCC using a wide range of target prediction and analysis methods. Twenty-four genes were identified by intersecting the differential genes of 3 DN datasets and 2 RCC datasets. We predicted the micro-ribonucleic acids (miRNAs) of these genes that may be controlled using the miRNA Data Integration Portal (mirDIP) database, and rated them according to each data forecast based on the Comparative Toxicogenomics Database (CTD) and the StarBase database.
Results
Four genes were associated with DN and RCC patients: the predicted miRNAs hsa-miR-200b-3p and hsa-miR-429 of fibronectin 1 (FN1); the predicted miRNA hsa-miR-29c-3p of collagen type 1 alpha 2 (COL1A2); the predicted miRNA hsa-miR-29c-3p of collagen type 3 alpha 1 (COL3A1); and the predicted miRNA hsa-miR-29a-3p and hsa-miR-200c-3p of glucose-6-phosphatase catalytic subunit (G6PC). These genes may serve as potential biomarkers or specific targets in the treatment of DN-related RCC.
Conclusions
A significant correlation was identified between DN and RCC. The FN1, COL1A2, COL3A1, and G6PC genes could be novel biomarkers of DN-related RCC.
Keywords: Gene analysis, biomarkers, diabetic nephropathy (DN), renal cell carcinoma (RCC)
Introduction
Approximately 25% of people with diabetes develop renal complications. Diabetic nephropathy (DN), one of the major chronic complications of diabetes, has become the primary cause of end-stage kidney disease in the world (1,2). Statistics predict that the number of diabetic patients globally will reach 3.66 billion by the middle of the 21st century, with more than 100 million of them suffering from DN (3). Renal cell carcinoma (RCC) is a malignant genitourinary tumor accounting for 2% of adult cancers (4). The incidence and mortality of RCC increase at a rate of 2–3% each decade (5). However, the correlation between DN and RCC remains unclear and controversial.
According to existing epidemiological reports, diabetes can significantly increase the risk of malignant tumors, including pancreatic and liver cancers, as well as RCC (6-9). Habib et al. found that diabetic patients were more likely to develop RCC than healthy individuals, with 14% of diabetic patients suffering from RCC, which is 5 times higher than the rate among healthy people (10).
The incidence of RCC and diabetes is increasing. The elevated incidence of RCC, especially DN-associated RCC, should be afforded greater attention. In this study, we predicted the differentially expressed genes (DEGs) in RCC and DN, and performed a bioinformatics analysis on these co-expressed differential genes.
We present the following article in accordance with the MDAR reporting checklist (available at http://dx.doi.org/10.21037/tau-19-911).
Methods
Gene expression profile data
Our datasets were drawn from the Gene Expression Omnibus (GEO) repository (http://www.ncbi.nlm.nih.gov/geo/). The data platforms for GSE99339 are GPL19109 [HG-U133_Plus_2] Affymetrix Human Genome U133Plus 2.0 Array [CDF: Brainarray HGU133Plus2_Hs_ENTREZG_v18] and GPL19184 [HG-U133A] Affymetrix Human Genome U133A Array [Custom Brain] array v18 ENTREZG CDF]. The data platform for GSE96804 is GPL17586 [HTA-2_0] Affymetrix Human Transcriptome Array 2.0 [transcript (gene) version]. The data platform for GSE47183 is GPL1670AffymetrixHumanGenomeU133Plus2.0 Array [Hs133P_Hs_ENTREZG.Cd] GPL1463AffymetrixGeneChipHumanGenomeHGU133ACustomCDF [Affy_HGU133A_CDF_ENTREZG_10]. The data platform for GSE53757 is GPL570 [HG-U133_Plus_2] Affymetrix Human Genome U133 Plus 2.0 Array. The data platform for GSE15641 is GPL96 [HG-U133A] Affymetrix Human Genome U133A Array. The robust multi-array average (RMA) method was utilized to standardize and annotate the corresponding data.
All procedures performed in this study were in accordance with the Declaration of Helsinki (as revised in 2013) and approved by the Ethics Committee of the Shanghai Tenth People’s Hospital, School of Medicine in Tongji University (registration ID SHSY-IEC-4.0/19-47/01).
Statistical analysis
The ComBat of the sva packet of R language was used to correct two different chips. The differential genes of GSE99339, GSE96804, GSE53757, GSE15641, and GSE47183 were screened using the limma package of the R language. The standard that we selected was P<0.05, fold change >2 or <0.5. The interaction between genes was predicted using String V11.0, and the relationship between them was identified. The screening criterion was a combined score ≥0.4. The network map was visually constructed using the Cytoscape software (V3.5.1; http://cytos cape.org/). The genes are presented as points, while the relationship between the genes is represented by lines. The color depicts the size of degree, with a red color indicating a larger degree, and a yellow color indicating a smaller degree. The micro ribonucleic acids (miRNAs) of six genes that may be regulated were predicted using the miRNA Data Integration Portal (mirDIP) database and scored according to the prediction of each data set. The DIANA-MirPath v3 database was used to analyze the pathway and gene ontology (GO) enrichment of the miRNA predicted by each gene.
Identification the networks of DEGs
The protein-protein interaction (PPI) network of DN- and RCC-DEGs was predicted by string V11.0, and the relationship between them was obtained. The screening criterion was combined_score ≥0.4. And through the Cytoscape software (V3.5.1; http://cytos cape.org/) to visualize the construction of the network map, using dots to represent genes, and lines to represent the relationship between genes, where the color indicates the size of the degree, the color Reddish indicates that degree is larger, and yellowish indicates that degree is smaller.
Functional enrichment analysis
Kyoto Encyclopedia of Genes and Genomes (KEGG) and GO analysis used database to visually and comprehensively discover bioinformatics resources. We showed the biological process, molecular function and different biological functions of DN- and RCC-DEGs in REACTOME databases (v62; http://www.reactome) and DAVID (http://david.abcc.ncifcrf.gov/), respectively. DianamiRPath’s online tool (v3.0; http://www.microrna.gr/miRPa thv3) was used to evaluate the interaction between miRNA previously identified by predictive tools and the co-DEGs associated with DN and RCC.
Identification of co-DEGs between cancer and urogenital diseases
The Toxicogenomics database (http://ctdba se.org/) can be used to discover integrated gene-chemistry, gene-disease and chemical-disease interactions, then generate extended networks and estimate new associations. Then, these data were used to analyze the relationship between genes and kidney disease to determine the relationship and association or implicit association between these genes and diseases.
Results
Identification of DEGs
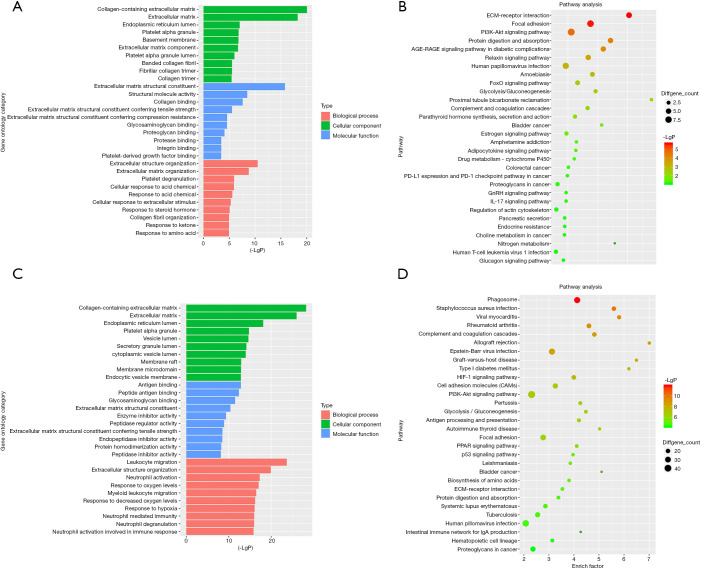
Firstly, the differential genes in DN were identified using the GSE99339, GSE96804, and GSE47183 datasets from the GEO database. For the GSE99339 dataset, the total number of probes was 10,947, of which the number of differential probes was 171 (up to 151 and down to 20). For the GSE96804 dataset, the total number of probes was 67,528, of which the number of differential probes was 2,012 (up to 1,552 and down to 460). For the GSE47183 dataset, the total number of probes was 11,961, of which the number of differential probes was 216 (up to 168 and down to 48). These three datasets were intersected and 53 intersecting genes were identified. Next, the pathway enrichment analysis was performed. We constructed a column of the function of significantly different genes, and the results are presented in Figure 1A. Figure 1B shows a bubble map depicting the significant differential gene pathways.
Figure 1.
GO analysis and KEGG pathway enrichment. (A) DN-related GO analysis for DEGs; (B) KEGG pathway of DN-related DEGs; (C) RCC-related GO analysis for DEGs; (D) KEGG pathway of RCC-related DEGs, and dot colors represent negative Log10(P values). GO, gene ontology; KEGG, Kyoto Encyclopedia of Genes and Genomes; DN, diabetic nephropathy; DEGs, differentially expressed genes; RCC, renal cell carcinoma.
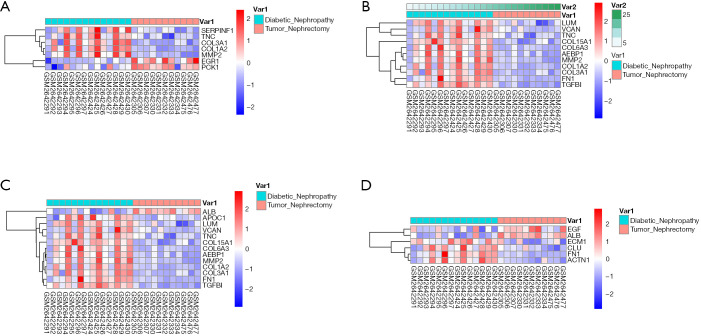
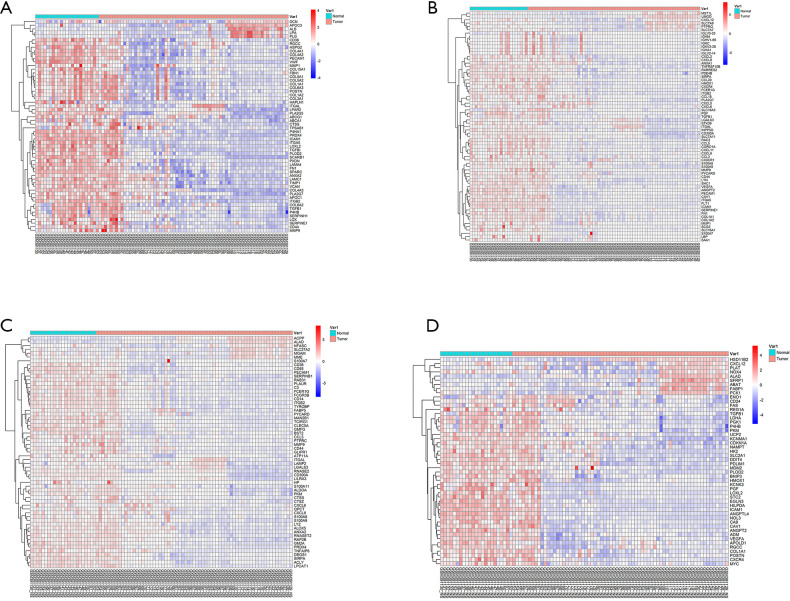
Second, the differential genes in RCC were identified using the GSE53757 and GSE15641 datasets from the GEO database. For the GSE53757 dataset, the total number of probes was 54,665, of which the number of differential probes was 6,585 (up to 3,641 and down to 2,944). For the GSE15641 dataset, the total number of probes was 22,272, of which the number of differential probes was 2,050 (up to 1,649 and down to 2,944). These two datasets were intersected and 679 intersecting genes were identified. And the results of pathway enrichment analysis are shown in Figure 1C,D. The top 4 enriched biological process GO terms (cellular response to acid chemical, extracellular matrix organization, extracellular structure organization, and platelet degranulation) for these genes of DN-datasets are shown in a heat map in Figure 2. The top 4 enriched biological process GO terms (extracellular structure organization, leukocyte migration, neutrophil activation, and response to oxygen levels) for these genes of RCC-datasets are represented in a heat map in Figure 3.
Figure 2.
Hierarchical clustering analysis of DN-related differentially expressed genes. (A) results of hierarchical clustering analysis for DEGs expression in relation to cellular response to acid chemical; (B) results of hierarchical clustering analysis for DEGs expression in relation to extracellular matrix organization; (C) results of hierarchical clustering analysis for DEGs expression in relation to extracellular structure organization; (D) results of hierarchical clustering analysis for DEGs expression in relation to platelet degranulation. Red, greater expression. Blue, less expression. DN, diabetic nephropathy; DEGs, differentially expressed genes.
Figure 3.
Hierarchical clustering analysis of RCC-related differentially expressed genes (DEGs). (A) Results of hierarchical clustering analysis for the expression of DEGs in relation to the organization of extracellular structure; (B) results of hierarchical clustering analysis for the expression of DEGs in relation to leukocyte migration; (C) results of hierarchical clustering analysis for the expression of DEGs in relation to neutrophil activation; (D) results of hierarchical clustering analysis for the expression of DEGs in relation to response to oxygen levels. Red, high expression; Blue, low expression. RCC, renal cell carcinoma.
PPI network and co-DEGs analysis
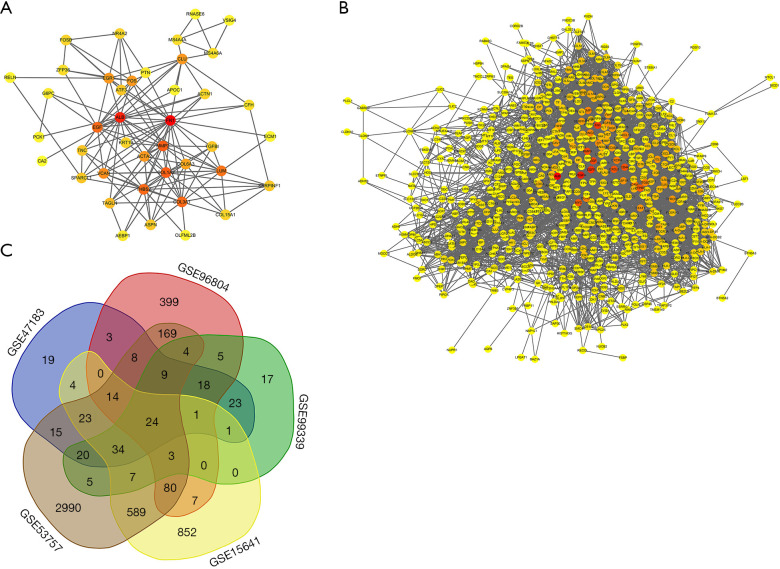
PPI between the 53 intersecting genes identified from the 3 DN datasets was predicted using String V11.0. We visualized the relationships between the genes by constructing a PPI network, as shown in Figure 4A. The results showed that FN1 (degree =23), albumin (ALB) (degree =20), COL1A2 (degree =15), and MMP2 (degree =15) were hub genes in DN (with the degree indicating the number of other genes that the gene interacts with). Then, the PPI network of the 679 intersecting genes identified from the 2 RCC datasets was constructed to visualize their relationships (Figure 4B). The hub genes in RCC included ALB (degree =159), vascular endothelial growth factor A (VEGFA, degree =139), epidermal growth factor receptor (EGFR, degree =127), and FN1 (degree =123).
Figure 4.
Protein-protein interaction (PPI) network analysis. (A) PPI network of DN-related DEGs; (B) PPI network of RCC-related DEGs. Red, greater degree; yellow, lesser degree; (C) Venn diagrams of DEGs. PPI network and Venn diagrams: (I) PPI networks of DEGs from A and B constructed using the String database (threshold >0.4); (II) Venn diagrams of DEGs related to DN and RCC, respectively. DN, diabetic nephropathy; DEGs, differentially expressed genes; RCC, renal cell carcinoma.
Subsequently, we performed a joint analysis to determine which genes are co-differentially expressed in DN and RCC. VENN software was used to intersect the DEGs identified from the DN and RCC datasets. Twenty-four genes were obtained, and these are visualized in a Venn diagram in Figure 4C. More information is provided in Table 1.
Table 1. 24 DEGs related to DN and RCC.
| Genes | Gene name | P value |
|---|---|---|
| ALB | Albumin | 3.82757E−06 |
| G6PC | Glucose-6-phosphatase catalytic subunit | 0.00022495 |
| EGF | Epidermal growth factor | 0.000414252 |
| PCK1 | Phosphoenolpyruvate carboxykinase 1 | 7.27637E−05 |
| ADH1B | Alcohol dehydrogenase 1B (class I), beta polypeptide | 0.004123934 |
| CLU | Clusterin | 0.002382186 |
| ARL4C | ADP ribosylation factor like GTPase 4C | 0.000208268 |
| COL15A1 | Collagen type XV alpha 1 chain | 1.32548E−06 |
| VSIG4 | V-set and immunoglobulin domain containing 4 | 0.000470776 |
| ACTN1 | Actinin alpha 1 | 0.000178285 |
| MS4A4A | Membrane spanning 4-domains A4A | 0.000178285 |
| RNASE6 | Ribonuclease A family member k6 | 0.000251524 |
| SPARCL1 | SPARC like 1 | 9.03479E−05 |
| OLFML2B | Olfactomedin like 2B | 0.020197939 |
| THBS2 | Thrombospondin 2 | 0.000178285 |
| APOC1 | Apolipoprotein C1 | 0.000178285 |
| COL1A2 | Collagen type I alpha 2 chain | 0.008832521 |
| COL6A3 | Collagen type VI alpha 3 chain | 0.000178285 |
| COL3A1 | Collagen type III alpha 1 chain | 0.000178285 |
| PLK2 | Polo like kinase 2 | 0.001742339 |
| FN1 | Fibronectin 1 | 0.002382186 |
| VCAN | Versican | 0.000208268 |
| KRT19 | Keratin 19 | 0.003055744 |
| TGFBI | Transforming growth factor beta induced | 0.006804421 |
DN, diabetic nephropathy; RCC, renal cell carcinoma; DEGs, differentially expressed genes.
Prediction of disease-related genes using the Comparative Toxicogenomics Database
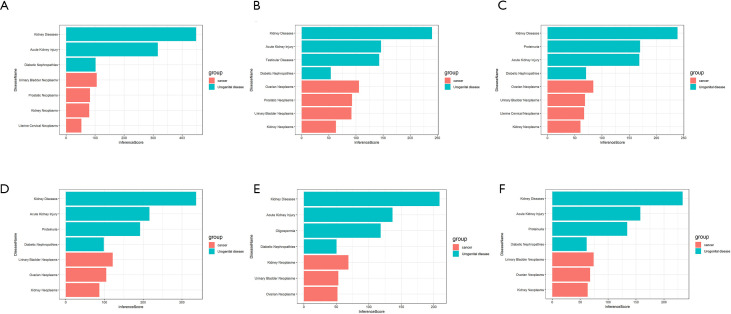
The Comparative Toxicogenomics Database (http://ctdbase.org/) was used to identify genes related to urogenital disease and cancer. Eleven genes were directly confirmed, and three genes [ALB, FN1, and transforming growth factor beta induced (TGFBI)] were confirmed to be related to DN. When the gene was scored more than 50 indirectly through the database, ALB, COL1A2, COL3A1, collagen type IV alpha 3 (COL6A3), FN1, G6PC, keratin 19 (KRT19), phosphoenolpyruvate carboxy kinase 1 (PCK1), polo like kinase 2 (PLK2), and TGFBI were found to be associated with RCC that these genes scored more than 50 indirectly. On the other hand, COL1A2, COL3A1, G6PC, and PCK1 were found through indirect prediction. Thus, we determined that ALB, FN1, COL1A2, COL3A1, G6PC, and PCK1 were related to DN and RCC. The related score of each gene in DN and RCC is shown in Figure 5.
Figure 5.
Relationship of urogenital disease and cancer related to co-expressed genes based on the Comparative Toxicogenomics Database (CTD). (A) The interactions of ALB in urogenital disease and cancer; (B) the interaction of COL1A2 in urogenital disease and cancer; (C) the interaction of COL3A1 in urogenital disease and cancer; (D) the interaction of FN1 in urogenital disease and cancer; (E) the interaction of G6PC in urogenital disease and cancer; (F) the interaction of PCK1 in urogenital disease and cancer.
Hub gene detection and validation
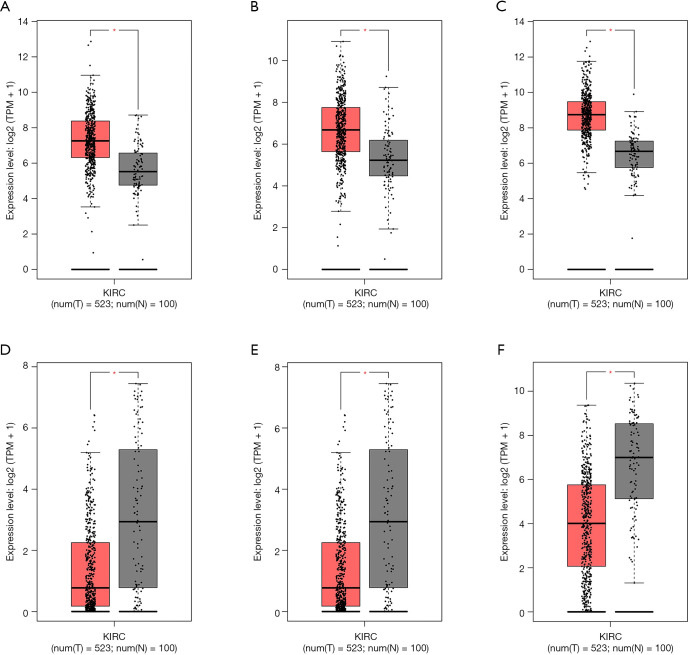
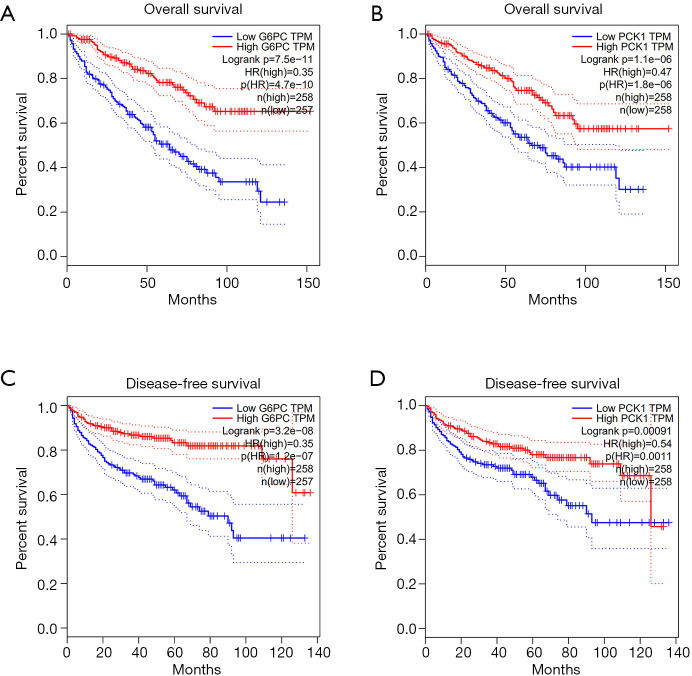
We predicted the differential expression analysis for hub genes in tumor tissue and normal tissue using the Gene Expression Profiling Interactive Analysis (GEPIA) database (Figure 6). COL1A2, COL3A1, and FN1 were significantly upregulated, while ALB, G6PC, and PCK1 were significantly downregulated, in RCC, compared with normal tissues (P<0.01). Among these genes, the expression levels of G6PC and PCK1 were significantly related to overall survival and disease-free survival in patients with RCC (Figure 7).
Figure 6.
Validation of the gene expression levels of hub genes between normal kidney and RCC tissues in the GEPIA database. (A) COL1A2 was significantly upregulated in RCC compared with normal tissues; (B) COL3A1 was significantly upregulated in RCC compared with normal tissues; (C) FN1 was significantly upregulated in RCC compared with normal tissues; (D) ALB was significantly downregulated in RCC compared with normal tissues; (E) G6PC was significantly downregulated in RCC compared with normal tissues; (F) PCK1 was significantly downregulated in RCC compared with normal tissues (P<0.01). The red * represents P<0.01. GEPIA, the Gene Expression Profiling Interactive Analysis; RCC, renal cell carcinoma; KIRC, kidney renal clear cell carcinoma.
Figure 7.
Overall survival and disease-free survival analysis of key genes in RCC (based on TCGA data in GEPIA). (A) The expression levels of G6PC were significantly associated with the overall survival of patients with RCC; (B) the expression levels of PCK1 were significantly associated with overall survival in patients with RCC; (C) the expression levels of G6PC were significantly associated with disease-free survival in patients with RCC; (D) the expression levels of PCK1 were associated with disease-free survival in patients with RCC (P<0.05).
Identification of pathways and functional enrichment
We predicted the miRNAs of six genes using the mirDIP database, and rated these miRNAs according to each data forecast. The top five miRNAs of each gene were determined. The pathway and GO enrichment analysis of these miRNAs predicted for each gene was then carried out using the DIANA-MirPath v3 database (Table 2). The miRNAs predicted for the genes were as follows: ALB (hsa-miR-496 and hsa-miR-141-3p); COL1A2 (hsa-miR-29c-3p, hsa-let-7b-5p, hsa-let-7c-5p, hsa-let-7f-5p, and hsa-miR-29a-3p); COL3A1 (hsa-miR-29c-3p, hsa-miR-29a-3p, hsa-miR-29b-3p, hsa-miR-98-5p, and hsa-let-7b-5p); FN1 (hsa-miR-200c-3p, sa-miR-200b-3p, hsa-miR-429, hsa-miR-199a-3p, and hsa-miR-144-3p); G6PC (hsa-miR-200c-3p, hsa-miR-429, hsa-miR-200b-3p, hsa-miR-3163, and hsa-miR-29a-3p); and PCK1 (hsa-miR-1297, hsa-miR-548m, hsa-miR-330-3p, hsa-miR-101-3p, and hsa-miR-3163). Finally, we predicted the differential expression of the top five miRNAs in tumor tissue and normal tissue using StarBase (a website for predicting the RNA interactions). Among the predicted miRNAs, the expression levels of hsa-miR-200b-3ph, hsa-miR-429, and hsa-miR-29c-3p were significantly decreased in RCC.
Table 2. The gene ontology (GO) terms and Kyoto Encyclopedia of Genes and Genomes (KEGG) pathways enrichment among predicted miRNAs and co-DEGs.
| Genes | Predicted miRNAs | Category | Function | P value |
|---|---|---|---|---|
| ALB | hsa-miR-496 | KEGG pathway | Steroid hormone biosynthesis | 5.27E−08 |
| hsa-miR-141-3p | Hippo signaling pathway | 2.02E−05 | ||
| Endocrine and other factor-regulated calcium reabsorption | 2.47E−05 | |||
| GO terms | Macromolecular complex assembly | 0.00030452 | ||
| Epidermal growth factor receptor signaling pathway | 0.000423173 | |||
| Post-translational protein modification | 0.000428322 | |||
| G2/M transition of mitotic cell cycle | 0.000515818 | |||
| Keratan sulfate biosynthetic process | 0.00053589 | |||
| Fc-epsilon receptor signaling pathway | 0.000720702 | |||
| Keratan sulfate metabolic process | 0.001811958 | |||
| Sulfur compound metabolic process | 0.001941431 | |||
| Phospholipid metabolic process | 0.005110673 | |||
| ECM-receptor interaction | 1.46E−48 | |||
| Mucin type O-glycan biosynthesis | 8.96E−09 | |||
| KEGG pathway | PI3K-Akt signaling pathway | 0.006961302 | ||
| TNF signaling pathway | 0.009107875 | |||
| Signaling pathways regulating pluripotency of stem cells | 0.009974988 | |||
| COL1A2 | hsa-miR-29c-3p | GO terms | Fc-epsilon receptor signaling pathway | 3.59E−17 |
| hsa-let-7b-5p | neurotrophin TRK receptor signaling pathway | 2.73E−15 | ||
| hsa-let-7c-5p | Extracellular matrix disassembly | 1.20E−12 | ||
| hsa-let-7f-5p | Post-translational protein modification | 3.56E−12 | ||
| hsa-miR-29a-3p | Extracellular matrix organization | 3.92E−09 | ||
| Nucleobase-containing compound catabolic process | 8.99E−09 | |||
| Platelet activation | 1.77E−08 | |||
| COL3A1 | hsa-miR-29c-3p | KEGG pathway | ECM-receptor interaction | 8.17E−49 |
| hsa-miR-29a-3p | Mucin type O-glycan biosynthesis | 7.54E−09 | ||
| hsa-miR-29b-3p | Focal adhesion | 0.001207023 | ||
| hsa-miR-98-5p | PI3K-Akt signaling pathway | 0.006207862 | ||
| hsa-let-7b-5p | GO terms | Fc-epsilon receptor signaling pathway | 4.44E−17 | |
| Neurotrophin TRK receptor signaling pathway | 3.49E−15 | |||
| Extracellular matrix disassembly | 1.42E−12 | |||
| Post-translational protein modification | 4.28E−12 | |||
| Cellular protein metabolic process | 1.98E−11 | |||
| FN1 | hsa-miR-200c-3p | KEGG pathway | Thyroid hormone signaling pathway | 0.024934027 |
| hsa-miR-200b-3p | Cysteine and methionine metabolism | 0.028989042 | ||
| hsa-miR-429 | Sphingolipid metabolism | 0.047606983 | ||
| hsa-miR-199a-3p | ErbB signaling pathway | 0.048121598 | ||
| hsa-miR-144-3p | GO terms | Toll-like receptor TLR1:TLR2 signaling pathway | 0.010695034 | |
| Toll-like receptor TLR6:TLR2 signaling pathway | 0.010695034 | |||
| Toll-like receptor 10 signaling pathway | 0.017791067 | |||
| G6PC | hsa-miR-200c-3p | KEGG pathway | ECM-receptor interaction | 1.62E−70 |
| hsa-miR-429 | Focal adhesion | 3.49E−05 | ||
| hsa-miR-200b-3p | PI3K-Akt signaling pathway | 0.000700807 | ||
| hsa-miR-3163 | Signaling pathways regulating pluripotency of stem cells | 0.001671859 | ||
| hsa-miR-29a-3p | GO terms | Cell death | 0.000888739 | |
| Fibroblast growth factor receptor signaling pathway | 0.001026574 | |||
| Cellular lipid metabolic process | 0.0010844 | |||
| MyD88-independent toll-like receptor signaling pathway | 0.001319258 | |||
| PCK1 | hsa-miR-1297 | KEGG pathway | Hippo signaling pathway | 0.000298106 |
| hsa-miR-548m | Thyroid hormone signaling pathway | 0.024032656 | ||
| hsa-miR-330-3p | Sphingolipid metabolism | 0.037579593 | ||
| hsa-miR-101-3p | Adherens junction | 0.037579593 | ||
| hsa-miR-3163 | GO terms | Cellular component disassembly involved in execution phase of apoptosis | 3.19E−05 | |
| Cell proliferation | 0.000266671 | |||
| Cellular protein metabolic process | 0.000394966 | |||
| Macromolecular complex assembly | 0.00042068 | |||
| Fc-epsilon receptor signaling pathway | 0.000562009 | |||
| Response to stress | 0.000562009 |
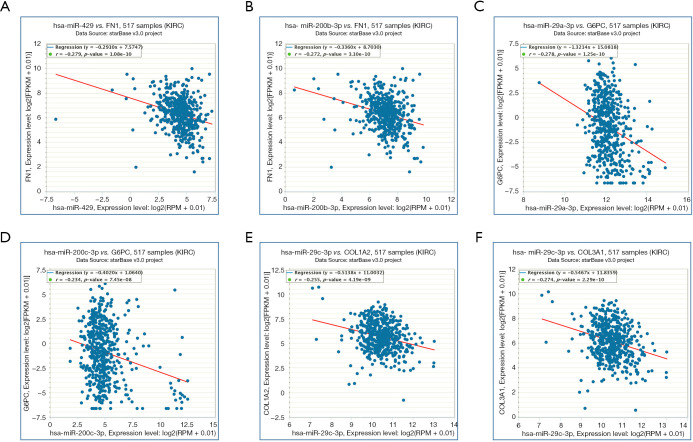
At the same time, we also carried out co-expression analysis for the miRNA-target interactions (Figure 8). FN1 (predicted miRNAs: hsa-miR-200b-3p and hsa-miR-429), COL1A2 (predicted miRNA: hsa-miR-29c-3p), COL3A1 (predicted miRNA: hsa-miR-29c-3p), and G6PC (predicted miRNAs: hsa-miR-29a-3p and hsa-miR-200c-3p) were associated with DN and RCC.
Figure 8.
Co-expression analysis for the miRNA-target interactions. (A) There is a significant negative correlation between hsa-miR-429 and FN1 with RCC; (B) there is a significant negative correlation between hsa-miR-200b-3p and FN1 with RCC; (C) there is a significant negative correlation between hsa-miR-29a-3p and G6PC with RCC; (D) there is a significant negative correlation between hsa-miR-200c-3p and G6PC with RCC; (E) there is a significant negative correlation between hsa-miR-29c-3p and COL1A2 with RCC; (F) there is a significant negative correlation between hsa-miR-29c-3p and COL3A1 with RCC (P<0.05).
Genetic alteration of hub genes
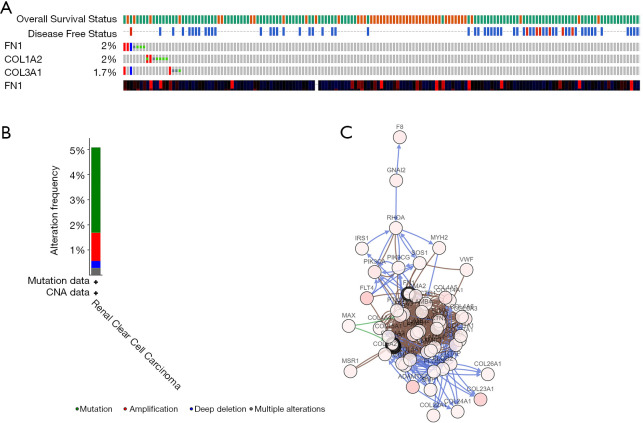
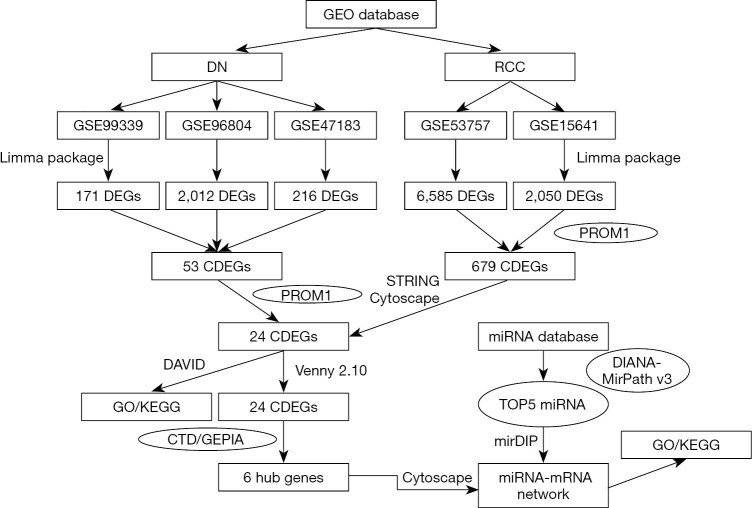
The alteration status of three key genes was analyzed using RCC patient data from The Cancer Genome Atlas (TCGA) of the cBioPortal for Cancer Genomics database. The frequency of alteration of each hub gene is shown in Figure 9A. FN1, COL1A2, and COL3A1 exhibited the most alteration (2%, 2%, and 1.7%, respectively), with amplification and messenger ribonucleic acid (mRNA) upregulation as the main types. The 3 hub genes were altered in 21 of 354 RCC patients (6%) (Figure 9B). Figure 9C shows the relationship of the 3 genes and the other 48 most frequently altered neighbor genes. FN1, COL1A2, and COL3A1 were significantly important in the network. Finally, we constructed a flow chart to summarize the all analysis process (Figure 10).
Figure 9.
Genetic alterations associated with 3 key genes. (A) A visual summary of genetic alterations (data from RCC in TCGA, provisional) shows the genetic alteration of 3 key genes which were altered in 21 (6%) of 354 RCC patients; (B) the total alteration frequency of 3 key genes is illustrated; (C) the network contains 51 nodes, including 3 key genes and the 50 most frequently altered neighbor genes. Relationship of 3 key genes is also illustrated.
Figure 10.
A flow chart for analysis. GO, gene ontology; KEGG, Kyoto Encyclopedia of Genes and Genomes; DN, diabetic nephropathy; RCC, renal cell carcinoma; CDEGs, co-expressed diferentially expressed genes; CTD, the Comparative Toxicogenomics Database; GEPIA, the Gene Expression Profiling Interactive Analysis.
Discussion
The incidence of renal cancer and diabetes occurring together is increasing. The elevated incidence of renal cancer, especially when it is associated with diabetes, should be of considerable concern. Although, due to a series of confounding factors, the relationship between DN and RCC may be unclear, these two diseases are clearly closely related. In clinical practice, early and careful screening of diabetic patients is needed to prevent the occurrence of RCC.
The DEGs from the DN and RCC datasets were respectively examined using functional and pathway enrichment analysis. The GO database can help us to gain a better understanding of the relationship between gene functions. The value of GO analysis lies in first identifying the most important function of the target gene and the main or non-main function of the same gene, then judging whether the research target is accurate in a larger number of samples. The GO analysis method annotates gene functions of differential genes using the GO database to obtain all the functions that the genes participate in. It then uses Fisher’s exact test and the multiple comparison test to calculate the significance level (P value) and false discovery rate (FDR) of each function. Thus, the significant functions performed by different genes can be screened, with a P value <0.05 considered statistically significant. A targeted map can then be established according to the P value sequence based on the significant function, the number of genes contained in the analysis results, and their enrichment degree in the database. The smaller the P value, the higher the level of functional significance.
By constructing the PPI network of DEGs, we can identify the action relationship between each gene in the network and other genes. We used String V11.0 to predict the interaction between genes, and the screening criterion was a combined score ≥0.4. Cytoscape software visualized the construction of the network map, using dots to represent genes and lines to represent the relationships between genes. The color depicted the size of the degree, with a red color indicating a larger degree, and a yellow color indicating a smaller degree. The degree refers to the number of genes associated with other genes; the larger the degree of a particular gene, the more genes that interact with it.
We also performed a joint analysis of DN and RCC. By building a network of DEGs, we were able to identify the relationship between each gene and other genes in the network. According to the intersection of the two diseases, we established a Venn diagram using VENN software to show the DEGs that were co-differentially expressed in DN and RCC. A total of 24 genes were obtained by intersecting the DEGs from the 3 DN datasets with those from the 2 RCC datasets. We predicted the differential expression analysis for hub genes in both tumor tissue and normal tissue. According to the PPI network data, we screened the top 6 genes from the 24 obtained. These genes scored the highest on all datasets. We found that ALB, FN1, COL1A2, COL3A1, G6PC, and PCK1 were associated with both DN and RCC.
ALB encodes serum ALB and acts on the colloid osmotic pressure of blood. To date, no study has explored the association between the hub gene of ALB and DN. ALB is downregulated in the tubulointerstitial tissue of patients with DN and may play a renal protective role in the prevention of diabetic tubulointerstitial injury (10). In tumor vascular endothelial cells, FN1 is highly expressed and promotes endothelial cell migration and angiogenesis (11,12). FN1 has been proven to potentially promote the progression of some tumors (13,14). Furthermore, some studies have shown that FN1 could play a critical role in promoting the invasion and metastasis of clear cell renal cell carcinoma (ccRCC) (15,16). The COL3A1 gene encodes the collagen found in extensible connective tissues. Su et al. found that LET-7d-COL3A1 acts through regulatory pathways in renal cell growth and metastasis. Let-7d inhibits the survival and proliferation of RCC by targeting chemokine (C-C motif) ligand 7 (CCL7) and COL3A1 (17).
At the same time, we also predicted the co-expression analysis for the miRNA-target interactions. We predicted the miRNAs and rated these miRNAs according to each data forecast. We found that FN1, with the predicted miRNAs hsa-miR-200b-3p and hsa-miR-429, was related to both DN and RCC. COL1A2 (predicted miRNA: hsa-miR-29c-3p), COL3A1 (predicted miRNA: hsa-miR-29c-3p), and G6PC (predicted miRNAs hsa-miR-29a-3p and hsa-miR-200c-3p) were also associated with DN and RCC. The expression levels of the predicted miRNA hsa-miR-200b-3p was significantly downregulated in RCC compared with normal tissues, and there was a significant negative correlation between hsa-miR-200b-3p and FN1 in RCC. The expression levels of the predicted miRNA hsa-miR-29c-3p were also significantly downregulated in RCC compared with normal tissues and exhibited a significant negative correlation with COL1A2 in RCC. Furthermore, the predicted miRNAs hsa-miR-29a-3p and hsa-miR-200c-3p were negatively correlated with G6PC.
The miRNA miR-200c-3p is involved in the tumorigenesis and progression of various cancers. Research has shown that the microR-200c-3p/ZEB2 loop plays a crucial role in prostate carcinoma tumor progression (18). Maolakuerban et al. found that miR-200c-3p inhibits cell migration and invasion of ccRCC by regulating the solute carrier family 6 member 1 (SLC6A1) gene (19). According to Li et al., miR-200c-3p suppresses the proliferative, migratory, and invasive capacities of nephroblastoma cells via targeting the fibroblast growth factor receptor substrate 2 (FRS2) gene (20). Also, miR-29a-3p has been reported to function as a tumor suppressor in several cancers. Zheng et al. found that downregulation of ribosomal protein S15a (RPS15A) by miR-29a-3p attenuated cell proliferation in colorectal carcinoma (21). Li et al. found that miR-200b-3p and miR-429-5p targeted the LIM domain kinase 1/cofilin 1 (LIMK1/CFL1) pathway to inhibit the growth and motility of breast cancer cells (22). Research has shown that miR-29c-3p regulates deoxyribonucleic acid (DNA)-methyltransferase 3 beta (DNMT3B) and large tumor suppressor kinase 1 (LATS1) methylation to inhibit tumor progression in hepatocellular carcinoma (23). Zhang et al. reported that miR-29c-3p regulates the biological function of colorectal cancer by targeting secreted protein acidic and cysteine rich (SPARC) (24). However, the biological functional role of miRNAs in RCC has not been well investigated. The expression of these genes needs to be verified in further well-designed studies. Although bioinformatics analyses have been performed, the specific molecular mechanisms have yet to be identified.
In conclusion, the predicted miRNAs of FN1 (hsa-miR-200b-3p and hsa-miR-429), COL1A2 (hsa-miR-29c-3p), COL3A1 (hsa-miR-29c-3p), and G6PC (hsa-miR-29a-3p and hsa-miR-200c-3p) may be potential biomarkers or specific targets for the treatment of DN-related RCC. DN has a clear relationship with RCC, and further research is required to determine the underlying mechanisms of this relationship.
Supplementary
The article’s supplementary files as
Acknowledgments
Funding: National Natural Science Foundation of China (81772705).
Ethical Statement: The authors are accountable for all aspects of the work in ensuring that questions related to the accuracy or integrity of any part of the work are appropriately investigated and resolved. All procedures performed in this study were in accordance with the Declaration of Helsinki (as revised in 2013) and approved by the Ethics Committee of the Shanghai Tenth People’s Hospital, School of Medicine in Tongji University (registration ID SHSY-IEC-4.0/19-47/01).
Footnotes
Reporting Checklist: The authors have completed the MDAR reporting checklist. Available at http://dx.doi.org/10.21037/tau-19-911
Conflicts of Interest: All authors have completed the ICMJE uniform disclosure form (available at http://dx.doi.org/10.21037/tau-19-911). The authors have no conflicts of interest to declare.
References
- 1.Saran R, Robinson B, Abbott KC, et al. US Renal Data System 2019 Annual Data Report: Epidemiology of Kidney Disease in the United States. Am J Kidney Dis 2020;75:A6-A7. 10.1053/j.ajkd.2019.09.003 [DOI] [PubMed] [Google Scholar]
- 2.de Boer IH, Caramori ML, Chan JCN, et al. Executive summary of the 2020 KDIGO Diabetes Management in CKD Guideline: evidence-based advances in monitoring and treatment. Kidney Int 2020;98:839-48. 10.1016/j.kint.2020.06.024 [DOI] [PubMed] [Google Scholar]
- 3.Reutens AT, Atkins RC. Epidemiology of Diabetic Nephropathy. In: Lai KN, Tang SCW. editors. Diabetes and the Kidney (Contributions to Nephrology Book 170). 1st edition. S. Karger, 2011:1-7. [DOI] [PubMed] [Google Scholar]
- 4.Labochka D, Moszczuk B, Kukwa W, et al. Mechanisms through which diabetes mellitus influences renal cell carcinoma development and treatment: A review of the literature. Int J Mol Med 2016;38:1887-94. 10.3892/ijmm.2016.2776 [DOI] [PubMed] [Google Scholar]
- 5.Solarek W, Czarnecka AM, Escudier B, et al. Insulin and IGFs in renal cancer risk and progression. Endocr Relat Cancer 2015;22:R253-R264. 10.1530/ERC-15-0135 [DOI] [PubMed] [Google Scholar]
- 6.Tseng CH. Type 2 Diabetes Mellitus and Kidney Cancer Risk: A Retrospective Cohort Analysis of the National Health Insurance. PLoS One 2015;10:e0142480. 10.1371/journal.pone.0142480 [DOI] [PMC free article] [PubMed] [Google Scholar]
- 7.Bosetti C, Rosato V, Polesel J, et al. Diabetes mellitus and cancer risk in a network of case-control studies. Nutr Cancer 2012;64:643-51. 10.1080/01635581.2012.676141 [DOI] [PubMed] [Google Scholar]
- 8.Larsson SC, Wolk A. Diabetes mellitus and incidence of kidney cancer: a meta-analysis of cohort studies. Diabetologia 2011;54:1013-8. 10.1007/s00125-011-2051-6 [DOI] [PubMed] [Google Scholar]
- 9.Mitri J, Castillo J, Pittas AG. Diabetes and risk of Non-Hodgkin's lymphoma: a meta-analysis of observational studies. Diabetes Care 2008;31:2391-7. 10.2337/dc08-1034 [DOI] [PMC free article] [PubMed] [Google Scholar]
- 10.Habib SL, Prihoda TJ, Luna M, et al. Diabetes and risk of renal cell carcinoma. J Cancer 2012;3:42-8. 10.7150/jca.3718 [DOI] [PMC free article] [PubMed] [Google Scholar]
- 11.Zeng M, Liu J, Yang W, et al. Multiple-microarray analysis for identification of hub genes involved in tubulointerstial injury in diabetic nephropathy. J Cell Physiol 2019. [Epub ahead of print]. doi: . 10.1002/jcp.28313 [DOI] [PubMed] [Google Scholar]
- 12.Di Maio M, Daniele B, Gallo C, et al. Re: Design and Endpoints of Clinical Trials in Hepatocellular Carcinoma. J Natl Cancer Inst 2008;100: 1557; author reply 1557-8. 10.1093/jnci/djn342 [DOI] [PubMed] [Google Scholar]
- 13.Wijelath ES, Rahman S, Murray J, et al. Fibronectin promotes VEGF-induced CD34 cell differentiation into endothelial cells. J Vasc Surg 2004;39:655-60. 10.1016/j.jvs.2003.10.042 [DOI] [PubMed] [Google Scholar]
- 14.Takayasu H, Horie H, Hiyama E, et al. Frequent deletions and mutations of the beta-catenin gene are associated with overexpression of cyclin D1 and fibronectin and poorly differentiated histology in childhood hepatoblastoma. Clin Cancer Res 2001;7:901-8. [PubMed] [Google Scholar]
- 15.Qian P, Zuo Z, Wu Z, et al. Pivotal role of reduced let-7g expression in breast cancer invasion and metastasis. Cancer Res 2011;71:6463-74. 10.1158/0008-5472.CAN-11-1322 [DOI] [PubMed] [Google Scholar]
- 16.Tapper J, Kettunen E, El-Rifai W, et al. Changes in gene expression during progression of ovarian carcinoma. Cancer Genet Cytogenet 2001;128:1-6. 10.1016/S0165-4608(01)00386-7 [DOI] [PubMed] [Google Scholar]
- 17.Su B, Zhao W, Shi B, et al. Let-7d suppresses growth, metastasis, and tumor macrophage infiltration in renal cell carcinoma by targeting COL3A1 and CCL7. Mol Cancer 2014;13:206. 10.1186/1476-4598-13-206 [DOI] [PMC free article] [PubMed] [Google Scholar]
- 18.Zhang J, Zhang H, Qin Y, et al. MicroRNA-200c-3p/ZEB2 loop plays a crucial role in the tumor progression of prostate carcinoma. Ann Transl Med 2019;7:141. 10.21037/atm.2019.02.40 [DOI] [PMC free article] [PubMed] [Google Scholar]
- 19.Maolakuerban N, Azhati B, Tusong H, et al. MiR-200c-3p inhibits cell migration and invasion of clear cell renal cell carcinoma via regulating SLC6A1. Cancer Biol Ther 2018;19:282-91. 10.1080/15384047.2017.1394551 [DOI] [PMC free article] [PubMed] [Google Scholar]
- 20.Li T, Zhao P, Li Z, et al. miR-200c-3p Suppresses the Proliferative, Migratory, and Invasive Capacities of Nephroblastoma Cells via Targeting FRS2. Biopreserv Biobank 2019;17:444-51. 10.1089/bio.2019.0009 [DOI] [PubMed] [Google Scholar]
- 21.Zheng Z, Cui H, Wang Y, et al. Downregulation of RPS15A by miR-29a-3p attenuates cell proliferation in colorectal carcinoma. Biosci Biotechnol Biochem 2019;83:2057-64. 10.1080/09168451.2019.1637712 [DOI] [PubMed] [Google Scholar]
- 22.Li D, Wang H, Song H, et al. The microRNAs miR-200b-3p and miR-429-5p target the LIMK1/CFL1 pathway to inhibit growth and motility of breast cancer cells. Oncotarget 2017;8:85276-89. 10.18632/oncotarget.19205 [DOI] [PMC free article] [PubMed] [Google Scholar]
- 23.Wu H, Zhang W, Wu Z, et al. miR-29c-3p regulates DNMT3B and LATS1 methylation to inhibit tumor progression in hepatocellular carcinoma. Cell Death Dis 2019;10:48. 10.1038/s41419-018-1281-7 [DOI] [PMC free article] [PubMed] [Google Scholar]
- 24.Zhang S, Jin J, Tian X, Wu L. hsa-miR-29c-3p regulates biological function of colorectal cancer by targeting SPARC. Oncotarget 2017;8:104508-24. 10.18632/oncotarget.22356 [DOI] [PMC free article] [PubMed] [Google Scholar]
Associated Data
This section collects any data citations, data availability statements, or supplementary materials included in this article.
Supplementary Materials
The article’s supplementary files as


