Abstract
High-pressure water injection, as an important measure for coal and gas outburst prevention, is still under-researched, especially its mechanism on the coal pore structure. The anthracite samples taken from no. 3 coal seam in Xinjing coal mine were dried and injected with high-pressure water, after which their pore characteristics were studied by using mercury porosimetry (MP) and low-pressure N2 gas adsorption (LP-N2GA). The results of MP showed that after the water was injected into the coal samples, the pore volume and the pore size of samples increased, but the specific surface area (SSA) remained almost unchanged. It could be concluded from LP-N2GA experiments that after the high-pressure water injection, the SSA of coal samples reduced greatly, but their pore size increased significantly. Through detailed analysis, the mechanism of high-pressure water injection on the coal pore structure is described as follows: the pores within the samples fracture after high-pressure water injection and the diameter of pores becomes bigger, resulting in increases in both the pore volume and the pore size. In addition, water molecules injected will stay at the end of micropores, so there is almost no change in the SSA, as indicated by MP testing results. However, the SSA of coal samples decreased significantly in the LP-N2GA testing. This is because it is really difficult to evaporate water molecules staying in the micropores by heating because of the strong interaction between water and coal. This study is helpful to further understand the mechanism of high-pressure water injection on preventing coal and gas outburst at the microlevel.
1. Introduction
With the increase in mining depth of underground coal mine year by year, coal and gas outburst has become a severe problem, plaguing many underground coal mines, which poses a great threat to health and lives of miners and significantly affects the safe and efficient production.1 Coal seam water injection can be used as a positive measure for regionally or locally preventing and controlling coal and gas outburst in China, and effective dust mitigation can also be obtained.2 On the basis of water injection, a variety of hydraulic measures are available for outburst control, such as hydraulic punching, hydraulic fracturing, hydraulic cutting, hydraulic extrusion, and hydraulic loosening. As the high-pressure water is utilized as the working medium in all the measures mentioned above, the interaction between the high-pressure water and coal body occurs. At the macrolevel, the antioutburst mechanism of high-pressure water injection into coal seam has been well studied, which includes fracturing the coal body, reducing the peak stress concentration, and pushing the peak stress to deeper place.3 However, at the microlevel, there is a lack of research in this area, which is significant and helpful for a clearer understanding of the antioutburst mechanism of high-pressure water injection.
It is known that coal is a kind of a porous medium with pores and fractures.4 Studies have shown that the pore structure has an important effect upon gas adsorption and gas transport through the coal matrix.5−7 Gan et al. classified total pore volumes into micropores (0.4–1.2 nm), transitional pores (1.2–30 nm), and macropores (30–2960 nm).8 The IUPAC categorized pores into macropores (greater than 50 nm), transitional pores (2.0–50 nm), micropores (1.5–2.0 nm), and ultramicropores (less than 1.5 nm).9 The classification method proposed by B. B. Hodot is widely used in China, which classifies the coal space into fractures (more than 105 nm) and pores (less than 105 nm) and further categorizes pores into large pores (greater than l000 nm), mesopores (100–1000 nm), transitional pores (10–100 nm), and micropores (less than 10 nm).1,10 Pan et al. studied the effects of matrix moisture on gas diffusion and flow in coal and drew a conclusion that moisture in the coal matrix had a significant impact on gas adsorption capacity and played a key role in desorption and migration of gas.10 Nie et al. investigated the influence of coal rank on the pore structure with low-pressure N2 gas adsorption (LP-N2GA) and scanning electron microscopy.11 Liu et al. researched the impact of the pore structure on gas adsorption and diffusion dynamics for long-flame coal.12 Wang et al. probed into the pore structure characteristics of low- and medium-rank coals and their differential adsorption and desorption effects.13 Su et al. carried out the laboratory study on changes in the pore structure and gas desorption properties of both intact and tectonic coals after supercritical CO2 treatment.14 A detailed investigation into the effects of the pore structure and methane adsorption in coal with alkaline treatment was conducted by Zhou et al.15 Wang et al. focused on changes in the coal pore structure and permeability during N2 injection.16
Although pore structures of dried coal samples have been studied in detail, there are few literature studies revealing the difference in the pore structure of coal before and after high-pressure water injection.17−19 Therefore, this paper focuses on the change in the coal pore structure by using mercury porosimetry (MP) and LP-N2GA when high-pressure water was injected into the coal samples. The study lays a theoretical foundation for a thorough understanding of the antioutburst mechanism of high-pressure water injection from the microlevel.
2. Results and Discussion
2.1. Test Results and Discussion of MP
2.1.1. Test Results of MP
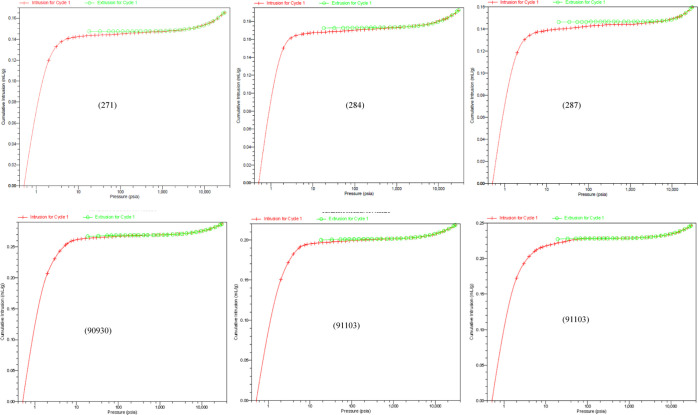
The corresponding mercury intrusion and extrusion curves are shown in Figure 1. It can be seen that the curves are similar to each other.
Figure 1.
Cumulative intrusion and extrusion vs pressure in MP.
2.1.2. Discussion of MP Results
2.1.2.1. Comparative Analysis of Pore Characteristics
Based on the experimental data, a comparison of the pore characteristic parameters is shown in Table 1. It can be seen that the pore volume, average pore size, and porosity increased by 45.17, 48.88, and 46.26%, respectively, after high-pressure water injection, but the specific surface area (SSA) decreased by 2.42%. It was obvious that almost all parameters have increased greatly except the SSA, which indicated that high-pressure water injection has significantly changed the pore structure of coal samples.
Table 1. Test Results of Pore Size Distribution.
| sample category | sample number | specific pore volume (cm3/g) | SSA (m2/g) | average pore size (nm) | porosity (%) | water injection pressure (MPa) |
|---|---|---|---|---|---|---|
| dried | 271 | 0.1653 | 5.806 | 113.9 | 17.3957 | 0 |
| 284 | 0.1925 | 6.264 | 122.9 | 19.5298 | 0 | |
| 287 | 0.1598 | 5.298 | 120.6 | 18.0892 | 0 | |
| average | 0.17253 | 5.7893 | 119.1 | 18.3382 | 0 | |
| water injected | 90930 | 0.2869 | 5.619 | 204.2 | 26.4863 | 10 |
| 91011 | 0.2184 | 5.539 | 157.8 | 21.8503 | 10 | |
| 91103 | 0.2461 | 5.789 | 170.1 | 32.1284 | 10 | |
| average | 0.25047 | 5.64900 | 177.4 | 26.8217 | ||
| increase ratio (%) | 45.17 | –2.42 | 48.88 | 46.26 | ||
However, there is a marginal change in the SSA. It could be inferred that high-pressure water injection mainly affects the number of large pores and has a minor impact on micropores, which is consistent with the previous understanding: high-pressure water injection has a significant influence on the mechanical properties of coal bodies and promotes the evolution of fractures in coal bodies. It is this positive effect that is used in hydraulic fracturing and hydraulic loosening prevention measures to increase the permeability of coal bodies.
2.1.2.2. Changes of Pore Volume Distribution
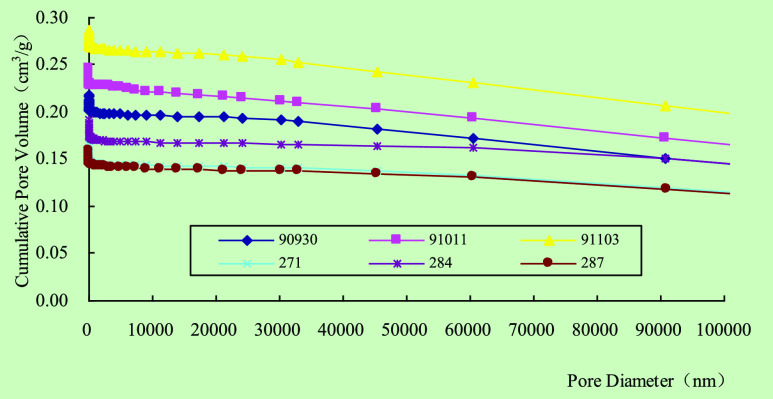
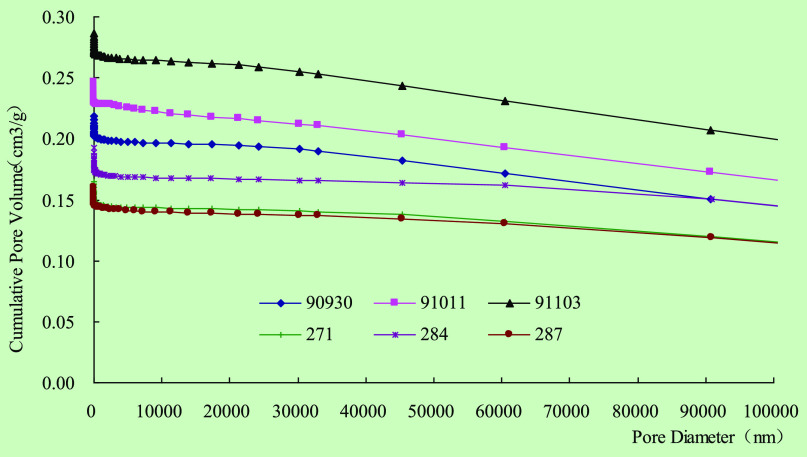
It is shown in Figure 2 that the relationship between the cumulative pore volume and pore diameter shows the similar trend for different coal samples. However, both the cumulative pore volume and curve slope for water-injected coal samples are bigger than those of dried coal samples, which indicated that new pores have been created after water injection.
Figure 2.
Cumulative pore volume vs the pore diameter.
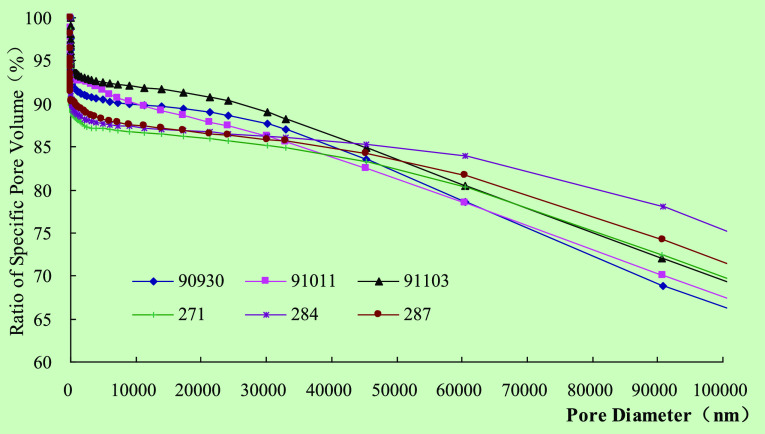
It is noted from Figure 3 that the ratio of the specific pore volume (RSPV) for pores with diameters higher than 105 and 103 nm exceeds 65 and 85%, respectively, and that less than 15% of pores have diameters ranging from 0 to 103 nm, which indicates that the pore volume mainly depends on large pores and fractures. It showed that the curves of different coal samples intersect at areas where pore diameters were around 40,000 nm. The RSPV of water-injected coal samples is higher than that of dried coal samples when the pore diameter is less than 40,000 nm, illustrating that high-pressure water injection increases the RSPV of pores with diameters smaller than 40,000 nm.
Figure 3.
Ratio of the pore volume vs pore diameter.
2.1.2.3. SSA Distribution
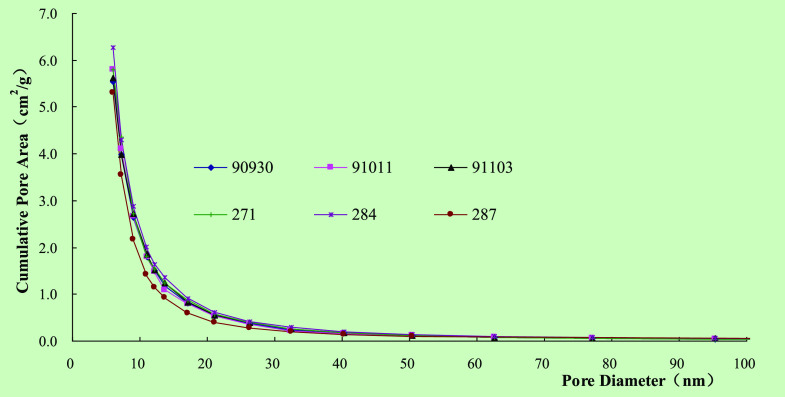
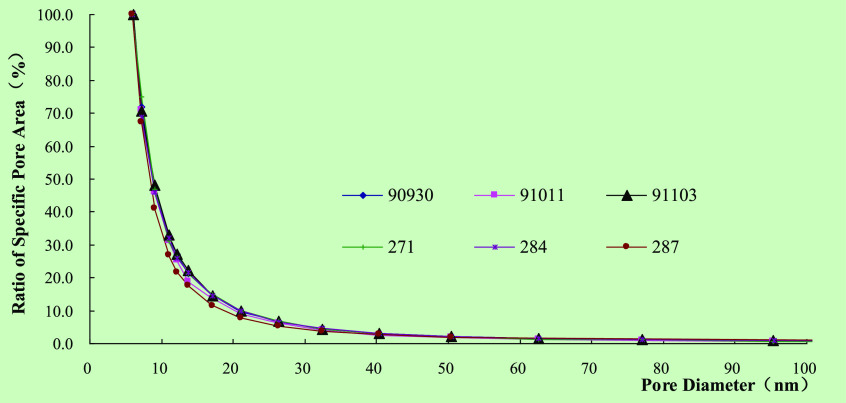
It is apparent from Figure 4 that the relationship between the cumulative pore area and pore diameter is similar for coal samples dried and those injected with high-pressure water. In terms of the ratio of the SSA, it can be obtained from Figure 5 that Yangquan no. 3 coal is dominated by micropores (less than 10 nm), contributing more than 70% to the total SSA. It is consistent with the fact that Yangquan no. 3 coal seam has a bigger methane content than other coal seems, as micropores are the main channels for gas adsorption.
Figure 4.
Cumulative SSA vs pore diameter.
Figure 5.
Ratio of the SSA vs pore diameter.
2.1.2.4. Analysis of Conditions for Occurrence of the Inhibitory Desorption Effect
It can be concluded from MP testing that Yangquan no. 3 coal seam has the innate favorable conditions for water injection for the purpose of preventing gas outburst. In terms of pore volume, fractures and large pores are relatively developed, which provide channels for water movement during injection; with regard to the SSA, micropores are mainly developed, which provide space for water to stay in the coal body. The water molecules existing in micropores will hinder the gas movement caused by capillary force, so the gas desorption within the coal is suppressed, which is beneficial to prevent gas outburst because the initial gas rate is reduced, as described in the literature.2
2.2. Test Results and Discussion of LP-N2GA
2.2.1. Test Result of LP-N2GA
The isothermal adsorption–desorption curves for N2 within different coal samples are shown in Figure 6. It can be seen that the curves of water-injected coal samples are similar to that of the dried coal sample, but both the N2 adsorption volume and desorption hysteresis are decreased.
Figure 6.
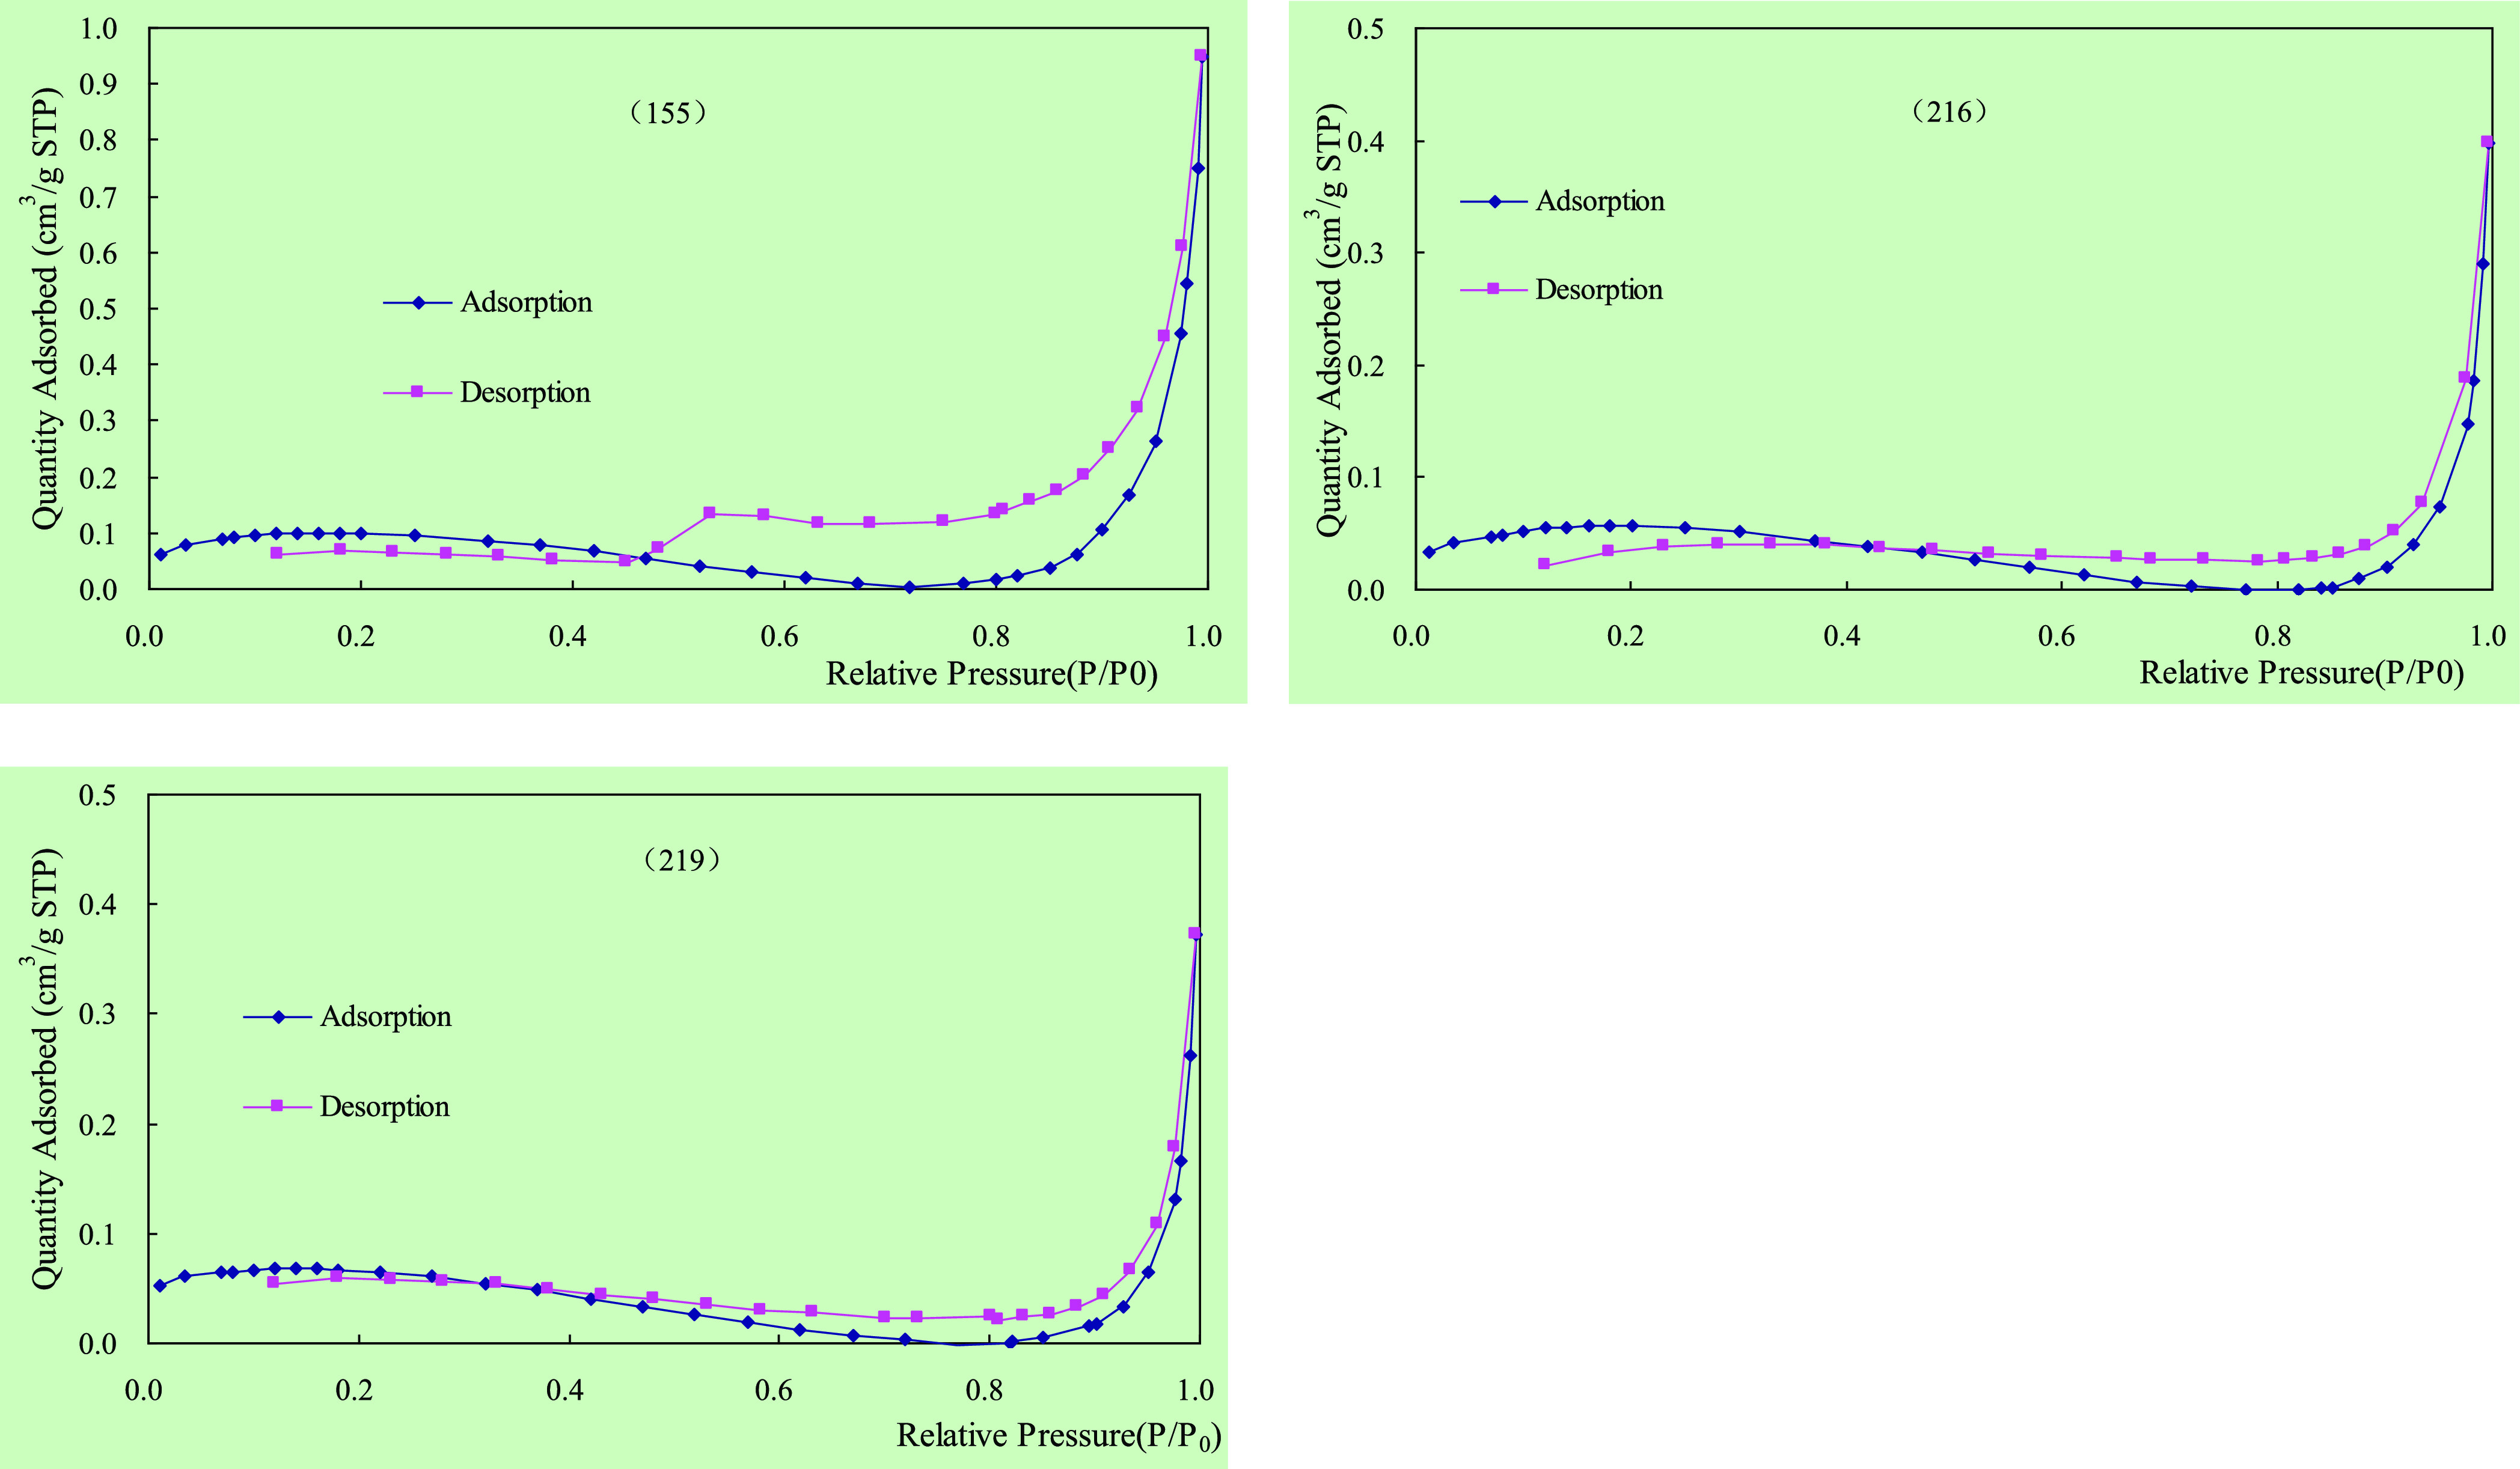
LP-N2GA isotherm of coal samples.
2.2.2. Discussion of LP-N2GA Results
2.2.2.1. Changes in Pore Structure Parameters
The test results of LP-N2GA are listed in Table 2. It can be observed that the coal samples treated by using three different methods, Brunauer–Emmett–Teller (BET) surface area, Langmuir surface area, and Barrett–Joyner–Halenda (BJH) adsorption cumulative surface area, reduced by 63.58, 65.39, and 71.12%, respectively, and the BJH adsorption cumulative volume dropped by 61.39%. However, the adsorption average pore width and BJH adsorption average pore diameter increased by 19.94 and 33.04%, respectively.
Table 2. Test Results of LP-N2GA Analysis.
| sample category | sample number | BET surface area (m2/g) | Langmuir surface area (m2/g) | BJH adsorption cumulative surface area (m2/g) | BJH adsorption cumulative volume (cm3/g) | adsorption average pore width (nm) | BJH adsorption average pore diameter (nm) | water injection pressure (MPa) |
|---|---|---|---|---|---|---|---|---|
| dried | 155 | 0.3889 | 0.4551 | 0.116 | 0.001374 | 17.22510 | 47.5223 | 0 |
| water injected | 216 | 0.1731 | 0.2059 | 0.035 | 0.000548 | 16.14507 | 62.5320 | 8 |
| 219 | 0.1102 | 0.1091 | 0.032 | 0.000513 | 25.17621 | 63.9168 | 8 | |
| Average | 0.14165 | 0.1575 | 0.0335 | 0.000531 | 20.66064 | 63.2244 | ||
| increase ratio (%) | –63.58 | –65.39 | –71.12 | –61.39 | 19.94 | 33.04 | ||
Both the pore volume and SSA reduced dramatically, but the pore diameter rose significantly. Through analysis, it is concluded that this contradictory phenomenon is caused by the following reasons: although the tested coal samples were all predried, studies have shown that it is difficult to completely evaporate all the adsorbed water molecules, so water molecules may occupy the adsorption sites, thereby reducing the effective adsorption site of N2 gas.
2.2.2.2. Changes of Pore Volume Distribution
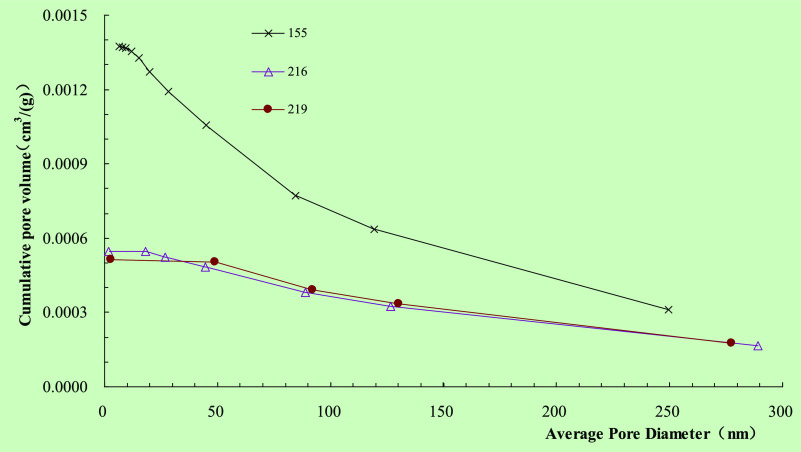
Figure 7 demonstrates that the cumulative pore volume greatly reduced when high-pressure water is injected into coal samples. The increment of the cumulative pore volume of water-injected coal samples is much less than that of the dried coal sample. The phenomena of water staying on the adsorption sites can also be seen in Figure 7. More specially, the cumulative pore volume of the dried coal sample (155) increases with the decrease in pore diameter, while the cumulative pore volume of water-injected samples [(216) and (219)] remains almost unchanged when the pore diameter is less than 20 nm for sample 216 and 50 nm for sample 219.
Figure 7.
Cumulative pore volume vs pore diameter.
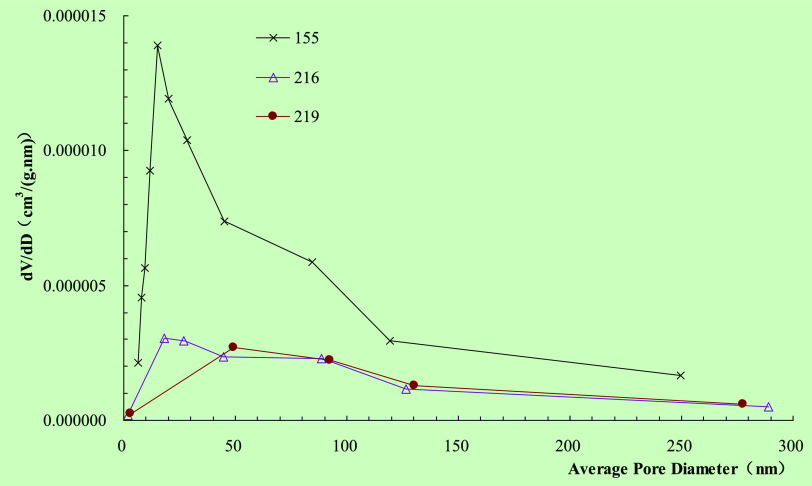
The value of dV/dD reduced drastically after high-pressure water injection, and the peak values for samples 155, 216, and 219 can be obtained when the average pore diameters are 15.1, 18.2, and 49.1 nm, respectively (Figure 8), which indicates that the pore diameter of the peak value dV/dD increased after water injection.
Figure 8.
Adsorption dV/dD vs average pore diameter.
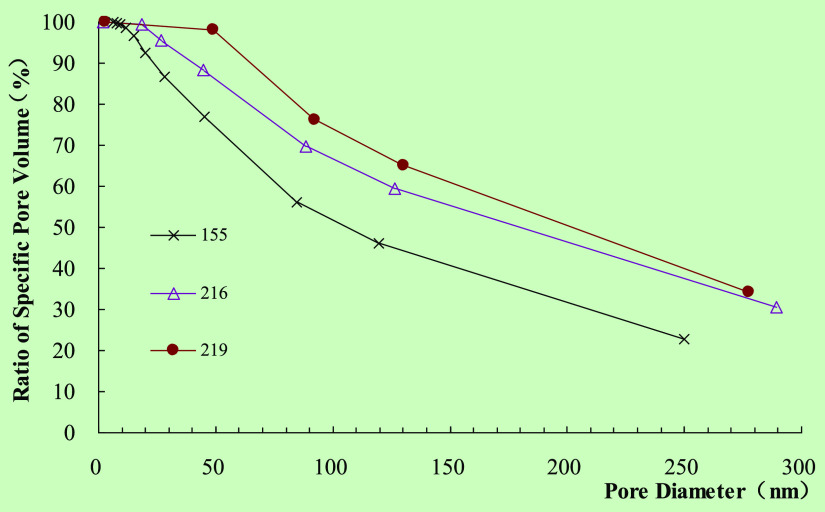
The relationship between the RSPV and pore diameter (below 300 nm) is plotted in Figure 9. It can be seen that in comparison with dried sample 155, the ratio of RSPV generally increased for water-injected samples under the condition of the same pore diameter. The RSPV remains unchanged when the pore diameter decreases to a certain value for water-injected samples, which indicates that the RSPV of the micropore volume (≤50 nm) of the water-injected coal sample is smaller than that of the dried coal sample.
Figure 9.
RSPV vs pore diameter.
2.2.2.3. Changes of Pore Area Distribution
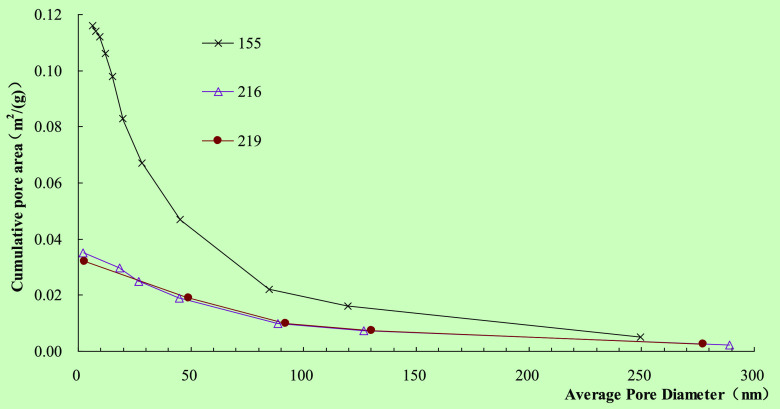
The relationship between the cumulative pore area and pore diameter (below 300 nm) is plotted in Figure 10. The cumulative pore area reduced greatly after high-pressure water is injected into samples, and the difference in the cumulative pore area between the dried coal sample and water-injected coal samples rises with the decrease in pore diameter, which reveals that water molecules occupy the adsorption sites and reduce the adsorption spots after water injection.
Figure 10.
Cumulative pore area vs pore diameter.
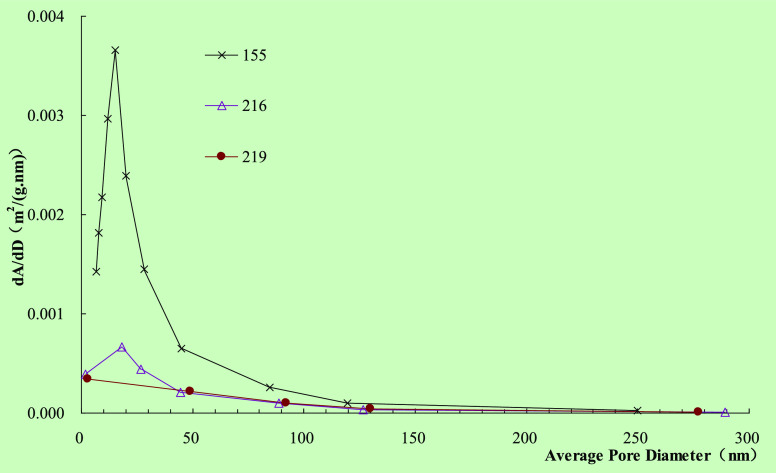
As illustrated in Figure 11, the value of dA/dD decreased significantly after high-pressure water injection. Samples 155 and 216 reach a peak value of dA/dD when the pore diameters are 15.1 and 18.2 nm, respectively. In comparison with dried sample 155, the pore diameter of the peak value dA/dD has a tendency to increase after water injection.
Figure 11.
Adsorption dA/dD vs pore diameter.
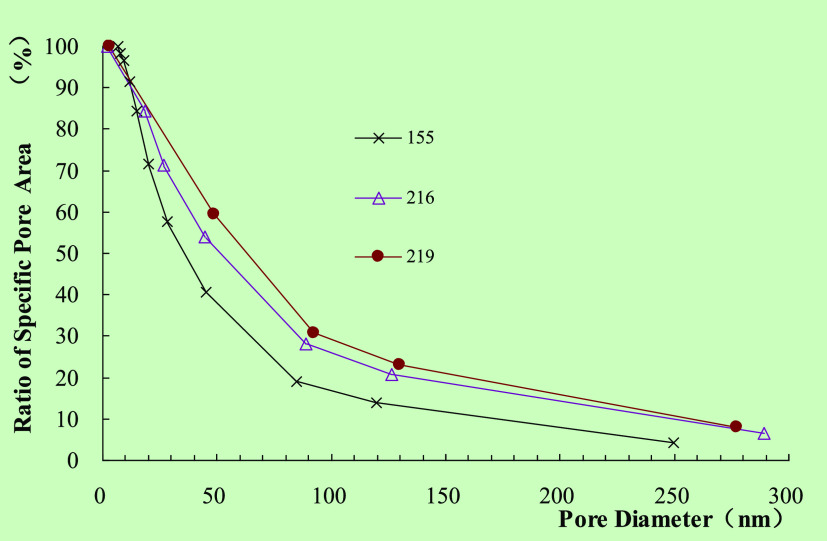
Figure 12 depicts that the RSPV for water-injected samples is higher than that of the dried coal sample when the pore diameter is greater than 11.9 nm, indicating that pores with diameters larger than 11.9 nm occupy a larger proportion of total pores after water injection.
Figure 12.
Ratio of the specific pore area vs pore diameter.
3. Mechanism of High-Pressure Water Injection on the Coal Pore Structure
With the help of MP and LP-N2GA, the influence of high-pressure water injection on the pore structure of anthracite coal seam has been studied, and the mechanism of high-pressure water injection on the coal pore structure is obtained at the microlevel.
It is known from MP testing that in comparison with the samples dried only, the pore volume and pore size increase, but the SSA is basically unchanged for samples treated by high-pressure water injection. From the curves of the cumulative pore volume, both the pore volume and curve slope of water-injected coal samples are bigger than those of dried coal samples, which indicates that new pores have been created after water injection. The RSPV of water-injected coal samples is higher than those of dried coal samples when the pore diameter is less than 40,000 nm, indicating that high-pressure water injection increases the number of pores with a diameter below 40,000 nm. From the curves of the cumulative SSA, it indicates that Yangquan no. 3 coal is dominated by micropores (less than 10 nm), occupying more than 70% of the total SSA, meaning that the no. 3 coal seam has the favorable innate conditions for water injection to prevent gas outburst: in terms of pore volume, fractures and large pores are relatively developed, which provide channels for water movement during water injection; when it comes to the SSA, micropores are mainly developed, which provide space for water to retain in the coal body. The water retained in micropores will hinder the gas movement and suppress the gas desorption, which is beneficial for coal outburst control and prevention.
It can be obtained from the LP-N2GA experiment that reduction of the SSA exceeds 60%, but the pore size increases significantly after high-pressure water is injected into coal samples. It is inferred that this contradictory phenomenon is caused by the following reasons: although the tested coal samples were all predried for 4 h, it is difficult to evaporate all the water molecules that retain in the micropores by heating due to the strong interaction between water and coal. Water molecules will occupy the adsorption sites, thereby reducing the effective adsorption sites of N2 gas. The cumulative pore volume of dried coal samples rises with the decrease of pore diameter, but it remains almost unchanged when the diameter is less than 20 nm for water-injected coal samples, which indicates that water molecules stay on adsorption sites. The pore diameters corresponding to the peak value of dV/dD and the peak value of dA/dD increase after water injection, which means that water molecules occupy the micropores. The RSPV of water-injected samples is higher than that of dried coal samples when the pore diameter is greater than 11.9 nm, which indicates that pores with diameters greater than 11.9 nm occupy a larger proportion of total pores after water injection.
From the above-mentioned analysis, the mechanism of high-pressure water injection on the coal pore structure is revealed and described as follows: the pores within the coal samples fracture under the effect of high-pressure water injection and pore diameters become bigger, which further result in increases in pore volume and pore size; Yangquan no. 3 coal is dominated by micropores (less than 10 nm) which occupy more than 70% of the total SSA; as a result, there is a negligible difference in the SSA obtained by MP testing. In addition, it can be seen from the LP-N2GA experiment that both the SSA and pore volume reduce, but the pore size rises. The reason for the results is that water molecules stay in the micropores and they are difficult to be evaporated by heating due to the strong interaction between water and coal. According to the distributions of the pore volume and pore area, it can be concluded that the pore diameter has a tendency to increase.
Therefore, high-pressure water injection promotes further development of pores at the microlevel, but the residual of moisture still occupies some micropores for a long time, which is mainly determined by the microscopic force strength of water and coal.
4. Experimental Section
4.1. Sample Location and Preparation
The anthracite collected from no. 3 coal seam in Xinjing coal mine in Yangquan, Shanxi, China, was chosen for this study. The freshly exposed bulk coal was taken from a mining face and crushed by hand, after which it was sieved by using a screen with mesh diameters of 3, 1 mm, 60 (0.250 mm), and 80 (0.170 mm) successively. The coal particles with diameters ranging from 1 to 3 mm were utilized in MP testing, while the coal particles with diameters ranging from 60 to 80 mesh were chosen for LP-N2GA experiments and for proximate analysis on the basis of Chinese national standards GB/T212-2008 and GB/T217-2008. The results are listed in Table 3, which includes moisture (Mad), ash (Aad), volatile (Vdaf), apparent relative density (ARD), true relative density (TRD), and porosity.
Table 3. Physical Parameters of the Coal Sample.
| coal mine | coal seam | Mad (%) | Aad (%) | Vdaf (%) | ARD (g/cm3) | TRD (g/cm3) | porosity (%) |
|---|---|---|---|---|---|---|---|
| Xinjing | no. 3 | 1.76 | 5.6 | 6.81 | 1.36 | 1.52 | 10.53 |
After preparation, the coal samples were dried in a 105 °C drying oven for 6 h to ensure that water in the coal samples has been completely evaporated, after which they were kept in a desiccator.
4.2. Experimental Procedure
The coal samples were divided into two parts, namely, dried coal and water-injected coal. By comparing the pore characteristics of two kinds of coal samples with MP and LP-N2GA, the influence of high-pressure water injection on the pore structure was studied.
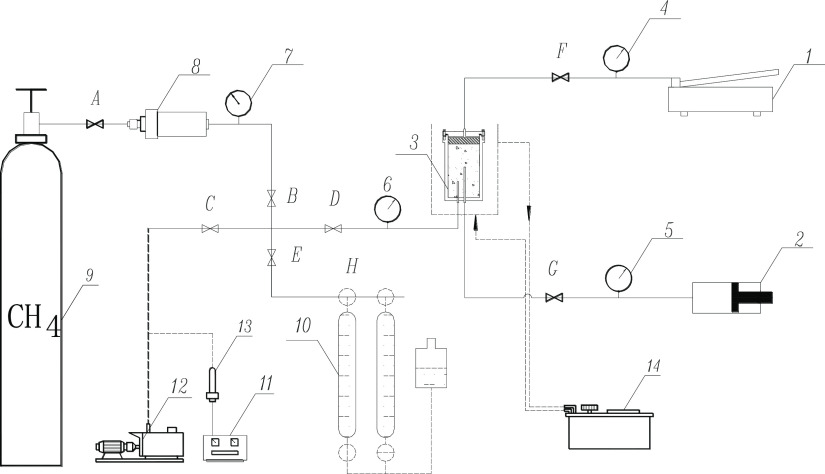
The water-injected coal samples were produced by a test device shown in Figure 13. The procedure is listed as follows: the coal sample is loaded into adsorption tank 3 and evacuated at 100 °C for at least 8 h until its vacuum pressure reaches 10 Pa or less. Second, the free volume in tank 3 is calibrated by filling with helium gas. Third, tank 3 is re-evacuated and the temperature of 14 is set at 303 K. Fourth, the coal sample is repeatedly injected by high-pressured CH4 at 303 K to a final equilibrium pressure. Then, manual hydraulic pump 1 is used to impose a certain overpressure on the coal sample. Finally, water injection pump 2 is switched on to inject some water to the coal sample under a certain pressure until the precalculated water injection volume is obtained. Then, the coal sample is equilibrated in tank 3 for 12 h before being taken out for MP and LP-N2GA testing.
Figure 13.
Schematic of the coal sample gas adsorption–desorption with water injection. 1—Manual hydraulic pump, 2—water injection pump, 3—adsorption tank, 4,5,6,7—precise pressure gauge, 8—Gas inflating tank, 9—high-purity methane cylinder, 10—desorption apparatus, 11—vacuum gauge, 12—Vacuum pump, 13—vacuum silicone tube, 14—constant temperature water bath, A–E—high-pressure valve, and H—glass three-way valve.
The coal samples with diameters ranging from 1 to 3 mm were selected for MP testing. The mass of the coal samples was 411.05 g. During the water injection process, Figure 14a shows that the pressure in tank 3 changed from 6.75 to 10.30 MPa. The total water injection amount was 72.30 g, and the water content reached 14.96% after water injection.
Figure 14.

Pressure changes of the adsorption tank in the water injection process: (a) 1–3 mm coal sample for MP. (b) 0.17–0.25 mm coal sample for LP-N2GA.
The coal samples with diameters ranging from 0.17 to 0.25 mm were chosen for LP-N2GA testing: the mass of the coal samples was 353.74 g. During the water injection process, Figure 14b shows that the pressure changed from 6.65 to 7.85 MPa. The total water injection amount was 43.63 g and the water content reached 10.98% after water injection.
4.3. Experimental Principle and the Device
The methods available for research on coal porosity include the density method, MP, and LP-N2GA. The density method which calculates coal porosity by measuring ARD and TRD is a widely used traditional method, but it cannot be used when the detailed pore size distribution (PSD) analysis is required. MP has the ability to measure the pore diameter ranging from 5.5 nm to 360 μm, while LP-N2GA is good at measuring the pore diameter ranging from 1.7 to 300 nm. Therefore, it is a better way to combine these two methods to investigate the changes of the coal pore structure after high-pressure water injection.
4.3.1. MP Analyses
During the MP experiment, the coal samples were equally divided into six parts, with three parts dried to be regarded as the control group and the other three parts treated with water injection at a pressure of 10 MPa (Figure 14a) and evaporated for 4 h at 373 K.
The MP is based on the nonwetting ability of mercury to coal. When mercury enters into a pore with radius r, it must overcome a capillary resistance F1 by the external force
| 1 |
where r is the radius of pore, nm; σ is the surface tension of mercury, 4.8 × 10⁻¹⁰ N/nm at 25 °C; and θ is the wetting angle of mercury to coal, 140°.
In order for mercury to enter into a pore with radius r, the external force can be calculated as follows
| 2 |
where p is the mercury pressure, MPa, 1 MPa = 10–12 N/nm2.
Because F1 = F2, then −2πrσ cos θ = πr2p × 10–12; so
| 3 |
The MP analyses were performed by using a mercury porosimeter AutoPore IV 9505, which has two high-pressure [33,000 psia (228 MPa) maximum pressure] and four low-pressure analysis ports and is able to measure the pore diameter ranging from 5.5 nm to 360 μm. The MP analysis can measure not only the SSA of large pores but also the porosity and PSD of the samples with advantage of simple and fast operation.
4.3.2. LP-N2GA Analyses
In order to investigate the effect of water injection on micropores, the pore characteristics of dried coal samples and water-injected coal samples were tested by ASAP2020, and the effect of water injection on the coal structure was analyzed by comparison. One dried sample and two water-injected samples were tested in this experiment. The water-injected coal samples were dried in a high-temperature oven at 373 K for 4 h.
In contrast to MP analysis, the LP-N2GA analysis can measure micropores with a pore diameter less than 2 nm, but the measurement of pores larger than 500 nm will cause an error.
4.3.2.1. Evaluation of the SSA
The BET equation is widely used to calculate the SSA of a porous material
| 4 |
where V is the adsorption volume of N2 at a relative pressure (P/P0), cm3/g; Vm is the maximum monolayer adsorption volume of N2, cm3/g; P0 is the saturated vapor pressure of N2; and C is the BET constant related to the energy of adsorption of the first layer of adsorption heat and condensation heat.
Generally, when
the relative pressure P/P0 is selected in the range of 0.05–0.35, the instrument can
measure the value of V. According to formula 4, a straight line can be obtained by plotting  to P/P0. The slope of this line
is
  , and the intercept is
  . Then,
| 5 |
Finally, the SSA of sample Sg (m2/g)
| 6 |
where σ is the molecular cross-sectional area of N2, 0.162 nm2 and N0 is Avogadro’s constant, 6.02 × 10²³.
4.3.2.2. Evaluation of PSD
The PSD refers to the distribution of the pore volume with respect to the pore size. The most common method of mesopore PSD is the BJH theory. The principle is the equivalent volume replacement method, that is, the volume of liquid nitrogen filling in the pore is regarded as the pore volume. It is known from the principle of capillary agglomeration that under different relative pressures P/P0, the range of pore sizes where capillary agglomeration occurs is different. The size of the pore with agglomeration increases with the increase in P/P0. For a given relative pressure value P/P0, there is a critical pore radius Rk. Capillary cohesive filling can occur for pores smaller than Rk, and capillaries do not occur for pores larger than Rk. The critical radius Rk is given by the Kelvin equation shown in eq 7
| 7 |
where γ is the liquid surface tension coefficient of N2, 8.85 × 10⁻⁵ N/cm; Ṽ is the liquid molar volume of N2, 34.65 cm3/mol; θ is the contact angle of liquid N2 to coal, 0°; T is the evaporation temperature of liquid N2, 77.3 K; and R is the ideal gas constant, 8.315 J/(K·mol).
| 8 |
As for micropores, based on the Polanyi adsorption potential theory, the Dubinin and Radushkevich (D–R) method can well characterize the pore structures
| 9 |
where V0 is the micropore volume; A represents the free energy of adsorption; β is the affinity coefficient; and E0 is the so-called characteristic energy of adsorption.
For a large number of microporous mediums, the adsorption isotherm can be well characterized by the D–R equation. However, for those microporous materials with heterogeneous distribution or strongly activated carbons, such as coal, the D–R equation fails to linearize the adsorption data. To describe the adsorption process of microporous mediums with a broader range, the D–A equation was proposed
| 10 |
where W is the weight adsorbed at P/P0 and W0 represents the total weight adsorbed; E is the characteristic energy; and n is the noninteger value (typically between 1 and 3).
The LP-N2GA was performed on an ASAP 2020 plus physisorption analyzer, which can perform the single-point, multi-point BET SSA, Langmuir SSA, BJH mesopores, pore distribution, density function theory, heat of adsorption, and average pore size. The pore size analysis ranges from 0.35 to 500 nm, and the minimum pore volume detection is 0.0001 cc/g.
Acknowledgments
Funding for this study was provided by the National Natural Science Foundation of China (nos. 51204066, 41372160). The first author is very grateful to the China Scholarship Council for its funding for visiting fellow in the University of Wollongong.
The authors declare no competing financial interest.
References
- Zhao W.; Cheng Y.; Pan Z.; Wang K.; Liu S. Gas diffusion in coal particles: A review of mathematical models and their applications. Fuel 2019, 252, 77–100. 10.1016/j.fuel.2019.04.065. [DOI] [Google Scholar]
- Zhiguo X.; Zhaofeng W. Experimental Study on Inhibitory Effect of Gas Desorption by Injecting Water into Coal-sample. Procedia Eng. 2011, 26, 1287–1295. 10.1016/j.proeng.2011.11.2303. [DOI] [Google Scholar]
- Yang W.; Wang H.; Zhuo Q.; Lin B.; Zhang J.; Lu C.; Lin M. Mechanism of water inhibiting gas outburst and the field experiment of coal seam infusion promoted by blasting. Fuel 2019, 251, 383–393. 10.1016/j.fuel.2019.04.064. [DOI] [Google Scholar]
- Liu Z.; Yang H.; Wang W.; Cheng W.; Xin L. Experimental Study on the Pore Structure Fractals and Seepage Characteristics of a Coal Sample Around a Borehole in Coal Seam Water Infusion. Transp. Porous Media 2018, 125, 289–309. [Google Scholar]
- Clarkson C. R.; Bustin R. M. The effect of pore structure and gas pressure upon the transport properties of coal: a laboratory and modeling study. 2. Adsorption rate modeling. Fuel 1999, 78, 1345–1362. 10.1016/s0016-2361(99)00056-3. [DOI] [Google Scholar]
- Zhao D.; Gao T.; Ma Y.; Feng Z. Methane Desorption Characteristics of Coal at Different Water Injection Pressures Based on Pore Size Distribution Law. Energies 2018, 11, 2345. 10.3390/en11092345. [DOI] [Google Scholar]
- Clarkson C. R.; Bustin R. M. The effect of pore structure and gas pressure upon the transport properties of coal: a laboratory and modeling study. 1. Isotherms and pore volume distributions. Fuel 1999, 78, 1333–1344. 10.1016/s0016-2361(99)00055-1. [DOI] [Google Scholar]
- Gan H.; Nandi S. P.; Walker P. L. Nature of the porosity in American coals. Fuel 1972, 51, 272–277. 10.1016/0016-2361(72)90003-8. [DOI] [Google Scholar]
- Rouquerol J.; Avnir D.; Fairbridge C. W.; Everett D. H.; Haynes J. M.; Pernicone N.; Ramsay J. D. F.; Sing K. S. W.; Unger K. K. Recommendations for the characterization of porous solids (Technical Report). Pure Appl. Chem. 1994, 66, 1739. [Google Scholar]
- Pan Z.; Connell L. D.; Camilleri M.; Connelly L. Effects of matrix moisture on gas diffusion and flow in coal. Fuel 2010, 89, 3207–3217. 10.1016/j.fuel.2010.05.038. [DOI] [Google Scholar]
- Nie B.; Liu X.; Yang L.; Meng J.; Li X. Pore structure characterization of different rank coals using gas adsorption and scanning electron microscopy. Fuel 2015, 158, 908–917. 10.1016/j.fuel.2015.06.050. [DOI] [Google Scholar]
- Liu H.; Mou J.; Cheng Y. Impact of pore structure on gas adsorption and diffusion dynamics for long-flame coal. J. Nat. Gas Sci. Eng. 2015, 22, 203–213. 10.1016/j.jngse.2014.11.030. [DOI] [Google Scholar]
- Wang B.; Qin Y.; Shen J.; Zhang Q.; Wang G. Pore structure characteristics of low- and medium-rank coals and their differential adsorption and desorption effects. J. Pet. Sci. Eng. 2018, 165, 1–12. 10.1016/j.petrol.2018.02.014. [DOI] [Google Scholar]
- Su E.; Liang Y.; Li L.; Zou Q.; Niu F. Laboratory Study on Changes in the Pore Structures and Gas Desorption Properties of Intact and Tectonic Coals after Supercritical CO2 Treatment: Implications for Coalbed Methane Recovery. Energies 2018, 11, 3419. 10.3390/en11123419. [DOI] [Google Scholar]
- Zhou Y.; Zhang R.; Huang J.; Li Z.; Zhao Z.; Zeng Z. Effects of pore structure and methane adsorption in coal with alkaline treatment. Fuel 2019, 254, 115600. 10.1016/j.fuel.2019.06.008. [DOI] [Google Scholar]
- Wang H.; Fu X.; Jian K.; Li T.; Luo P. Changes in coal pore structure and permeability during N-2 injection. J. Nat. Gas Sci. Eng. 2015, 27, 1234–1241. 10.1016/j.jngse.2015.09.068. [DOI] [Google Scholar]
- Lu S. Q.; Cheng Y. P.; Li W.; Wang L. Pore structure and its impact on CH4 adsorption capability and diffusion characteristics of normal and deformed coals from Qinshui Basin. Int. J. Oil, Gas Coal Technol. 2015, 10, 94–114. 10.1504/ijogct.2015.070042. [DOI] [Google Scholar]
- Walker P. L.; Mahajan O. P. Pore Structure In Coals. Energy Fuels 1993, 7, 559–560. 10.1021/ef00040a017. [DOI] [Google Scholar]
- Xin F. D.; Xu H.; Tang D. Z.; Yang J. S.; Chen Y. P.; Cao L. K.; Qu H. X. Pore structure evolution of low-rank coal in China. Int. J. Coal Geol. 2019, 205, 126–139. 10.1016/j.coal.2019.02.013. [DOI] [Google Scholar]


