Abstract
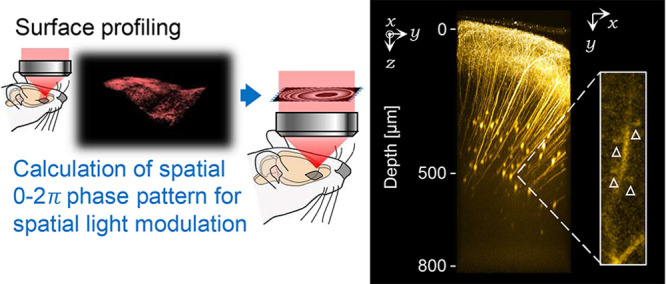
We developed adaptive optical (AO) two-photon excitation microscopy by introducing a spatial light modulator (SLM) in a commercially available microscopy system. For correcting optical aberrations caused by refractive index (RI) interfaces at a specimen’s surface, spatial phase distributions of the incident excitation laser light were calculated using 3D coordination of the RI interface with a 3D ray-tracing method. Based on the calculation, we applied a 2D phase-shift distribution to a SLM and achieved the proper point spread function. AO two-photon microscopy improved the fluorescence image contrast in optical phantom mimicking biological specimens. Furthermore, it enhanced the fluorescence intensity from tubulin-labeling dyes in living multicellular tumor spheroids and allowed successful visualization of dendritic spines in the cortical layer V of living mouse brains in the secondary motor region with a curved surface. The AO approach is useful for observing dynamic physiological activities in deep regions of various living biological specimens with curved surfaces.
1. Introduction
Two-photon microscopy is useful for revealing deep-inside biological specimens because of its superior penetration depth and less phototoxicity compared to one-photon confocal laser scanning microscopy.1−3 As Abbe’s criterion, the spatial resolution of the optical microscope is improved by employing an objective with a high numerical aperture (NA). However, a high NA objective deteriorates the focal spot size significantly in deeper regions of specimens because of different optical path lengths between the central and peripheral areas at the pupil of the objective when the rays refract irregularly at surfaces of specimens.4−6 In actual biological specimens with a complicated surface and structure induces not only symmetrical (e.g., spherical) but also asymmetrical aberrations (e.g., coma and astigmatism).7 Such optical aberrations occur dominantly at the specimen-immersion liquid interface where the refractive index (RI) mismatch is high, leading to low imaging contrasts and spatial resolution.
Adaptive optics (AO) cancels optical aberrations inside the specimen or optical elements of the microscope system by modulating the 2D spatial phase distributions of the wave front of the excitation laser beam.7 During the last several decades, many AO approaches have been proposed for two-photon microscopy, for example, using a spatial light modulator (SLM), as reported by our and other groups.8−15 The precise modulation of the phase and wave front allows us to perform the diffraction-limited resolution even in living biological specimens.16,17 These approaches require an additional wave-front sensor for the direct sensing of the 2D distributions of optical aberrations (wave-front aberrations),14−16 feedback loops of imaging of the region of interest in the sample, and modulations of the phase distributions until the fluorescence intensity of the guide stars is maximized. These processes could have significant phototoxicity and a photobleaching effect.10,12,17 However, Booth et al. proposed a sophisticated analytical approach to calculate a symmetrical aberration that could be introduced at a RI-mismatched planar surface.18,19 Such aberrations consisted dominantly of defocus and spherical aberrations. Based on these results, Matsumoto et al. approximately described optical aberrations occurring at tilted RI-mismatched interfaces by defocus and spherical aberration and proposed a numerical calculation applicable to tilted RI-mismatched interfaces.20 Their approach estimated a phase distribution to correct even asymmetrical aberrations generated at a tilted surface of a fixed mouse brain assuming an RI value. To estimate more precise optical aberrations in complicated surfaces of biological specimens, a generalized numerical method based on 3D ray tracing is required for high resolution in vivo observation.
In this work, we newly developed a generalized AO two-photon microscopy for compensating optical aberrations caused at the complicated surface with unknown RI values by using commercially available microscope systems equipped with a high NA objective. First, the 3D coordinate of the RI surface was profiled by single volumetric imaging for the surface labeled by fluorescent dyes. Based on the 3D coordinate, we numerically calculated 2D spatial phase distributions to compensate for optical aberrations using a 3D ray-tracing method. Our approach successfully performed high-resolution imaging of fine structures in the deep region of a living 3D-culture of HeLa cells and neurons in the secondary motor cortex of a living mouse brain with a high NA objective.
2. Experimental Section
2.1. Strategy for Compensating Optical Aberrations in Living Biological Specimens
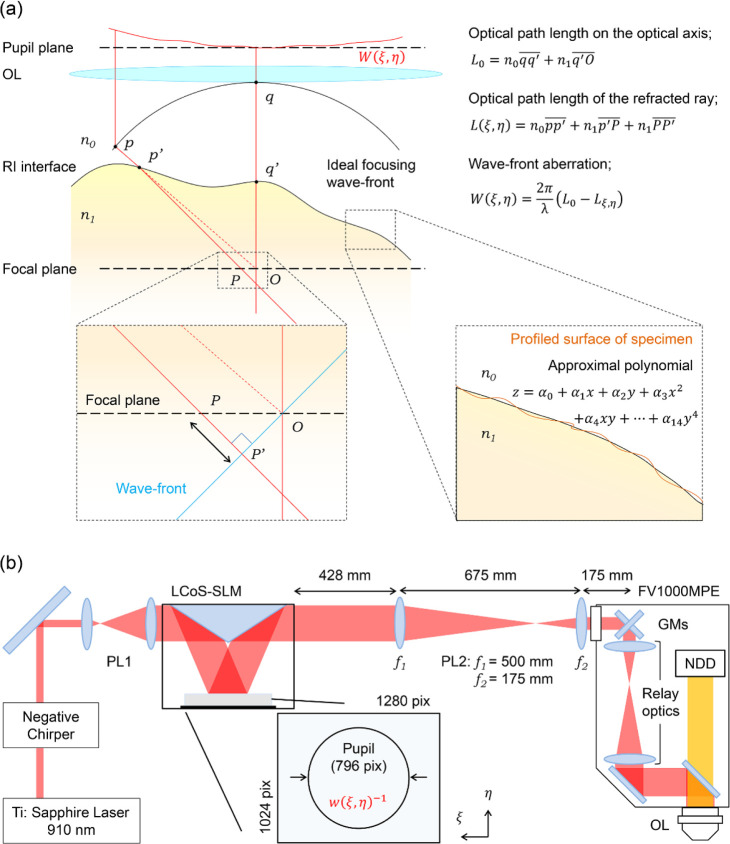
We estimated spatial phase distributions for compensating optical aberrations (correction phase patterns) by assuming that the RI in biological specimens is homogeneous, and the largest change in RI is at the interface between their surface and the immersion liquid (we refer to the RI interface below). The 3D structure of the sample surface labeled with fluorescent dyes is visualized, and the RI interface is profiled by fitting the image with an approximal polynomial.18 Based on the 3D coordinates of the RI interface, wave-front aberration expressed as a 2D phase distribution was numerically calculated using a 3D ray-tracing method (Figure 1a). Finally, an inverted distribution of the wave-front aberration estimated from a spatial phase distribution was applied to the SLM.
Figure 1.
Schematic illustration of calculation and setup. (a) Schematic illustration of the ray-tracing method for numerical calculation of the optical aberration. Starting points of rays were positioned on the ideal focusing wave front (p). The rays were refracted at the RI interface (the intersection p′) expressed by the approximal polynomial of the profiled surface of the specimen. After reaching the focal plane (the intersection P), the rays additionally propagated to the position P′ for their plane wave front reaching the ideal focal point (O). The total optical path lengths of refracted rays (L) were calculated to obtain spatial distributions of the wave-front aberration (W). (b) Schematic illustration of the AO two-photon microscopy system (PL: Pair of lenses; GMs: Galvanometer scanning mirrors; OL: Objectives; NDD: Multialkaline photomultiplier tube-based non-descanned detector). 2D spatial phase distributions for compensating wave-front aberrations (w–1) is applied to the display of the LCoS-SLM. The size of 2D spatial phase distributions (796 pix on the display) corresponds to the pupil diameter of the OL.
2.2. Optical Setup
A reflective SLM based on liquid crystal on silico technology (LCoS-SLM; C14280-12, Hamamatsu Photonics) was introduced in the excitation light path of a commercially available multiphoton laser scanning microscopy system (FV1000-MPE, Olympus) (Figure 1b). The LCoS-SLM display 72 mm away from the frame body used in this study has a resolution of 1280 × 1024 pixels (12.5 μm pixel size), 8-bit phase quantization, and a complete 2π phase modulation for near-infrared light at each pixel with a 60-Hz refresh rate. A linearly-polarized two-photon excitation laser light beam (910 nm, 80 MHz, 100 fs; Tsunami, Spectra Physics) passed through a negative chirper was expanded five times and collimated with the first pair of lenses (PL1; Draconis Broadband #59-135, Edmund Optics) in front of the LCoS-SLM. The excitation laser beam (13 mm in diameter) was reflected at the LCoS-SLM display. A second pair of lenses (PL2: f1 = 500 mm and f2 = 175 mm convex lenses, Thorlabs) was placed after the LCoS-SLM to relay a spatial phase distribution generated by the LCoS-SLM to the pupil of the objective lens (XLPLN 25× W MP NA1.05, Olympus) via galvanometer-scanning mirrors (GMs) and relay optics originally equipped in the commercially available system. LCoS-SLM and PL2 were placed on the excitation light path to project the image of the SLM at the middle plane of closely located two galvanometers for each x- and y-direction. The diameter of the excitation laser light beam was expanded to fill the pupil of the objective to use the maximum NA. Fluorescence was collected using the same objective and detected using a multialkaline photomultiplier tube based on a non-descanned detector (NDD).
2.3. Fluorescent Bead Imaging and Analysis
For evaluating the performance of AO-modulated two-photon microscopy, fluorescent yellow-green beads with a diameter of 0.2 μm (FluoSpheres, Carboxylate-modified, [505/515], Invitrogen) embedded in 1% w/v agarose gel (agarose L, Nippon Gene) were used as a standard sample. The RI of the gel was adjusted by adding glycerol. The gel (RI = 1.36) with the fluorescent beads was coated on a coverslip (0.16–0.19 mm, no. 1S) and subjected to our two-photon microscopy to simulate various configurations of the RI interface, such as upside-down or tilted against the lateral axis of the stage. Round samples were mimicked using agarose gel (RI = 1.33) with the fluorescent beads in a glass capillary (outer diameter of 1.5 mm, inner diameter of 1.1 mm; round sample). The surfaces of the samples were first visualized using red fluorescent beads (1.0 μm in diameter, FluoSpheres, Carboxylate-modified, [580/605], Invitrogen) to determine the shape of the RI interface and extract parameters for the AO modulation. The correction collar was first adjusted to correct the spherical aberration caused by the coverslip before the estimation of spherical aberrations caused at the second RI interface. For the tilted or round sample, the correction collar had to be adjusted to focus on the upper glass surface. The averaged intensity and full width at half maxima (fwhm) along the x-axis (fwhmx) and z-axis (fwhmz) were simply estimated for the flat sample by fitting the fluorescent spots of the fluorescent beads with a Gaussian function. For the tilted sample, the tilt angle (Δθ) was estimated by fitting images of fluorescent beads with a Gaussian function. Finally for the round sample, because the lateral images of fluorescent beads on single xy-focal planes are distorted and appear as ellipsoids, the ratio of fwhms to the major and minor axes of the ellipsoids (fwhmmajor and fwhmminor, respectively) is first determined through the fitting. In each case, images of 15–20 fluorescent beads were used to determine the parameters.
2.4. Calculation of Spatial Phase Distributions for Aberration Corrections
Spatial phase distributions for the corrections of the optical aberrations were numerically calculated using a 3D ray-tracing method21 on statistical computing software R.22 The ray-tracing method requires the RI of objects, depth of the focal plane, and 3D coordinates of RI interfaces. The 3D coordinates of RI interfaces were obtained by fitting images of the surface of specimens labeled with fluorescent dyes with an approximal polynomial. The number of light rays was matched to the number of pixels on the LCoS-SLM display and was used for the number of rays in the 3D ray-tracing simulation to fill the pupil (Figure 1b).
The focusing rays were refracted at the RI interfaces (point p′ in Figure 1a) according to Snell’s law and propagated from p′ to P to the focal plane, as shown by the horizontal dashed line in Figure 1a. The difference in optical path lengths between the unrefracted ideal focusing (from q to O via q′) and the refracted focusing (from p to P′ via p′) was converted to spatial distributions of the phase differences using
| 1 |
Finally, the spatial phase distributions Wξ,η were wrapped to wξ,η and inverted to wξ,η–1 for wave-front modulations of the excitation light beam using (Figure S1)
| 2 |
and
| 3 |
In the tilted or round sample, the shape of the first RI interfaces and thickness of the glass was used to predict the second RI interfaces (gel surface) because the strong optical aberration made it challenging to determine the precise shape of the second RI interfaces (Figure S2).
2.5. Biological Specimen Preparation for Imaging and Analysis
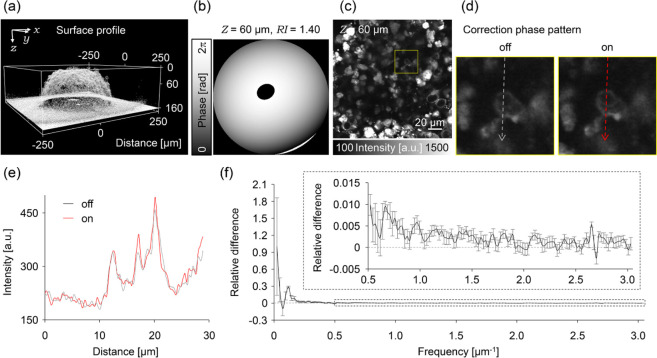
Human cervical cancer cells (HeLa cells, RCB0007) were provided by the Riken Cell Bank. The cells were cultured in Dulbecco’s modified Eagle’s medium (Gibco) supplemented with 10% fetal bovine serum (Gibco) and penicillin–streptomycin at 37 °C under 5% CO2. 3D multicellular tumor spheroids (MCTSs) were constructed by transferring a suspension of the HeLa cell culture (1200 cells/well) to several wells on a nonadhesion 96-well round-bottom plate (Prime Surface, Sumitomo Bakelite) and incubated at 37 °C under 5% CO2 for 3–5 days. After incubation, the MCTSs (∼200 μm diameter) were transferred on a 35 mm-diameter dish coated with poly-d-lysine. The MCTS with fluorescent dyes were labeled by adding fresh Tubulin Tracker Green (T34075, Invitrogen) solution to the dish. After incubation for 60 min at 37 °C under 5% CO2, the MCTSs were rinsed three times with Live Cell Imaging Solution (LCIS; A14291DJ, Invitrogen). The 3D coordinates of the MCTS surface (RI interface) were obtained by immersing the labeled MCTS in rhodamine B-labeled dextran (Thermo Fisher Scientific, 70,000 MW, 1 mg/mL in LCIS) solution until the end of profiling. After profiling the RI interface of the MCTSs, the rhodamine B-labeled dextran solution was gently washed with phosphate-buffered saline (PBS) and immersed in LCIS. For evaluating spatial frequencies of the obtained images, radial frequencies along concentric rings centered at the zero frequency were integrated and averaged in 10 sequential untreated z-stack images (42 × 42 × 10 μm3 of region, 0.165 × 0.165 × 1.00 μm3 voxel size, and the frequency ranged from 0.0237 to 3.03 μm–1).23 Images obtained inside the MCTS (Figure 5c,d) were smoothed with a Gaussian filter (radius = 1.0 pixel) to increase the image contrast.
Figure 5.
AO corrections in MCTSs. (a) 3D surface profile of the living MCTS visualized by florescent dextran solution. (b) Correction phase pattern with the RI value of 1.40 at 60 μm depth. (c) Image of the inside of the MCTS at the depth of 60 μm observed without applying the correction phase pattern. (d) Magnified image in the yellow square region of the (d) without (left) or with (right) applying the correction phase pattern. (e) Fluorescence intensity profiles in (d). The color of the lines corresponds to those of (d). (f) Normalized relative differences of the spatial frequency spectrum between each of the images obtained with and without applying the correction phase pattern. The differences were averaged in 10 sequential images of z-stack. Inset graph is a magnified view of the spectrum.
The in vivo imaging was conducted on Thy1-eYFP-H mice24 at least 8 weeks old. A craniotomy of 4.2 mm in diameter was made on the frontal bone with striding over the inferior cerebral vein under anesthesia with pentobarbital sodium to image the mouse’s secondary motor cortex. The 3D coordinates of the brain surface were obtained by dropping rhodamine B-labeled dextran (70,000 MW, 5 mg/mL in PBS) onto the exposed brain surface. The dextran solution was removed after a 5 s incubation. A cranial window consisting of a single ∼170 μm thickness φ4.2 mm coverslip (no. 1S, Matsunami glass) was embedded into the craniotomy section (the center was positioned 4 mm anterior to the bregma) and fixed in place with cyanoacrylate glue.25 The aberration was reduced by adjusting the coverslip manually to be perpendicular to the optical axis by a custom-made adapter stage, as previously reported.26 The center of the field of view in the observation was set at ∼3.9 mm anterior and ∼1.0 mm lateral to the bregma. Images obtained in the cortical layer V were smoothed with a Gaussian filter (radius = 1.0 pixel) to display the neural structures distinctly.
Note that all animal experiments were conducted following the recommendations in the Guidelines for the Care and Use of Laboratory Animals of the Animal Research Committee of Hokkaido University. The Institutional Animal Care and Use Committee of National University Corporation Hokkaido University (Permit Number: 17-0077) approved all protocols.
3. Results and Discussion
3.1. Performance Test for Compensating Optical Aberrations with Optical Phantoms
This section evaluates the proposed correction method for three aberrations, namely, spherical, coma, and astigmatism on the standard sample. Note that the correction phase patterns were estimated from only the 3D coordination of the RI interface without scanning the deep region of the sample.
3.1.1. Compensation of the Spherical Aberration
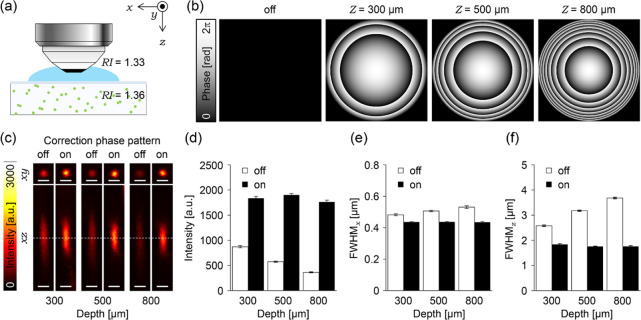
Using fluorescent beads embedded in agarose gel with a similar RI as the living mouse cortex (1.36),8,27 we evaluated the performance of AO two-photon microscopy for compensating the spherical aberration (Figure 2a). The excitation laser intensity was maintained constant during all experiments. Therefore, changes in the signal intensity shown here resulted from the aberration correction applied. By following eqs 1–3, we first calculated spatial phase distributions for modulating the wave front of the excitation laser beam to compensate optical aberrations (correction phase pattern) in depths of 300, 500, and 800 μm from the gel surface (Figure 2b). Figure 2c shows that the correction with the collar results in low fluorescence intensity and elongated spots along both the lateral and axial directions in depth-dependent manners, respectively (images indicated with off in Figure 2c). However, introducing correction phase patterns to the LCoS-SLM drastically improves the fluorescent images of the single beads at various depths. The values of the intensity were almost recovered to the constant (1800 a.u., to 215%, 330%, and 483% at each depth, Figure 2d), and the fwhm along the lateral and axial directions shows less depth dependence, 0.437 and 1.79 μm, respectively (fwhmx contracted to 90.1, 86.2, and 82.1%, and fwhmz contracted to 71.3, 55.3, and 47.8% at each depth, Figure 2e,f). The measured size of the bead image, however, was still larger than the theoretical value because of the residual optical aberrations or Brownian motion of the fluorescent beads. The less dependency on the depth indicates that the modulation of the wave front of the excitation laser beam by the LCoS-SLM successfully reduces the spherical aberration better than that by the correction collar adjusted to the thickness of the coverslip in the agarose-gel standard sample.
Figure 2.
Correction effects on spherical aberrations. (a) Schematic illustration of the experimental setup. (b) Correction phase patterns at 300, 500, and 800 μm depth. (c) 3D images of fluorescent beads observed with or without applying the correction phase pattern at each depth; the dashed lines indicate positions displaying xy images. All scale bars show 1 μm. (d–f) Bar graphs represent (d) average peak intensity of the fitted Gaussian function, (e) average fwhmx, and (f) average fwhmz. The white or black bars indicate average data obtained from fluorescent beads observed with or without applying the correction phase patterns. All error bars represent standard error of the mean (n = 20 beads).
3.1.2. Compensation of Coma Aberration
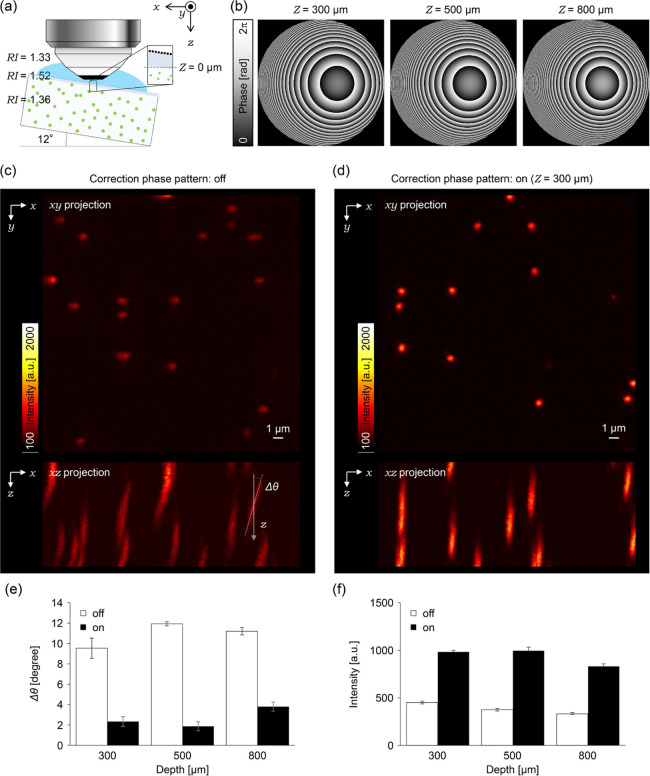
The effects of coma aberration were investigated by tilting the standard sample by ∼12° (Figure 3a). By using the 3D coordinates of two tilted RI interfaces between the glass and immersion liquid, the correction phase pattern was calculated at depths of 300, 500, and 800 μm from the gel surface according to eqs 1–3 (Figure 3b). Without applying the correction phase pattern, the fluorescent spots of the beads were significantly tilted in the xz-plane because of the coma aberration (9.53° ± 1.00°, 11.93° ± 0.20°, and 11.20° ± 0.36°at each depth, Figure 3c,e). With the correction phase pattern, the coma aberration was canceled, and the tilting angle of the fluorescent spots was reduced (2.33° ± 0.47°, 1.87° ± 0.43°, and 3.80° ± 0.45° at each depth, Figure 3d,e). Simultaneously, the fluorescence intensity was also increased by 218%, 265%, and 251% at each depth, respectively (Figure 3f). The tilting angle did not become zero even after applying the correction phase pattern because the pattern was not completely relayed to the pupil of the objective lens, which can be improved using detailed information of the relay optics inside the microscope.
Figure 3.
Correction effects on coma aberrations. (a) Schematic illustration of the experimental setup. (b) Correction phase patterns at 300, 500, and 800 μm depth. (c) (top) An xy projection image of fluorescent beads observed without applying the correction phase pattern at the depth of 300 μm. (bottom) An xz projection image. (d) (top) An xy projection image of fluorescent beads observed upon applying the correction phase pattern at the depth of 300 μm. (bottom) An xz projection image. (e,f) Bar graphs represent (e) average tilt angles against to the optical axis and (f) average peak intensity of the fitted Gaussian function. The white or black bars indicate average data obtained from fluorescent beads observed with or without applying the correction phase patterns. All error bars represent standard error of the mean (n = 15 beads).
3.1.3. Compensation of Astigmatism Aberration
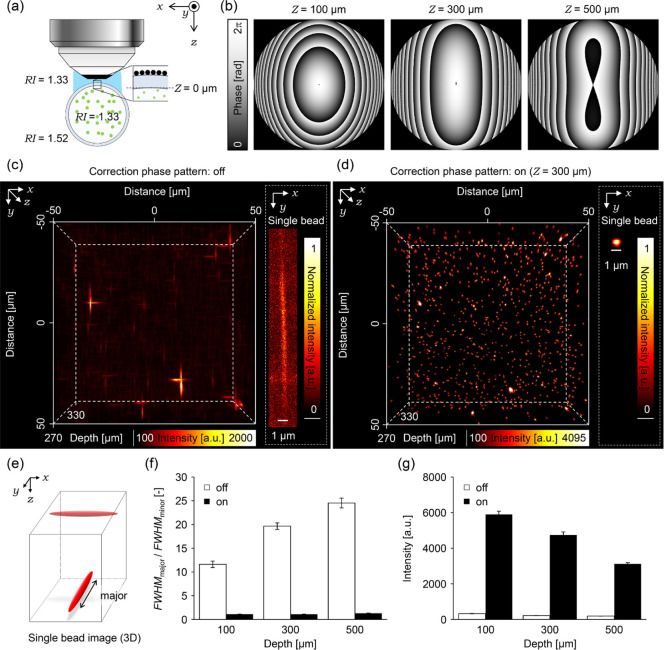
Many biological samples have nonflat rounded surfaces, which could induce astigmatism aberration. These situations were simulated by evaluating the phase correction method on agarose gel with fluorescent beads stored in a round glass capillary (Figure 4a). By applying the 3D coordinates of two rounded RI interfaces between the glass and gel and between the glass and immersion liquid, the correction phase patterns were calculated for the imaging depths of 100, 300, and 500 μm from the inner surface of the glass capillary by using eqs 1–3 (Figure 4b). Without the correction phase pattern, the bead images (Figure 4c) showed strong astigmatism caused by a cylindrical lens effect of the glass capillary (Figure 4e,f, fwhmmajor/fwhmminor 11.6, 19.7, and 24.5 at each depth). Because of the cylindrical lens effect, only fwhmmajor increased, whereas the fwhmminor did not change. The fluorescence intensity is also low because of the distortion (Figure 4g). By applying the correction phase pattern shown in Figure 4b, the fluorescent spots of the beads show an almost round shape (Figure 4d), and the ratios, fwhmmajor/fwhmminor, were corrected to almost one (1.11, 1.11, and 1.30 at each depth; Figure 4f). Consequently, fluorescence intensity was also recovered by 1800%, 2180%, and 1630% at each depth (Figure 4g). The degree of correction slightly decreased as the imaging depth increased because of less precision of the estimation of the inner RI interface between the glass and gel. However, the proposed AO method confirmed to be a powerful tool to improve imaging quality in deep regions of biological samples even those with a rounded surface.
Figure 4.
Correction effects on astigmatisms. (a) Schematic illustration of the experimental setup. (b) Correction phase patterns at 100, 300 and 500 μm depth. (c) (left) 3D image of fluorescent beads observed without applying the correction phase pattern at 300 μm depth. (right) An example image of the single fluorescent bead on the focal plane. The fluorescence intensity was normalized between the minimum value and the maximum value on the cropped area. (d) (left) 3D image of fluorescent beads observed with applying the correction phase pattern at 300 μm depth. (right) An example image of the single fluorescent bead on the focal plane. The fluorescence intensity was normalized between the minimum value and the maximum value on the cropped area. (e) An illustration of single fluorescent bead image observed without applying the correction phase pattern. (f,g) Bar graphs represent (f) average ratios of fwhmmajor to fwhmminor, and (f) average peak intensity of the fitted Gaussian function. The dashed line in (g) represents the value of the ratio 1. The white or black bars indicate average data obtained from fluorescent beads observed with or without applying the correction phase patterns. All error bars show standard error of the mean (n = 15 beads).
3.2. Application of AO Two-Photon Microscopy for Living Biological Specimens
3.2.1. 3D Multicellular Tumor Spheroids
The proposed AO two-photon microscopy was then applied to a living specimen. First, 3D MCTS was used as a model biological sample. Although MCTS should induce less aberration compared to the real biological tissue, it could cause some aberrations; therefore, the correction method was applied for visualizing the inside of MCTS. Microtubules were labeled with a fluorescent dye, Tubulin Tracker Green. Because the dye molecules penetrate up to ∼70 μm from the surface of the spheroids, the imaging has been carried out within ∼70 μm depth. First, the correction collar was adjusted to its surface, and the surface of the MCTS (the RI interface) was visualized using a fluorescent dextran in the extracellular solution (Figure 5a). The corresponding correction phase patterns were calculated based on the 3D coordination of the RI interface and the value of RI of MCTSs (1.40) (Figure 5b).28 The correction phase pattern was almost symmetrically similar to the case of spherical aberration, and the degree of phase shift ranged within 2π. The spatial phase distribution did not show significant dependence on depths at 40, 60, and 80 μm or RI values of 1.39, 1.40, and 1.41 (see Figure S3). Despite the less dependence on the depth and RI, introducing the correction phase pattern improved the image contrast in the fluorescence image inside the MCTS (Figure 5c–e).
We evaluated our method by also evaluating spatial frequencies using the method previously reported (Section 2.4).23 By analyzing the difference in the spatial frequency spectrum of the image, the intensity was increased in all ranges of the spatial frequency examined (Figure 5f), indicating that the RI interface of MCTSs does not induce strong aberration because of their smooth and spherical surface.
3.2.2. Secondary Motor Cortex of Living Mouse Brains
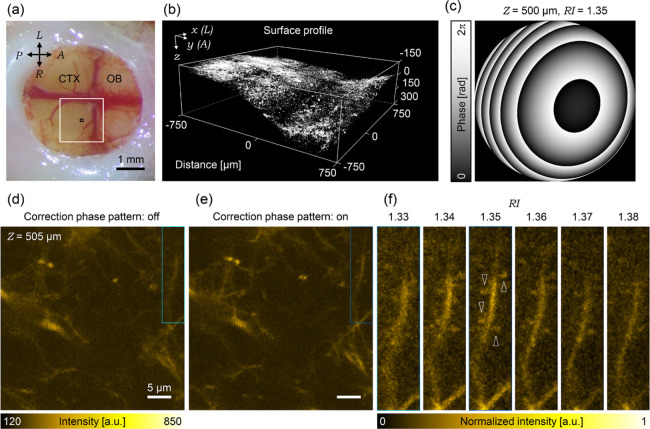
Finally, we applied AO two-photon microscopy to an in vivo deep imaging of the mouse’s secondary motor cortex, of which, the surface has large curvatures. The secondary motor cortex was positioned at the center of the cranial window by conducting a craniotomy on the frontal bone striding over the inferior cerebral vein (Figure 6a). For the two-photon imaging, the correction collar was adjusted to compensate the optical aberration caused by the cranial window. As in the case of 3D MCTS (Figure 5), correction phase patterns corresponding to various depths were calculated based on the surface shape visualized by the fluorescent dextran (Figure 6b). Here, the correction patterns were calculated using various RI values ranging from 1.34 to 1.38 with 0.01 intervals because the RI value of the secondary motor cortex in vivo is unknown. As expected, the correction phase patterns significantly varied, depending on the imaging depths and RI values (Figure S4). Figure 6c shows the calculated correction phase pattern with the RI value of 1.35 at 500 μm depth as an example.
Figure 6.
AO corrections in mouse’s secondary motor cortex. (a) Snapshot of the implanted cranial window (OB: Olfactory bulb; CTX: cortex; A: anterior; P: posterior; L: left; R: right). The white rectangle shows the region of surface-shape obtained area as shown in (b). The black rectangle shows the range of the field of view as shown in (d) and (e). (b) 3D surface profile of the living mouse brain visualized by fluorescent dextran. (c) Correction phase pattern with the RI value of 1.35 at 500 μm depth. (d) Image of living mouse brain in 500 μm depth observed without applying the correction phase pattern. (e) Same field of view as (d) observed with applying the correction phase pattern. (f) Magnified images in the cyan rectangle region of the (d) without or with various correction phase patterns. The top values indicate the assumed RI values. The fluorescence intensity was normalized between the minimum value and the maximum value on the cropped area of 1.35. The white arrow heads indicate the visualized dendritic spines.
Without correction, individual dendritic spines are hardly distinguished in the fluorescent image captured at a depth of 500 μm from the brain surface (Figure 6d). However, by applying the correction phase pattern, image contrast significantly increased, and dendritic spines became distinguishable in the same field of view (Figure 6e). Notably, the dendritic spines were most distinctly visualized when the secondary motor cortex’s RI value in vivo was assumed to be 1.35 (Figure 6f). The result indicated that the averaged RI value of the targeted region, tissue, or specimen can be estimated using various correction phase patterns, assuming various RI values.
4. Conclusions
This study introduced an LCoS-SLM device on the excitation light path of the commercially available two-photon microscopy system. Images on the SLM were displayed on the midplane of two galvanometers once followed by relaying with the scan lens.29,30 Two galvanometers for the x- and y-directions were separated spatially to conjugate the image of the LCoS-SLM display precisely.31 In this sense, even though our optical design for the position of the SLM device’s insertion might be imperfect, the correction of aberrations was effective in all specimens examined in this study, indicating that the image quality of any commercially available laser scanning microscope can be improved without any complicated settings using an AO device.
Most importantly, for calculating spatial phase distributions to modulate the wave front of the excitation laser beam, we considered only the surface structure (RI interface). Calculations for additional fine-tuning of spatial phase distributions corresponding to the inhomogeneous distribution of RI inside the biological specimen would be required, especially in the thick specimen or deep regions in vivo.11,16,17 However, RI’s inhomogeneous distributions vary for each specimen, depending on their complicated structures composed of various elements with a specific value of RI such as the extracellular matrix and intracellular organelle.32,33 Only modifying the wave front cannot realize the diffraction-limited performance in deep regions of specimens, scattering the incident light strongly.23 Considering these issues, novel clearing methods for living specimens could help achieve ideal spatial resolution imaging even in biological specimens.34,35
Our AO two-photon microscopy was evaluated by visualizing dendritic spines in the cortical layer V of a mouse’s secondary motor cortex. Recent studies have suggested that the secondary motor cortex is a critical target for treating neurological diseases.36−38In vivo observation of the secondary motor cortex with a synaptic level should elucidate the mechanism and therapeutic disciplines of neurological diseases.39−41 Our AO approach should facilitate investigating the underlying mechanisms at a subcellular level on the physiology and pathology.
Acknowledgments
We thank Dr. Ryosuke Enoki and Dr. Hirokazu Ishii of the Division of Biophotonics at the National Institute for Physiological Sciences, National Institute of Natural Sciences for their helpful advice regarding the experimental set up. We are also grateful to Dr. Kentaro Kobayashi and Dr. Yasutaka Matsuo of the Nikon Imaging Center at Hokkaido University for providing technical support. This collaborative work was partially supported by the JSPS “Core-to-Core Program, A. Advanced Research Networks”, the Research Program of “Five-star Alliance” in “NJRC Mater. & Dev.” (MEXT), “Network Joint Research Center for Materials and Devices”, and “the Photo-excitonix in Hokkaido University”. We would like to thank Enago (www.enago.jp) for the English language review.
Glossary
Abbreviations
- AO
adaptive optics
- NA
numerical aperture
- RI
refractive index
- SLM
spatial light modulator
- LCoS
liquid crystal on silico
- fwhm
full width at half maximum
- PBS
phosphate-buffered saline
- MCTS
multicellular tumor spheroid
Supporting Information Available
The Supporting Information is available free of charge at https://pubs.acs.org/doi/10.1021/acsomega.0c04888.
Schematic illustration of the compensation of wave-front aberration, estimation of the second RI interface in tilted or round samples, calculated spatial phase distributions depending on the RI value of 1.40 at 60 μm depth, and calculated spatial phase distributions depending on the RI value of 1.35 at 500 μm depth (PDF)
Brain/MINDS (AMED); MEXT/JSPS KAKENHI (JP20H00523, JP19K15406, JP18K06591, JP16K15103, JP15H05953 “Resonance Bio”, JP17H03003, JP20K05413, and JP20K21165).
The authors declare no competing financial interest.
Supplementary Material
References
- Helmchen F.; Denk W. Deep tissue two-photon microscopy. Nat. Methods 2005, 2, 932–940. 10.1038/nmeth818. [DOI] [PubMed] [Google Scholar]
- Denk W.; Strickler J.; Webb W. Two-photon Laser Scanning Fluorescence Microscopy. Science 1990, 248, 73–76. 10.1126/science.2321027. [DOI] [PubMed] [Google Scholar]
- Zipfel W. R.; Williams R. M.; Webb W. W. Nonlinear magic: multiphoton microscopy in the biosciences. Nat. Biotechnol. 2003, 21, 1369–1377. 10.1038/nbt899. [DOI] [PubMed] [Google Scholar]
- Born M.; Wolf E.. Principles of Optics; Pergamon Press: Oxford, 1980. [Google Scholar]
- Hell S.; Reiner G.; Cremer C.; Stelzer E. H. K. Aberrations in confocal fluorescence microscopy induced by mismatches in refractive index. J. Microsc. 1993, 169, 391–405. 10.1111/j.1365-2818.1993.tb03315.x. [DOI] [Google Scholar]
- Egner A.; Hell S. W.. Aberrations in Confocal and Multi-photon Fluorescence Microscopy Induced by Refractive Index Mismatch. Handbook of Biological Confocal Microscopy; Springer: Boston, 2006; pp 404–413. [Google Scholar]
- Ji N. Adaptive optical fluorescence microscopy. Nat. Methods 2017, 14, 374–380. 10.1038/nmeth.4218. [DOI] [PubMed] [Google Scholar]
- Muriello P. A.; Dunn K. W. Improving signal levels in intravital multiphoton microscopy using an objective correction collar. Opt. Commun. 2008, 281, 1806–1812. 10.1016/j.optcom.2007.05.070. [DOI] [PMC free article] [PubMed] [Google Scholar]
- Ue Y.; Monai H.; Higuchi K.; Nishiwaki D.; Tajima T.; Okazaki K.; Hama H.; Hirase H.; Miyawaki A. A spherical aberration-free microscopy system for live brain imaging. Bull. Biol. Res. Cent 2018, 500, 236–241. 10.1016/j.bbrc.2018.04.049. [DOI] [PubMed] [Google Scholar]
- Turcotte R.; Liang Y.; Ji N. Adaptive optical versus spherical aberration corrections for in vivo brain imaging. Biomed. Opt. Express 2017, 8, 3891–3902. 10.1364/boe.8.003891. [DOI] [PMC free article] [PubMed] [Google Scholar]
- Tanabe A.; Hibi T.; Ipponjima S.; Matsumoto K.; Yokoyama M.; Kurihara M.; Hashimoto N.; Nemoto T. Correcting spherical aberrations in a biospecimen using a transmissive liquid crystal device in two-photon excitation laser scanning microscopy. J. Biomed. Opt. 2015, 20, 101204. 10.1117/1.jbo.20.10.101204. [DOI] [PubMed] [Google Scholar]
- Ji N.; Milkie D. E.; Betzig E. Adaptive optics via pupil segmentation for high-resolution imaging in biological tissues. Nat. Methods 2010, 7, 141–147. 10.1038/nmeth.1411. [DOI] [PubMed] [Google Scholar]
- Tanabe A.; Hibi T.; Ipponjima S.; Matsumoto K.; Yokoyama M.; Kurihara M.; Hashimoto N.; Nemoto T. Transmissive liquid-crystal device for correcting primary coma aberration and astigmatism in biospecimen in two-photon excitation laser scanning microscopy. J. Biomed. Opt. 2016, 21, 121503. 10.1117/1.jbo.21.12.121503. [DOI] [PubMed] [Google Scholar]
- Rueckel M.; Mack-Bucher J. A.; Denk W. Adaptive wavefront correction in two-photon microscopy using coherence-gated wavefront sensing. Proc. Natl. Acad. Sci. U.S.A. 2006, 103, 17137–17142. 10.1073/pnas.0604791103. [DOI] [PMC free article] [PubMed] [Google Scholar]
- Wang K.; Milkie D. E.; Saxena A.; Engerer P.; Misgeld T.; Bronner M. E.; Mumm J.; Betzig E. Rapid adaptive optical recovery of optimal resolution over large volumes. Nat. Methods 2014, 11, 625–628. 10.1038/nmeth.2925. [DOI] [PMC free article] [PubMed] [Google Scholar]
- Wang K.; Sun W.; Richie C. T.; Harvey B. K.; Betzic E.; Ji N. Direct wavefront sensing for high-resolution in vivo imaging in scattering tissue. Nat. Commun. 2015, 6, 7276. 10.1038/ncomms8276. [DOI] [PMC free article] [PubMed] [Google Scholar]
- Ji N.; Sato T. R.; Betzig E. Characterization and adaptive optical correction of aberrations during in vivo imaging in the mouse cortex. Proc. Natl. Acad. Sci. U.S.A. 2012, 109, 22–27. 10.1073/pnas.1109202108. [DOI] [PMC free article] [PubMed] [Google Scholar]
- Matsumoto N.; Konno A.; Inoue T.; Okazaki S. Aberration correction considering curved sample surface shape for non-contact two-photon excitation microscopy with spatial light modulator. Sci. Rep. 2018, 8, 9252. 10.1038/s41598-018-27693-7. [DOI] [PMC free article] [PubMed] [Google Scholar]
- Booth M. J.; Neil M. A. A.; Wilson T. Aberration correction for confocal imaging in refractive-index-mismatched media. J. Microsc. 1998, 192, 90–98. 10.1111/j.1365-2818.1998.99999.x. [DOI] [Google Scholar]
- Salter P. S.; Baum M.; Alexeev I.; Schmidt M.; Booth M. J. Exploring the depth range for three-dimensional laser machining with aberration correction. Opt. Express 2014, 22, 17644–17656. 10.1364/oe.22.017644. [DOI] [PubMed] [Google Scholar]
- Schedin S.; Hallberg P.; Behndig A. Three-dimensional ray-tracing model for the study of advanced refractive errors in keratoconus. Appl. Opt. 2016, 55, 507–514. 10.1364/ao.55.000507. [DOI] [PubMed] [Google Scholar]
- RStudio team . RStudio: Integrated Development for R; RStudio, Inc.: Boston, MA, 2016.
- Brajones J. M.; Clouvel G.; Dovillaire G.; Levecq X.; Lorenzo C. Highly Sensitive Shack-Hartmann Wavefront Sensor: Application to Non-Transparent Tissue Mimic Imaging with Adaptive Light-Sheet Fluorescence Microscopy. Methods Protoc. 2019, 2, 59. 10.3390/mps2030059. [DOI] [PMC free article] [PubMed] [Google Scholar]
- Feng G.; Mellor R. H.; Bernstein M.; Keller-Peck C.; Nguyen Q. T.; Wallace M.; Nerbonne J. M.; Lichtman J. W.; Sanes J. R. Imaging Neuronal Subsets in Transgenic Mice Expressing Multiple Spectral Variants of GFP. Neuron 2000, 28, 41–51. 10.1016/s0896-6273(00)00084-2. [DOI] [PubMed] [Google Scholar]
- Holtmaat A.; Bonhoeffer T.; Chow D. K.; Chuckowree J.; De Paola V.; Hofer S. B.; Hübener M.; Keck T.; Knott G.; Lee W.-C. A.; Mostany R.; Mrsic-Flogel T. D.; Nedivi E.; Portera-Cailliau C.; Svoboda K.; Trachtenberg J. T.; Wilbrecht L. Long-term, high-resolution imaging in the mouse neocortex through a chronic cranial window. Nat. Protoc. 2009, 4, 1128–1144. 10.1038/nprot.2009.89. [DOI] [PMC free article] [PubMed] [Google Scholar]
- Kawakami R.; Sawada K.; Kusama Y.; Fang Y.-C.; Kanazawa S.; Kozawa Y.; Sato S.; Yokoyama H.; Nemoto T. In vivo two-photon imaging of mouse hippocampal neurons in dentate gyrus using a light source based on a high-peak power gain-switched laser diode. Biomed. Opt. Express 2015, 6, 891–901. 10.1364/boe.6.000891. [DOI] [PMC free article] [PubMed] [Google Scholar]
- Yamaguchi K.; Kitamura R.; Kawakami R.; Otomo K.; Nemoto T. In vivo two-photon microscopic observation and ablation in deeper brain regions realized by modifications of excitation beam diameter and immersion liquid. PLoS One 2020, 15, e0237230 10.1371/journal.pone.0237230. [DOI] [PMC free article] [PubMed] [Google Scholar]
- Hari N.; Patel P.; Ross J.; Hicks K.; Vanholsbeeck F. Optical coherence tomography complements confocal microscopy for investigation of multicellular tumour spheroids. Sci. Rep. 2019, 9, 10601. 10.1038/s41598-019-47000-2. [DOI] [PMC free article] [PubMed] [Google Scholar]
- Nikolenko V.; Watson B. O.; Araya R.; Woodruff A.; Peterka D. S.; Yuste R. SLM microscopy: scanless two-photon imaging and photostimulation with spatial light modulators. Front. Neural Circuits 2008, 2, 1–14. 10.3389/neuro.04.005.2008. [DOI] [PMC free article] [PubMed] [Google Scholar]
- Watson B. O.; Nikolenko V.; Yuste R. Two-photon imaging with diffractive optical elements. Front. Neural Circuits 2009, 3, 1–11. 10.3389/neuro.04.006.2009. [DOI] [PMC free article] [PubMed] [Google Scholar]
- Matsumoto N.; Konno A.; Ohbayashi Y.; Inoue T.; Matsumoto A.; Uchimura K.; Kadomatsu K.; Okazaki S. Correction of spherical aberration in multi-focal multiphoton microscopy with spatial light modulator. Opt. Express 2017, 25, 7055–7068. 10.1364/oe.25.007055. [DOI] [PubMed] [Google Scholar]
- Choi W.; Fang-Yen C.; Badizadegan K.; Oh S.; Lue N.; Dasari R. R.; Feld M. S. Tomographic phase microscopy. Nat. Methods 2007, 4, 717–719. 10.1038/nmeth1078. [DOI] [PubMed] [Google Scholar]
- Binding J.; Ben Arous J.; Léger J.-F.; Gigan S.; Boccara C.; Bourdieu L. Brain refractive index measured in vivo with high-NA defocus-corrected full-field OCT and consequences for two-photon microscopy. Opt. Express 2011, 19, 4833–4847. 10.1364/oe.19.004833. [DOI] [PubMed] [Google Scholar]
- Iijima K.; Oshima T.; Kawakami R.; Nemoto T. Optical clearing of living brains with MAGICAL to extend in vivo imaging. bioRxiv 2019, 507426. [DOI] [PMC free article] [PubMed] [Google Scholar]
- Boothe T.; Hilbert L.; Heide M.; Berninger L.; Huttner W. B.; Zaburdaev V.; Vastenhouw N. L.; Myers E. W.; Drechsel D. N.; Rink J. C. A tunable refractive index matching medium for live imaging cells, tissues and model organisms. eLife 2017, 6, e27240 10.7554/elife.27240. [DOI] [PMC free article] [PubMed] [Google Scholar]
- Barthas F.; Kwan A. C. Secondary Motor Cortex: Where “Sensory” Meets “Motor” in the Rodent Frontal Cortex. Trends Neurosci. 2017, 40, 181–193. 10.1016/j.tins.2016.11.006. [DOI] [PMC free article] [PubMed] [Google Scholar]
- Murakami M.; Vicente M. I.; Costa G. M.; Mainen Z. F. Neural antecedents of self-initiated actions in secondary motor cortex. Nat. Neurosci. 2014, 17, 1574–1582. 10.1038/nn.3826. [DOI] [PubMed] [Google Scholar]
- Magno L. A. V.; Tenza-Ferrer H.; Collodetti M.; Aguiar M. F. G.; Rodrigues A. P. C.; da Silva R. S.; Silva J. d. P.; Nicolau N. F.; Rosa D. V. F.; Birbrair A.; Miranda D. M.; Romano-Silva M. A. Optogenetic Stimulation of the M2 Cortex Reverts Motor Dysfunction in a Mouse Model of Parkinson’s Disease. J. Neurosci. 2019, 39, 3234–3248. 10.1523/jneurosci.2277-18.2019. [DOI] [PMC free article] [PubMed] [Google Scholar]
- Lai C. S. W.; Franke T. F.; Gan W.-B. Opposite effects of fear conditioning and extinction on dendritic spine remodeling. Nature 2012, 483, 87–91. 10.1038/nature10792. [DOI] [PubMed] [Google Scholar]
- Muñoz-Cuevas F. J.; Athilingam J.; Piscopo D.; Wilbrecht L. Cocaine-induced structural plasticity in frontal cortex correlates with conditioned place preference. Nat. Neurosci. 2013, 16, 1367–1369. 10.1038/nn.3498. [DOI] [PMC free article] [PubMed] [Google Scholar]
- Johnson C. M.; Peckler H.; Tai L.-H.; Wilbrecht L. Rule learning enhances structural plasticity of long-range axons in frontal cortex. Nat. Commun. 2016, 7, 10785. 10.1038/ncomms10785. [DOI] [PMC free article] [PubMed] [Google Scholar]
Associated Data
This section collects any data citations, data availability statements, or supplementary materials included in this article.


