Abstract
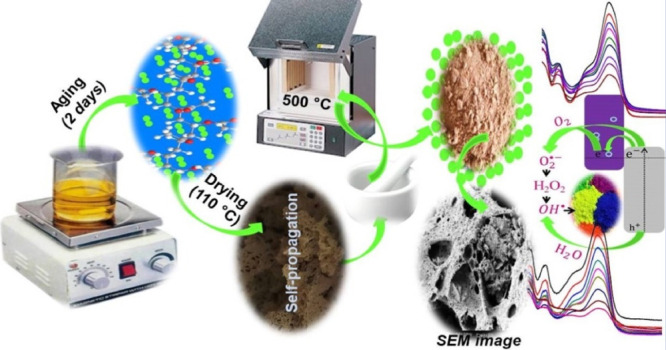
Zinc oxide is one of the novel metal oxides utilized for diverse applications. The sol–gel and unintended self-propagation procedures were applied to synthesize the porous and high surface area ZnO-based metal oxide nanocomposite. The p-type manganese(III) oxide was successfully coupled with n-type ZnO. The physical property characterization results revealed the surface area, porosity, and charge transfer capability improvement on the poly(vinyl alcohol) (PVA)-aided binary nanocomposite (PVA-ZnO/Mn2O3), compared to ZnO. The XRD patterns and TEM image analysis validated the nanometer size range for the materials (15–60 nm). The SEM micrographs and BET spectral details have confirmed the porous nature of the PVA-ZnO/Mn2O3 nanocomposite. The supporting results were obtained from the HRTEM (IFFT) and SAED pattern analyses. The EDX and HRTEM analyses were used for the confirmation of elemental composition and reality of the PVA-ZnO/Mn2O3 composite, respectively. The presence of the improved charge transfer property for PVA-ZnO/Mn2O3, compared to ZnO, was evidenced from acid orange-8 dye degradation. The highest zone of inhibition (14 mm) was recorded on Escherichia coli bacteria for the uncalcined PVA-ZnO/Mn2O3 nanocomposite compared to PVA, yet, less zone of inhibition compared to the calcined PVA-ZnO/Mn2O3 nanocomposite. The authors recommend the formation of the couple between metal oxides by electrochemical technique analyses as a future work.
1. Introduction
Among 70% of the critical life-sustaining water resources that cover the earth’s surface, ∼2.5% is fresh, and out of 2.5%, 70% is discharged as wastewater without treatment.1,2 Sectors, such as textile, paints, paper, leather, and plastics, release toxic synthetic organic dyes that cause damage to the living organisms.3,4 In light of this, among numerous methods used for remediation of pollutants, the heterogeneous advanced oxidation processes by a metal oxide semiconductor received attention.5,6 Titanium dioxide (TiO2) and zinc oxide (ZnO) nanomaterials have been extensively applied in several areas, such as adsorption, photocatalysis, food preservation/antibacterial, photoluminescence, photoelectrocatalytic, and pollutant sensors.7,8 This is due to their prominent electronic, thermal, and optical properties along with their biocompatibility and reusability.9,10 Compared to TiO2, the production cost of ZnO is approximately 75% lower and has higher absorption efficiency across a large fraction of the solar spectrum. Nowadays, due to their suitable band gap energy, low-cost, nontoxicity, ubiquity, and high electron mobility properties, ZnO nanoparticles (NPs) have become an attention grabbing semiconductor for remediation of hazardous organic pollutants and as food preservation.11,12
Irradiation of a ZnO photocatalyst with suitable energy produces an electron (e–) and hole (h+) pairs on the surface of the photocatalyst. On the reduction half-reaction, an e– reacts with dissolved oxygen and creates hydroxide radicals (OH·) after passing some intermediates. Whereas, on the oxidation half-reaction, the h+ reacts with water and form additional OH·. The occurrence of these two reactions is dependent on the band potential of the photocatalyst. The OH· and O2·– oxidizing agents react with adsorbed toxic pollutants and produce a nontoxic byproduct. Applying single ZnO as a photocatalyst faces an e–/h+ recombination problem. This recombination problem, particularly in the nanosized range, lead to the diminution of their quantum efficiency. It is also understood from the past studies that sometimes the e–/h+ recombination may also initiate highly desirable reactions and consequences in the dissipation of radiant energy.13,14
Among several strategies developed for the improvement of the charge transfer capabilities of the photocatalysts, the formation of an interface between two or more metal oxide semiconductors is one of the viable schemes.12 The design and fabrication of an interface significantly assist the process of continuous transfer of electrons from the more negative conduction band (CB) potential to the lower CB potential and holes from less negative valence band (VB) potential to the more negative VB.15 Furthermore, forming a hybrid also enhances the active sites, polarity, porous nature, and broad band gap properties of the materials. Nowadays, the coupling of related band gap metal oxides, such as TiO2/ZnO16 and SnO2/ZnO,17 has a novel approach for diminishing the e–/h+ recombination problem. In addition to efficient charge separation, the formation of a heterojunction with different band gap metal oxides like ZnO/MnxOy18−22 results in the enhancement in the efficiency of the adsorption of pollutants, surface area, and stability.13,18
The environment-friendly nature, promising surface area, magnetic assets, abundance, and cheap availability of manganese oxide makes it a suitable candidate for heterojunction formation with other metal oxides. Among different crystalline polymorphs of manganese oxide, the Mn2O3 is cheap and environmentally safe.23 Both in the amorphous and crystalline states, the α-Mn2O3 has a wide range of photocatalytic applications.24 Because of its low charge transfer resistance and multitudinous defects, it forms a heterojunction with ZnO and enhances the e–/h+ separation route. In addition, in the nanosized range (high surface-to-volume ratio), Mn2O3 can improve the adsorption capacity of the pollutants and is also sensitive to ultraviolet light.25
Because of the large surface area and surface energy of metal oxides, aggregation/agglomeration occurred. The aggregation/agglomeration reduces the generation of radioactive oxygen species and hydroxyl radicals so as the diminution of the photocatalytic activities. It is due to the e– and h+ quenching with the neighboring aggregate.26 To avoid this problem, capping of the NPs with a polymer matrix that acts as a structure-directing agent through forming a noncovalent or/and a covalent bond is an effective way.27 The synthesis of novel mesoporous materials on the crystallization stages with well-defined morphologies using polymers is also recommended in different fields.28 Among several polymers, poly(vinyl alcohol) (PVA) has biocompatible, biodegradable, water-soluble, and easily film-forming properties.29,30 PVA also has hydroxyl groups on the carbon chain backbone, which act as a source for hydrogen bond formation.31 On the thermal analysis of PVA, between 100–250 °C, a slow intramolecular decomposition took place, and within its melting points ranges of 220–370 °C, the degradation of the amorphous part (∼300 °C) took place.32 The intermolecular decay at 385 °C, its crystalline part decomposition at 398 °C,33 and complete decomposition from 400–500 °C also took place to yield carbon and hydrocarbons that lead to the liberation of CO2 gas resulting in a pure metal oxide phase.33,34
Nowadays, numerous studies are being conducted without considering the risk assessments of toxic solvents. Solvents, especially, which are certified under the severe human health risk phrases category of the Global Harmonized System (GHS) and Hazard and Precautionary (H & P) agency, are carcinogenic, toxic to the reproduction, and mutagenic. The other important issue is the assessment of the safety score related to the flammability and explosion score as well as reactivity and stability scores.35,36 Therefore, the synthetic procedure, which reduces the solvent risk and cost, and the complicated system should be developed. The recent research suggested the more advantageous sol–gel synthetic technique using environmentally benign water as a solvent with fewer cost tactics.37,38 As an example, comparing with the different solvents used to synthesize the nanomaterials, it is evidenced that using water as a solvent offers better photocatalytically active morphology and crystallite size.39
Herein, reducing the agglomeration/agglomeration problem by using PVA, diminishing the recombination problem by coupling with Mn2O3, surface area improvement, and applying water as a solvent to reduce the solvent risk have been the novelty of this work. The physical property of the synthesized materials was characterized by potential analytical techniques and confirmed the presence of noticeable surface area, porosity, and charge transfer improvement. The potential of the synthesized materials was also tested on the photocatalytic degradation of dye and disinfection of bacteria.
2. Results and Discussion
2.1. Crystallinity and Compositional Analysis
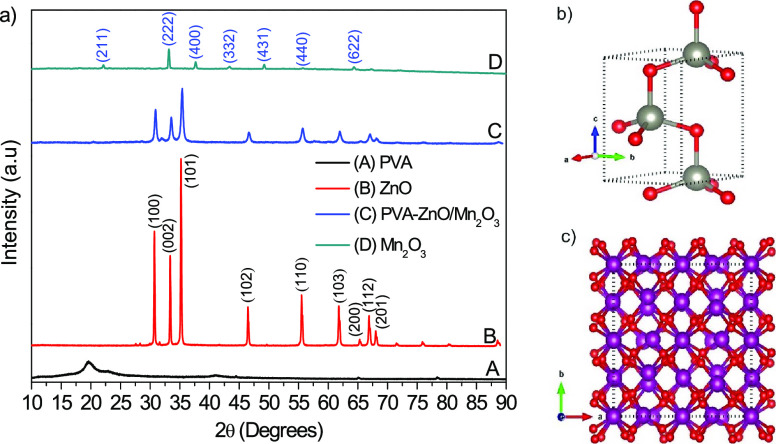
Figure 1a shows the XRD diffraction patterns that prove the crystallinity and composition of ZnO, Mn2O3, and PVA-ZnO/Mn2O3. The diffraction angles with their corresponding crystal planes appeared at ∼32° (100), 34° (002), 36°(101), 47° (102), 57° (110), 63° (103), 66° (200), 68° (112), 69° (201), 73° (004), and 77° (202) corresponds to the ZnO crystal structure. The diffraction peaks of ZnO that appeared on the XRD patterns are indexed to the wurtzite type of the hexagonal phase with an ICSD card number 00-036-1451 and belong to the P63mc (#186-1) space group. The diffraction angles with their corresponding crystal planes of ∼22° (211), 33° (222), 38° (400), 43° (332), 49° (431), 56° (440), and 64° (622) are matching with those of α-Mn2O3 (ICSD number 24342, P1 (#1-1) space group). The structures of stable ZnO and Mn2O3 crystals were developed using VESTA 3D visualization program software depending on the American mineralogist crystal structure database cif data search. The results are presented in Figure 1b,c, for ZnO and Mn2O3, respectively. On the comparative evaluation of the XRD pattern of single ZnO with that of the PVA-ZnO/Mn2O3 nanocomposite, except peak intensity reduction and width widening, no extra diffraction peaks, as well as band shifts, were observed. As the amount of the manganese precursor is only 4%, no peak for Mn2O3 appeared in the XRD pattern of PVA-ZnO/Mn2O3. The nonappearance of any band position shift also indicates the absence of any structural distortion on ZnO, which could be attributed to Mn3+ inclusion.13
Figure 1.
(a) XRD patterns of PVA, ZnO, PVA-ZnO/Mn2O3, and Mn2O3; the ball-and-stick style crystal structures of (b) ZnO and (c) Mn2O3 (red is for the O atom) calcined at 500 °C.
The sharpness of the peaks for ZnO synthesized without PVA shows a higher crystallinity with a crystallite size of 59 nm. The broadness of the peaks for the PVA-ZnO/Mn2O3 nanocomposite synthesized using PVA indicates its low crystallinity with a smaller crystallite size of 23 nm; it shows the presence of the amorphous phase in addition to crystalline. The crystallite size of ZnO and PVA-ZnO/Mn2O3 is calculated using the Debye–Scherrer’s formula (eq 1).
| 1 |
where λ is the wavelength of X-ray radiation (for Cu, 0.15418 nm), K is a constant close to unity, β is the full width at half maximum (FWHM) in 2θ scales, and θ is the angle of the considered Bragg reflection.40
2.2. Textural Analysis
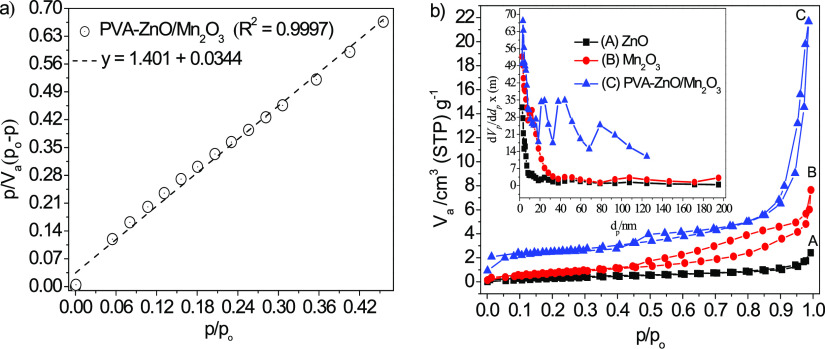
The presence of larger pore volumes and higher specific surface areas are the most relevant parameters for the optimized photocatalyst and its photocatalytic performance.41 The BET method is the most widely used procedure for measuring the surface area of the materials. Based on the density functional theory and molecular simulation at 77 K (boiling points of N2 gas), N2 gas was utilized as an adsorbate for the characterization of the texture of porous materials. For efficient applications, the physical features of the materials should have an efficient number of surface-active sites that support a high adsorption rate and displace the reactant molecule through the interconnected porous framework.41 The cylindrical, ink-bottled, and slit-shaped are the three basic pore shape models; the ZnO, Mn2O3, and PVA-ZnO/Mn2O3 look cylindrical in shape (Figure 2b). The BET-area, a(BET), is calculated by treating the data according to the BET adsorption isotherm equation in the linear form (eq 17).42
Figure 2.
(a) Linear plot of PVA-ZnO/Mn2O3, (b) the combined BET plots of ZnO, Mn2O3, and PVA-ZnO/Mn2O3 calcined at 500 °C (Inset in (b): the respective pore size distributions based on the BJH method).
The BET value, [(P/Po)/(n(1 – P/Po))], is plotted against P/Po according to eq 17.42 This plot should yield a straight line in the approximate relative pressure range of 0.05 to 0.3. The data is considered acceptable if the linear regression value (R2) is not less than 0.995. As shown in Figure 2a, the obtained R2 value for PVA-ZnO/Mn2O3 is 0.9997. From the linear plot, the slope and the intercept are calculated by the linear regression analysis. From the slope and intercept values, nm is calculated as 1/(slope + intercept), and C is calculated as (slope/intercept) + 1. Then, from the nm value, the specific surface area in m2·g–1 is calculated by eq 18.42
According to IUPAC classification, among six types of adsorption isotherms (type I–VI), for mesoporous materials, an isotherm should look like a type II or/and VI. The adsorption hysteresis loop shape, which arises due to the non-overlapping of the adsorption and desorption curves, has a close correlation with the size distribution, shape, and connectivity of the pores. The type H1 adsorption hysteresis loop looks like agglomerates of the cylindrical-like pore; type H2 looks like bottleneck constrictions; type H3 looks slit-shaped pores; the type H4 hysteresis loop looks narrow slit pores.43 The loops observed for ZnO, Mn2O3, and PVA-ZnO/Mn2O3 appears to follow a typical type IV isotherm with an H3 hysteresis loop (Figure 2b). High adsorption capacities and sharp inflection at high relative pressure (P/Po > 0.8) for PVA-ZnO/Mn2O3 signify the coexistence of macropore and mesopore size distributions.44 The capillary condensation step at a relative pressure of 0.40–0.85 on PVA-ZnO/Mn2O3 reveals the presence of a narrow pore size distribution.
The pore size distribution of porous NPs is expressed in terms of the Barrett–Joyner–Halenda (BJH) curve. According to IUPAC classification, depending on the pore sizes, porous materials were classified as microporous (<2.0 nm), mesoporous (2.0–50.0 nm), and macroporous (>50.0 nm).28,45 The size of mesopores in the architecture of ZnO, Mn2O3, and PVA-ZnO/Mn2O3 was not uniform and lay in size ranging from 5 to 50 nm in diameter. The appearance of peaks at 50 and 25 nm for ZnO and PVA-ZnO/Mn2O3, respectively, indicates the domination of mesopores distribution (Figure 2b inset). Also, the peaks at ∼80 nm for PVA-ZnO/Mn2O3 indicates the presence of macroporous distribution.44 The relatively large surface areas and narrow mesopore channels provide enough space and facilitate the rapid diffusion of molecules. The porous nature of the material also accounts for the increase in the photocatalytic degradation activity.46,47
2.3. Optical Analysis
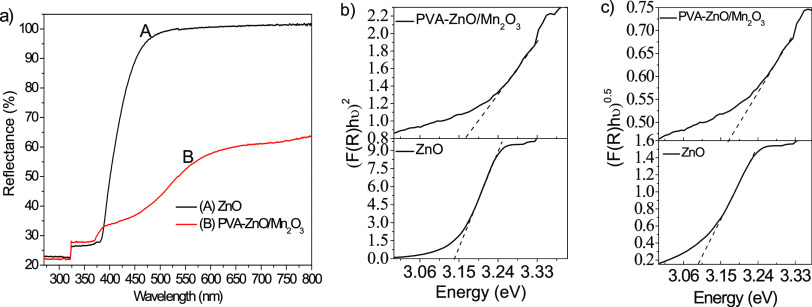
The optical properties with Kubelka–Munk (K–M) plots of ZnO and PVA-ZnO/Mn2O3 were studied using UV–vis-DRS spectroscopy (Figure 3a). The UV–vis-DRS spectra of ZnO and PVA-ZnO/Mn2O3 showed a characteristic absorption edge near 400 nm. The pure ZnO showed high reflectance in the visible region, which is possibly due to the broad band gap energies of ZnO NPs (3.17 eV) that respond in the UV region. The PVA-ZnO/Mn2O3 showed low reflectance in the visible range due to increased porosity/surface imperfection.48
Figure 3.
(a) DRS plot of ZnO and PVA-ZnO/Mn2O3, the respective (b) direct and (c) indirect Kubelka–Munk plots.
The absorption spectra of pure ZnO and PVA-ZnO/Mn2O3 is calculated using the K–M equation (eq 2) in the restrictive case dense sample:
| 2 |
where F(R) is the K–M function; K is the K–M molar absorption coefficient. As explained, if the catalyst scatters in a perfectly diffuse form, K becomes equal to 2α.39 Furthermore, in the parabolic band structure, the band gap Eg and the absorption coefficient of a direct band gap semiconductor α are related through eq 3:
| 3 |
where hν is the photon energy, and A is the proportionality constant. Taking the K–M scattering coefficient S as a constant concerning the wavelength and using the remission function in eq 2, the following expression is derived (eq 4):
| 4 |
The K–M function, F(R) is defined as eq 5:
| 5 |
The molar absorption coefficient K is defined as eq 6:
| 6 |
The scattering factor S is defined as eq 7:
| 7 |
where R is the reflectance of the materials and is defined as eq 8
| 8 |
The PVA-ZnO/Mn2O3 nanocomposite showed a broad absorption band across the measured wavelength compared to that of ZnO. It may also show enhancement of the wide-ranging light absorption efficiency. As shown in Figure 3a, the coupling of other metal oxides with ZnO has a crucial effect on the optical reflectance property. The band gap energies of pure ZnO and PVA-ZnO/Mn2O3 were measured by extrapolation of the linear portion of direct K–M function plots of [F(R)hν]2 as the y axis vs (hν) as the x axis. However, no notable band energy changes between ZnO and PVA-ZnO/Mn2O3 nanocomposite were detected, as shown on the direct and indirect K–M plots (Figure 3b,c, respectively). As confirmed on the XRD pattern analysis, this is due to the non-incorporation of Mn3+ ions into the ZnO crystalline lattice.
2.4. Chemical Bonding Analysis
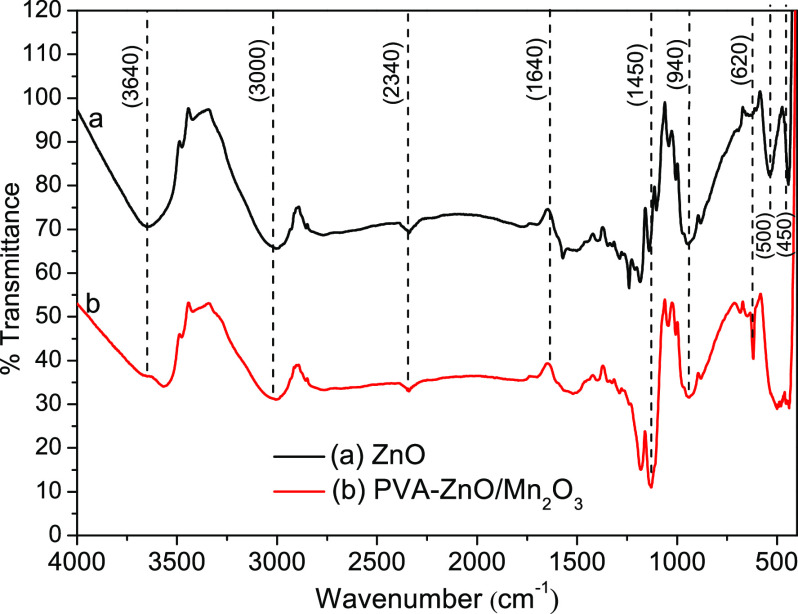
Figure 4 shows the FTIR spectra that give the chemical bonding information of the ZnO and PVA-ZnO/Mn2O3 nanocomposite. The usual broad absorption bands around ∼3600 and ∼1650 cm–1 can be attributed to the stretching vibration of the chemisorbed hydroxyl groups and physisorbed water molecules. The semiconductor metal oxides exhibit a strong absorption band below 1000 cm–1 (in the fingerprint region), which is due to the interatomic vibration. The FTIR spectrum of ZnO shows a characteristic absorption band in the range between 400 and 550 cm–1. The shape, number, and wavenumber position of these bands are dependent on the chemical composition, morphology, and crystal structure of the materials. If the morphology of the materials changes from spherical (zero) dimension to one, two, or three-dimensional morphology, the broadness and splitting also vary.49,50 The ZnO showed a split absorption peak; the PVA-ZnO/Mn2O3 nanocomposite showed one absorption band at 550 cm–1. These bands are correlated with the transverse-optical (TO)- and longitudinal-optical (LO)-phonon frequency.51
Figure 4.
FTIR spectra of ZnO NPs and PVA-ZnO/Mn2O3 calcined at 500 °C.
The absorption peaks that appeared at ∼1640 and 1400 cm–1 are due to C=C and C–C or/and C=O/C–O stretching vibrations, respectively. The absorption peak that appeared at ∼3000 cm–1 is due to CH2 symmetric and asymmetric stretching vibrations.52 The other not assigned peaks are from the intermediate impurities created during synthesis.53,54 Compared to the broad absorption band of ZnO, the absorption band shift toward a lower wavenumber for PVA-ZnO/Mn2O3 is due to the surface passivation influences of PVA during synthesis. Indirectly, it indicates the presence of hydrogen bonds between the PVA (O–H group) and metal oxide surface.29
2.5. Morphology and Microstructure Analysis
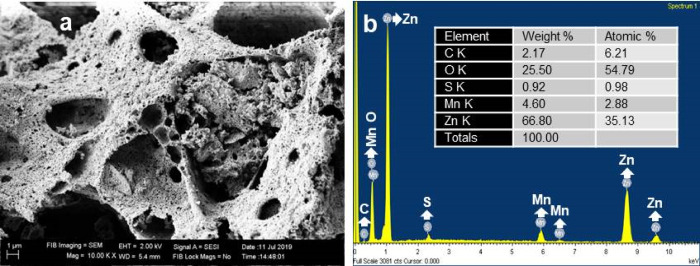
To gain a detailed understanding of the morphological and microstructure properties of the PVA-ZnO/Mn2O3, the SEM image with EDXS spectra (Figure 5a), and the bright-field TEM image (Figure 6a–c) analyses were accomplished. The SEM image of the PVA-ZnO/Mn2O3 clearly indicated the presence of a highly porous surface. As confirmed on the N2 adsorption study, the porosity of PVA-ZnO/Mn2O3, which provides sufficient active sites for the adsorption of pollutant, is more visible than ZnO. The Zn, Mn, and O elements, which were not detected on the SEM images and XRD pattern analysis, are confirmed by EDXS analysis. The result shows the presence of predictable Zn, Mn, and O elements at 1, 0.5, and 0.5 keV, respectively. The sources for C and S impurities are from the precursors and PVA decompositions (Figure 5b).
Figure 5.
Morphological analysis of PVA-ZnO/Mn2O3: (a) SEM image and (b) EDXS spectra calcined at 500 °C. Inset in (b) is the elemental weight % and atomic % results.
Figure 6.
Morphological analysis of PVA-ZnO/Mn2O3: (a) TEM and (b) HRTEM images calcined at 500 °C. Inset in (b) is the XRD pattern; insets in (c) are the (1) magnified lattice fringes and (2) the IFFT pattern.
The TEM images of PVA-ZnO/Mn2O3 showed the presence of different sized nanoscale particles with a diameter ranging from 15–60 nm. It is in good agreement with the result obtained from the XRD pattern. On the interface of the PVA-ZnO/Mn2O3 nanocomposite, an oriented attachment that occurred due to fission as a driving force, the NPs share a common crystallographic orientation and improve the charge transfer properties of the PVA-ZnO/Mn2O3.55,56 As shown in the HRTEM image of PVA-ZnO/Mn2O3 (Figure 6c), the lattice fringes are noted on the whole surface. As determined by Gatan microscopy suit software, the lattice fringe with an adjacent d-spacing value of 0.34 nm corresponds to the (221) atomic plane of α-Mn2O3.57 It may indicate the presence of heterojunctions between the metal oxides with sufficient interfacial contact. The lattice fringes for ZnO are not detected on the HRTEM image of PVA-ZnO/Mn2O3, which is possibly due to the random magnifying of the crystal during HRTEM analysis. However, Zn in EDXS spectra with a high percentage and two distinctive morphologies in Figure 6a showed the presence of ZnO. Figure 6c insets are the magnified image (1) and the inverse fast Fourier transmission (IFFT) pattern (2) of α-Mn2O3. The occurrence of stacking faults on the surface of the NPs (see the IFFT image) suggests the semicrystalline nature of the material.
The circular pattern of the reflected random aggregates in the fast Fourier transform selected-area electron diffraction (SAED) pattern analysis confirms the existence of ZnO NPs (Figure 6b). The measured interplanar spacing of diffraction rings on the SAED pattern (0.2900, 0.2540, 0.2042, 0.1671, 0.1609, 0.1652, 0.1297, 0.1500, and 0.1070 nm) matches with the hexagonal wurtzite structure as detected on the XRD pattern (Figure 6b, inset). The diffuse ring pattern on the SAED image indicates the presence of some amorphous region on the sample. The presence of several bright diffraction spots on the rings corroborates the crystallinity of the ZnO. The spots present outside of the rings are due to the α-Mn2O3.58
2.6. Photocatalytic Activity and Mechanism
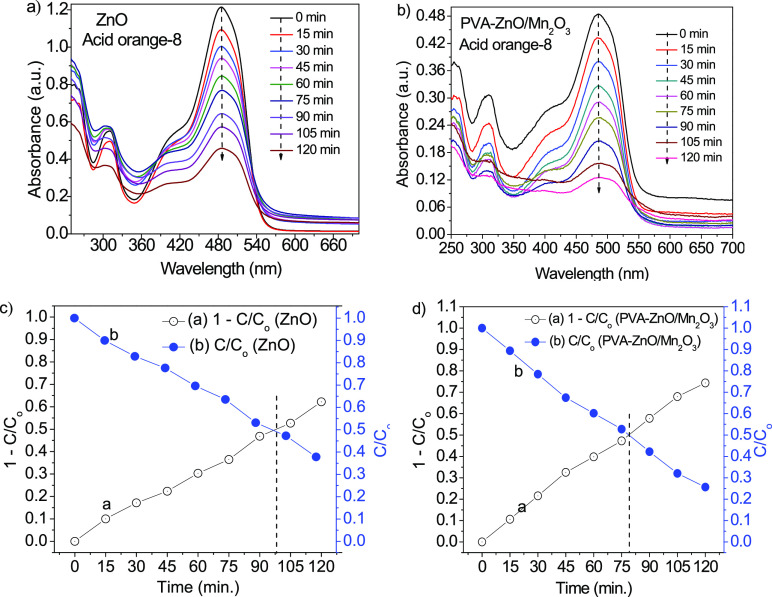
The porosity in materials was found to add more surface defects that improves light absorption efficiency and increase the photocatalytic degradation activity.47,59 The several past studies18−22 revealed the fact that the charge transfer improvement of ZnO is due to the formation of a heterojunction with manganese oxides. In the study of the reflectance spectra of UV–vis-DRS analysis, we did not observe a band gap redshift due to Mn2O3 incorporation on PVA-ZnO/Mn2O3 nanocomposite spectra; therefore, we used a UV-light lamp as an irradiation source. The photodegradation of the ZnO and PVA-ZnO/Mn2O3 were studied using acid orange-8 dye at a maximum absorption wavelength of 484 nm (Figure 7a,b, respectively). The ZnO and PVA-ZnO/Mn2O3 exhibited 9.85 and 10.6% dye degradation for the first 15 min, respectively. At 120 min, a maximum degradation of 62.2% was recorded for ZnO and 74.35% for PVA-ZnO/Mn2O3. The obtained equilibrium constant (k) value for ZnO and PVA-ZnO/Mn2O3 was 0.005819 and 0.008646 min.–1, respectively. From the contact point of 1–C/Co vs t and C/Co vs t plots (Figure 7c,d), the obtained degradation half-life values were found to be approximately 98 min for ZnO and 79 min for PVA-ZnO/Mn2O3.
Figure 7.
Photocatalytic activities: (a, b) absorbance vs wavelength plots and (c, d) 1–C/Co vs t and C/Co vs t plots for ZnO and PVA-ZnO/Mn2O3, respectively.
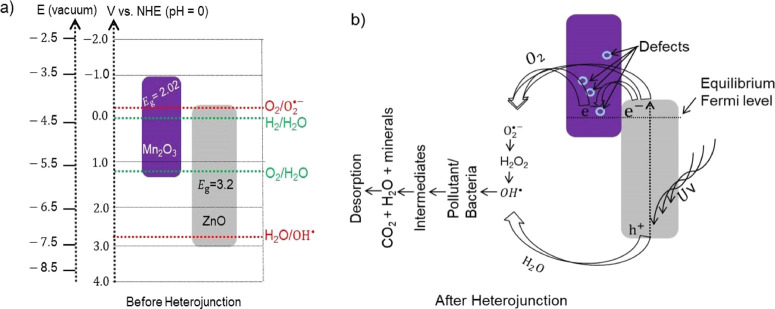
The metal oxides have a unique electronic configuration/band gap that facilitates the absorption of a characteristic wavelength of light. However, the band edge positions of metal oxides are dependent on the surface charge.60 For an efficient photocatalytic reaction, the bottom of the CB needs to be more negative than the redox potential of H+/H2, and the top of the VB needs to be more positive than the redox potential of O2/H2O.61,62 Also, it is beneficial for the oxidation potential of the hydroxyl radicals and the reduction potential of peroxide radicals to be in between the band gap of the catalyst from the thermodynamic point of view.63 It helps for the subsequent transfer of electrons from the more negative CB potential to lower CB potential and holes from the less negative VB potential to more negative VB potential. Depending on the electronegativity values of metal oxides,64 the redox potential of n-type ZnO and p-type Mn2O318,57,65 before the heterojunction is studied as seen in Figure 8a. For this work, a possible photocatalytic mechanism after heterojunctions was developed, as shown in Figure 8b.
Figure 8.
(a) Band gap energy and band edge positions of ZnO and Mn2O3 before a heterojunction and (b) a proposed possible mechanism after heterojunctions.
During the formation of the heterojunction, the Fermi levels of metal oxides need to attain a stable equilibrium stage. For equilibration, their energy band starts to move up and down by transferring electrons. This electron drift, until the Fermi level equalizes, occurs due to the presence of difference in the work function.13,66 Then, a depletion layer that has a significant role in the electron transfer capability developed at the interface of the heterojunctions.67 It is important to note that the Fermi level of p-type Mn2O3 exists near to its VB. During UV irradiation, the photogenerated electrons either localize on the ZnO CB or may diffuse to the different defects/imperfection of the Mn2O3; the defects/surface imperfection occurred due to the porous nature of the material.48 The electron then reacts with oxygen and forms a hydroxyl radical after passing some intermediates. The hole reacts with water from the solution and produces hydroxyl radicals. The formed oxidizing agent, hydroxyl radical, reacts with organic pollutants/bacteria and results in nontoxic byproducts. Therefore, the recombination of the electrons and holes diminish and results in the enhancement of photocatalytic activity.13Figure 8b shows the main steps involved in the reaction process of photocatalytic degradation under UV light irradiation.
2.7. Antibacterial Activity
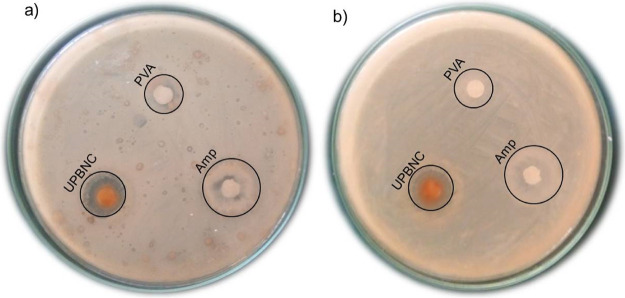
As reported from the author’s earlier works,68,69 ZnO is not showing antibacterial activity for both Gram-negative and Gram-positive bacteria. It is because of its higher crystallite size compared to the nanocomposite.70 The calcined (at 500 °C) PVA-aided binary nanocomposite showed good antibacterial activity with a 23 mm zone of inhibition on E. coli bacteria.68 The enhanced antibacterial activity for the composites is due to their increased surface area, which provides superior contact with the surface of the bacteria. Figure 9 shows the antibacterial activities of PVA and uncalcined PVA-ZnO/Mn2O3. The obtained antibacterial activity on E. coli and S. aureus bacteria is 8 and 6 nm for PVA and 14 and 13 mm for uncalcined PVA-ZnO/Mn2O3, respectively. It shows that PVA is not showing antibacterial activity compared to the uncalcined PVA-ZnO/Mn2O3. However, the uncalcined PVA-ZnO/Mn2O3 has lower activity compared to the calcined binary68 and ternary69 nanocomposites. At a lower drying temperature of 110 °C, the PVA polymer does not decompose completely. The insignificantly decomposed PVA may block the active sites of the ZnO/Mn2O3 nanocomposite. That is why the antibacterial activities of the uncalcined nanocomposite become less active compared to calcined.
Figure 9.
Antibacterial activity of poly(vinyl alcohol) (PVA), ampicillin (Amp), and uncalcined PVA-ZnO/Mn2O3 (UPBNC) toward (a) E. coli and (b) S. aureus bacteria.
Interaction of NPs with microorganisms, the formation of ROS by the effect of light radiation, and the release of ions are the main mechanisms of bacterial death.71 As confirmed from the XRD pattern and UV–vis-DRS spectroscopic analyses, the non-appearance of any band position shift indicates the absence of any structural distortion in ZnO, which could be attributed to the incorporation of Mn3+. Thus, the interaction of NPs with microorganisms and the formation of ROS are the likely mechanisms for this work.
3. Conclusions
The development of advanced materials with modified heterojunctions is the current necessity for environmental protection and nanomedicine applications. The sol–gel and self-propagation procedures were applied for the synthesis of a porous PVA-ZnO/Mn2O3 nanocomposite. Using the XRD pattern analysis, the average approximate crystallite sizes of ZnO and PVA-ZnO/Mn2O3 were found to be 59 and 23 nm. The BET analysis confirmed the presence of an enhanced surface area and suitable pore size distribution for PVA-ZnO/Mn2O3, compared to ZnO. The porous nature of the PVA-ZnO/Mn2O3 and certainty of the Zn, Mn, and O elemental compositions were confirmed from SEM and EDXS studies, respectively. The porosity of the composite and actuality of the Mn2O3 were further understood from the respective SAED ring and HRTEM image examination. The obtained equilibrium constant (k) values for ZnO and PVA-ZnO/Mn2O3 were 0.005819 and 0.008646 min.–1, respectively. The obtained inhibition zone for uncalcined PVA-ZnO/Mn2O3 on E. coli bacteria was found to be 14 nm, which appears to be lower when compared to the activity of the calcined PVA-ZnO/Mn2O3 nanocomposite. The authors recommend the investigation of the formation of heterojunctions between metal oxides by electrochemical and XPS techniques as a future work.
4. Materials and Methods
4.1. Chemicals
Common analytical grade reagents used are zinc nitrate hexahydrate (Zn(NO3)2·6H2O, ≥98%, Sigma–Aldrich), manganese sulfate (MnSO4·H2O, 99%, Sigma–Aldrich), acid orange-8 (Sigma–Aldrich), poly(vinyl alcohol) (PVA, Thermo Fisher Scientific India Pvt. Ltd.).
4.2. Synthesis of Single and Binary Metal Oxides
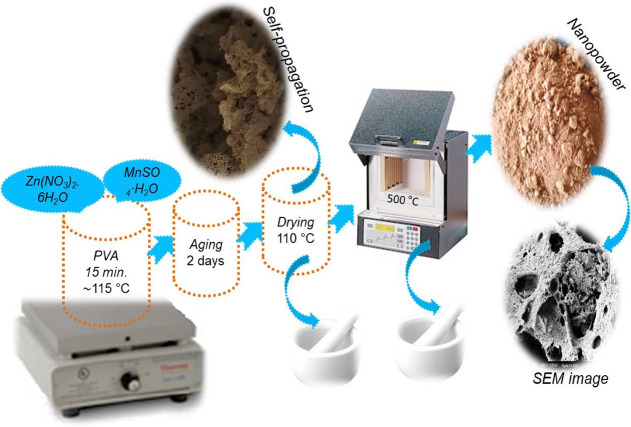
To synthesize the porous PVA-ZnO/Mn2O3, first, the PVA polymer was dissolved in distilled water while stirring on a magnetic stirrer for about 15 min (at ∼115 °C).72 The purpose of using PVA is to delay cation mobility and to minimize unwanted aggregation/agglomeration of the metal oxides.37 Then, the Zn(NO3)2·6H2O and MnSO4·H2O precursors were added to the above dissolved and cooled PVA polymer solution to form a 0.01 M solution. The sol formed (colloidal particles of metal hydroxides) was aged for two days to form a gel (−M–O–M−) and dried in an oven at about 110 °C for about 8 h. The aging time of the sol has a critical effect on the surface area/crystallinity of the materials.73 At the final drying step, the unintentional self-propagation process took place, and a porous product formed. The product was crushed carefully using a mortar and pestle to reduce the size of the self-propagated material. Finally, the powder was calcined at 500 °C for 3 h, and a pure metal oxide nanocomposite developed. Figure 10 shows a scheme showing the PVA-ZnO/Mn2O3 synthesis procedure. To synthesize single ZnO and Mn2O3 without PVA, except for the first procedure used to dissolve the PVA polymer, the same protocol was followed. However, due to the absence of the polymer, no self-propagation process occurred during the final drying step.
Figure 10.
Scheme showing the sol–gel followed by the self-propagation synthesis procedure.
4.3. Photocatalytic Activity
The photocatalytic experiments were conducted by taking 20 ppm of acid orange-8 dye in 250 mL of aqueous solution and 0.06 g of a ZnO or PVA-ZnO/Mn2O3 catalyst. The experiment was achieved by using a 176.6 cm2 circular glass reactor under 125 W mercury vapor lamp irradiation. By taking 5 mL of the dye solution every 15 min, the concentration at time t is measured using a UV–vis spectrophotometer. The pseudo-first-order kinetic equation (eq 9) was applied to study reaction dynamics.
| 9 |
where Co and C are the initial concentration of the dye solution and its residual concentration after irradiation at a time t, respectively, and k is a pseudo-first-order kinetics constant.
4.4. Antibacterial Activity
The in vitro antibacterial activity of PVA and uncalcined PVA-ZnO/Mn2O3 was carried out by the disk diffusion method, and the commercial antibiotic ampicillin was used as a standard positive control. As per the manufacturer procedure, the nutrient broth medium was prepared and autoclaved at 121 °C for 15 min. The prepared medium was poured into a test tube (4–5 mL/test tube) and was allowed to cool for some time at room temperature. Then, the pure bacterial strain was inoculated and incubated at 37 °C for 24 h. The turbidity of the cultured bacterial strains was adjusted as per 0.5 McFarland standards (a mixture of 0.5 mL of 0.048 M BaCl2 and 99.5 mL of 0.18 M H2SO4). For the antibacterial susceptibility test, as per the manufacturer procedure, the Muller Hinton agar was prepared and autoclaved at 121 °C for 15 min. The prepared medium was poured into a petri dish (25–30 mL/plate). After solidification under sterilized conditions, the grown culture was seeded on the petri dish overnight after evenly swabbing with the help of a cotton swab. The antibacterial activities of PVA and uncalcined PVA-ZnO/Mn2O3 were evaluated using a 125 μg mL–1 concentration as optimized from the authors’ earlier works.68,69 It is measured in terms of zone of inhibition by measuring with a ruler in millimeters (mm). The bacteria used for the tests are Escherichia coli (E. coli) (ATCC 25922) and Staphylococcus aureus (S. aureus) (ATCC 25923).
4.5. Analytical Techniques
The optical properties of the synthesized materials were characterized by UV–vis diffuse reflectance spectroscopy (UV–vis-DRS). Chemical bonding information of the samples was obtained using a Fourier transform infrared (FTIR) spectroscopy. The detailed morphological and crystal structure of the as-synthesized material was characterized by scanning electron microscopy with energy-dispersive X-ray spectroscopy (SEM-EDXS) and transmission electron microscopy (TEM). The crystallinity and composition were characterized by an X-ray diffractometer (XRD). The specific surface areas and pore volumes were characterized by Brunauer–Emmett–Teller (BET) analysis; the equilibrium concentration of pollutants was measured using a UV–vis spectrophotometer (SM-1600).
Acknowledgments
This study was supported by the Adama Science and Technology University. We thank the applied chemistry and applied biology departments for providing us the lab facility and materials.
Author Contributions
B.A. conducted the experiments with the conception of the idea and initial write-up of the manuscript. Final write-up improvement and supervision is by H.C.A.M. and E.A.Z.
The authors declare no competing financial interest.
References
- Pirhashemi M.; Habibi-Yangjeh A.; Rahim Pouran S. Review on the Criteria Anticipated for the Fabrication of Highly Efficient ZnO-Based Visible-Light-Driven Photocatalysts. J. Ind. Eng. Chem. 2018, 62, 1–25. 10.1016/j.jiec.2018.01.012. [DOI] [Google Scholar]
- Subbareddy Y.; Kumar R. N.; Sudhakar B. K.; Reddy K. R.; Martha S. K.; Kaviyarasu K. A Facile Approach of Adsorption of Acid Blue 9 on Aluminium Silicate-Coated Fuller’s Earth––Equilibrium and Kinetics Studies. Surf. Interfaces 2020, 19, 100503. 10.1016/j.surfin.2020.100503. [DOI] [Google Scholar]
- Kaviyarasu K.; Maria Magdalane C.; Jayakumar D.; Samson Y.; Bashir A. K. H.; Maaza M.; Letsholathebe D.; Mahmoud A. H.; Kennedy J. High Performance of Pyrochlore like Sm2Ti2O7 Heterojunction Photocatalyst for Efficient Degradation of Rhodamine-B Dye with Waste Water under Visible Light Irradiation. J. King Saud Univ., Sci. 2020, 32, 1516–1522. 10.1016/j.jksus.2019.12.006. [DOI] [Google Scholar]
- Alhaji N. M. I.; Nathiya D.; Kaviyarasu K.; Meshram M.; Ayeshamariam A. A Comparative Study of Structural and Photocatalytic Mechanism of AgGaO2 Nanocomposites for Equilibrium and Kinetics Evaluation of Adsorption Parameters. Surf. Interfaces 2019, 17, 100375. 10.1016/j.surfin.2019.100375. [DOI] [Google Scholar]
- Panimalar S.; Uthrakumar R.; Selvi E. T.; Gomathy P.; Inmozhi C.; Kaviyarasu K.; Kennedy J. Studies of MnO2/g-C3N4 Hetrostructure Efficient of Visible Light Photocatalyst for Pollutants Degradation by Sol-Gel Technique. Surf. Interfaces 2020, 20, 100512. 10.1016/j.surfin.2020.100512. [DOI] [Google Scholar]
- Magdalane C. M.; Kaviyarasu K.; Priyadharsini G. M. A.; Bashir A. K. H.; Mayedwa N.; Matinise N.; Isaev A. B.; Abdullah Al-Dhabi N.; Arasu M. V.; Arokiyaraj S.; Kennedy J.; Maaza M. Improved Photocatalytic Decomposition of Aqueous Rhodamine-B by Solar Light Illuminated Hierarchical Yttria Nanosphere Decorated Ceria Nanorods. J. Mater. Res. Technol. 2019, 8, 2898–2909. 10.1016/j.jmrt.2018.11.019. [DOI] [Google Scholar]
- Kaviyarasu K.; Maria Magdalane C.; Kanimozhi K.; Kennedy J.; Siddhardha B.; Subba Reddy E.; Rotte N. K.; Sharma C. S.; Thema F. T.; Letsholathebe D.; Mola G. T.; Maaza M. Elucidation of Photocatalysis, Photoluminescence and Antibacterial Studies of ZnO Thin Films by Spin Coating Method. J. Photochem. Photobiol., B 2017, 173, 466–475. 10.1016/j.jphotobiol.2017.06.026. [DOI] [PubMed] [Google Scholar]
- Orudzhev F.; Ramazanov S.; Sobola D.; Isaev A.; Wang C.; Magomedova A.; Kadiev M.; Kaviyarasu K. Atomic Layer Deposition of Mixed-Layered Aurivillius Phase on Tio2 Nanotubes: Synthesis, Characterization and Photoelectrocatalytic Properties. Nanomaterials 2020, 10, 2183. 10.3390/nano10112183. [DOI] [Google Scholar]
- Bharti B.; Kumar S.; Lee H.-N.; Kumar R. Formation of Oxygen Vacancies and Ti3+ State in TiO2 Thin Film and Enhanced Optical Properties by Air Plasma Treatment. Sci. Rep. 2016, 6, 32355. 10.1038/srep32355. [DOI] [PMC free article] [PubMed] [Google Scholar]
- Mobeen A.; Maria Magdalane C.; Jasmine Shahina S. K.; Lakshmi D.; Sundaram R.; Ramalingam G.; Raja A.; Madhavan J.; Letsholathebe D.; Bashir A. K. H.; Maaza M.; Kaviyarasu K. Investigation on Antibacterial and Photocatalytic Degradation of Rhodamine-B Dye under Visible Light Irradiation by Titanium Molybdate Nanoparticles Prepared via Microwave Method. Surf. Interfaces 2019, 17, 100381. 10.1016/j.surfin.2019.100381. [DOI] [Google Scholar]
- Zhang Y.; Su P.; Weathersby D.; Zhang Q.; Zheng J.; Fan R.; Zhang J.; Dai Q. Synthesis of γ-Fe2O3-ZnO-Biochar Nanocomposites for Rhodamine B Removal. Appl. Surf. Sci. 2020, 501, 144217. 10.1016/j.apsusc.2019.144217. [DOI] [Google Scholar]
- Mohd Adnan M. A.; Julkapli N. M.; Abd Hamid S. B. Review on ZnO Hybrid Photocatalyst: Impact on Photocatalytic Activities of Water Pollutant Degradation. Rev. Inorg. Chem. 2016, 36, 77–104. 10.1515/revic-2015-0015. [DOI] [Google Scholar]
- Lachheb H.; Ajala F.; Hamrouni A.; Houas A.; Parrino F.; Palmisano L. Electron Transfer in ZnO–Fe2O3 Aqueous Slurry Systems and Its Effects on Visible Light Photocatalytic Activity. Catal. Sci. Technol. 2017, 7, 4041–4047. 10.1039/C7CY01085K. [DOI] [Google Scholar]
- Abebe B.; Murthy H. C. A.; Amare E. Enhancing the Photocatalytic Efficiency of ZnO: Defects, Heterojunction, and Optimization. Environ. Nanotechnol. Monit. Manage. 2020, 14, 100336. 10.1016/j.enmm.2020.100336. [DOI] [Google Scholar]
- Jiamprasertboon A.; Kafizas A.; Sachs M.; Ling M.; Alotaibi A. M.; Lu Y.; Siritanon T.; Parkin I. P.; Carmalt C. J. Heterojunction Α-Fe2O3 /ZnO Films with Enhanced Photocatalytic Properties Grown by Aerosol-Assisted Chemical Vapour Deposition. Chem. – Eur. J. 2019, 25, 11337–11134. 10.1002/chem.201902175. [DOI] [PubMed] [Google Scholar]
- Bozkurt Çırak B.; Caglar B.; Kılınç T.; Morkoç Karadeniz S.; Erdoğan Y.; Kılıç S.; Kahveci E.; Ercan Ekinci A.; Çırak Ç. Synthesis and Characterization of ZnO Nanorice Decorated TiO2 Nanotubes for Enhanced Photocatalytic Activity. Mater. Res. Bull. 2019, 109, 160–167. 10.1016/j.materresbull.2018.09.039. [DOI] [Google Scholar]
- Chiang Y.-J.; Lin C.-C. Photocatalytic Decolorization of Methylene Blue in Aqueous Solutions Using Coupled ZnO/SnO2 Photocatalysts. Powder Technol. 2013, 246, 137–143. 10.1016/j.powtec.2013.04.033. [DOI] [Google Scholar]
- Saravanan R.; Gupta V. K.; Narayanan V.; Stephen A. Visible Light Degradation of Textile Effluent Using Novel Catalyst ZnO/γ-Mn2O3. J. Taiwan Inst. Chem. Eng. 2014, 45, 1910–1917. 10.1016/j.jtice.2013.12.021. [DOI] [Google Scholar]
- Qamar M. T.; Aslam M.; Rehan Z. A.; Soomro M. T.; Basahi J. M.; Ismail I. M. I.; Almeelbi T.; Hameed A. The Influence of P-Type Mn3O4 Nanostructures on the Photocatalytic Activity of ZnO for the Removal of Bromo and Chlorophenol in Natural Sunlight Exposure. Appl. Catal., B 2017, 201, 105–118. 10.1016/j.apcatb.2016.08.004. [DOI] [Google Scholar]
- Yu W.; Liu T.; Cao S.; Wang C.; Chen C. Constructing MnO2/Single Crystalline ZnO Nanorod Hybrids with Enhanced Photocatalytic and Antibacterial Activity. J. Solid State Chem. 2016, 239, 131–138. 10.1016/j.jssc.2016.04.027. [DOI] [Google Scholar]
- Wang R.; Hao Q.; Feng J.; Wang G. C.; Ding H.; Chen D.; Ni B. Enhanced Separation of Photogenerated Charge Carriers and Catalytic Properties of ZnO-MnO2 Composites by Microwave and Photothermal Effect. J. Alloys Compd. 2019, 786, 418–427. 10.1016/j.jallcom.2019.02.009. [DOI] [Google Scholar]
- Saravanan R.; Khan M. M.; Gupta V. K.; Mosquera E.; Gracia F.; Narayanan V.; Stephen A. ZnO/Ag/Mn2O3 Nanocomposite for Visible Light-Induced Industrial Textile Effluent Degradation, Uric Acid and Ascorbic Acid Sensing and Antimicrobial Activity. RSC Adv. 2015, 5, 34645–34651. 10.1039/C5RA02557E. [DOI] [Google Scholar]
- Yang G.; Yan W.; Wang J.; Yang H. Fabrication and Formation Mechanism of Mn2O3 Hollow Nanofibers by Single-Spinneret Electrospinning. CrystEngComm 2014, 16, 6907–6913. 10.1039/C4CE00521J. [DOI] [Google Scholar]
- Moharreri E.; Hines W. A.; Biswas S.; Perry D. M.; He J.; Murray-Simmons D.; Suib S. L. Comprehensive Magnetic Study of Nanostructured Mesoporous Manganese Oxide Materials and Implications for Catalytic Behavior. Chem. Mater. 2018, 30, 1164–1177. 10.1021/acs.chemmater.7b05280. [DOI] [Google Scholar]
- Zhao J.; Nan J.; Zhao Z.; Li N. Facile Fabrication of Novel Mn2O3 Nanocubes with Superior Light-Harvesting for Ciprofloxacin Degradation. Catal. Commun. 2017, 102, 5–8. 10.1016/j.catcom.2017.08.018. [DOI] [Google Scholar]
- Jassby D.; Farner Budarz J.; Wiesner M. Impact of Aggregate Size and Structure on the Photocatalytic Properties of TiO2 and ZnO Nanoparticles. Environ. Sci. Technol. 2012, 46, 6934–6941. 10.1021/es202009h. [DOI] [PubMed] [Google Scholar]
- Wu Z.; Yang S.; Wu W. Shape Control of Inorganic Nanoparticles from Solution. Nanoscale 2016, 8, 1237–1259. 10.1039/c5nr07681a. [DOI] [PubMed] [Google Scholar]
- ALOthman Z. A. A Review: Fundamental Aspects of Silicate Mesoporous Materials. Materials 2012, 5, 2874–2902. 10.3390/ma5122874. [DOI] [Google Scholar]
- Hong R. Y.; Li J. H.; Chen L. L.; Liu D. Q.; Li H. Z.; Zheng Y.; Ding J. Synthesis, Surface Modification and Photocatalytic Property of ZnO Nanoparticles. Powder Technol. 2009, 189, 426–432. 10.1016/j.powtec.2008.07.004. [DOI] [Google Scholar]
- Madkour M.; Bumajdad A.; Al-sagheer F. To What Extent Do Polymeric Stabilizers Affect Nanoparticles Characteristics?. Adv. Colloid Interface Sci. 2019, 270, 38–53. 10.1016/j.cis.2019.05.004. [DOI] [PubMed] [Google Scholar]
- Mallakpour S.; Adnany Sadaty M. Preparation and Characterization of Nanocomposites Based on Poly(Vinyl Alcohol) and Vitamin B1-Modified TiO2 and Evaluation of the Optical, Mechanical, and Thermal Properties. Colloid Polym. Sci. 2016, 294, 2099–2107. 10.1007/s00396-016-3974-8. [DOI] [Google Scholar]
- Kumar S.; Krishnakumar B.; Sobral A. J. F. N.; Koh J. Bio-Based (Chitosan/PVA/ZnO) Nanocomposites Film: Thermally Stable and Photoluminescence Material for Removal of Organic Dye. Carbohydr. Polym. 2019, 205, 559–564. 10.1016/j.carbpol.2018.10.108. [DOI] [PubMed] [Google Scholar]
- Radhamani A. V.; Shareef K. M.; Rao M. S. R. ZnO@MnO2 Core–Shell Nanofiber Cathodes for High Performance Asymmetric Supercapacitors. ACS Appl. Mater. Interfaces 2016, 8, 30531–30542. 10.1021/acami.6b08082. [DOI] [PubMed] [Google Scholar]
- Ghafari E.; Feng Y.; Liu Y.; Ferguson I.; Lu N. Investigating Process-Structure Relations of ZnO Nanofiber via Electrospinning Method. Composites, Part B 2017, 116, 40–45. 10.1016/j.compositesb.2017.02.026. [DOI] [Google Scholar]
- Alder C. M.; Hayler J. D.; Henderson R. K.; Redman A. M.; Shukla L.; Shuster L. E.; Sneddon H. F. Updating and Further Expanding GSK’s Solvent Sustainability Guide. Green Chem. 2016, 18, 3879–3890. 10.1039/C6GC00611F. [DOI] [Google Scholar]
- Bumajdad A.; Nazeer A. A.; Al Sagheer F.; Nahar S.; Zaki M. I. Controlled Synthesis of ZrO2 Nanoparticles with Tailored Size, Morphology and Crystal Phases via Organic/Inorganic Hybrid Films. Sci. Rep. 2018, 8, 3695. 10.1038/s41598-018-22088-0. [DOI] [PMC free article] [PubMed] [Google Scholar]
- Ciciliati M. A.; Silva M. F.; Fernandes D. M.; de Melo M. A. C.; Hechenleitner A. A. W.; Pineda E. A. G. Fe-Doped ZnO Nanoparticles: Synthesis by a Modified Sol–Gel Method and Characterization. Mater. Lett. 2015, 159, 84–86. 10.1016/j.matlet.2015.06.023. [DOI] [Google Scholar]
- Ong C. B.; Ng L. Y.; Mohammad A. W. A Review of ZnO Nanoparticles as Solar Photocatalysts: Synthesis, Mechanisms and Applications. Renewable Sustainable Energy Rev. 2018, 81, 536–551. 10.1016/j.rser.2017.08.020. [DOI] [Google Scholar]
- Kumar Jangir L.; Kumari Y.; Kumar A.; Kumar M.; Awasthi K. Investigation of Luminescence and Structural Properties of ZnO Nanoparticles, Synthesized with Different Precursors. Mater. Chem. Front. 2017, 1, 1413–1421. 10.1039/C7QM00058H. [DOI] [Google Scholar]
- Tallapally V.; Damma D.; Darmakkolla S. R. Facile Synthesis of Size-Tunable Tin Arsenide Nanocrystals. Chem. Commun. 2019, 55, 1560–1563. 10.1039/C8CC08101H. [DOI] [PubMed] [Google Scholar]
- Rosman N.; Wan Salleh W. N.; Aziz F.; Ismail A. F.; Harun Z.; Bahri S. S.; Nagai K. Electrospun Nanofibers Embedding ZnO/Ag2CO3/Ag2O Heterojunction Photocatalyst with Enhanced Photocatalytic Activity. Catalysts 2019, 9, 565. 10.3390/catal9070565. [DOI] [Google Scholar]
- Abebe B.; H C A. M.; Zerefa E.; Abdisa E. Porous PVA/Zn–Fe–Mn Oxide Nanocomposites: Methylene Blue Dye Adsorption Studies. Mater. Res. Express 2020, 7, 065002 10.1088/2053-1591/ab94fc. [DOI] [Google Scholar]
- Saxena R.; Rodriguez O.; Cho W.; Gill W. N.; Plawsky J. L.; Baklanov M. R.; Mogilnikov K. P. Internal Matrix Structure of Low-κ Mesoporous Silica and Its Relation to Mechanical Properties. J. Non-Cryst. Solids 2004, 349, 189–199. 10.1016/j.jnoncrysol.2004.08.185. [DOI] [Google Scholar]
- Liu J.; He J.; Wang L.; Li R.; Chen P.; Rao X.; Deng L.; Rong L.; Lei J. NiO-PTA Supported on ZIF-8 as a Highly Effective Catalyst for Hydrocracking of Jatropha Oil. Sci. Rep. 2016, 6, 23667. 10.1038/srep23667. [DOI] [PMC free article] [PubMed] [Google Scholar]
- Thommes M.; Kaneko K.; Neimark A. V.; Olivier J. P.; Rodriguez-Reinoso F.; Rouquerol J.; Sing K. S. W. Physisorption of Gases, with Special Reference to the Evaluation of Surface Area and Pore Size Distribution (IUPAC Technical Report). Pure Appl. Chem. 2015, 87, 1051–1069. 10.1515/pac-2014-1117. [DOI] [Google Scholar]
- Liu Y.; Pang H.; Wei C.; Hao M.; Zheng S.; Zheng M. Mesoporous ZnO-NiO Architectures for Use in a High-Performance Nonenzymatic Glucose Sensor. Microchim. Acta 2014, 181, 1581–1589. 10.1007/s00604-014-1275-9. [DOI] [Google Scholar]
- Prabakaran E.; Pillay K. Synthesis of N-Doped ZnO Nanoparticles with Cabbage Morphology as a Catalyst for the Efficient Photocatalytic Degradation of Methylene Blue under UV and Visible Light. RSC Adv. 2019, 9, 7509–7535. 10.1039/C8RA09962F. [DOI] [PMC free article] [PubMed] [Google Scholar]
- Nsib M. F.; Naffati N.; Rayes A.; Moussa N.; Houas A. Effect of Some Operational Parameters on the Hydrogen Generation Efficiency of Ni-ZnO/PANI Composite under Visible-Light Irradiation. Mater. Res. Bull. 2015, 70, 530–538. 10.1016/j.materresbull.2015.04.067. [DOI] [Google Scholar]
- Fatehah M. O.; Aziz H. A.; Stoll S. Stability of ZnO Nanoparticles in Solution. Influence of PH, Dissolution, Aggregation and Disaggregation Effects. J. Colloid Sci. Biotechnol. 2014, 3, 75–84. 10.1166/jcsb.2014.1072. [DOI] [Google Scholar]
- Sigoli F. A.; Davolos M. R.; Jafelicci M. Jr. Morphological Evolution of Zinc Oxide Originating from Zinc Hydroxide Carbonate. J. Alloys Compd. 1997, 262-263, 292–295. 10.1016/S0925-8388(97)00404-0. [DOI] [Google Scholar]
- Yang Z.; Zong X.; Ye Z.; Zhao B.; Wang Q.; Wang P. The Application of Complex Multiple Forklike ZnO Nanostructures to Rapid and Ultrahigh Sensitive Hydrogen Peroxide Biosensors. Biomaterials 2010, 31, 7534–7541. 10.1016/j.biomaterials.2010.06.019. [DOI] [PubMed] [Google Scholar]
- Huang C.-Y.; Hu K.-H.; Wei Z.-H. Comparison of Cell Behavior on Pva/Pva-Gelatin Electrospun Nanofibers with Random and Aligned Configuration. Sci. Rep. 2016, 6, 37960. 10.1038/srep37960. [DOI] [PMC free article] [PubMed] [Google Scholar]
- Znaidi L.; Soler Illia G. J. A. A.; Benyahia S.; Sanchez C.; Kanaev A. V. Oriented ZnO Thin Films Synthesis by Sol–Gel Process for Laser Application. Thin Solid Films 2003, 428, 257–262. 10.1016/S0040-6090(02)01219-1. [DOI] [Google Scholar]
- Anžlovar A.; Kogej K.; Orel Z. C.; Žigon M. Polyol Mediated Nano Size Zinc Oxide and Nanocomposites with Poly(Methyl Methacrylate). Express Polym. Lett. 2011, 5, 604–619. 10.3144/expresspolymlett.2011.59. [DOI] [Google Scholar]
- Penn R. L.; Banfield J. F. Imperfect Oriented Attachment: Dislocation Generation in Defect-Free Nanocrystals. Science 1998, 281, 969–971. 10.1126/science.281.5379.969. [DOI] [PubMed] [Google Scholar]
- Zhang J.; Huang F.; Lin Z. Progress of Nanocrystalline Growth Kinetics Based on Oriented Attachment. Nanoscale 2010, 2, 18–34. 10.1039/B9NR00047J. [DOI] [PubMed] [Google Scholar]
- Zhao J.; Zhao Z.; Li N.; Nan J.; Yu R.; Du J. Visible-Light-Driven Photocatalytic Degradation of Ciprofloxacin by a Ternary Mn2O3/Mn3O4/MnO2 Valence State Heterojunction. Chem. Eng. J. 2018, 353, 805–813. 10.1016/j.cej.2018.07.163. [DOI] [Google Scholar]
- Zhai T.; Xie S.; Zhao Y.; Sun X.; Lu X.; Yu M.; Xu M.; Xiao F.; Tong Y. Controllable Synthesis of Hierarchical ZnO Nanodisks for Highly Photocatalytic Activity. CrystEngComm 2012, 14, 1850–1855. 10.1039/c1ce06013a. [DOI] [Google Scholar]
- Tian S.; Liu Q.; Sun J.; Zhu M.; Wu S.; Zhao X. Mesoporous ZnO Nanorods Array with a Controllable Area Density for Enhanced Photocatalytic Properties. J. Colloid Interface Sci. 2019, 534, 389–398. 10.1016/j.jcis.2018.09.049. [DOI] [PubMed] [Google Scholar]
- Beranek R. (Photo)Electrochemical Methods for the Determination of the Band Edge Positions of TiO2-Based Nanomaterials. Adv. Phys. Chem. 2011, 2011, 1–20. 10.1155/2011/786759. [DOI] [Google Scholar]
- Hoffmann M. R.; Martin S. T.; Choi W.; Bahnemann D. W. Environmental Applications of Semiconductor Photocatalysis. Chem. Rev. 1995, 95, 69–96. 10.1021/cr00033a004. [DOI] [Google Scholar]
- Mills A.; Le Hunte S. An Overview of Semiconductor Photocatalysis. J. Photochem. Photobiol., A 1997, 108, 1–35. 10.1016/S1010-6030(97)00118-4. [DOI] [Google Scholar]
- Vinu R.; Madras G. Environmental Remediation by Photocatalysis. J. Indian Inst. Sci. 2010, 90, 189–230. [Google Scholar]
- Abdullah Mirzaie R.; Kamrani F.; Anaraki Firooz A.; Khodadadi A. A. Effect of α-Fe2O3 Addition on the Morphological, Optical and Decolorization Properties of ZnO Nanostructures. Mater. Chem. Phys. 2012, 133, 311–316. 10.1016/j.matchemphys.2012.01.029. [DOI] [Google Scholar]
- Naeem R.; Ali Ehsan M.; Yahya R.; Sohail M.; Khaledi H.; Mazhar M. Fabrication of Pristine Mn2O3 and Ag–Mn 2 O 3 Composite Thin Films by AACVD for Photoelectrochemical Water Splitting. Dalt. Trans. 2016, 45, 14928–14939. 10.1039/C6DT02656G. [DOI] [PubMed] [Google Scholar]
- Tama A. M.; Das S.; Dutta S.; Bhuyan M. D. I.; Islam M. N.; Basith M. A. MoS2 Nanosheet Incorporated α-Fe2O3/ZnO Nanocomposite with Enhanced Photocatalytic Dye Degradation and Hydrogen Production Ability. RSC Adv. 2019, 9, 40357–40367. 10.1039/C9RA07526G. [DOI] [PMC free article] [PubMed] [Google Scholar]
- Zhang J.; Liu X.; Wang L.; Yang T.; Guo X.; Wu S.; Wang S.; Zhang S. Synthesis and Gas Sensing Properties of α-Fe2O3 @ ZnO Core–Shell Nanospindles. Nanotechnology 2011, 22, 185501. 10.1088/0957-4484/22/18/185501. [DOI] [PubMed] [Google Scholar]
- Abebe B.; Murthy H. C. A.; Zereffa E. A.; Adimasu Y. Synthesis and Characterization of ZnO/PVA Nanocomposites for Antibacterial and Electrochemical Applications. Inorg. Nano-Met. Chem. 2020, 1–12. 10.1080/24701556.2020.1814338. [DOI] [Google Scholar]
- Abebe B.; Murthy H. C. A.; Zerefa E.; Adimasu Y. PVA Assisted ZnO Based Mesoporous Ternary Metal Oxides Nanomaterials: Synthesis, Optimization, and Evaluation of Antibacterial Activity. Mater. Res. Express 2020, 7, 045011 10.1088/2053-1591/ab87d5. [DOI] [Google Scholar]
- Raghupathi K. R.; Koodali R. T.; Manna A. C. Size-Dependent Bacterial Growth Inhibition and Mechanism of Antibacterial Activity of Zinc Oxide Nanoparticles. Langmuir 2011, 27, 4020–4028. 10.1021/la104825u. [DOI] [PubMed] [Google Scholar]
- Abebe B.; Zereffa E. A.; Tadesse A.; Murthy H. C. A. A Review on Enhancing the Antibacterial Activity of ZnO: Mechanisms and Microscopic Investigation. Nanoscale Res. Lett. 2020, 15, 190. 10.1186/s11671-020-03418-6. [DOI] [PMC free article] [PubMed] [Google Scholar]
- Liu B.; You Y.; Zhang H.; Wu H.; Jin J.; Liu H. Synthesis of ZnO Nano-Powders via a Novel PVA-Assisted Freeze-Drying Process. RSC Adv. 2016, 6, 110349–110355. 10.1039/C6RA24154A. [DOI] [Google Scholar]
- Speaks D. T. Effect of Concentration, Aging, and Annealing on Sol Gel ZnO and Al-Doped ZnO Thin Films. Int. J. Mech. Mater. Eng. 2020, 15, 2. 10.1186/s40712-019-0113-6. [DOI] [Google Scholar]


