

The acceptor variant (rs8084) in the HLA‐DRA gene mediates the transcription of an alternative version of the alpha‐chain lacking 25 amino acids in its extracellular domain. This short isoform functions as a novel intact antigen for canonical class II HLA molecules.

Keywords: antigen presentation, human leucocyte antigen, immune response, protein folding
Summary
Class II human leucocyte antigen (HLA) proteins are involved in the immune response by presenting pathogen‐derived peptides to CD4+ T lymphocytes. At the molecular level, they are constituted by α/β‐heterodimers on the surface of professional antigen‐presenting cells. Here, we report that the acceptor variant (rs8084) in the HLA‐DRA gene mediates the transcription of an alternative version of the α‐chain lacking 25 amino acids in its extracellular domain. Molecular dynamics simulations suggest this isoform undergoes structural refolding which in turn affects its stability and cellular trafficking. The short HLA‐DRA isoform cannot reach the cell surface, although it is still able to bind the corresponding β‐chain. Conversely, it remains entrapped within the endoplasmic reticulum where it is targeted for degradation. Furthermore, we demonstrate that the short isoform can be transported to the cell membrane via interactions with the peptide‐binding site of canonical HLA heterodimers. Altogether, our findings indicate that short HLA‐DRA functions as a novel intact antigen for class II HLA molecules.
Abbreviations
- APCs
antigen‐presenting cells
- BSA
bovine serum albumin
- CHX
cycloheximide
- DTT
dithiothreitol
- EndoH
endoglycosidase H
- ER
endoplasmic reticulum
- *HEL
hen egg white lysozyme
- HLA
human leucocyte antigen
- INF‐α
interferon‐α
- MD
molecular dynamics
- MS
multiple sclerosis
- NGS
next‐generation sequencing
- NGS
normal goat serum
- PBMCs
peripheral blood mononuclear cells
- PBS
phosphate‐buffered saline
- PCA
principal component analysis
- RA
rheumatoid arthritis
- RASGRP2
RAS guanyl‐releasing protein 2
- RMSD
root‐mean‐square deviation
- SASA
solvent accessible surface area
- SDS
sodium dodecyl sulphate
- SLE
systemic lupus erythematosus
- SNP
single nucleotide polymorphism
- T1D
type 1 diabetes
- TBS
Tris‐buffered saline
- VMD
visual molecular dynamics
INTRODUCTION
The human leucocyte antigen (HLA) genes in chromosome 6p21 encode a set of conserved glycoproteins that play a critical role in the immune response. 1 In their mature form, HLA molecules consist of two non‐covalently associated chains forming heterodimers that present antigens on the cell surface for recognition by T cells. Class I HLA molecules coded by the genes located in the telomeric region of the locus are deputed to present endogenous antigens such as peptides from virus‐infected or neoplastic cells to cytotoxic CD8+ T lymphocytes, while HLA class II proteins coded by genes in centromere proximal segment of the locus preferentially display pathogen‐derived exogenous antigens to CD4+ T lymphocytes.
Both classes employ similar structures for antigen presentation. Specifically, a β‐sheet topped by two α‐helical regions creates a groove in the extracellular domain, where the peptides can be loaded and stabilized through H bonds with specific residues in the pocket. 2 Despite the overall similarity, striking differences exist in the fine structure of the binding sites between the two classes, in turn affecting their antigen repertoires and ensuing immune responses. Indeed, the binding site of class I molecules is closed at both ends, restricting to 8–10 amino acids the maximum length of peptides that can be accommodated within the cleft. On the contrary, the ends of class II pockets are open, allowing much longer peptides as well as intact proteins to be presented. 2 , 3
The gene encoding the class II HLA‐DR β‐chains is extremely polymorphic and, through the years, several allelic isoforms have been found associated with a large number of common diseases. 4 , 5 On the other hand, there has been limited interest in the α‐chain due to the fact that its encoding gene HLA‐DRA is relatively monomorphic. A structural variant of HLA‐DRA has been reported, which lacks part of the extracellular domain, resulting in a shorter polypeptide chain. This variant was first described in a mutagenesis screening of lymphoblastoid cell lines by gamma irradiation, 6 and it is the result of an alternative splicing event driven by the single nucleotide polymorphism (SNP) rs8084. The minor allele is common in most human populations (A = 0·37–0·40) 7 ; thus, the structural variation in the α‐chain may have important functional consequences, yet the specificity of this isoform remains poorly understood.
Here, we show that this isoform is sequestered into the endoplasmic reticulum (ER) and in turn undergoes rapid degradation, when it is the only α‐chain interacting with HLA‐DRB molecules. However, co‐expression of canonical class II HLA heterodimer promotes its localization onto the cell membrane possibly through interactions with the peptide‐binding groove, partially protecting this alternative HLA‐DRA isoform from proteolysis. Altogether, we report that this isoform of class II α‐chain (HLA‐DRA) may function as a novel intact neo‐antigen for class II HLA molecules.
MATERIALS AND METHODS
Cell lines
HeLa and HEK293 cells were obtained from ATCC biobank. Both cell lines were maintained in Dulbecco's modified Eagle's medium (GIBCO) supplemented with 10% v/v fetal bovine serum (GIBCO) at 37°C in a humidified atmosphere with 5% CO2.
Plasmids
The pcDNA3.1 constructs containing the coding sequences for long and short HLA‐DRA with a C‐terminal FLAG tag, short HLA‐DRA with an N‐terminal HA tag, HLA‐DRB1*15:01 with a C‐terminal Myc tag and human CD74 invariant chain (Ii) were purchased from GenScript. The vectors containing HLA‐DMA and HLA‐DMB coding sequences were a kind gift from Dr. Adam Benham (Durham University, UK).
To construct the minigenes, the genomic portion of HLA‐DRA gene between exon 2 and exon 4 was PCR‐amplified from whole‐genomic DNA using Q5 High‐Fidelity DNA Polymerase (New England Biolabs) using the following primers: forward 5ʹ‐CCCCCCCTCGAGAAGAACATGTGATCATCCAGG‐3ʹ; reverse 5ʹ‐CCCCCCTCTAGACTCCATGTGCCTTACAGAGG‐3ʹ. The PCR product was then double‐digested with the restriction enzymes XhoI and XbaI (New England Biolabs) and cloned into the pcDNA3 vector (13031, Addgene) from which the coding sequence of the Green Fluorescent Protein had been previously excised using the same pair of enzymes. Constructs expressing the other allele of the SNP rs8084 were obtained by introducing the A>C point mutation with the QuikChange Lightning Site‐Directed Mutagenesis Kit (Stratagene). Individual clones were confirmed by Sanger sequencing.
Antibodies
The following antibodies were used in the study: anti‐FLAG rabbit polyclonal antibody (2368, Cell Signaling); anti‐Myc rabbit monoclonal antibody (2278, Cell Signaling); anti‐β‐actin rabbit monoclonal antibody (8457, Cell Signaling); anti‐rabbit IgG F(abʹ)2 Fragment Alexa Fluor 555 Conjugate (4413, Cell Signaling); anti‐HA tag antibody (ab9110, Abcam); anti‐HLA‐DRA polyclonal antibody (NBP2‐38691, NOVUS Biologicals); anti‐FLAG M2 mouse monoclonal antibody (F1804, Sigma); anti‐Myc mouse monoclonal antibody (sc‐40, Santa Cruz); and normal mouse IgG (sc‐2025, Santa Cruz).
RT‐PCR analysis
HeLa cells were grown in 6‐well plates and transfected at 90% confluence with the different HLA‐DRA minigene constructs using Lipofectamine 2000 (Invitrogen), according to the manufacturer's instructions. After 24 h, total RNA was extracted from transfected cells using the RNeasy Mini Kit (Qiagen). DNA contaminations were removed on column using the RNase‐free DNase Set (Qiagen). For mRNA analysis, 1 μg of total RNA was retro‐transcribed into cDNA with the SuperScript III First‐Strand kit (Invitrogen), and 1 μl of the total reaction volume was used for RT‐PCR. All amplifications were performed on a PTC100 thermocycler (MJ Research), using the GoTaq Green Master Mix (Promega). The expression of HLA‐DRA isoforms was analysed using the following primers: forward 5′‐GAATTTGGACGATTTGCCAG‐3′; reverse 5′‐TAGGTGACACTATAGAATAGG‐3′. Amplicons were separated onto 2·5% agarose gels, stained with ethidium bromide and imaged using a Molecular Imager ChemiDoc XRS System equipped with Quantity One software (Bio‐Rad).
DNA‐sequencing
For next‐generation sequencing (NGS) analysis, HLA‐DRA isoforms were amplified using the following primers: forward 5′‐GAATTTGGACGATTTGCCAG‐3′; reverse 5′‐GCTTGAGAAGAGGCTCATCC‐3′, resulting in fragments of 391 bp for the long form of HLA‐DRA and 316 bp for the short form. The amplicons generated from two independent transfections were then purified with the QIAquick PCR Purification Kit (Qiagen) and sequenced onto a MiSeq platform (Illumina), generating 1·5 million pair‐end 250‐bp reads per sample. Library preparation and all the sequencing steps were outsourced at GENEWIZ. Quality control of raw reads was implemented using Agilent's TapStation Analysis Software. The reads for each sample were individually mapped onto the HLA‐DRA target region using BLASTN (v2.6.0+). The BLAST nucleotide database was formatted using as references both the long and short isoform sequences of the HLA‐DRA target region. Stringent criteria were adopted to filter for strong alignments: only mapped reads with sequence identity ≥95, e‐value ≤0·001, gaps =0 and mismatches ≤1 were considered. In addition, the read alignments that did not overlap the junction of exon 2 and exon 3 were excluded. A short:long isoform ratio was finally calculated for each sample by dividing the total number of reads that uniquely mapped to the short transcript by the total number of reads that uniquely mapped to the long one.
Quantitative RT‐PCR analysis
To measure the levels of short and long HLA‐DRA isoforms in response to INF‐α stimulation, PBMCs from individuals carrying different rs8084 genotypes (AA, AC and CC) were cultured in 24‐well plates (106 cells/well) using RPMI 1640 (GIBCO/Invitrogen) supplemented with 2 mM l‐glutamine, 1 mM sodium pyruvate, 10% (vol/vol) fetal bovine serum and antibiotics (100 IU/ml penicillin and 100 mg/ml streptomycin). Cells were stimulated with 40 000 U/ml human INF‐α (Millipore) for 24 h, and then, total RNA was extracted with the RNeasy Mini Kit (Invitrogen). DNA contaminations were removed by on‐column digestion using the RNAse‐free DNase Set (Qiagen). An amount equal to 1 μg of total RNA then retro‐transcribed into cDNA with the SuperScript III First‐Strand kit (Invitrogen), and 1 μl of the total reaction volume was used for quantitative RT‐PCR. All amplifications were performed on a 7900HT thermocycler (ABI), using the Power SYBR Green PCR Master Mix (Applied Biosystem). The following primers were used to amplify the different isoforms: short HLA‐DRA forward, 5ʹ‐ATACTCCGATCACCAATGACA‐3ʹ; long HLA‐DRA forward, 5ʹ‐CCAACGTCCTCATCTGTTTC‐3ʹ; HLA‐DRA reverse, 5ʹ‐AGACTGTCTCTGACACTCCT‐3ʹ; GAPDH forward, 5ʹ‐GGAGCGAGATCCCTCCAAAAT‐3ʹ; GAPDH reverse, 5ʹ‐GGCTGTTGTCATACTTCTCATGG‐3ʹ. Each sample was run in triplicate, and the ΔΔCt method was used for relative quantification, with GAPDH expression levels serving as internal control.
Co‐immunoprecipitation assays
HeLa or HEK293 cells were cultured in 100‐mm dishes at 90% confluence and transfected with various combination of HLA vectors (10 μg of total plasmid) using Lipofectamine 2000 (Invitrogen). After 48 h, the cells were washed twice with cold phosphate‐buffered saline (PBS) and then lysed in 1 ml of lysis buffer (50 mM Tris–HCl, pH 7·5; 150 mM NaCl; 0·5% NP‐40; protease and phosphatase inhibitor cocktails, Roche) for 10 min on ice. Lysates were spun at 2300 g at 4°C for 5 min, and the supernatants were collected. Aliquots corresponding to 2% of the total volume were saved from each sample as input controls. The rest of the samples were pre‐cleared with 40 μl of Dynabeads Protein G (Invitrogen) for 1 h at 4°C, rotating. For immunoprecipitation, 3 μg of monoclonal anti‐FLAG or anti‐Myc antibody was conjugated with 50 μl of Dynabeads Protein G according to the manufacturer's instruction. In parallel, 3 μg of normal mouse IgG was coupled for mock immunoprecipitation controls. Each pre‐cleared lysate was then split into two equal fractions of 500 μl which were incubated with the monoclonal antibody‐coated beads or IgG controls for 5 h at 4°C, rotating. The beads were then washed with lysis buffer for five times and immunopreciptated proteins were eluted in 40 μl of 2× Laemmli buffer, boiling the samples at 95°C for 10 min.
Western blot assays
Samples were separated by SDS–PAGE on 10% gels and then transferred to nitrocellulose membranes (Immobilion) at 100 V for 30 min. Membranes were then blocked with 5% milk in Tris‐buffered saline supplemented with 0·05% Tween‐20 (TBS‐T) for 1 h at room temperature (RT) and then incubated with primary antibodies (1:1000) in 5% bovine serum albumin (BSA) in TBST‐T, overnight at 4°C. The next day, the membranes were washed three times with TBS‐T and incubated with horseradish peroxidase (HRP)‐conjugated secondary antibodies in blocking solution (1:10 000) for 1 h at RT. After extensive washing in TBS‐T, the chemiluminescent signals were detected with Supersignal West Dura reagent (Thermo Scientific), using a Molecular Imager ChemiDoc XRS System equipped with Quantity One software (Bio‐Rad).
Immunofluorescence assays
HeLa cells were cultured in 12‐well plates and transfected at 90% confluence with short and long HLA‐DRA constructs, either alone or in combination with HLA‐DRB1*15:01, using Lipofectamine 2000 (Invitrogen). After 24 h, cells were reseeded onto coverslips previously coated with poly‐l‐lysine. After additional 24 h, cells were fixed with 2% paraformaldehyde (PFA) in PBS for 10 min at RT. Some cells were permeabilized with 0·2% Triton XT‐100 in PBS for 5 min at RT. All cells were then blocked with 3% normal goat serum (NGS) in PBS for 1 h at RT, before incubating the coverslips with an anti‐HLA‐DRA primary antibody (1:300) in 1% BSA at 4°C ON. The day after, the coverslips were washed with PBS and incubated with Alexa‐conjugated secondary antibodies (1:600) in 1% BSA for 1 h at RT in the dark. Coverslips were finally washed three times with PBS and mounted on glass slides using Vectashield with DAPI (Vector Laboratories). Cells were imaged (40× magnification) using an Eclipse Ti‐E microscope equipped with NIS‐Elements software (Nikon).
HLA heterodimer stability assays
HeLa cells were cultured in 100‐mm dishes at 90% confluence and transfected with short or long HLA‐DRA vectors, together with HLA‐DRB1*15:01, using Lipofectamine 2000 (Invitrogen). After 48 h, the cells were lysed in 1 ml of lysis buffer (50 mM Tris–HCl, pH 7·5; 150 mM NaCl; 0·5% NP‐40; protease and phosphatase inhibitor cocktails, Roche) and subjected to immunoprecipitation of HLA‐DRA using an anti‐FLAG antibody. HLA heterodimers were subsequently eluted from the beads using FLAG peptide (0·5 mg/ml) for 30 min at 4°C, shaking. Supernatants were mixed with Laemmli buffer (2% SDS final concentration) and split in two equal aliquots. One was boiled for 5 min, while the other was incubated for 1 h at RT. Both samples were then probed by Western blotting for HLA‐DRA using an anti‐FLAG antibody.
EndoH digestion assays
Digestions of cell lysates expressing different HLA‐DRA constructs with EndoH enzyme (New England Biolabs) were carried out according to the manufacturer's protocol. Briefly, 10–20 μg of total proteins was first denatured in glycoprotein denaturing buffer (0·5% SDS, 40 mM DTT) by heating the reaction at 100°C for 10 min. Subsequently, proteins were digested with 500 U EndoH at 37°C for 1 h. Finally, the molecular weight of short and long HLA‐DRA was analysed by Western blotting, using an anti‐FLAG antibody. Undigested cell lysates were used as controls.
Protein stability assays
We adapted a robust method employing the translation inhibitor cycloheximide (CHX). 8 Briefly, HeLa cells were cultured in 6‐well plates and transfected at 90% confluence with different HLA‐DRA constructs, either alone or in combination with HLA‐DRB1*15:01, using Lipofectamine 2000 (Invitrogen). After 24 h, cells were treated with 25 μg/ml CHX (Sigma) for 4, 8 and 12 h. At the different time‐points, cells were washed twice with cold PBS and lysed in 250 μl of RIPA buffer supplemented with protease inhibitors. Untreated transfected cells were also collected as baseline. Cell lysates were spun at 5000 × g for 5 min and supernatants were retained for subsequent analysis. Protein concentration was assessed and volumes equal to 10 μg of total proteins were probed by Western blotting for HLA‐DRA levels using an anti‐FLAG or anti‐HA antibody. Actin levels were used as internal controls.
In‐cell ELISA assays
HeLa or HEK293 cells were cultured in 12‐well plates and transfected at 90% confluence with different HLA‐DRA constructs, either alone or in combination with HLA‐DRB1*15:01, using Lipofectamine 2000 (Invitrogen). After 24 h, cells were reseeded in 96‐well plates (80 000 cells/well) and cultured for additional 24 h. Cells were then washed with PBS twice and fixed with 2% PFA for 10 min at RT. After three washes with PBS, cells were blocked with 3% NGS in PBS for 1 h at RT. After one wash, cells were incubated with primary antibodies (1:300 anti‐HA) in 1% BSA solution at 37°C for 1 h. After three more washes, cells were incubated with HRP‐conjugated secondary antibody (1:2500) in 1% BSA solution at 37°C for 1 h. After three final washes, signals were developed using the TBD substrate and absorbance values at 450 nm were detected with a Spectramax plate reader (Molecular Devices).
Cell viability assays
HeLa cells were cultured in 60‐mm dishes and transfected at 90% confluence with different HLA‐DRA constructs, either alone or in combination with HLA‐DRB1*15:01, using Lipofectamine 2000 (Invitrogen). After 24 h, cells were reseeded in 96‐well plates (80 000 cells/well) and cultures for additional 24 h. Cell viability was measured using the Cell Proliferation Kit II (Roche), incubating the cells with the XTT reagent for 4 h. Absorbance was finally read at 492 nm with a VersaMax plate reader (Molecular Devices). Each condition was measured in eight replicates.
Cell proliferation assays
PBMCs were isolated from the blood of individuals (31–79 age range, 0·4 M/F sex ratio) carrying different rs8084 genotypes using a standard Ficoll (GE Healthcare) density gradient protocol. The study was approved by the UCSF Institutional Review Board (IRB #: 10‐00104) with written informed consent obtained from all subjects and was performed in accordance with the principles in the Declaration of Helsinki. Cells were counted with a Cellometer (Nexcelom Bioscience) and cryopreserved in 10 million cell aliquots for further usage. PBMCs were plated in 96‐well plates (200 000 cells/well) using the serum‐free AIM‐V medium (GIBCO, Invitrogen), which contains 2 mM l‐glutamine, 50 μg/ml streptomycin sulphate, 10 μg/ml gentamicin sulphate and human albumin. Cells were cultured for 72 h and pulsed for the last 18 h with 1 μCi/well [3H]‐thymidine before harvesting. Radioactive signals were measured with a 1450 MicroBeta TriLux liquid scintillation counter (PerkinElmer).
Molecular dynamics simulations
The short HLA‐DRA isoform was partially homology‐modelled using SWISS‐MODEL, 9 based on the crystal structure of the long isoform (PDB ID: 2Q6W) as the template. 10 The β‐strands along the 25 amino acids in the long isoform were replaced with a linker region in the short HLA‐DRA, which was modelled from a database of 700 million loops using the SuperLooper2 webserver. 11 The final structure was solvated in the TIP3P explicit water model and minimized for 100 000 steps prior to equilibration.
Both long and short isoforms were equilibrated for 100 ns using NAMD molecular dynamics package and CHARMM36 forcefield. 12 , 13 Periodic boundary conditions were applied in all three directions. Pressure and temperature were controlled at 1 bar and 310 K via Langevin piston Nose‐Hoover and Langevin thermostat, respectively. 14 , 15 All visualization and post‐processing analyses were performed using visual molecular dynamics (VMD) and Bio3D packages. 16 , 17
Statistical analyses
Data were expressed as mean ±SEM. Differences between means of two groups were assessed with two‐tailed Student's t‐test. P values equal or lower to 0·05 were considered significant.
We used the 1000 Genomes RNA‐Seq dataset to examine expression levels of HLA‐DRA transcript isoforms. 18 This dataset is available cleaned and normalized. We selected individuals homozygous AA and CC and heterozygous AC for rs8084. We extracted the expression value of the two transcripts, computed their relative abundance, removed 5 outliers based on the interquartile range method and performed Wilcoxon ranked tests to test for differences between groups. We tested the alternative hypotheses that ratios from samples homozygous AA are higher than ratios from samples heterozygous AC and homozygous CC and that ratios from samples heterozygous AC are higher than ratio from samples homozygous CC.
For cell proliferation, we first removed 5 outliers based on the interquartile range method (1·5 IQR rule), and then, we applied a linear mixed‐effects model with group as fixed effect and day as random effect to compare the cpm values between genotypes.
RESULTS
SNP rs8084 mediates HLA‐DRA alternative splicing
The rs8084 SNP maps to the junction between the second intron and the third exon of the HLA‐DRA gene, and the A allele drives the transcription of a shorter isoform lacking 75 nucleotides in its third exon. To confirm this molecular mechanism, we generated a panel of minigenes by subcloning in a mammalian expression vector the genomic sequences laying between exons 2 and 4 of HLA‐DRA from one individual carrying the C allele and one carrying the A allele. To exclude possible confounding effects of other SNPs in close proximity to rs8084, we also generated a third construct in which the original A allele was artificially converted to the C allele (A>C) by site‐directed mutagenesis. All of the different constructs were subsequently expressed in HeLa cells and the alternative splicing event was assessed by RT‐PCR using a set of primers designed around the intron–exon junction. As expected, while all constructs expressed the full‐length isoform at high levels, only the minigene carrying the A allele produced at detectable levels a transcript whose length is compatible with the short isoform (Figure 1A). The alternative splicing of HLA‐DRA was further assessed by NGS analysis of the RT‐PCR products, which confirmed the presence of the short transcript in samples carrying the A allele at significantly higher levels (mean relative abundance short/long transcripts =3 ± 0·1%) as compared to the samples carrying the C and A>C alleles (mean relative abundance short/long transcripts =0·1 ± 0·01% and 0·03 ± 0·01%, respectively). These results are in agreement with publicly available data (1000 Genomes), which confirmed that the relative abundance of the short transcript is significantly associated with rs8084‐A (P AAvsCC = 2·8 × 10−11, P ACvsCC = 2·4 × 10−7) (Figure 1B). Similar patterns were also obtained when the expression levels of short HLA‐DRA were normalized to a housekeeping gene (actin) (P AAvsCC = 1·1 × 10−7, P ACvsCC = 0·002) (Figure S1).
Figure 1.

SNP rs8084 drives HLA‐DRA alternative splicing. (A) Constructs carrying the HLA‐DRA minigenes with different alleles of rs8084 SNP (A, C or A converted to C by mutagenesis) or a control vector carrying the green fluorescent protein (GFP) coding sequence were transiently transfected in HeLa cells. After 24 h, their expression products were analysed by RT‐PCR using a forward primer designed on HLA‐DRA exon 3 and a reverse primer on the vector backbone. This set of primers produces amplicons of 594 bp or 519 bp corresponding to the long and short isoforms, respectively. In the schematic are represented Exon 2, Exon 3 (the striped part represents the 75 bp portion only presents in the long transcript), and Exon 4. (B) Relative abundance of the alternative isoform of HLA‐DRA in 1000 Genomes samples according to the genotypes of rs8084. Expression value ratio represents the expression value of the short transcript divided by the expression value of the long transcript. Reported P‐values are the results of Wilcoxon tests, one‐sided P‐value. (C,D) Expression analysis of long and short HLA‐DRA isoforms in PBMCs from individuals carrying the following rs8084 genotypes: AA (n = 6), AC (n = 4), AA (n = 7). Cells were stimulated with 40 000 U/ml of human recombinant INF‐α for 24 h or left unstimulated. *P ≤ 0·05.
Next, we cultured peripheral blood mononuclear cells (PBMCs) from individuals with different rs8084 genotypes (AA, AC and CC) and measured by quantitative RT‐PCR the levels of both long and short HLA‐DRA isoforms in basal conditions and in response to interferon alpha (INF‐α), a pro‐inflammatory cytokine known to stimulate HLA expression. 19 Consistent with our in vitro results, we detected short HLA‐DRA expression only in PBMCs carrying at least one copy of the A allele (Figure 1C), while the standard transcript was found in all the tested samples regardless of the genotype (Figure 1D). Moreover, the expression of both isoforms increases upon INF‐α treatment, suggesting they are subjected to similar regulatory mechanisms (Figure 1C,D).
Short HLA‐DRA acquires an alternative conformation
The 75 missing nucleotides in the short HLA‐DRA isoform encode a stretch of 25 amino acids that includes two β‐strands in the α2 domain of the long isoform extracellular portion. Importantly, this segment includes the cysteine residue C132, which plays a key role in stabilizing the entire structure by forming a disulphide bond with C188. As these β‐strands are replaced by a linker region in short HLA‐DRA, we carried out detailed molecular dynamics (MD) simulations in order to fully capture the structural implications of the alternative splicing event.
We observed a notable rearrangement of β‐strands only in the short isoform, which was mainly driven by the disulphide bond removal (Figure 2A,B). Solvent accessible surface area (SASA) is a measure of structural rearrangement and quantifies the exposed surface of the structure to the solvent. The SASA values of the long α1 domain remained very stable, whereas it highly fluctuated especially towards the end of the short isoform simulation (Figure 2C). The peaks in the SASA plot indicate major structural instability and conformational transition within the α2 domain of the short HLA‐DRA. Conversely, the α1 domain of the short isoform remained relatively intact as indicated by the root‐mean‐square deviation (RMSD) (Figure 2D). We further confirmed the fold change in the α2 domain by principal component analysis (PCA) of all the different conformers generated along the MD trajectory. Each conformer is represented by a point in the PC space and clustering of points demonstrates similar conformational states. While the conformational state of the long isoform did not drastically change throughout the simulation, the beginning and end states of the short isoform formed distinct clusters (Figure 2E,F).
Figure 2.

Short HLA‐DRA undergoes structural rearrangement. (A) The 25 missing amino acids of the short isoform map on two β strands in the α2 domain of the long isoform shown in magenta. This structural segment includes residue C132, which forms a disulphide bond with C188 in the long isoform. Two snapshots of the α2 domain shown at times 0 and 100 ns of the simulation are similar in shape indicating that the disulphide bond plays a critical role in stabilizing the structure. (B) In the short isoform, a linker region (orange) replaces the 25 amino acid stretch connecting α1 and α2 domains. Snapshots of the α2 domain of the short isoform clearly show misfolding of this domain due to the absence of the disulphide bond. (C) Minimal fluctuations in the SASA of the α2 domain throughout the simulation of the long isoform indicates no major conformational transitions, whereas significant structural rearrangements occurred at multiple time‐points of the short HLA‐DRA simulation (p < 2·2 × 10−16). (D) The RMSD distribution of the α1 domain measures deviation of the structure from the first frame, which shows no drastic difference between short and long isoforms. Particularly, the medians of distributions marked by the black line in the box plots, are very similar. (E, F) The PCA of the α2 domain confirmed the conformational transition of the short isoform. Each conformer is a point in the PC space. Specifically, there is no distinct grouping of the conformational states along PC1 to PC3 components (left panels), whereas there are two clear clusters recognizable in the short isoform in both PC1‐PC2 and PC1‐PC3 subspaces of the short isoform (right panels). The course of the trajectory is represented by the continuous colour gradient from blue to red. The percentage of the total mean square displacement of atom positional fluctuations along each eigenvector defined by the corresponding eigenvalue is shown in the bottom right panel in each case.
These simulations suggest that the alternative isoform may retain its ability to dimerize with the corresponding β‐chain as the α1 domain is not significantly affected. An antibody with the ability to selectively bind short HLA‐DRA does not exist. Therefore, to experimentally validate the MD prediction, we performed co‐immunoprecipitation (co‐IP) experiments in HeLa cells overexpressing a Myc‐tagged form of the HLA‐DRB1 molecule (encoded by the HLA‐DRB1*15:01 allele) in combination with either the long or the short HLA‐DRA isoform, both FLAG‐tagged. Despite not being classic antigen‐presenting cells (APCs), functional HLA class II heterodimers can be efficiently reconstituted in these cells. 20 , 21 Immunoprecipitations of the HLA‐DRA proteins and subsequent detection of HLA‐DRB1 showed that both isoforms are able to biochemically interact with the β‐chain (Figure 3A). This evidence was further confirmed in reciprocal co‐IP experiments by pulling down HLA‐DRB1 and then probing for the presence of the HLA‐DRA isoforms (Figure 3B). We next explored the stability of these heterodimers using a well‐established in vitro denaturation assay. 22 Also in this case, the heterodimers containing either the long or the short isoform were both partially resistant towards dissociation in SDS‐containing buffer at room temperature (Figure 3C).
Figure 3.
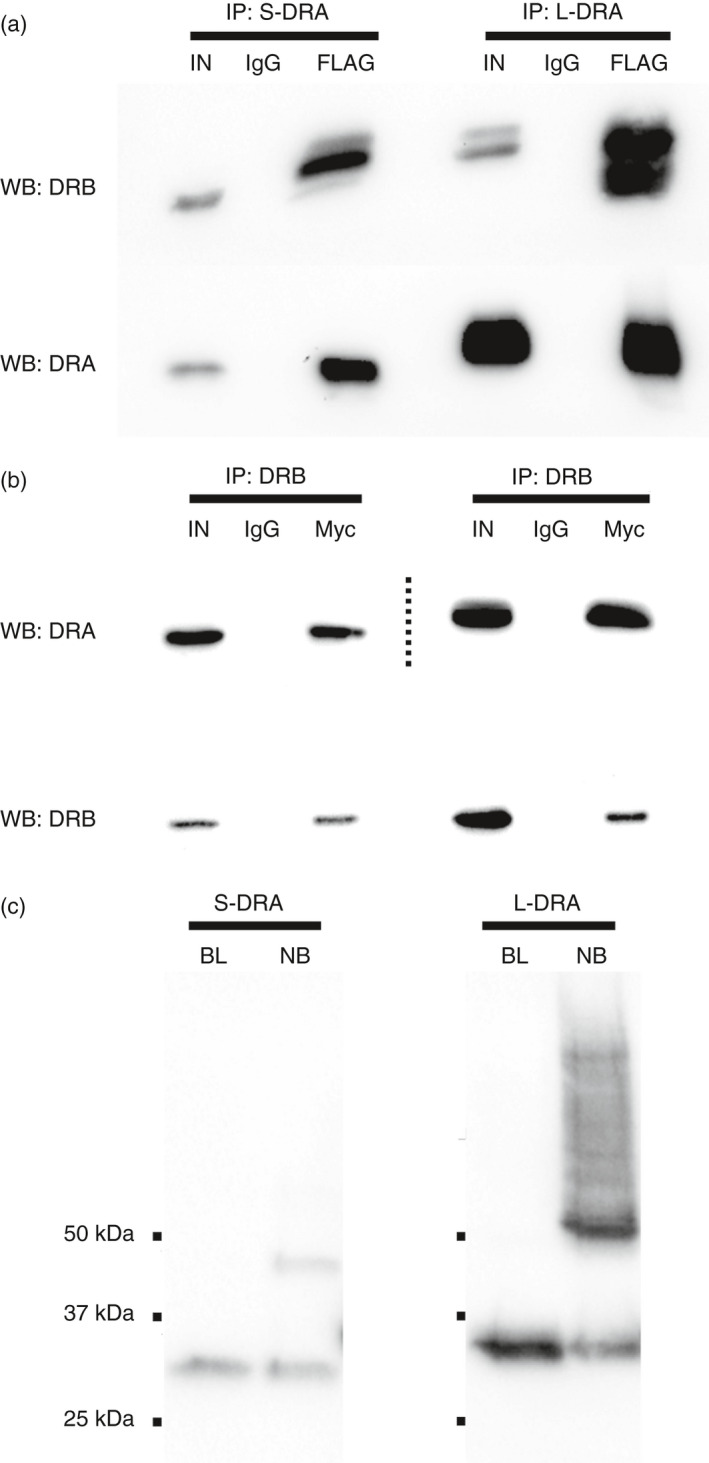
Short HLA‐DRA forms stable heterodimers with the β‐chain. (A) Co‐immunoprecipitation experiments of HLA‐DRB1 (encoded by HLA‐DRB1*15:01 allele) with the short or long isoform of HLA‐DRA. HLA‐DRA and HLA‐DRB1 were FLAG‐ and Myc‐tagged respectively. Top band shows the detection of HLA‐DRB1 molecules after the co‐immunoprecipitation with either the short (left) or the long (right) HLA‐DRA isoform. Bottom bands confirm immunoprecipitation of HLA‐DRA molecules. Mock experiments using normal IgG were carried out in parallel. Input samples (IN) equal to 10% of total volume of lysates served as positive controls. (B) Reciprocal co‐immunoprecipitation experiments. Top band shows the detection of the HLA‐DRA molecules after co‐immunoprecipitation with HLA‐DRB1. Bottom bands show HLA‐DRB1 immunoprecipitation. Dotted lines separate contiguous lanes with two different exposure times. (C) HLA‐DRB1 was co‐expressed with short or long HLA‐DRA and heterodimers were immunoprecipitated using an anti‐FLAG antibody. Samples were then incubated in Laemmli buffer containing 2% SDS for 1 hour at RT or boiled for 10 minutes. Samples were then separated by SDS–PAGE and HLA‐DRA molecules were detected by Western blotting with an anti‐FLAG antibody. Signals around 25 kDa originate from monomeric α‐chains after denaturation while the bands of 50 kDa correspond to intact α/β heterodimers.
Short HLA‐DRA accumulates within the cytosol
As the short isoform of HLA‐DRA is able to form stable heterodimers with HLA‐DRB1, we tested whether they could also traffic to the cell membrane in order to present antigens. We thus transfected HeLa cells with short and long HLA‐DRA, either alone or in combination with HLA‐DRB1, and analysed their subcellular localization by immunofluorescence microscopy. To selectively visualize the cytosolic or the membrane compartments, some cells were permeabilized while other cells were not prior to staining for HLA‐DRA. Single α‐chains, either short or long, showed a typical perinuclear stain suggesting ER deposition (Figure 4A). Upon β‐chain co‐expression, long HLA‐DRA appeared also on the cell surface, while short HLA‐DRA was exclusively found in the cytosol (Figure 4A). This suggests that heterodimers containing the short isoform are unable to reach the cell surface but remain trapped within the ER.
Figure 4.

Short HLA‐DRA is retained within the cytosolic compartment. (A) HeLa cells expressing short or long HLA‐DRA isoforms, either alone or with HLA‐DRB1, were fixed and immunostained with an antibody recognizing the extracellular domain of HLA‐DRA (in red). Some cells were permeabilized with Triton X‐100 before staining, to detect the total amount of the protein. Other cells were left unpermeabilized, in order to label only HLA‐DRA molecules on the cell membrane. Nuclei were counterstained with DAPI (in blue). Only long HLA‐DRA was detected on the cell surface upon HLA‐DRB1 co‐expression. Scale bar=20 μm. (B) HeLa cell lysates expressing short or long HLA‐DRA, alone or in combination with HLA‐DRB1, were digested with EndoH enzyme for 1 h (+ lanes) or not (− lanes), before being separated by SDS–PAGE. HLA‐DRA molecules were then probed by Western blotting, using an anti‐FLAG antibody. Lower bands in +lanes correspond to immature HLA‐DRA molecules that are de‐glycosylated by the enzyme. Conversely, upper bands come from mature HLA‐DRA chains maintaining their glycosidic groups. Both isoforms are fully sensitive to EndoH activity when expressed alone, while long HLA‐DRA becomes partially resistant to de‐glycosylation upon co‐expression with HLA‐DRB1. (C) EndoH assay on cell lysates expressing HLA‐DRA isoforms in combination with HLA‐DRB1, HLA‐DM and invariant chain (Ii). Co‐expression of other factors involved in antigen presentation does not improve short HLA‐DRA maturation. (D, E) HeLa cells expressing short or long HLA‐DRA isoform, alone or together with HLA‐DRB1, were treated for increasing amount of time (4, 8 and 12 h) with cycloheximide (CHX). Lysates were then prepared and the levels of HLA‐DRA molecules were assessed at the different time‐points by Western blotting. Actin levels were used as internal controls. Both isoforms are rapidly degraded when expressed alone. On the contrary, long HLA‐DRA is stabilized by HLA‐DRB1 co‐expression. (F, G) CHX time‐course experiments in HeLa cells expressing both HLA‐DRA isoforms with or without HLA‐DRB1. Short HLA‐DRA becomes more stable when it is co‐expressed along the classic HLA heterodimer. Conversely, the short isoform is rapidly degraded when only long HLA‐DRA is co‐expressed.
We biochemically confirmed this hypothesis by monitoring HLA‐DRA trafficking via the robust endoglycosidase H (EndoH) digestion assay. 20 Immature glycoproteins that are located in the ER are EndoH sensitive, whereas mature glycoproteins that have been translocated to the Golgi body are resistant to EndoH digestion. Protein lysates from HeLa cells expressing short or long HLA‐DRA, with or without HLA‐DRB1, were digested with EndoH and the molecular weights of the different α‐chains were then assessed by Western blotting. Consistent with our immunofluorescence data, α‐chains expressed alone were found fully sensitive to EndoH, while long HLA‐DRA acquired partial resistance to EndoH upon co‐expression with HLA‐DRB1. On the contrary, short HLA‐DRA remained sensitive to EndoH proteolysis even after β‐chain co‐expression, supporting the hypothesis that the short isoform accumulates within the ER (Figure 4B). Interestingly, co‐expression of other molecules of the class II antigen presentation machinery, namely HLA‐DM and invariant chain (Ii), did not rescue ER deposition of short HLA‐DRA (Figure 4C).
Misfolded proteins are typically degraded to maintain the cellular proteostasis. 23 To understand whether short HLA‐DRA follows a similar pathway, we tested its stability by time‐course CHX experiments. HeLa cells expressing short or long isoform, with or without HLA‐DRB1, were treated with the translation inhibitor CHX and the levels of HLA‐DRA were probed at regular intervals up to 12 h. Interestingly, both isoforms were almost completely degraded when expressed alone already after 4 h from treatment (Figure 4D,E). The long, canonical HLA‐DRA was instead stabilized by β‐chain co‐expression and its levels remained unaltered at all the time‐points investigated (Figure 4D). The stability of the shorter HLA‐DRA did not increase upon HLA‐DRB co‐expression (Figure 4E). These results are in agreement with early reports demonstrating the rapid non‐lysosomal degradation of HLA heterodimers incorporating the short isoform. 6
As both isoforms are expressed within the cell in physiological conditions, we also tested the stability of short HLA‐DRA in the presence of both long HLA‐DRA and HLA‐DRB1. Remarkably, we found that the stability of short HLA‐DRA increases when it is co‐expressed along the standard HLA heterodimer. In fact, its levels were still detectable after 4 h from CHX treatment upon long HLA‐DRA and HLA‐DRB1 co‐expression (Figure 4F). No increase in stability was detected when short HLA‐DRA was co‐expressed with the long isoform alone (Figure 4G).
Short HLA‐DRA is presented by canonical class II HLA molecules
To explain our unexpected results on protein stability, we tested the possibility that short HLA‐DRA could function as a full‐length antigen and it is partially protected from degradation when combined with the full‐length DR α/β heterodimer. The rationale for these experiments was fuelled by recent evidence showing that certain misfolded class I alleles can work as intact antigens for class II heterodimers. 24 We hence optimized an in‐cell ELISA assay using HeLa cells expressing short HLA‐DRA tagged with HA epitope at the N‐terminus, in order to precisely quantify the amount of short isoform exposed on the cell surface. As expected, HeLa cells expressing short HLA‐DRA and HLA‐DRB1 showed surface expression signals comparable to the negative control represented by cells expressing long HLA‐DRA and HLA‐DRB1 alone. However, when the short isoform was co‐expressed together with the canonical HLA heterodimer, its surface levels were found to be significantly increased (Figure 5A). Notably, such differences in membrane expression cannot be ascribed to possible differences in cell proliferation (Figure 5B). The association between short HLA‐DRA and the HLA molecule was independently confirmed by co‐IP experiments, showing that the short isoform binds exclusively the α/β heterodimer while no interactions take place when only long and short HLA‐DRA are co‐expressed (Figure 5C).
Figure 5.

Short HLA‐DRA interacts with canonical heterodimers. (A) HeLa cells expressing HLA‐DRA molecules in various combinations were seeded into 96‐well plates and probed for short HLA‐DRA cell membrane expression by in‐cell ELISA as described in the Methods section. The surface levels of the short isoform are significantly higher in cells co‐expressing also long HLA‐DRA and HLA‐DRB1. (B) Viability of cells expressing the different combinations of HLA‐DRA molecules as measured by XTT assay. No significant differences were found. (C) Co‐immunoprecipitation of long and short HLA‐DRA molecules. Top band shows the detection of long HLA‐DRA after pull‐down of the short HLA‐DRA isoform. Bottom bands confirm immunoprecipitation of short HLA‐DRA. The interaction of the two isoforms takes place only when HLA‐DRB1 is also co‐expressed. (D) In‐cell ELISA assays in HeLa demonstrating that short HLA‐DRA surface expression via HLA heterodimer is abolished when invariant chain (Ii) is also co‐expressed. **P ≤ 0·01, ***P ≤ 0·001.
Our following challenge was to understand whether the short isoform binds the HLA heterodimer specifically through the peptide‐binding site. To address this point, we took advantage of the natural high affinity of the invariant chain Ii for the peptide groove—this molecule physiologically blocks the peptide‐binding site while the HLA heterodimers are transported to the endosomal compartment. 25 The overexpression of Ii molecule together with short HLA‐DRA and the HLA heterodimer was able to completely abolish surface expression of the short isoform as shown by in‐cell ELISA experiments (Figure 5D), thus suggesting that both molecules compete for binding the groove. We can hence propose that in professional APCs, the surface localization of the short DRA isoform likely depends on the relative levels of Ii. To exclude possible cell‐dependent artefacts, we replicated our main observations in another cell line. Consistent with our results in HeLa cells, we successfully recapitulated short HLA‐DRA surface expression and interactions with HLA heterodimers in HEK293 cells (Figure S2A,B).
Cell expressing short HLA‐DRA shows lower self‐proliferation
A body of experimental evidence suggests that HLA‐derived self‐antigens are able to drive autologous T‐cell proliferation. 26 , 27 We thus decided to assess whether short HLA‐DRA expression in immune cells is associated with changes in their proliferative capacity. PBMCs from 22 individuals carrying either the A allele (rs8084 AA) or the C allele (rs8084 CC) were cultured for 3 days in serum‐free media, and their self‐proliferation was compared in a standard thymidine incorporation assay. A broad range of self‐proliferation was observed in cells from CC donors, but self‐proliferation rates for cells homozygous for the A allele were consistently lower (P = 0·015) (Figure 6). We can thus argue that short HLA‐DRA expression might negatively affect cell division of PBMCs in basal conditions.
Figure 6.

Cell proliferation is lower in cells expressing short HLA‐DRA. PBMCs from individuals that are homozygous for rs8084, either CC (n = 22) or AA (n = 18), were cultured in serum‐free media. After 72 h, thymidine incorporation was assessed to test their intrinsic proliferation capacity. Cells carrying the CC genotype showed higher proliferation rates as compared to cells carrying the AA genotype. **P ≤ 0·01.
DISCUSSION
Splicing of precursor mRNA is an essential step in eukaryotic gene expression, allowing the removal of introns and the ligation of exons to produce the mature mRNA. 28 It has been estimated that alternative splicing occurs in more than 90% of human protein‐coding genes producing multiple mRNA isoforms. 29 , 30 Differences in alternative splicing between alleles may be manifested either as presence or as absence of the alternative isoforms or as shifts in the relative proportions of multiple mRNA isoforms. 28 The role of alternative splicing in antigen presentation by HLA molecules remains sparsely documented. Alternate spliced forms of HLA class I heavy chain have been reported, resulting for example in soluble HLA alleles, truncated proteins or molecules that are not expressed at the cell surface. 31 Alternative splicing of tapasin and TAP, two HLA class I‐associated structural genes, has also been reported, 32 and specific isoforms of the invariant chain, which prevents premature peptide loading by HLA class II molecules and facilitates their folding, have been shown to facilitate exogenous antigen presentation. 33
In this study, we provide the first comprehensive description of an alternative isoform of class II HLA‐DRA, at both structural and functional levels. First, we were able to recapitulate in vitro the precise molecular mechanism by which this isoform is originated. Specifically, we demonstrate the A allele of SNP rs8084 disrupts the acceptor site of the second intron of HLA‐DRA gene, promoting the usage of a cryptic splicing site within the third exon of the gene that results in a shorter protein lacking 25 amino acids in its extracellular domain. We then employed MD simulations to predict the impact of this missing portion on the overall structure of the molecule, showing that residues critical for the stability of the protein are missing, leading to profound rearrangements in its geometry as well as to dramatic effects on its physiology. While this isoform is still able to bind the respective β‐chain, it is unable to translocate through the secretory pathway and independently reach the cell surface. On the contrary, we show by combining biochemical assays and immunofluorescence imaging that the heterodimers containing the short isoform remain trapped within the ER, where they are rapidly cleared. In this regard, we can speculate that the alternative conformation of short HLA‐DRA negatively affects native interactions with factors involved in the correct maturation and trafficking of the protein.
The second major innovation of this study consists in the discovery that short HLA‐DRA can be loaded into the peptide‐binding site of canonical HLA class II heterodimers, functioning itself as a putative full‐length antigen. A few other examples are known of proteins presented without being processed to peptides. The first case to be described was a partially folded form of the hen egg white lysozyme (*HEL). This well‐known immunogen forms SDS‐stable complexes with HLA class II molecules in the endosomal compartment, and it is then transported to the plasma membrane following a proteolytic independent pathway. 34 Bovine RNAse and horse myoglobin were subsequently shown to bind class II HLA with high affinity. 3 Also, endogenous aberrantly folded proteins have been demonstrated to function as intact antigens for class II HLA molecules. For instance, a misfolded class I allele (HLA‐Cw4) was shown to reach the cell surface through HLA class II interactions and elicit antigen‐specific B‐cell responses. 24 More recently, the same group has found that the rheumatoid arthritis (RA)‐associated HLA‐DR4 molecule is able to present misfolded IgG heavy chains, which are specifically recognized by autoantibodies from sera of RA patients. 35
Although structural details of the short HLA‐DRA interaction with canonical HLA heterodimers remain unknown, we hypothesize that the refolding process of the HLA‐DRA short isoform eventually results in the exposure of linear epitopes that can fit into the peptide‐binding groove. Importantly, as short HLA‐DRA is also capable of binding the β‐chain through the dimerization domain, the affinity of the neo‐epitope needs to be necessarily higher in order for the loading process to be kinetically favoured as compared to heterodimer formation. In professional APCs, the presence of the invariant chain Ii adds another layer of complexity as its relative levels within the cell determine the number of free peptide‐binding sites available for short HLA‐DRA loading.
In this study, we experimentally show that short HLA‐DRA expression is up‐regulated by INF‐α stimulation, supporting a possible functional link between short HLA‐DRA presentation and diseases characterized by inflammatory responses. In this light, it is particularly intriguing that the HLA locus has been found associated with virtually all autoimmune diseases. 36 While there is not an extensive body of literature regarding rs8084, it has been found to be associated with penicillin allergy, 37 and pathway analyses suggested its role in multiple sclerosis (MS), 38 systemic lupus erythematosus (SLE) 39 and psoriasis susceptibility. 40
At the mechanistic level, it remains to be seen how this isoform and its role as an antigen are connected with disease. Here, we present data suggesting that short HLA‐DRA expression might affect the immune response by impairing the proliferation of specific cell populations, presumably CD4+ T cells with immunoregulatory functions. Defects in these cells have been connected with the breakdown of self‐tolerance in autoimmunity. 41 Although we cannot formally exclude in MS possible influences from the linked HLA‐DRB1*15:01, this defective proliferation phenotype is reminiscent of the abnormal differentiation of CD4+ T‐cell naïve and memory subsets in type 1 diabetes (T1D)—two lymphocytic populations defined by the expression of distinct CD45 splice variants, respectively, CD45RA and CD45R0. 42 , 43 Recent experiments have shown that B cells from subjects with MS effectively present self‐antigens such as peptides from HLA‐DR15 or RAS guanyl‐releasing protein 2 (RASGRP2) triggering the proliferation of brain‐homing Th1 CD4+ T cells. 26 , 27 We propose that in the context of a specific genotype and under specific physiological states, when the short isoform is more abundant, its likelihood to be presented by canonical HLA molecules increases. The increment in short HLA‐DRA molecules exposed on the surface of B cells and other professional APCs might negatively affect CD4+ T‐cell autologous proliferation by reducing the pool of HLA heterodimers available for loading functionally active self‐antigen peptides. Further studies will be necessary to fully characterize the activities and the cellular targets of this alternative isoform of HLA‐DRA in the immune system, both in health and in disease.
CONFLICT OF INTEREST
The authors declare no competing interests.
AUTHOR CONTRIBUTIONS
Jill A. Hollenbach, Jorge R. Oksenberg and Alessandro Didonna conceived and jointly supervised the project. Alessandro Didonna, Vincent Damotte, Hengameh Shams, Atsuko Matsunaga, Stacy J. Caillier, Ravi Dandekar and Maneesh K. Misra carried out all the experiments. Alessandro Didonna, Vincent Damotte, Hengameh Shams, Mohammad R. K. Mofrad, Jill A. Hollenbach and Jorge R. Oksenberg analysed the data and wrote the paper. All authors read and approved the final manuscript.
Supporting information
Figure S1. Relative abundance of the alternative isoform of HLA‐DRA in 1000 Genomes samples.
Figure S2. Short HLA‐DRA interacts with classic heterodimers in HEK cells.
ACKNOWLEDGEMENTS
The work was supported by the National Institutes of Health (R01NS102153). The study was also supported by FISM‐Fondazione Italiana Sclerosi Multipla Senior Research Fellowships Cod. 2014/B/1 and Cod. 2017/B/3 and financed or co‐financed with the ‘5 per mille’ public funding.
DATA AVAILABILITY STATEMENT
The data that support the findings of this study are available from the corresponding author upon reasonable request.
REFERENCES
- 1. Kulski JK, Shiina T, Anzai T, Kohara S, Inoko H. Comparative genomic analysis of the MHC: the evolution of class I duplication blocks, diversity and complexity from shark to man. Immunol Rev. 2002; 190:95–122. [DOI] [PubMed] [Google Scholar]
- 2. Stern LJ, Brown JH, Jardetzky TS, Gorga JC, Urban RG, Strominger JL, et al Crystal structure of the human class II MHC protein HLA‐DR1 complexed with an influenza virus peptide. Nature. 1994; 368:215–21. [DOI] [PubMed] [Google Scholar]
- 3. Runnels HA, Weber DA, Moore JC, Westerman LE, Jensen PE. Intact proteins can bind to class II histocompatibility molecules with high affinity. Mol Immunol. 1997; 34:471–80. [DOI] [PubMed] [Google Scholar]
- 4. Horton R, Wilming L, Rand V, Lovering RC, Bruford EA, Khodiyar VK, et al Gene map of the extended human MHC. Nat Rev Genet. 2004; 5:889–99. [DOI] [PubMed] [Google Scholar]
- 5. Misra MK, Damotte V, Hollenbach JA. The immunogenetics of neurological disease. Immunology. 2018; 153:399–414. [DOI] [PMC free article] [PubMed] [Google Scholar]
- 6. Koppelman B, Cresswell P. Rapid nonlysosomal degradation of assembled HLA class II glycoproteins incorporating a mutant DR alpha‐chain. J Immunol. 1990; 145:2730–6. [PubMed] [Google Scholar]
- 7. The 1000 Genomes Project Consortium , Auton A, Brooks LD, Durbin RM, Garrison EP, Kang HM, et al. A global reference for human genetic variation. Nature. 2015; 526:68–74. [DOI] [PMC free article] [PubMed] [Google Scholar]
- 8. Didonna A, Canto E, Shams H, Isobe N, Zhao C, Caillier SJ, et al Sex‐specific Tau methylation patterns and synaptic transcriptional alterations are associated with neural vulnerability during chronic neuroinflammation. J Autoimmun. 2019; 101:56–69. [DOI] [PMC free article] [PubMed] [Google Scholar]
- 9. Waterhouse A, Bertoni M, Bienert S, Studer G, Tauriello G, Gumienny R, et al SWISS‐MODEL: homology modelling of protein structures and complexes. Nucleic Acids Res. 2018; 46:W296–W303. [DOI] [PMC free article] [PubMed] [Google Scholar]
- 10. Parry CS, Gorski J, Stern LJ. Crystallographic structure of the human leukocyte antigen DRA, DRB3*0101: models of a directional alloimmune response and autoimmunity. J Mol Biol. 2007; 371:435–46. [DOI] [PubMed] [Google Scholar]
- 11. Ismer J, Rose AS, Tiemann JK, Goede A, Preissner R, Hildebrand PW. SL2: an interactive webtool for modeling of missing segments in proteins. Nucleic Acids Res. 2016; 44:W390–4. [DOI] [PMC free article] [PubMed] [Google Scholar]
- 12. Jorgensen WL, Chandrasekhar J, Madura JD. Comparison of simple potential functions for simulating liquid water. J Chem Phys. 1983; 79:926–35. [Google Scholar]
- 13. Phillips JC, Braun R, Wang W, Gumbart J, Tajkhorshid E, Villa E, et al Scalable molecular dynamics with NAMD. J Comput Chem. 2005; 26:1781–802. [DOI] [PMC free article] [PubMed] [Google Scholar]
- 14. Nosé S. A unified formulation of the constant temperature molecular dynamics methods. J Chem Phys. 1984; 81:511–9. [Google Scholar]
- 15. Hoover WG. Canonical dynamics: equilibrium phase‐space distributions. Phys Rev A. 1985; 31:1695–7. [DOI] [PubMed] [Google Scholar]
- 16. Humphrey W, Dalke A, Schulten K. VMD: visual molecular dynamics. J Mol Graph. 1996; 14:33–8, 27–8. [DOI] [PubMed] [Google Scholar]
- 17. Grant BJ, Rodrigues AP, ElSawy KM, McCammon JA, Caves LS. Bio3d: an R package for the comparative analysis of protein structures. Bioinformatics 2006; 22:2695–6. [DOI] [PubMed] [Google Scholar]
- 18. Lappalainen T, Sammeth M, Friedlander MR, ‘t Hoen PA, Monlong J, Rivas MA, et al Transcriptome and genome sequencing uncovers functional variation in humans. Nature. 2013; 501:506–11. [DOI] [PMC free article] [PubMed] [Google Scholar]
- 19. Canto E, Isobe N, Didonna A, Group M‐ES, Hauser SL, Oksenberg JR. Aberrant STAT phosphorylation signaling in peripheral blood mononuclear cells from multiple sclerosis patients. J Neuroinflammation 2018; 15:72. [DOI] [PMC free article] [PubMed] [Google Scholar]
- 20. van Lith M, Benham AM. The DMalpha and DMbeta chain cooperate in the oxidation and folding of HLA‐DM. J Immunol. 2006; 177:5430–9. [DOI] [PubMed] [Google Scholar]
- 21. van Lith M, McEwen‐Smith RM, Benham AM. HLA‐DP, HLA‐DQ, and HLA‐DR have different requirements for invariant chain and HLA‐DM. J Biol Chem. 2010; 285:40800–8. [DOI] [PMC free article] [PubMed] [Google Scholar]
- 22. Gorga JC, Horejsi V, Johnson DR, Raghupathy R, Strominger JL. Purification and characterization of class II histocompatibility antigens from a homozygous human B cell line. J Biol Chem. 1987; 262:16087–94. [PubMed] [Google Scholar]
- 23. Amm I, Sommer T, Wolf DH. Protein quality control and elimination of protein waste: the role of the ubiquitin‐proteasome system. Biochim Biophys Acta. 2014; 1843:182–96. [DOI] [PubMed] [Google Scholar]
- 24. Jiang Y, Arase N, Kohyama M, Hirayasu K, Suenaga T, Jin H, et al Transport of misfolded endoplasmic reticulum proteins to the cell surface by MHC class II molecules. Int Immunol. 2013; 25:235–46. [DOI] [PMC free article] [PubMed] [Google Scholar]
- 25. Honey K, Rudensky AY. Lysosomal cysteine proteases regulate antigen presentation. Nat Rev Immunol. 2003; 3:472–82. [DOI] [PubMed] [Google Scholar]
- 26. Mohme M, Hotz C, Stevanovic S, Binder T, Lee JH, Okoniewski M, et al HLA‐DR15‐derived self‐peptides are involved in increased autologous T cell proliferation in multiple sclerosis. Brain. 2013; 136:1783–98. [DOI] [PubMed] [Google Scholar]
- 27. Jelcic I, Al Nimer F, Wang J, Lentsch V, Planas R, Jelcic I, et al Memory B cells activate brain‐homing, autoreactive CD4(+) T cells in multiple sclerosis. Cell. 2018; 175:85–100.e23. [DOI] [PMC free article] [PubMed] [Google Scholar]
- 28. Lu ZX, Jiang P, Xing Y. Genetic variation of pre‐mRNA alternative splicing in human populations. Wiley Interdiscip Rev RNA. 2012; 3:581–92. [DOI] [PMC free article] [PubMed] [Google Scholar]
- 29. Wang ET, Sandberg R, Luo S, Khrebtukova I, Zhang L, Mayr C, et al Alternative isoform regulation in human tissue transcriptomes. Nature. 2008; 456:470–6. [DOI] [PMC free article] [PubMed] [Google Scholar]
- 30. Pan Q, Shai O, Lee LJ, Frey BJ, Blencowe BJ. Deep surveying of alternative splicing complexity in the human transcriptome by high‐throughput sequencing. Nat Genet. 2008; 40:1413–5. [DOI] [PubMed] [Google Scholar]
- 31. Voorter CE, Gerritsen KE, Groeneweg M, Wieten L, Tilanus MG. The role of gene polymorphism in HLA class I splicing. Int J Immunogenet. 2016; 43:65–78. [DOI] [PubMed] [Google Scholar]
- 32. Belicha‐Villanueva A, Blickwedehl J, McEvoy S, Golding M, Gollnick SO, Bangia N. What is the role of alternate splicing in antigen presentation by major histocompatibility complex class I molecules? Immunol Res. 2010; 46:32–44. [DOI] [PMC free article] [PubMed] [Google Scholar]
- 33. Peterson M, Miller J. Antigen presentation enhanced by the alternatively spliced invariant chain gene product p41. Nature. 1992; 357:596–8. [DOI] [PubMed] [Google Scholar]
- 34. Lindner R, Unanue ER. Distinct antigen MHC class II complexes generated by separate processing pathways. EMBO J. 1996; 15:6910–20. [PMC free article] [PubMed] [Google Scholar]
- 35. Jin H, Arase N, Hirayasu K, Kohyama M, Suenaga T, Saito F, et al Autoantibodies to IgG/HLA class II complexes are associated with rheumatoid arthritis susceptibility. Proc Natl Acad Sci USA. 2014; 111:3787–92. [DOI] [PMC free article] [PubMed] [Google Scholar]
- 36. Matzaraki V, Kumar V, Wijmenga C, Zhernakova A. The MHC locus and genetic susceptibility to autoimmune and infectious diseases. Genome Biol. 2017; 18:76. [DOI] [PMC free article] [PubMed] [Google Scholar]
- 37. Gueant JL, Romano A, Cornejo‐Garcia JA, Oussalah A, Chery C, Blanca‐Lopez N, et al HLA‐DRA variants predict penicillin allergy in genome‐wide fine‐mapping genotyping. J Allergy Clin Immunol. 2015; 135:253–9. [DOI] [PubMed] [Google Scholar]
- 38. Song GG, Choi SJ, Ji JD, Lee YH. Genome‐wide pathway analysis of a genome‐wide association study on multiple sclerosis. Mol Biol Rep. 2013; 40:2557–64. [DOI] [PubMed] [Google Scholar]
- 39. Lee YH, Bae SC, Choi SJ, Ji JD, Song GG. Genome‐wide pathway analysis of genome‐wide association studies on systemic lupus erythematosus and rheumatoid arthritis. Mol Biol Rep. 2012; 39:10627–35. [DOI] [PubMed] [Google Scholar]
- 40. Lee YH, Choi SJ, Ji JD, Song GG. Genome‐wide pathway analysis of a genome‐wide association study on psoriasis and Behcet's disease. Mol Biol Rep. 2012; 39:5953–9. [DOI] [PubMed] [Google Scholar]
- 41. Dominguez‐Villar M, Hafler DA. Regulatory T cells in autoimmune disease. Nat Immunol. 2018; 19:665–73. [DOI] [PMC free article] [PubMed] [Google Scholar]
- 42. Faustman D, Eisenbarth G, Daley J, Breitmeyer J. Abnormal T‐lymphocyte subsets in type I diabetes. Diabetes. 1989; 38:1462–8. [DOI] [PubMed] [Google Scholar]
- 43. Faustman DL. Occult CD45 T cell developmental defect in type 1 diabetes. Diabete Metab. 1993; 19:446–57. [PubMed] [Google Scholar]
Associated Data
This section collects any data citations, data availability statements, or supplementary materials included in this article.
Supplementary Materials
Figure S1. Relative abundance of the alternative isoform of HLA‐DRA in 1000 Genomes samples.
Figure S2. Short HLA‐DRA interacts with classic heterodimers in HEK cells.
Data Availability Statement
The data that support the findings of this study are available from the corresponding author upon reasonable request.