Abstract
Immunotherapy that targets lymphoid cell checkpoints holds great promise for curing cancer. However, a majority of cancer patients do not respond to this form of therapy. In addition to lymphoid cells, myeloid cells play essential roles in controlling immunity to cancer. Whether myeloid checkpoints exist that can be targeted to treat cancer is not well established. Here we show that c-Rel, a member of the nuclear factor (NF)-B family, specified the generation of myeloid-derived suppressor cells (MDSCs) by selectively turning on pro-tumoral genes while switching off anti-tumoral genes through a c-Rel enhanceosome. c-Rel deficiency in myeloid cells markedly inhibited cancer growth in mice, and pharmaceutical inhibition of c-Rel had the same effect. Combination therapy that blocked both c-Rel and the lymphoid checkpoint protein PD1 was more effective in treating cancer than blocking either alone. Thus, c-Rel is a myeloid checkpoint that can be targeted for treating cancer.
Introduction
Immunotherapy that targets lymphoid cell checkpoints such as PD1 has revolutionized cancer treatment. However, many cancer patients do not respond to this type of therapy1, 2, 3. Myeloid-derived suppressor cells (MDSCs) are a heterogeneous population of leukocytes important for cancer4, 5, 6, 7, 8. Depletion of MDSCs leads to markedly enhanced anti-tumor immunity in mice9, 10, and enhances the anti-tumor effect of checkpoint inhibitors such as anti-PD1 antibodies11. MDSCs are polarized immature myeloid cells, selectively producing immune inhibitory mediators but not inflammatory mediators. In mice, MDSCs are defined as cells expressing both Gr-1 and CD11b markers, which can be further divided into two subpopulations: granulocytic (G)-MDSCs (CD11b+Ly6G+Ly6Clo) and monocytic (M)-MDSCs (CD11b+Ly6G−Ly6Chi). In humans, G-MDSCs are defined as CD11b+CD14−CD15+ or CD11b+CD14−CD66b+, and M-MDSCs as CD11b+CD14+HLA-DR−/loCD15−. Despite their significance in cancer and inflammatory diseases, MDSCs remain to be one of the least understood subsets of myeloid cells.
Genome-wide association studies establish that c-Rel, a member of the nuclear factor (NF)-B family, is a risk factor for both cancer and inflammation12, 13, 14, 15, 16, 17, 18. Unlike other members of the NF-B family that are ubiquitously expressed, c-Rel is preferentially expressed by myeloid and lymphoid cells19, 20. c-Rel-deficient mice do not suffer from developmental problems or spontaneous infectious diseases. When challenged with high doses of pathogens, they are as competent as wild-type mice in eliminating Trichuris muris and lymphocytic choriomeningitis virus, while exhibiting partially reduced capacity to clear Leishmania major, Listeria, and influenza virus21, 22, 23, 24, 25, 26. However, c-Rel-deficient mice are highly resistant to autoimmune diseases such as arthritis, encephalomyelitis, and colitis27, 28, 29, 30. c-Rel is not required for the development of monocytes, granulocytes, dendritic cells, B cells, or naïve T cells; nor is it required intrinsically for the function of CD8+ T cells either in vitro or in mice25, 31. However, c-Rel is important for the development CD4+ regulatory T (Treg) and Th17 cells32, 33, 34, 35. In this report, we describe an unexpected role of c-Rel in the development of MDSCs that promote cancer.
Results
c-Rel deletion in myeloid cells significantly diminishes tumor growth in mice.
To explore the roles of c-Rel in tumorigenesis, we injected melanoma (B16F0 and B16F10) and lymphoma (EL4) cells into wild-type (WT) and c-Rel gene-deleted (Rel−/−) mice. Remarkably, tumor size and tumor weight in Rel−/− mice were reduced by up to 80%, compared with WT littermates (Fig. 1a,b and Extended Data Fig. 1a,b). It has been reported that c-Rel deficiency in the lymphoid compartment impedes the development of CD4+CD25+ Treg cells, which in turn diminishes tumor growth34. To establish the cell-specific roles of c-Rel in tumorigenesis, we first depleted CD25+ lymphocytes and Gr-1+ myeloid cells in tumor-bearing WT and Rel−/− mice with specific antibodies (Extended Data Fig. 1c–e). Although either CD25+ or Gr-1+ cell depletion abolished the effect of c-Rel deficiency on tumor growth, Gr-1+ cell depletion had a more prominent effect in blocking tumor growth in WT animals (Fig. 1c–e and Extended Data Fig. 1f).
Fig. 1. Global and myeloid Rel gene deletion block tumor growth, reduce MDSCs, and enhance effector CD8+ T cells in mice.
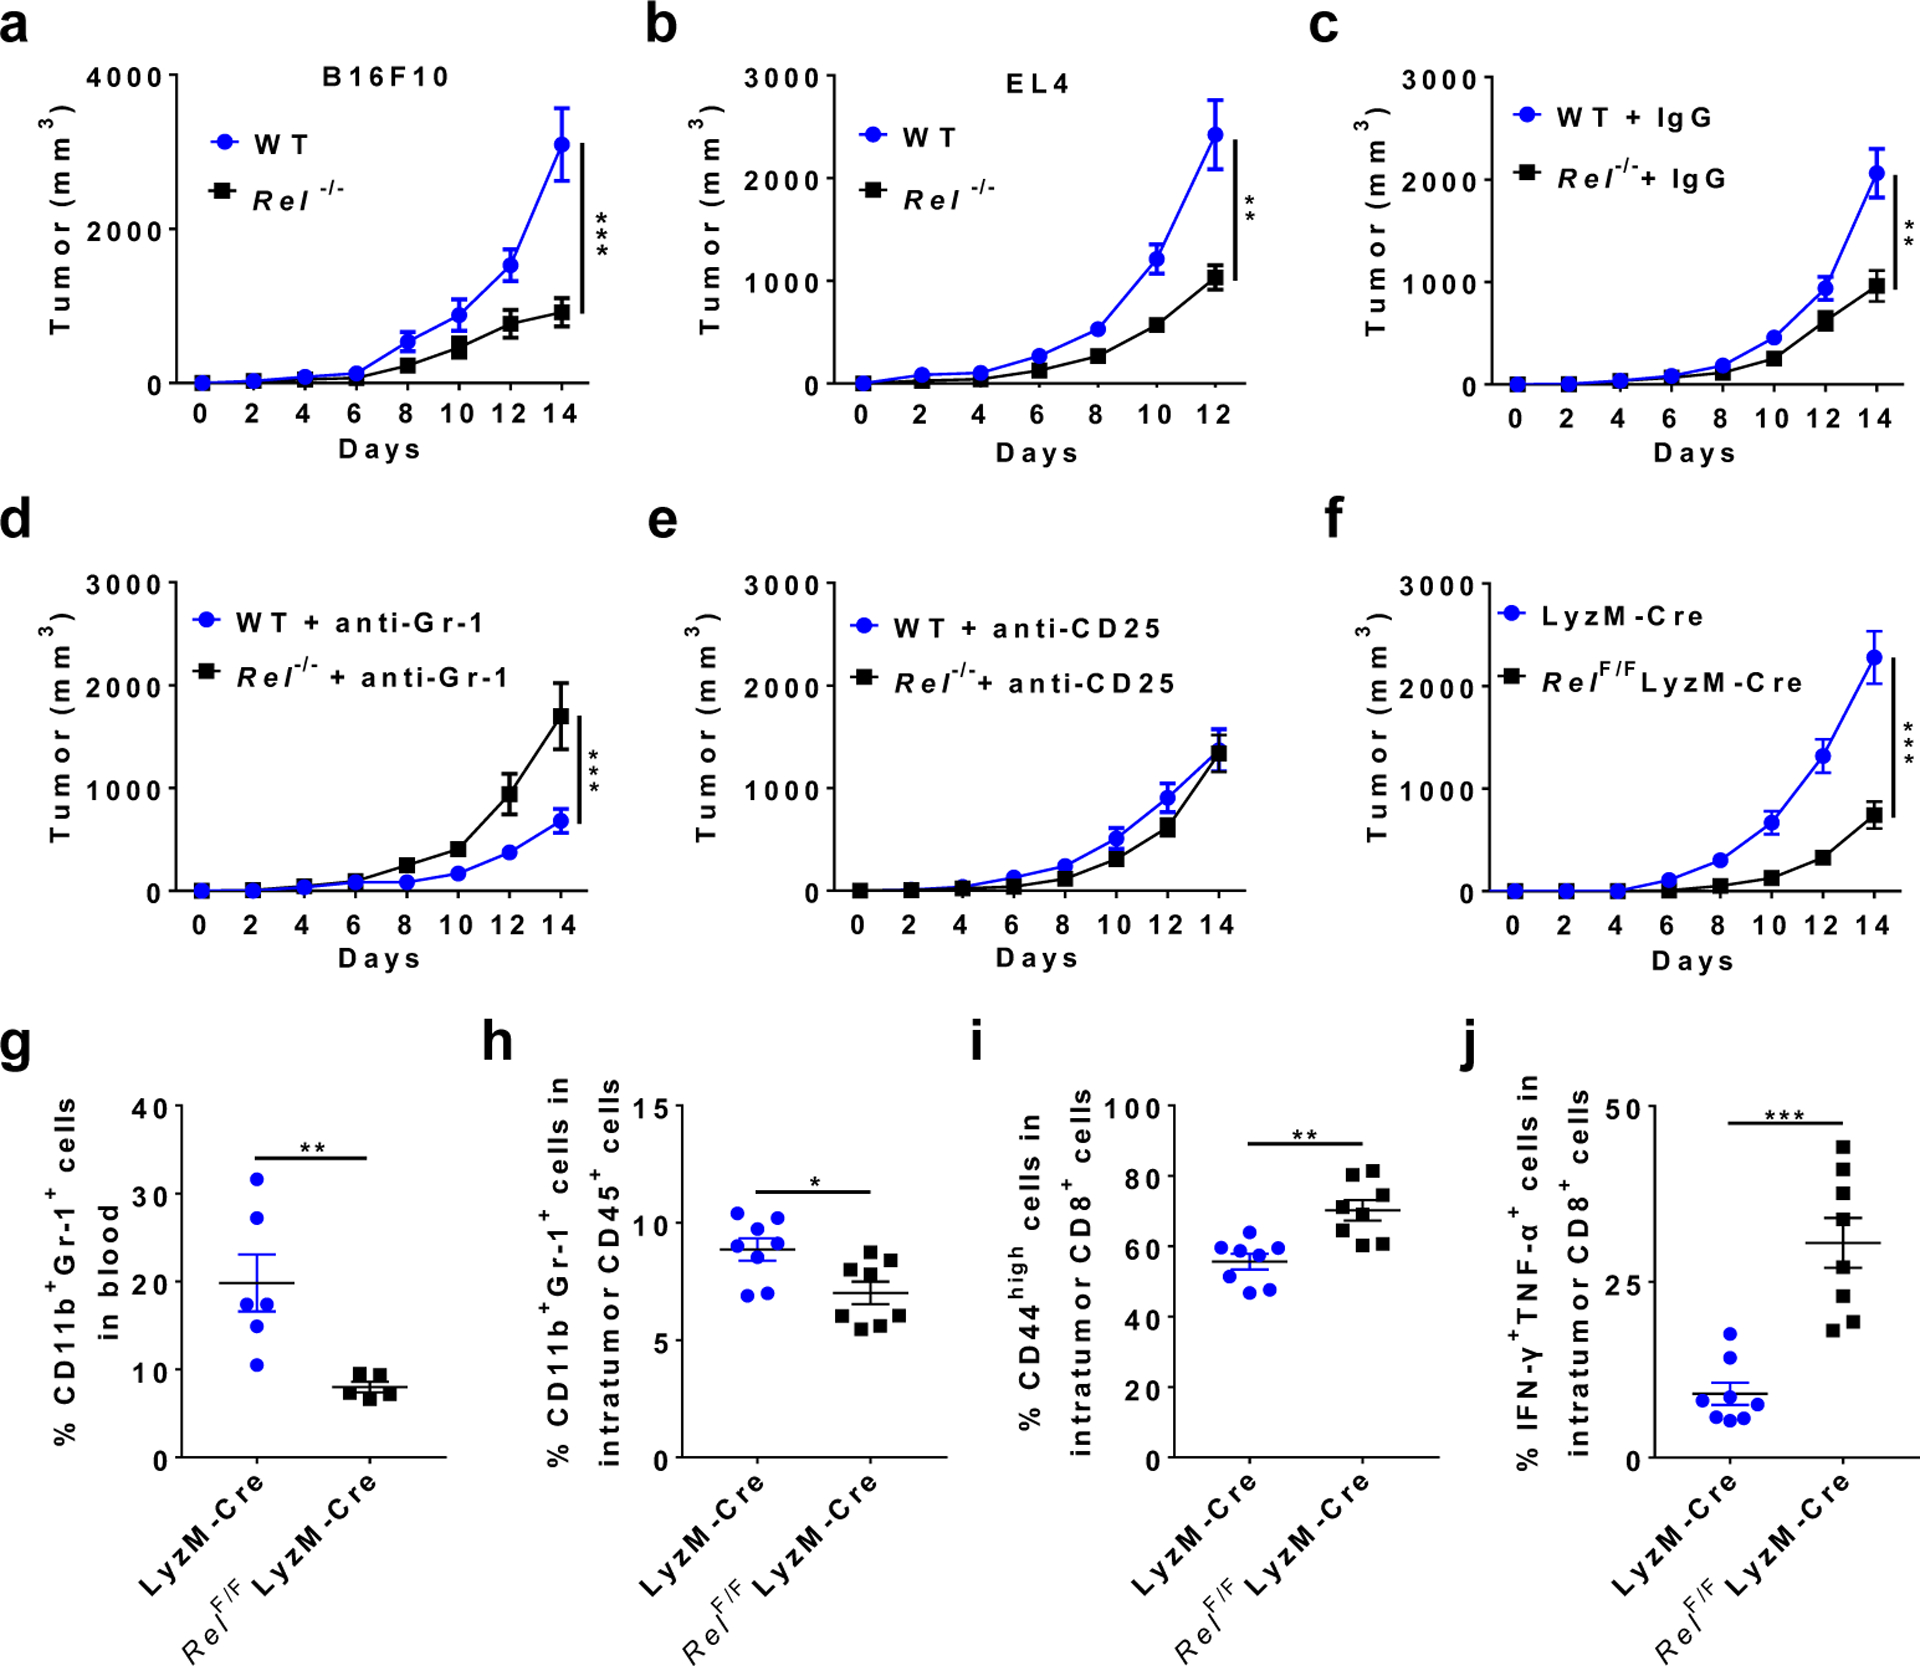
a, b, Tumor growth in wild-type (WT) and Rel−/− mice that were injected s.c. with B16F10 (a, n=20 mice/group), or EL4 (b, n=10 mice/group) tumor cells (**, P=0.0086; ***, P<0.0001).
c, Tumor growth in WT (n=16 mice/group) and Rel−/− (n=15 mice/group) mice injected with B16F10 cells and IgG isotype control (**, P=0.005).
d, Tumor growth in WT (n=11 mice/group) and Rel−/− (n=10 mice/group) mice injected with B16F10 cells and anti-Gr-1 (***, P=0.0003).
e, Tumor growth in WT (n=10 mice/group) and Rel−/− (n=10 mice/group) mice injected with B16F10 cells and anti-CD25.
f, Tumor growth in LyzM-Cre (n=18 mice/group) and LyzM-Cre RelF/F mice (n=13 mice/group) that were injected with B16F10 cells (***, P<0.0001).
g-j,Percentages of the indicated leukocyte subsets in blood (g) and tumor (h-j) of LyzM-Cre and LyzM-Cre RelF/F mice that had similar size of tumors 14 days post tumor cell inoculation, as determined by flow cytometry. n=6 for the LyzM-Cre group and n=5 for the LyzM-Cre RelF/F group (g); n=8 for both groups (h-j); *, P=0.0156; ** P<0.01; ***, P<0.0001. Statistical significance was determined by Mann-Whitney U-test (a-f) or two-tailed unpaired t-test (g-j). Data are presented as means ± s.e.m., and pooled from at least three (a-f) or two independent experiments (g-j).
We next examined the consequence of c-Rel deficiency in myeloid cells using a conditional Rel knockout approach. The RelF/F mice34 were crossed with the lysozyme M (LyzM)-Cre mice to generate mice that had c-Rel deficiency in Gr-1+ myeloid cells but not Gr-1− cells (Extended Data Fig. 1g). Remarkably, c-Rel deletion in myeloid cells significantly diminished tumor growth (Fig. 1f), indicating that tumor cells hijacked myeloid c-Rel to promote its growth.
c-Rel regulates the development, function, and metabolism of MDSCs.
Both global and myeloid c-Rel deletions significantly reduced the frequency of CD11b+Gr-1+ (including CD11b+Ly6G+ and CD11b+Ly6C+) cells in the tumor and blood, when mice with similar tumor size were compared (Fig. 1g,h and Extended Data Fig. 1h,i). The decrease in MDSC frequencies was more prominent in global Rel knockout mice than in myeloid Rel knockout mice, which suggests that c-Rel might also regulate MDSC development through MDSC-extrinsic mechanisms (such as Treg cells); alternatively, or in addition, such difference could be due to the incomplete depletion of c-Rel in the latter mice (Extended Data Fig. 1g). Consistent with these results, the percentages of activated (CD44high, CD25high, or IFN-γ+TNF-α+) CD8+ effector T cells in the tumor were significantly increased in myeloid Rel knockout mice (Fig. 1i,j and Extended Data Fig. 1j). By contrast, in the spleen of global Rel knockout mice, the percentages of CD11b+Gr-1+ cells and CD19+ B cells were not significantly changed, whereas the percentages of CD3+ T cells were reduced (Extended Data Fig. 1k–n). Similarly, in myeloid Rel knockout mice, the percentages of CD11b+Gr-1+ cells in the spleen, and the percentages of CD4+, CD4+CD25+, and CD8+ T cells in the spleen, blood, and tumor were unchanged as compared to control mice (Extended Data Fig. 2a–j). Interestingly, the percentages of intratumor CD11b+F4/80+Gr1− macrophages were increased by myeloid Rel deletion whereas those of CD11c+ cells were not affected (Extended Data Fig. 2k,l). Importantly, in non-tumor-bearing naïve mice, myeloid Rel deletion did not alter the frequencies of either splenic myeloid cells (CD11b+F4/80+, CD11b+Ly6c+, CD11b+Ly6G+, or CD11c+ cells) or lymphoid cells (CD4+, CD8+, CD4+CD25+, or CD19+ cells)(Extended Data Fig. 2m,n). Taken together, these results indicate that c-Rel is preferentially required for the generation of MDSCs in tumor-bearing mice.
Although reduced in numbers, CD11b+Gr-1+ cells were still present in tumor-bearing c-Rel-deficient mice. To determine if they were functionally competent in suppressing T cell immunity, we co-cultured them with CD8+ cytotoxic T cells. Compared with WT MDSCs, Rel−/− Gr1+CD11b+ cells (isolated from spleens of mice that had similar size of tumors to that of WT mice) had much reduced suppressive activities (Fig. 2a and Extended Data Fig. 3a). Similarly, Rel−/− MDSCs generated in vitro were also defective in suppression as compared to WT MDSCs (Fig. 2b and Extended Data Fig. 3b). In addition, while the ratio between G-MDSCs and M-MDSCs was not affected by the Rel gene mutation, Rel−/− MDSCs had a minor defect in proliferation and produced much less ROS upon stimulation (Extended Data Fig. 3c–e). Notably, the metabolism of Rel−/− MDSCs was also reprogramed, with their mitochondrial respiratory parameters significantly decreased and glycolysis enhanced as compared to WT cells (Fig. 2c–e). This change in metabolism is reminiscent of the Warburg effect, a metabolic state that is adopted by activated proinflammatory cells such as activated M1 type of macrophages.
Fig. 2. Reduced suppressive function and altered metabolism of Rel−/− Gr-1+ myeloid cells.
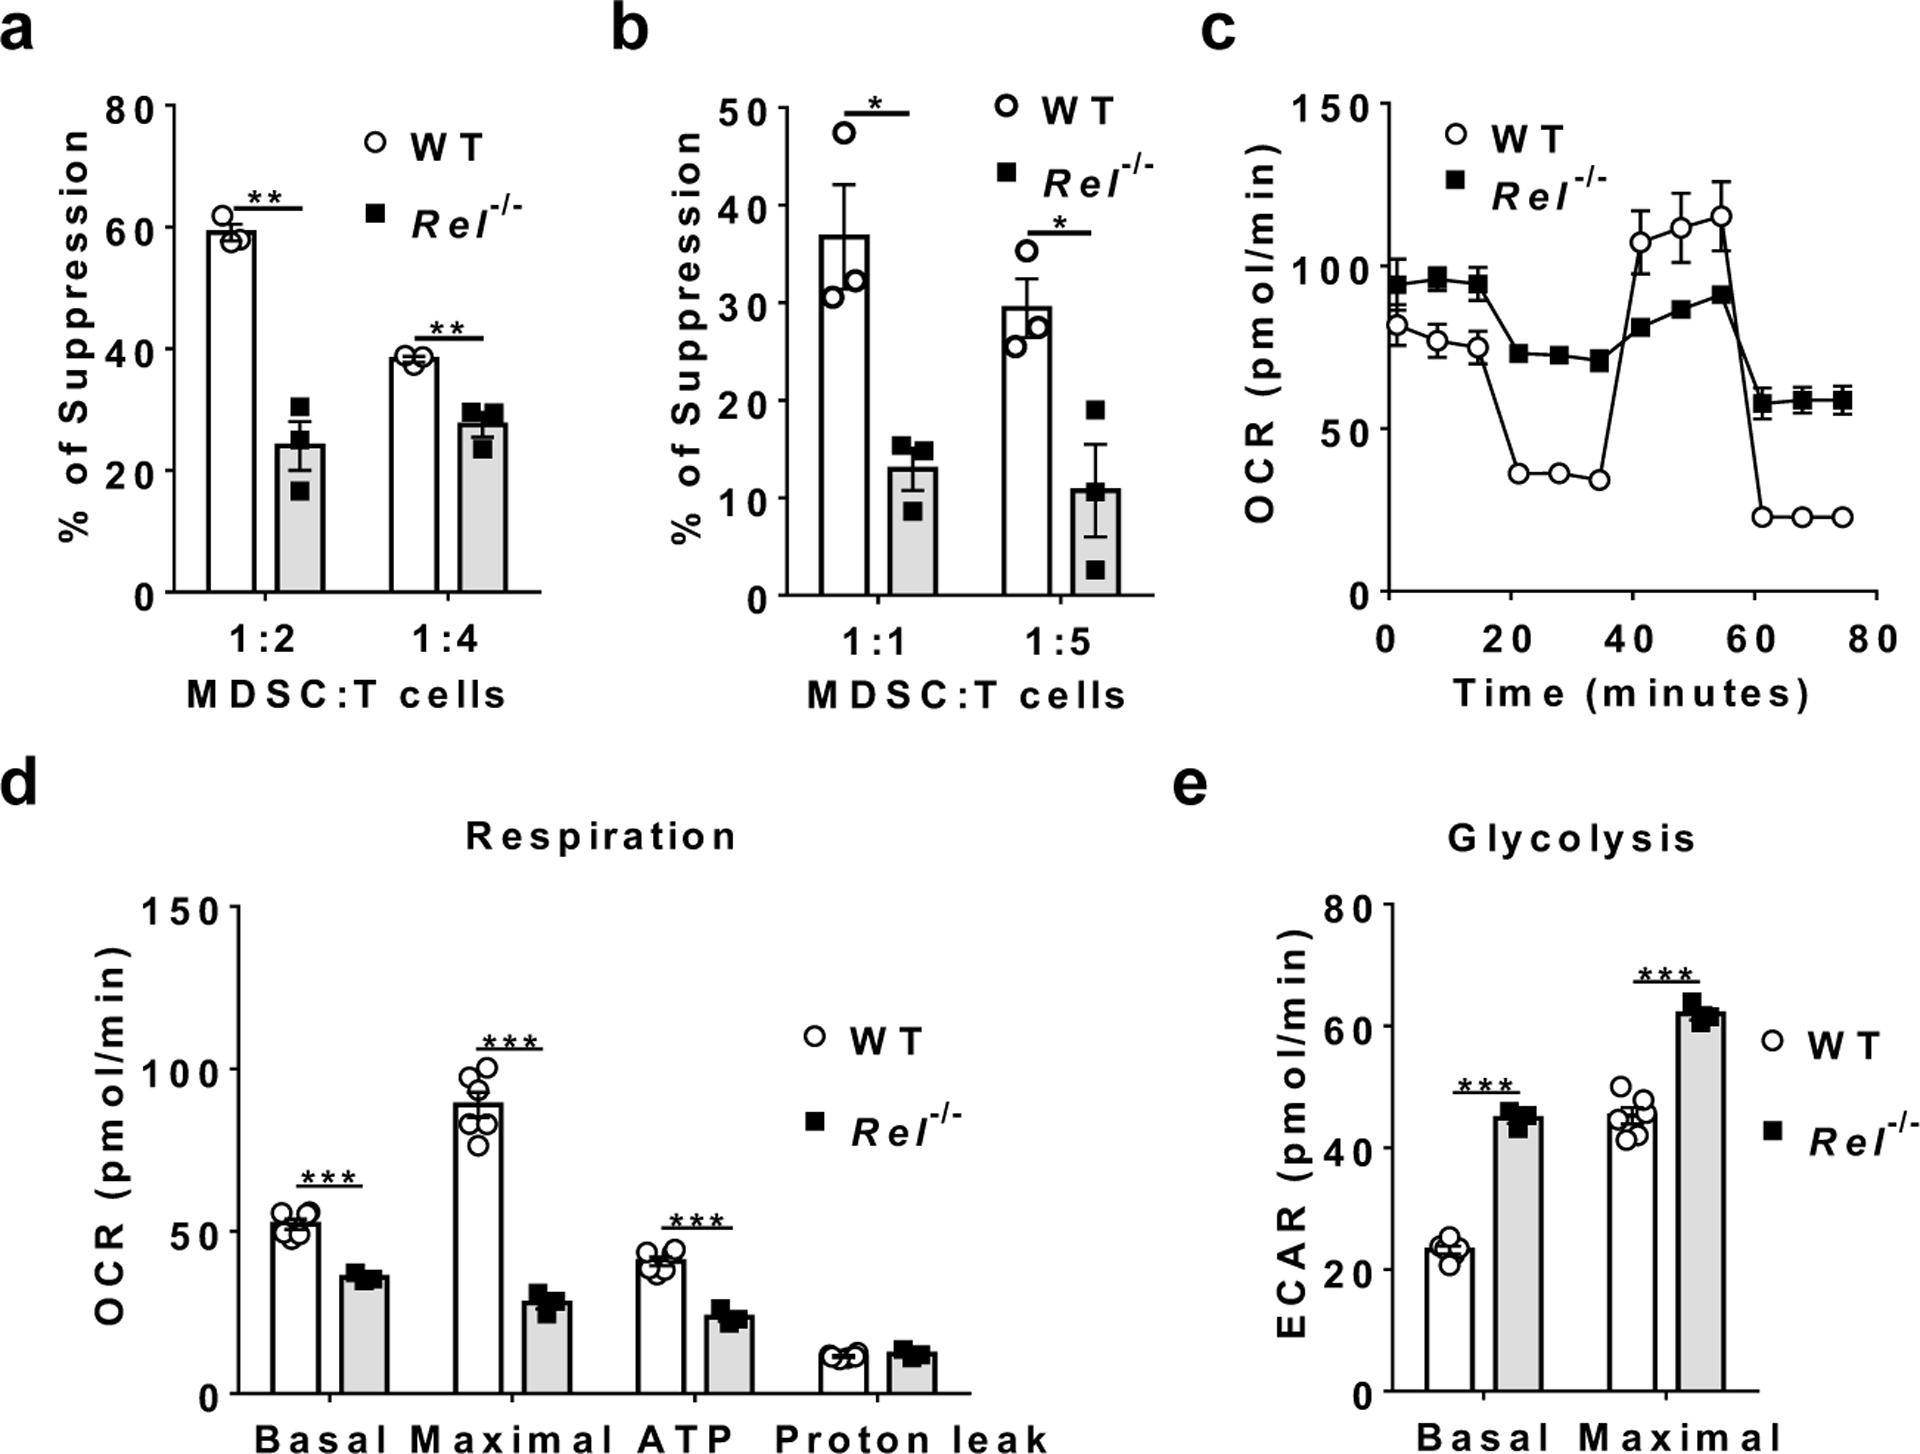
a, b, The degree of suppression, at the indicated MDSC:T cell ratio, of CD8+ T cell proliferation by purified splenic Gr-1+ myeloid cells (MDSCs) isolated by FACS from mice that had similar size of B16F10 tumor (a, n=3 mice/group), or generated in vitro from bone marrow of naïve mice (b, n=3 mice/group) (*, P<0.05; **, P<0.01).
c, Mitochondrial oxygen consumption rate (OCR) of bone marrow-derived MDSCs from WT (n=6) or Rel−/− (n=3) mice as measured by Seahorse XF96 analyzer.
d, Basal respiration, maximal respiration, ATP production, and proton leak of WT (n=6 mice) and Rel−/− (n=3 mice) MDSCs measured from the data in c (***, P<0.001).
e, Basal glycolysis and maximal glycolysis of WT (n=6 mice) and Rel−/− (n=3 mice) MDSCs measured using a Seahorse XF96 analyzer (***, P<0.0001). Statistical significance was determined by two-tailed unpaired t-test (a-b, d-e). For all panels, data are presented as means ± s.e.m.
The functional defect of Rel−/− MDSCs could be rescued by re-expressing c-Rel. Thus, Rel−/− MDSCs that expressed a Rel transgene had a significantly increased tumor-promoting effect in mice than Rel−/− MDSCs, following co-transfer with B16F10 melanoma cells (Extended Data Fig. 3f). Moreover, c-Rel expression in Rel−/− MDSCs also decreased the frequencies of activated intratumor CD8+ T cells (Extended Data Fig. 3g). To further examine whether Rel KO MDSCs gain immune-enhancing functions, we performed MDSC-T cell suppression assays with varying concentrations of anti-CD3 and anti-CD28, and with BMDMs as a control. We found that when T cell stimulation strength was reduced, Rel KO MDSCs completely lost their suppressive activity (Extended Data Fig. 3h,i). However, their enhancing effect, if any, was weak, similar to that of BMDMs.
c-Rel-deficient MDSCs selectively turn on anti-tumoral gene signatures but not pro-tumoral gene signatures.
Although phenotypically similar to other myeloid cells, MDSCs express unique gene signatures not shared by other myeloid cells8, 36, 37. To compare the transcriptome profile of WT and Rel−/− bone marrow-derived MDSCs, we extracted their RNAs and performed quantitative RNA sequencing (with 20M clean reads in each sample). We detected 12213 highly expressed genes in total, and among these, 525 genes were significantly downregulated and 647 genes upregulated (for more than 2 fold) in Rel−/− MDSCs as compared to WT cells (Fig. 3a). The downregulated genes in Rel−/− MDSCs include many protumoral genes (such as Arg1, Cebpb, and Nos2), and are highly enriched in glucose, amino acid, and lipid metabolic pathways (Fig. 3b,c and Supplementary Table 1), whereas the upregulated genes include many antitumoral genes (such as Il1b, Tnfa, and Il12p40), and are highly enriched in cell cycle checkpoint and inflammatory responses (Fig. 3d–g, Extended Data Fig. 4a, and Supplementary Tables 1–2). In addition, Gene Set Enrichment Analysis (GSEA) revealed that Rel−/− cells lost most of the MDSC signatures, and their transcriptome was more like that of neutrophils (Figure 3h,i). Moreover, C/EBP target genes (such as Arg1 and Fabp4) were significantly downregulated in Rel−/− cells (Extended Data Fig. 4b). Consistent with these findings, Western blotting and RT-PCR analyses revealed that Rel−/− MDSCs expressed much reduced levels of protumoral genes such as Arg1, Il10, Cebpb, and Nos2 (Fig. 4a–c), but the expression of the antitumoral genes such as Tnfa and Il1b was upregulated (Fig. 4d). Both arginase-1 and C/EBP (isoforms LAP* and LAP) proteins were also reduced in RelMDSCs isolated from tumor-bearing mice (Fig. 4a) or generated in vitro (Fig. 4b).
Figure 3. Loss of MDSC gene signatures from Rel−/− myeloid cells.
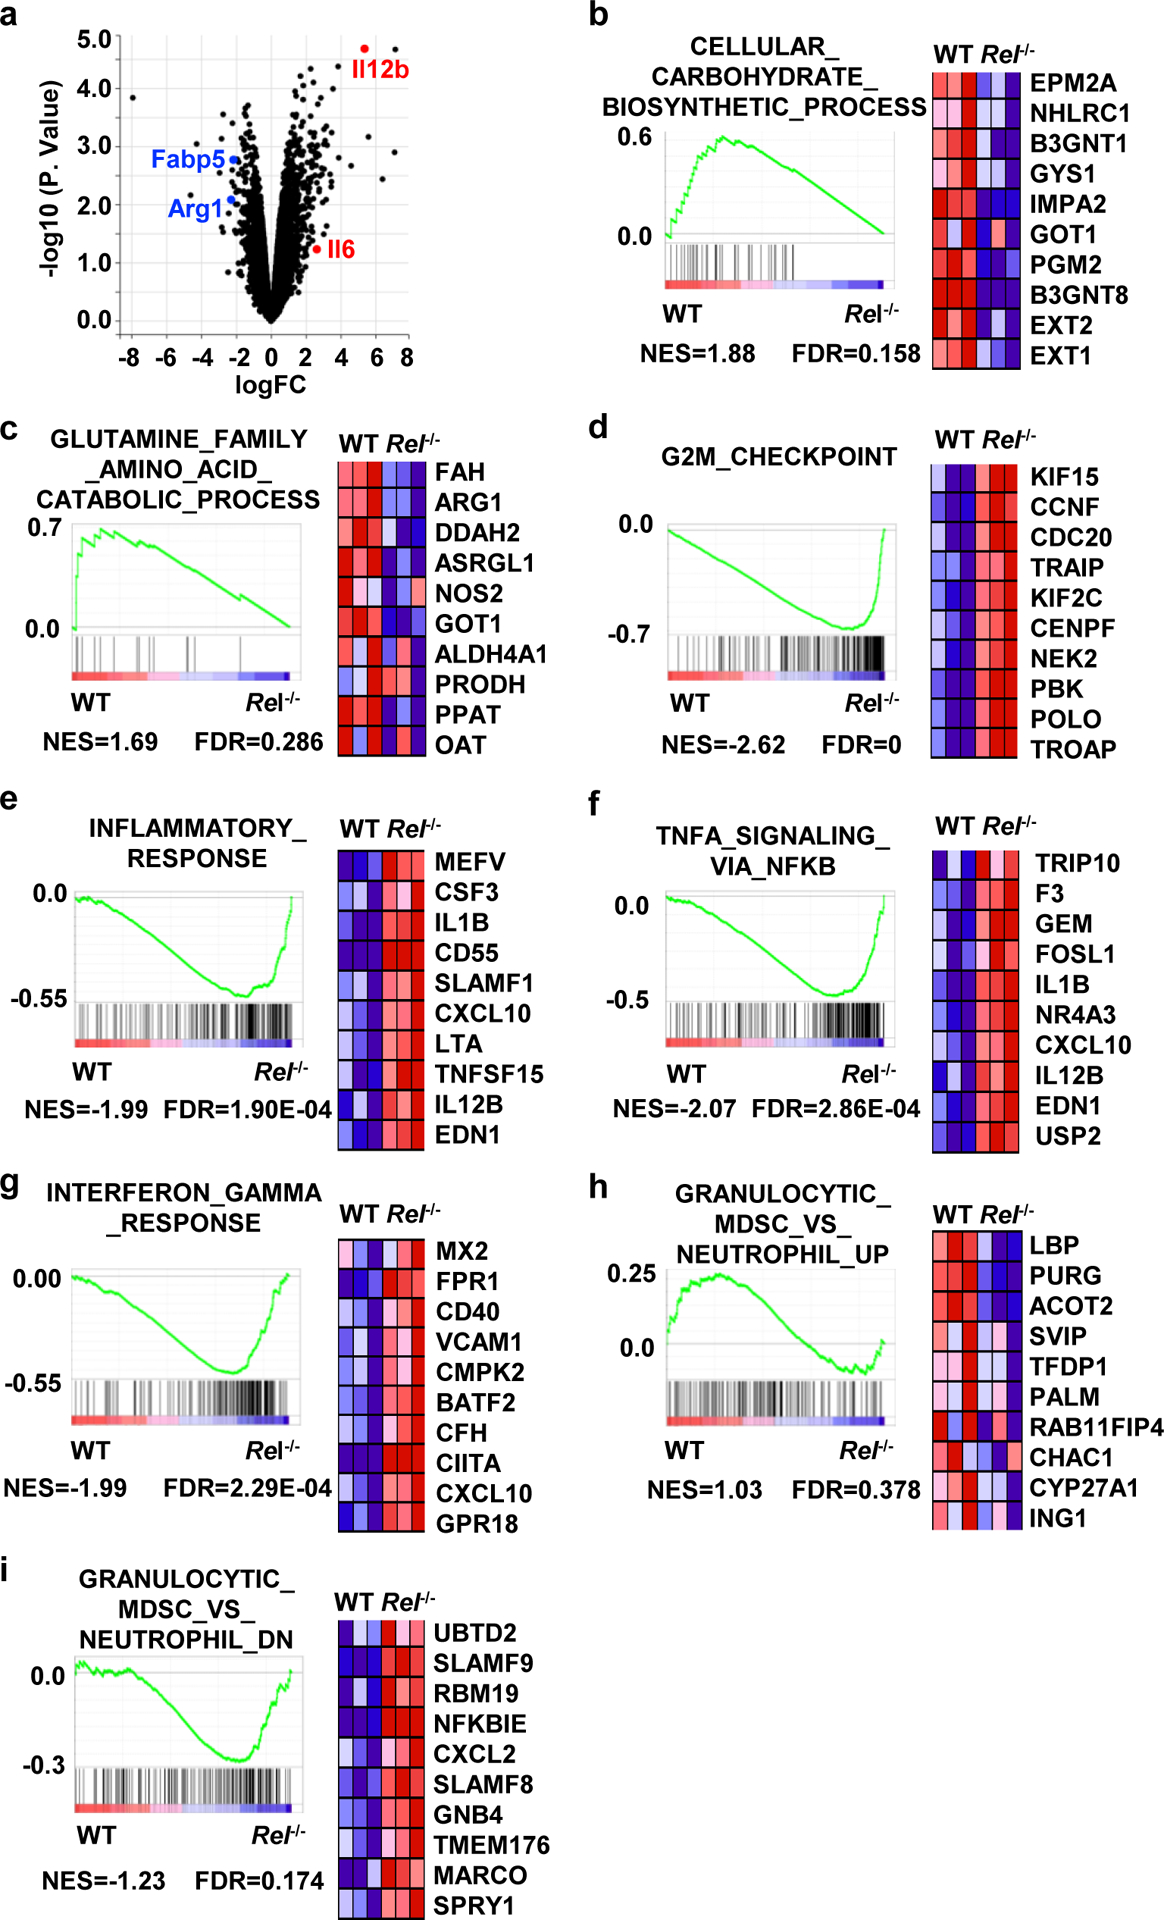
a, Volcano plot showing genes that are changed in Rel−/− bone marrow-derived MDSCs in comparison with WT MDSCs, as determined by RNA-seq. n=3 mice/group.
b-i, Results from gene set enrichment analysis (GSEA) of the RNA-seq data of bone marrow-derived WT and Rel−/− MDSCs. Representative genes from each category are shown. n=3 mice/group. Statistical significance was determined by linear modelling and Bayesian statistics after correcting for multiple testing using the Benjamini–Hochberg procedure (a), or Wald test with Benjamini-Hochberg’s multiple-comparison correction (b-i).
Fig. 4. c-Rel activates MDSC signature genes including Cebpb and Arg1.
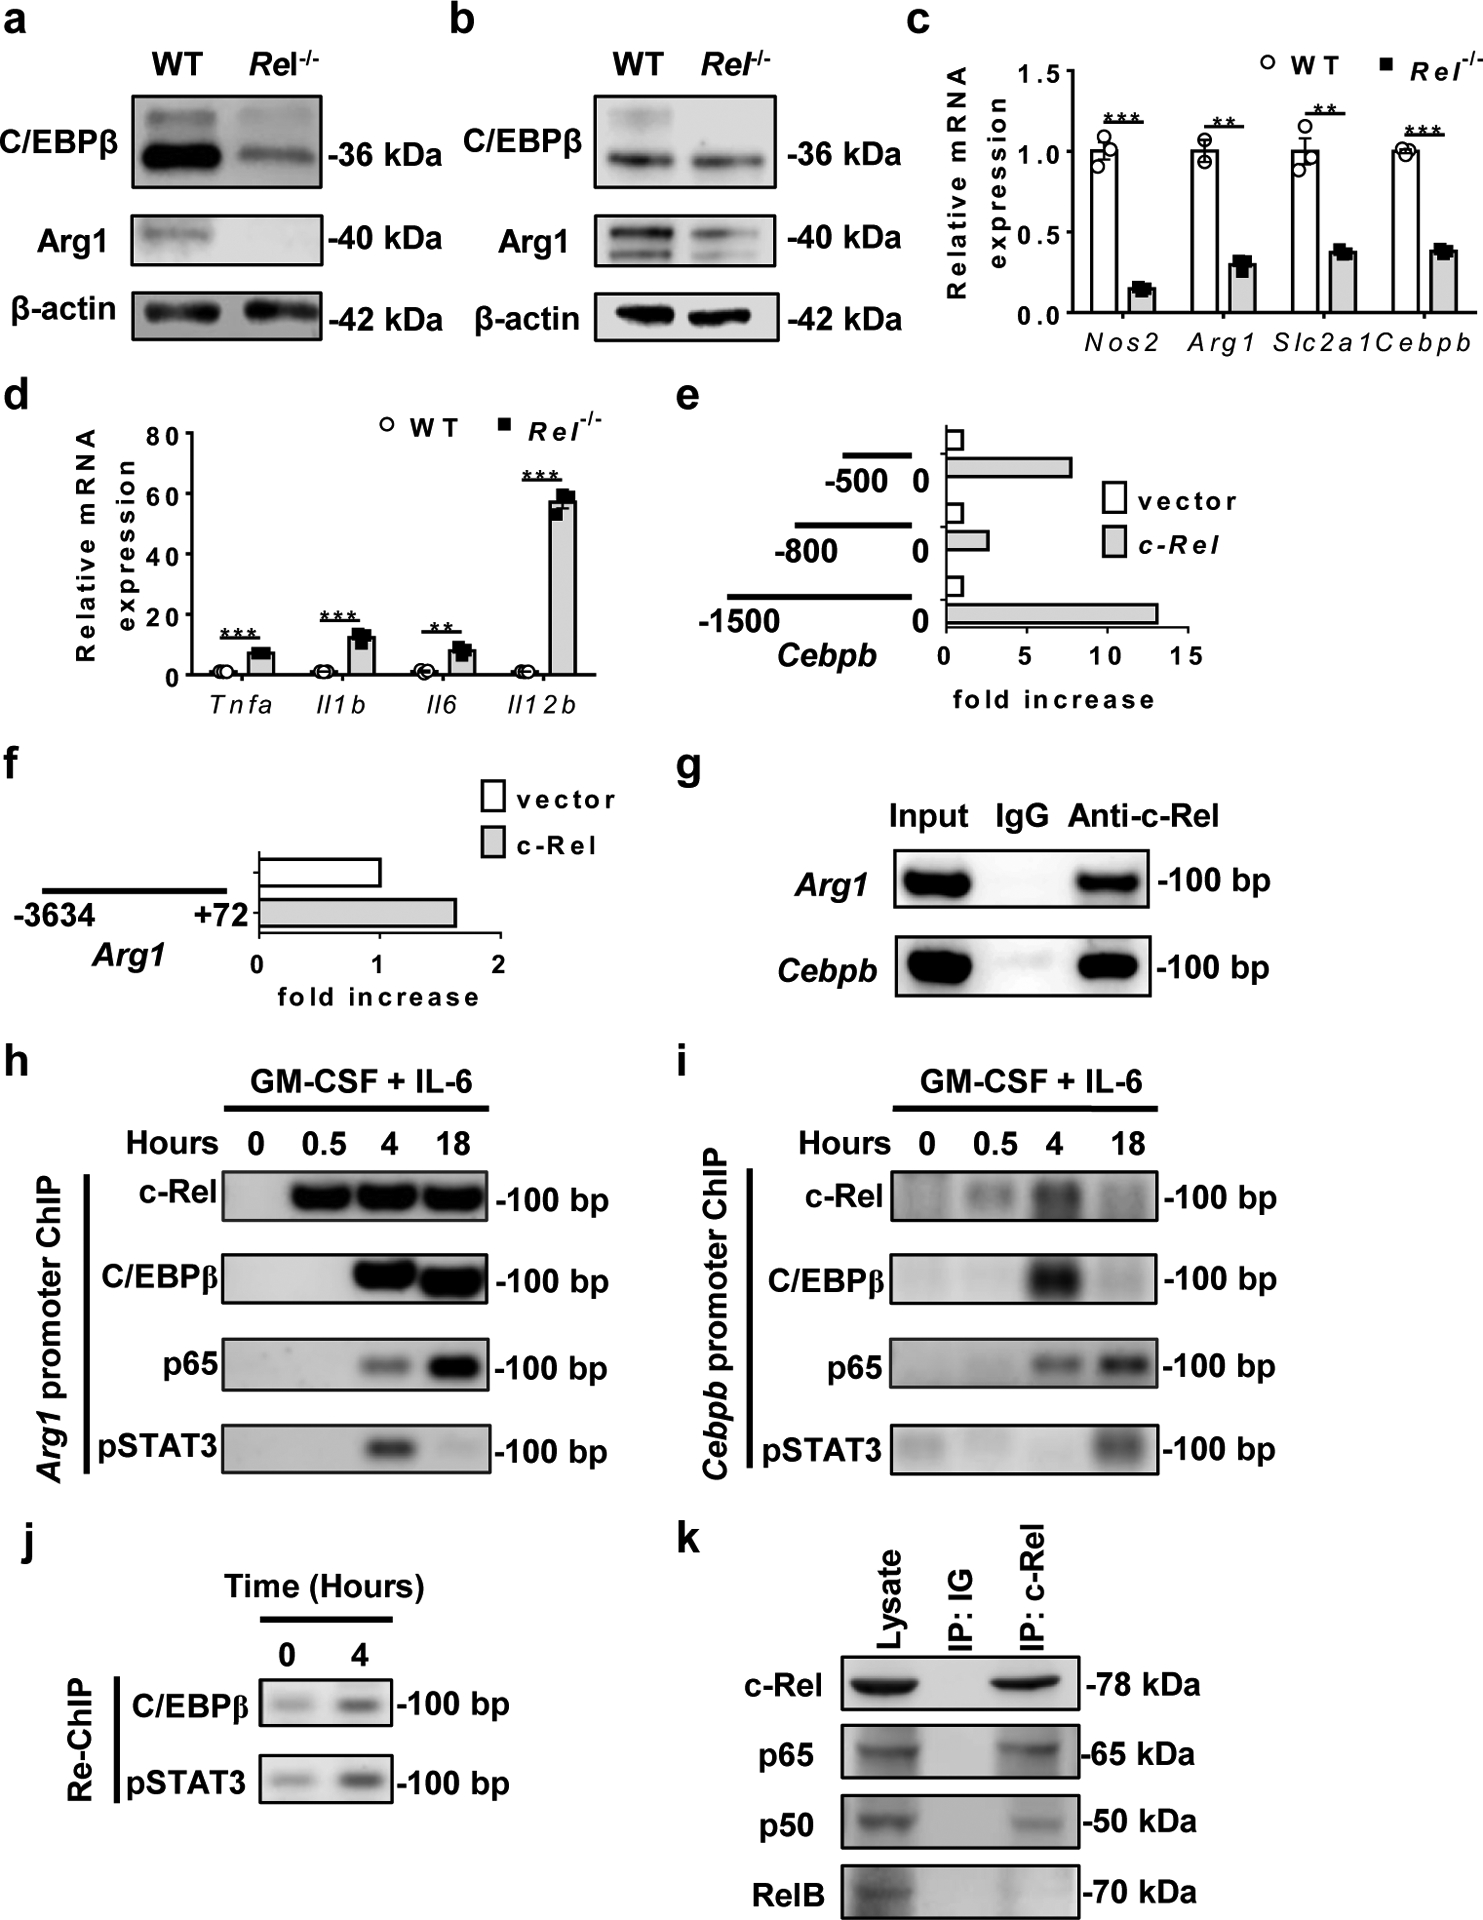
a, b, C/EBPβ and Arg1 protein expression in MDSCs from WT and Rel−/− mice that had similar size of B16F10 tumors, or bone marrow-derived MDSCs as determined by Western blot.
c, d, Relative mRNA levels of downregulated (c) and upregulated (d) genes in bone marrow-derived Rel−/− MDSCs as compared to WT MDSCs, determined by real-time RT-PCR (n=3 biologically independent cultures/group; **, P<0.01; ***, P<0.001)
e, f, The effect of Rel gene on Cebpb (e) and Arg1 (f) gene promoter regions as determined in the luciferase reporter assay. The results are representative of two independent experiments.
g, c-Rel binding to the Cebpb and Arg1 gene promoter regions in bone marrow-derived MDSCs as determined by chromatin immunoprecipitation (ChIP). Control IgG and input DNA are shown as controls.
h-i, The binding kinetics of c-Rel, C/EBPβ, p65, and pSTAT3 to the Arg1 (h) and Cebpb (i) gene promoters in cultured bone marrow cells treated with GM-CSF and IL-6 for up to 18 hours.
j, The presence of the enhanceosome complex at the Cebpb promoter in cultured bone marrow cells treated with (4 hours) or without GM-CSF and IL-6, as determined by first ChIP with anti-c-Rel and Re-ChIP with anti-C/EBPβ and anti-pSTAT3.
k, Co-immunoprecipitation (co-IP) of c-Rel with the indicated proteins (marked on the right), of bone marrow-derived MDSCs from WT mice.
Statistical significance was determined by two-tailed unpaired t-test (c-f). Data are presented as means ± s.e.m (c-f).
c-Rel enhanceosome specifies the expression of MDSC signature genes.
The transcription factor c-Rel exerts its function by directly binding to the regulatory regions of its target genes. To establish whether and how c-Rel directly controlled the expression of MDSC signature genes such as Cebpb and Arg1, we performed promoter transactivation, chromatin immunoprecipitation (ChIP), and Re-ChIP analyses. We found that c-Rel could activate both Cebpb and Arg1 gene promoters, and that nucleotides 800 to 500 of the Cebpb gene contained a potential repressor (Fig. 4e,f). c-Rel could bind to both Cebpb and Arg1 gene promoters in bone marrow-derived MDSCs (Fig. 4g). During MDSC differentiation, c-Rel binding to Cebpb and Arg1 gene promoters increased markedly in response to GM-CSF stimulation starting as early as 0.5 hour. Binding to these promoters by C/EBPβ, p65, and pSTAT3 appeared to be delayed as compared to c-Rel (Fig. 4h–i). However, Re-ChIP analysis revealed that these transcription factors bound to the same promoter element, indicating the formation of a single enhanceosome complex (Fig. 4j). By co-IP, we found that c-Rel bound to p65 and to a lesser degree p50, but not RelB in MDSCs (Fig. 4k).
The finding that Rel KO MDSCs had enhanced inflammatory gene expression is surprising since c-Rel has been firmly established to control the expression of inflammatory genes. Indeed, when we compared the transcriptomes of lipopolysaccharide (LPS)-treated bone marrow derived-macrophages (BMDMs) of WT and Rel KO mice, we found that c-Rel deficiency markedly reduced the expression of many inflammatory genes including Il1b and Il12p40 (Extended Data Fig. 5). This paradox may be explained by the finding that c-Rel regulates its target genes in a cell type- or lineage-specific manner38. For example, in BMDMs, c-Rel was readily detectable by ChIP on the promoter of the inflammatory gene Il12p40 (Fig. 5a). By contrast, in MDSCs, c-Rel could not be detected on the Il12p40 gene promoter even after stimulation with IL-6 and GM-CSF (Fig. 5a,b). These results indicate that MDSCs and BMDMs are different in their Il12p40 gene accessibility by c-Rel, which explains why c-Rel regulates the expression of Il12p40 gene in macrophages, but not in MDSCs. The heightened inflammatory gene expression in Rel KO MDSCs was likely due to the reduced expression of C/EBP, a master transcription factor for MDSC development. Cebpb gene expression was significantly reduced in Rel KO MDSCs, and overexpression of Cebpb in Rel KO MDSCs rescued their defects, which included the expression of proinflammatory cytokine genes such as Il12b, Il6, Tnfa, and Il1b as well as that of Arg1 (Fig. 5c–h). These results suggest that c-Rel indirectly suppresses the expression of the proinflammatory cytokines by regulating Cebpb. Additionally, Cebpb overexpression also enhanced mitochondrial respiration, decreased glycolysis of Rel KO MDSCs, and restored their suppressive functions against T cells (Fig. 5i–l).
Fig. 5. c-Rel regulates MDSC gene expression, metabolism, and suppressive function via Cebpb.
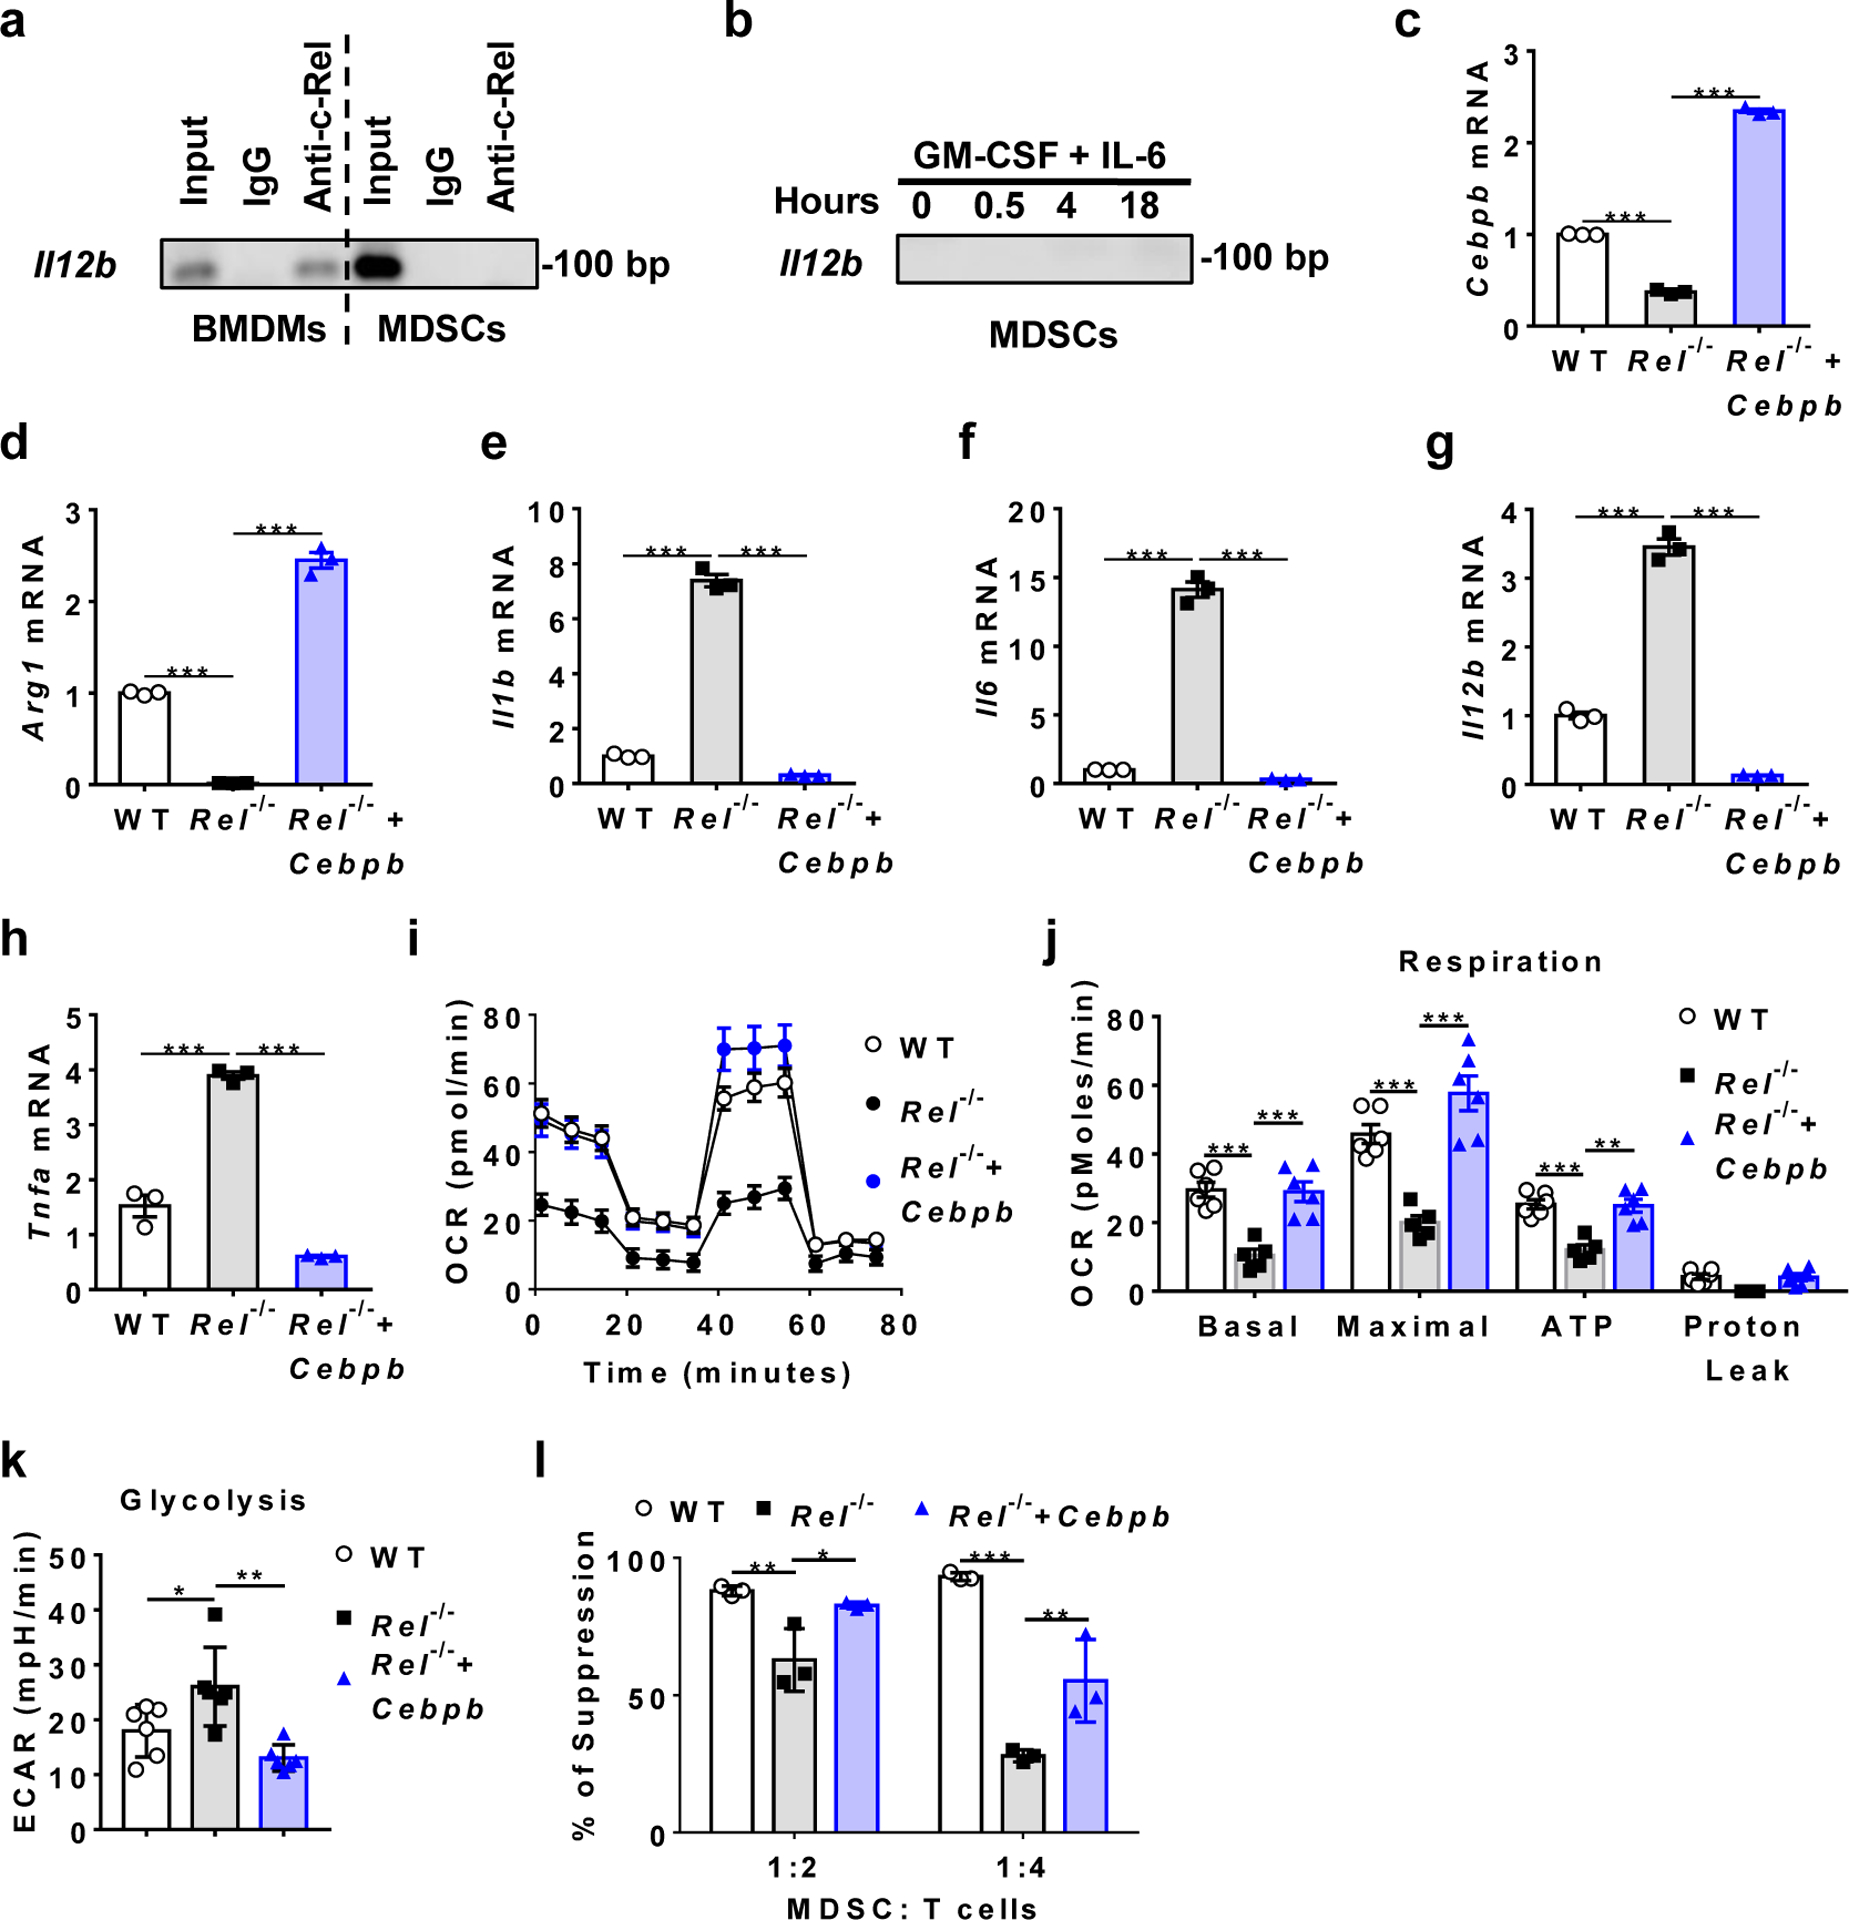
a, b, Measuring c-Rel binding to the Il12b gene promoter in resting BMDMs and MDSCs (a), or MDSCs treated with GM-CSF and IL-6 (b), by ChIP with anti-c-Rel. Input DNA and IgG were used as controls.
c-h, Relative mRNA levels of the indicated genes in bone marrow-derived WT MDSCs infected with control virus (WT), Rel−/− MDSCs infected with control virus (Rel−/−), and Rel−/− MDSCs infected with Cebpb-expressing virus (Rel−/−+ Cebpb). n=3 biologically independent cultures/group (***, P<0.0001).
i, Mitochondrial oxygen consumption rate (OCR) in the WT (n=6 cultures), Rel−/− (n=5 cultures), and Rel−/−+ Cebpb (n=6 cultures) MDSCs as measured by Seahorse XF96 analyzer.
j, Basal respiration, maximal respiration, ATP production, and proton leak in the WT (n=6 cultures), Rel−/− (n=5 cultures), and Rel−/−+ Cebpb (n=6 cultures) MDSCs as measured in i (**, P=0.0012; ***, P<0.001).
k, Basal glycolysis and maximal glycolysis in the indicated groups of MDSCs (n=6 cultures/group) measured using a Seahorse XF96 analyzer (*, P=0.0416; **, P=0.0015).
l, The degree of suppression of CD8+ T cell proliferation by MDSCs (n=3 cultures/group) shown in panel c (*, P=0.023; **, P<0.01, ***, P<0.0001).
Statistical significance was determined by one-way ANOVA with Turkey post-hoc test (c-h, k) or two-way ANOVA with Turkey post-hoc test (j, l). Data are presented as means ± s.e.m. (c-j).
Pharmaceutical inhibition of c-Rel blocks tumorigenesis and enhances the anti-tumor effect of PD1 antibodies.
These results indicate that c-Rel may serve as an immunotherapeutic target for cancer. To test this theory, we examined the therapeutic potential of an isothiourea c-Rel inhibitor (R96A) previously developed by us39. The specificity of the c-Rel inhibitor was confirmed in the following assays. Firstly, using WT Jurkat T cells that expressed c-Rel, KO Jurkat T cells that did not express c-Rel (generated by us using the CRISPR-Cas9 system), EL4 cells that expressed c-Rel, and B16F10 cells that expressed little or no c-Rel, we showed that the inhibitor effect on cell growth was c-Rel-dependent (Extended Data Fig. 6a–c). For example, the c-Rel inhibitor could reduce the proliferation of WT Jurkat T cells that expressed c-Rel, but not that of REL KO Jurkat T cells (Extended Data Fig. 6a). Secondly, the gene Il2 is one of the best characterized targets of c-Rel. The c-Rel inhibitor R96A could significantly block anti-CD3- and anti-CD28-induced IL-2 expression of WT human Jurkat and primary T cells at a concentration of 1μM, but had no effect on IL-2 expression of REL KO Jurkat T cells (Extended Data Fig. 6d,e). Lastly, By oligonucleotide pull-down, we showed that the inhibitor preferentially blocked the binding of NF-B consensus nucleotides to c-Rel in the nucleus as compared to other NF-B family members (p50, RelB, and p65/RelA) (Extended Data Fig. 6f).
To test the inhibitor effect on tumorigenesis, we injected R96A into mice and studied its effect on tumor growth and MDSC generation. The c-Rel inhibitor significantly reduced both melanoma and lymphoma growth in mice (Fig. 6a–c). This effect was c-Rel-dependent since the growth of melanoma cells in c-Rel-deficient mice was not affected by the inhibitor (Fig. 6d). The mouse body weight was measured during c-Rel inhibitor treatment, and no inhibitor-induced changes were observed (Extended Data Fig. 6g). The body weight increase in tumor-bearing animals was likely due to the tumor burden. As expected, the c-Rel inhibitor was highly effective in blocking MDSC generation or function both in mice and in cultures (Fig. 6e,f and Extended Data Fig. 6h,i).
Fig. 6. c-Rel inhibitor blocks tumor growth and MDSC development and enhances the effect of anti-PD1 therapy.
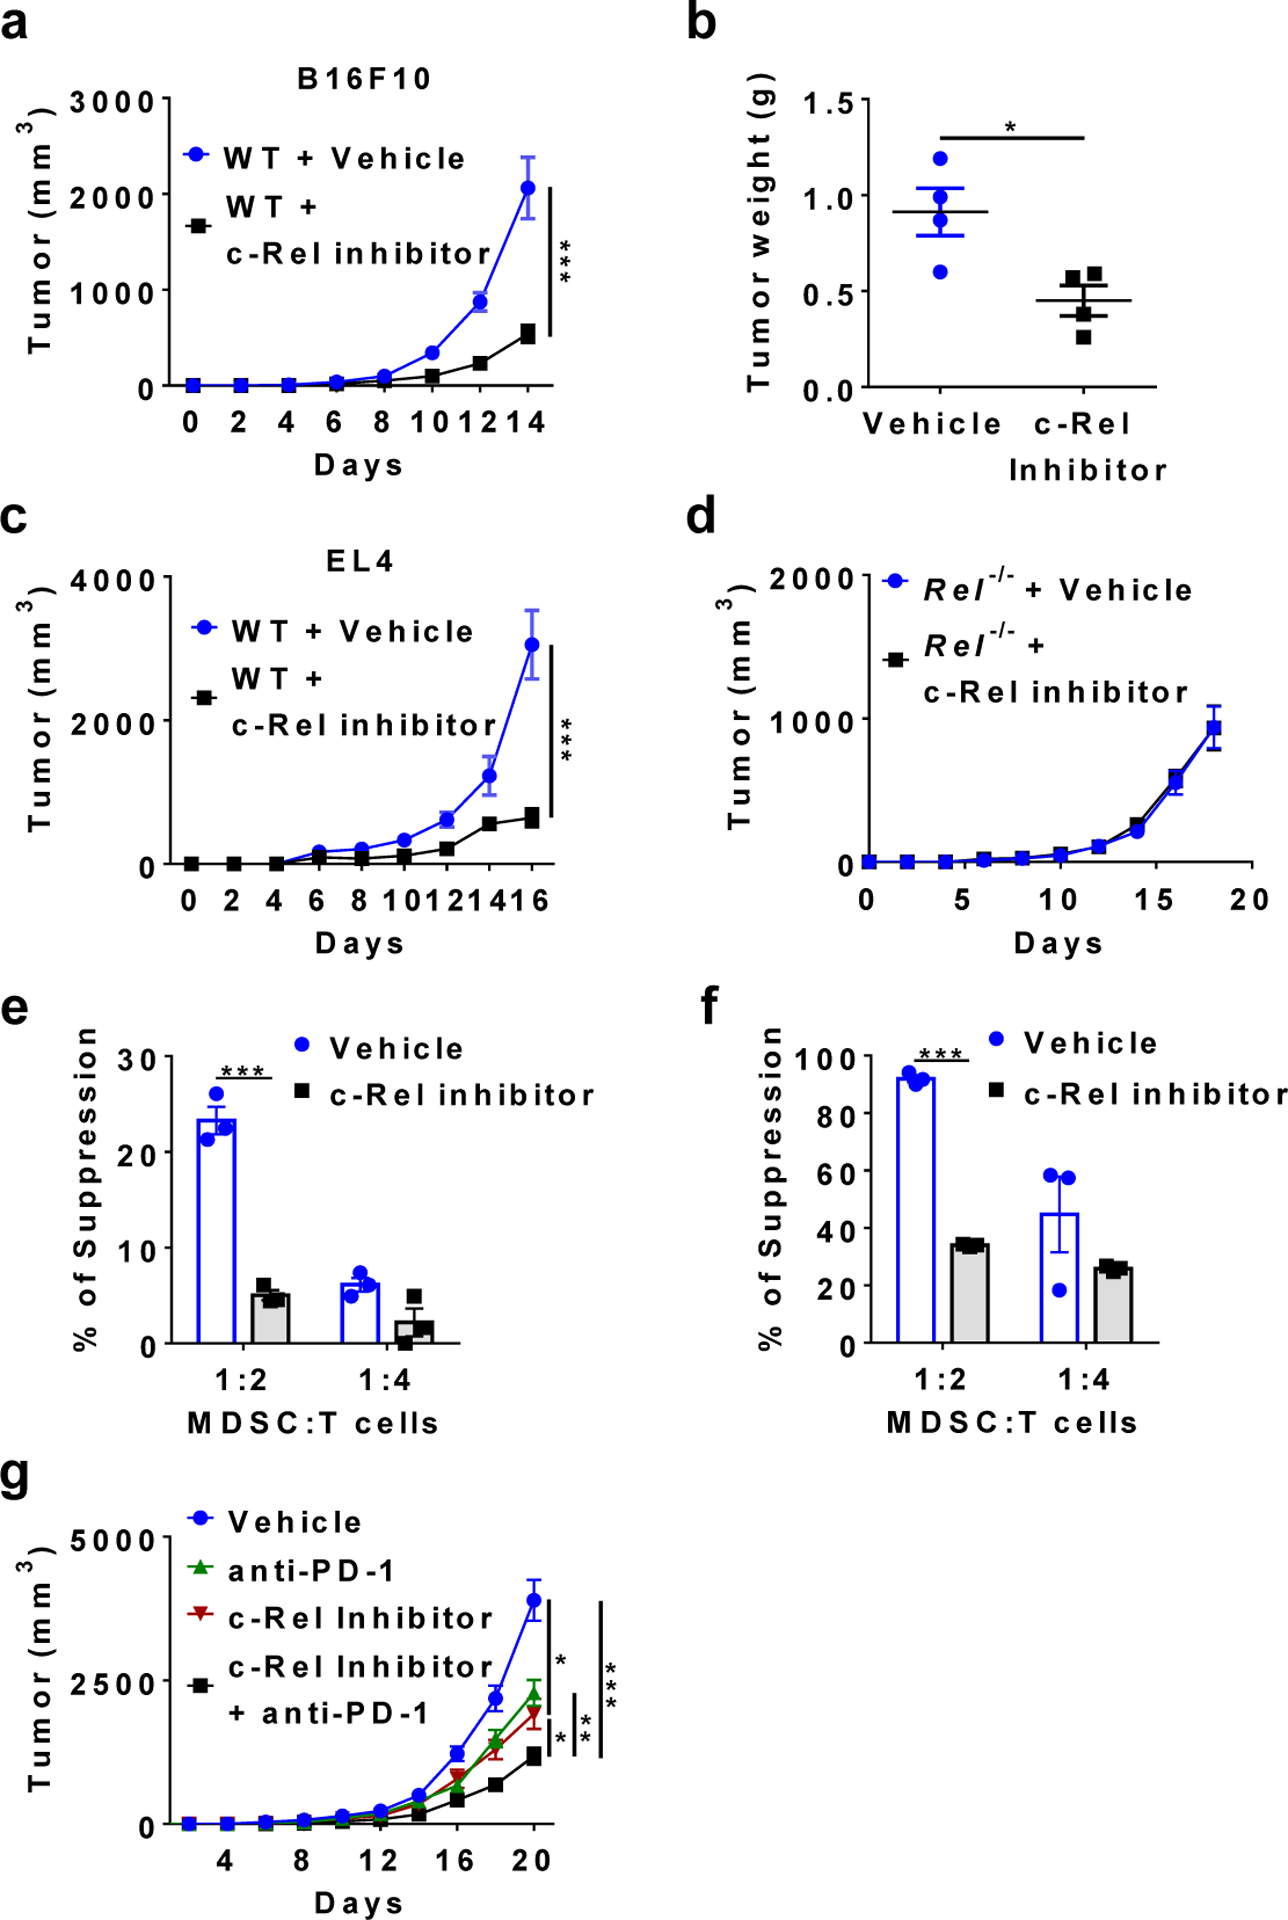
a, b, Tumor growth in WT mice that were injected s.c. with B16F10 cells and i.p. with c-Rel inhibitor (n=8) or vehicle control (n=9) (a), and tumor weight (n=4 in each group) at the end of the experiment (b). *, P=0.0196, ***, P=0.0001.
c, Tumor growth in WT mice that were injected s.c. with EL4 cells and i.p. with c-Rel inhibitor (n=6) or vehicle control (n=5). *, P=0.0003.
d, Tumor growth in Rel−/− mice that were injected s.c. with B16F10 cells and i.p. with c-Rel inhibitor (n=5) or vehicle control (n=3).
e, f, The degree of suppression of CD8+ T cell proliferation by purified Gr-1+ myeloid cells (MDSCs) isolated from mice described in a (e), or by MDSCs generated from bone marrow with or without c-Rel inhibitor (f). n=3 mice/group; ***, P<0.001.
g, Tumor growth in WT mice that were injected s.c. with B16F10 cells and i.p. with c-Rel inhibitor (n=9), anti-PD1 (n=10), c-Rel inhibitor+anti-PD1 (n=8), or vehicle (n=9) as indicated. *, P<0.05, **, P=0.0065, ***, P<0.0001.
Mice were injected with either 0.25×10⁶ tumor cells per mouse (g) or 0.5×10⁶ cells per mouse (a-d). Statistical significance was determined by Mann-Whitney U-test (a, c, g) or two-tailed unpaired t-test (b, e-f). Error bars indicate s.e.m.
It has been shown that PD1 blockade significantly inhibits melanoma growth. When tested in the same experiment, we found that the c-Rel inhibitor was as effective as the anti-PD1 in suppressing tumor growth (Fig. 6g). Importantly, combination of anti-PD1 and c-Rel inhibitor conferred the strongest suppression of tumor growth.
Pharmaceutical inhibition of c-Rel blocks the generation of human MDSCs.
Although initially identified from mice, MDSCs have also been found in human patients with a variety of cancers6, 40. Additionally, highly suppressive human MDSCs can be generated in vitro41. To determine whether c-Rel is required for the generation of human MDSCs, we cultured peripheral blood mononuclear cells (PBMCs) with GM-CSF and IL-6 in the presence or absence of our c-Rel inhibitor. As expected, human MDSCs generated in vitro were potent suppressors of human CD8+ T cell proliferation. By contrast, the MDSCs generated in the presence of the c-Rel inhibitor had significantly reduced suppressive activities (Fig. 7a), and expressed much reduced MDSC signature mRNAs ARG1 and CEBPB (Fig. 7b). These results indicate that c-Rel inhibition in humans might help eliminate cancer by blocking MDSCs.
Fig. 7. c-Rel inhibitor blocks human MDSCs.
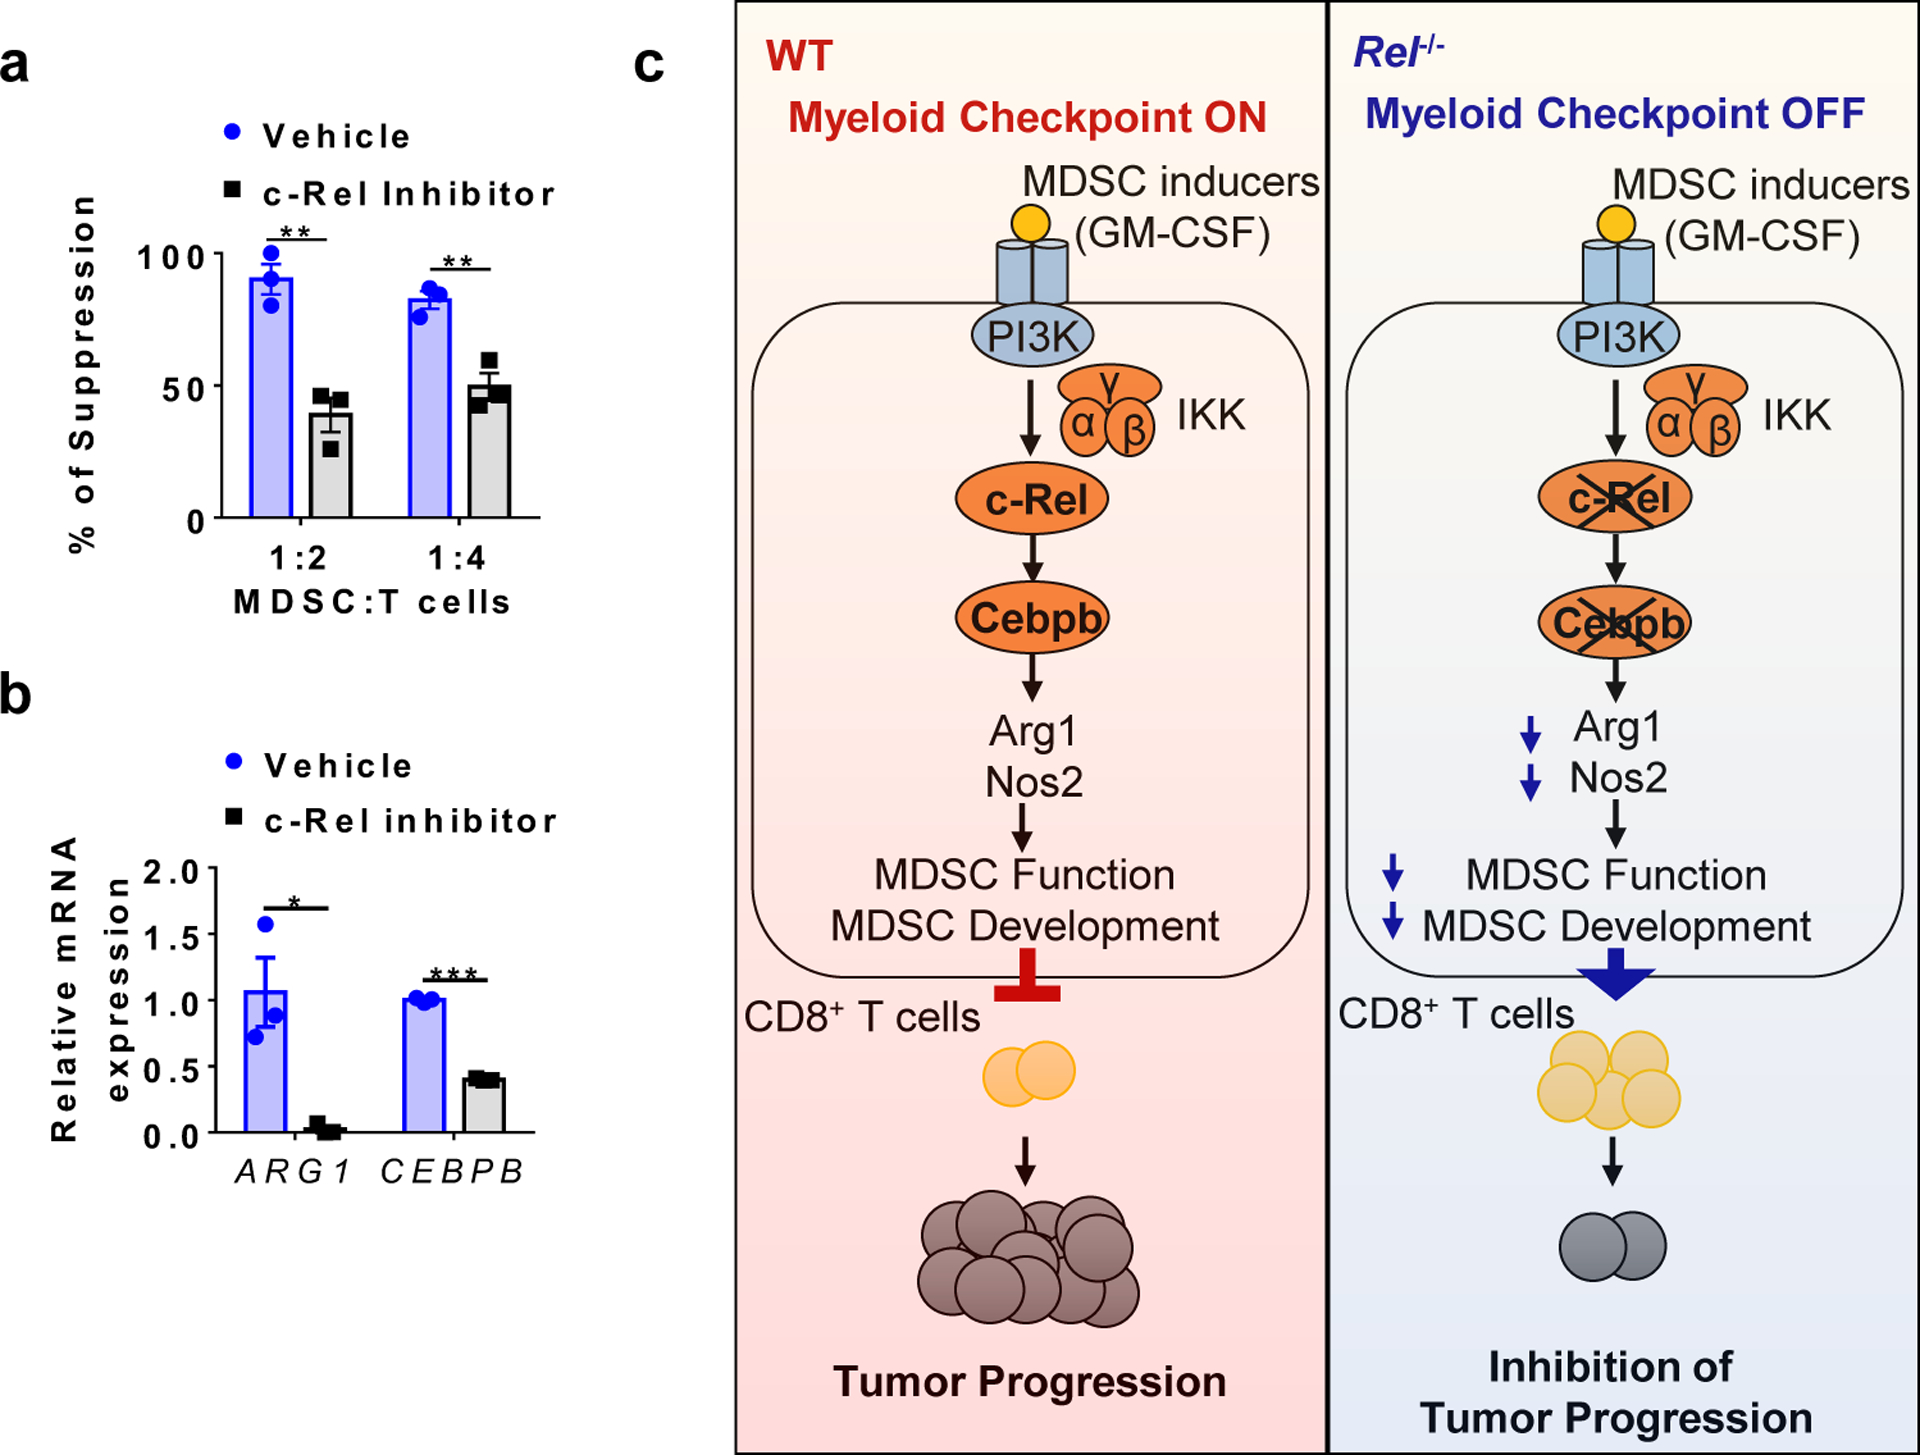
a, The degree of suppression of human CD8+ T cell proliferation by human MDSCs generated from human PBMCs with or without the c-Rel inhibitor. n=3 biologically independent cultures/group (**, P<0.01).
b, Relative mRNA levels of ARG1 and CEBPB in human MDSCs generated with or without the c-Rel inhibitor (5μM). n=3 biologically independent cultures/group (*, P=0.01694; ***, P<0.0001).
c, A working model for the c-Rel myeloid checkpoint of anti-tumor immunity. Please see text for details.
Statistical significance was determined by two-tailed unpaired t-test (a-b). Error bars indicate s.e.m.
Discussion
Results reported here prompted us to propose a model of anti-tumor immune regulation (Fig. 7c). During tumorigenesis, tumor-secreted molecules such as GM-CSF activates c-Rel through PI3K (phosphatidylinositol-4,5-bisphosphate 3-kinase)42 and IKK (inhibitor of IB kinase) in myeloid precursor cells; inflammatory cytokines such as IL-6 activate STAT3 and C/EBP. The activated transcription factors enter the nucleus and bind to the promoters or enhancers of MDSC signature genes (such as Cebpb or Arg1) to form specific enhanceosomes (transcriptional complexes) that initiate MDSC differentiation. The resultant MDSCs inhibit anti-tumor immunity such as CD8+ T cell responses, and promote tumor progression.
Myeloid-derived suppressor cells (MDSCs) are a well-recognized, but poorly defined, subpopulation of myeloid cells that promote tumorigenesis by inhibiting anti-tumor immunity4, 43, 44. They are present in low numbers in healthy individuals, but their numbers increase markedly in patients with cancer or chronic inflammation (comprising up to 10% of leukocytes in the blood and spleen)4, 5, 6, 7, 8, 40, 43, 44, 45, 46, 47. This increase is resulted from aberrant myelopoiesis driven by inflammatory mediators. MDSCs, but not mature monocytes or neutrophils, are potent suppressors of anti-cancer immunity4, 5, 6, 7. Phenotypically, MDSCs are similar to monocytes and neutrophils, but functionally and biochemically they are distinct from the latter cell types. Data reported here indicate that c-Rel is a primary transcription factor that specifies MDSC development, and prime drug target for treating cancer.
How does c-Rel specify MDSC development in a lineage-specific manner? A gene may be controlled by a compact enhancer complex called ‘enhanceosome’, in which each factor is essential for transcription48, 49, 50. Alternatively, a gene may be controlled by multiple ‘modular’ enhancer complexes, in which each factor contributes to the overall transcriptional output independent of other factors. Modular enhancer complexes may not be effective as ‘On-and-Off’ switches of gene expression or lineage differentiation48, 49, 50. Because c-Rel deficiency alone is sufficient to markedly block MDSC signature gene expression despite the presence of other transcription factors, we propose that c-Rel regulates MDSC gene expression through non-modular enhanceosomes, not by modular complexes. This enhanceosome theory explains how MDSC development can be specified by GM-CSF and IL-6, or transcription factors such as c-Rel, C/EBP, STAT3, and NFAT6, which are not MDSC-specific. Like other enhanceosomes, c-Rel-containing enhanceosomes operate as ‘coincidence detectors’, turning on c-Rel target genes only when all the enhanceosome factors are present (either sequentially or concurrently), and lacking any one of them leaves the gene locus dormant48. Thus, in order to initiate the MDSC differentiation program, multiple transcription factors must be transported to the same MDSC gene locus. Lacking any one of them is sufficient to halt the MDSC differentiation program. Thus, it is the collective identity of the enhanceosome, not individual factors, that is specific for MDSCs.
In summary, we discovered that c-Rel, a risk factor for tumorigenesis, plays an essential role in generating suppressive myeloid cells that promote cancer. Thus, blocking c-Rel represents an immunotherapeutic strategy to treat cancer.
Methods
Mice
Global Rel gene knockout (Rel−/−) C57BL/6 (B6) mice51 and B6 mice that carry the floxed Rel gene (RelF/F)34 were as previously described. LyzM-Cre (B6.129P2-Lyz2tm1(cre)Ifo/J) and C57BL/6J mice were originally purchased from the Jackson Laboratory (Bar Harbor, Maine, USA). Both males and females between the ages of 5 and 8 weeks were used in the study. All mice were housed in the University of Pennsylvania animal care facilities under pathogen-free conditions and all procedures were pre-approved by the institutional animal care and use committee.
Human samples
Blood samples from human healthy donors were collected by the Human Immunology Core at the University of Pennsylvania with the approval from the ethics committee and Institutional Review Board. The written consent was obtained from each healthy donor before blood collection. All experiments involving blood samples from healthy donors were performed in accordance with relevant ethical regulations.
Cells
B16F10, B16F0 and EL4 cells were obtained from ATCC and cultured in RPMI medium supplemented with 0.1 mM non-essential amino acids, 1 mM sodium pyruvate, 2 mM L-glutamine, 25 mM HEPES, 55 μM 2-mercaptoethanol, 10% FBS, and 1% PenStrep (100 U/mL penicillin and 100 μg/mL streptomycin). RAW cells were cultured in DMEM medium supplemented with 0.1 mM non-essential amino acids, 1 mM sodium pyruvate, 2 mM L-glutamine, 25 mM HEPES, 55 μM 2-mercaptoethanol, 10% FBS, and 1% PenStrep (100 U/mL penicillin and 100 μg/mL streptomycin). All cultures were maintained in a humidified 5 % CO2 incubator at 37 °C.
Tumor models and treatments
To generate subcutaneous tumors, 0.5 × 10⁶ EL4, B16F0, or B16F10 cells were injected subcutaneously (s.c.) into each mouse. Tumor size was measured every other day with a digital caliper. Tumor volume was calculated using the formula [(small diameter)2 × (large diameter) × 0.5]. For cell depletion experiments, 200 μg anti-Gr-1 (clone RB6–8C5, BioXcell), anti-CD25 (clone PC-61.5.3, BioXcell), or rat IgG2b isotype control was administered intraperitoneally to each mouse, once every three days, from Day 0 to the last day of the experiment. For c-Rel inhibitor experiments, mice received daily intraperitoneal injections of 10 mg/kg of c-Rel inhibitor R96A39 (in 50 ul DMSO) or DMSO vehicle control. For PD-1 antibody experiments, each mouse received intraperitoneal injections of 100 μg anti-mouse PD-1 (clone J43, BioXcell) or Armenian hamster IgG control (clone N/A, BioXcell), once every three days.
Flow cytometry
Single cell suspension of spleen was obtained by mechanical desegregation in FACS buffer (PBS + 2% FCS + 1mM EDTA). To obtain tumor-infiltrating cells, tumors were digested in RPMI (Gibco) supplemented with 0.5 mg/ml collagenase type IV (Gibco) and 0.1 mg/ml DNase I (Sigma) for 20 min at 37 °C. For intracellular staining, cells were first incubated for 6 hours with 10 ng/ml PMA (Sigma), 1 μg/ml ionoymycin (Sigma) in the presence of Golgi STOP (BD) and 10 μg/ml brefeldin A (Sigma). Cells were then permeabilized in 0.1% Triton X-100, stained with antibodies in FACS buffer and fixed in 1% paraformaldehyde (PFA). Stained cells were then analyzed on a LSR II flow cytometer (BD Biosciences). Data were analyzed with the FlowJo software.
Generation of MDSCs from murine bone marrow and human PBMCs
Bone marrow (BM)-derived MDSCs were generated from bone marrow of naive WT or Rel−/− mice. After red blood cell lysis, BM cells were cultured in complete RPMI medium containing GM-CSF (100 ng/mL) and IL-6 (100 ng/mL), at a density of 5×10⁶ cells per ml for 3–7 days. To generate human MDSCs, PBMCs from healthy donors were cultured in complete RPMI medium containing GM-CSF (100 ng/mL) and IL-6 (100 ng/mL), at a density of 5×10⁶ cells/ml for 7 days. The c-Rel inhibitor R96A was added to selected cultures once every other day to a final concentration of 5 μM to test its effect on the generation of MDSCs.
Murine and human T cell suppression assays
Murine CD8+ T cells labeled with 1 μM carboxyfluorescein succinimidyl ester (CFSE) were activated with plate-bound anti-mouse CD3 (250 ng/ml) and soluble anti-mouse CD28 (250 ng/ml), and co-cultured at different ratios with murine MDSCs for 72 hrs. Human PBMCs from healthy donors were labeled with 1 μM CFSE, activated with plate-bound anti-human CD3 (1 μg/ml) and soluble anti-human CD28 (5 μg/ml), and co-cultured at different ratios with human MDSCs generated in vitro for 72 hrs. CD8+ T cell proliferation was measured by the dilution of CFSE fluorescence compared with non-activated T cells and activated T cells without MDSCs, by flow cytometry (on gated CD8+ T cells). The % T cell suppression was calculated as follows: [(% T cell proliferation of cultures with anti-CD3 and anti-CD28 - % T cell proliferation of cultures with anti-CD3, anti-CD28, and MDSCs) / % T cell proliferation of cultures with anti-CD3 and anti-CD28] × 100.
Seahorse XF96 Analyzer
Seahorse XF96 analyzer was used to assess four mitochondrial parameters (including basal respiration, maximal respiration, proton leak, and ATP production) and two glycolysis parameters (including basal glycolysis and maximal glycolysis). Briefly, MDSCs were seeded at 100K per well in 96-well plates and cultured overnight. Culturing media was changed to modified DMEM media (1mM sodium pyruvate, 10mM glucose, 2mM glutamine) and placed into a 37 °C non-CO2 incubator for 1 hour. XF Cell Mito Stress Test Assay (1μM Oligomycin, 1μM FCCP, 0.5μM Antimycin and Rotenone) was then performed to determine the four different mitochondria parameters. 1μM Oligomycin was used to determine the two glycolysis parameters.
Western blot
The cells were lysed in RIPA buffer in the presence of protease inhibitor cocktail (Roche). Cell lysates were then subjected to 10% SDS-PAGE and transferred to PVDF membranes (Bio-Red). The membranes were probed overnight at 4°C with antibodies specific for c-Rel, C/EBPb, Arg1, p65, p50, RelB and β-actin (SantaCruz Biotech Inc), followed by incubation for 1 hour at room temperature with secondary antibodies conjugated with peroxidase. Membrane-bound immune complexes were detected using Super ECL detection reagent on an Amersham Imager 600.
RT-PCR, RNA-sequencing, and gene microarray
Total RNA was extracted using RNeasy Mini Kit (Qiagen) according to the manufacturer’s instructions. Reverse transcription was performed using oligo dT primers. Real-time PCR was carried out in the Applied Biosystems 7500 using Power SYBR Green PCR Master Mix (Applied Biosystems). Relative levels of gene expression were determined using -actin mRNA as the control. RNA-Seq was performed by BGI (Shenzhen, China). Briefly, libraries of bone marrow-derived MDSCs were prepared using an Illumina TruSeq Library Kit and sequenced using an BGISEQ-500 instrument. Raw FASTQ files were aligned on the murine GRCm38 (mm10) genome. Data analysis was carried out using the statistical computing environment R, the Bioconductor suite of packages for R, and RStudio. Raw data were background-subtracted, variance-stabilized, and normalized by robust spline normalization. Differentially expressed genes were identified by linear modeling and Bayesian statistics using the Limma package. Probe sets that were differentially regulated (≥2-fold, p value <0.05) after controlling for multiple testing using the Benjamini-Hochberg method were used for volcano plot generation in R. Pathway analysis was performed using IPA (Qiagen Bioinformatics) and GSEA (http://software.broadinstitute.org/gsea/index.jsp). IPA is a web-based software application that goes beyond pathway analysis by identifying key upstream regulators to explain expression patterns and predict downstream effects on biological and disease processes. GSEA is a computational method that determines whether a priori defined set of genes shows statistically significant and concordant differences between two biological states. GSEA does not focus on only significantly/highly changed genes but examines all the genes that belong to a certain biological process. For the gene microarray assay, BMDMs from WT and Rel−/− mice were challenged with vehicle or LPS (100 ng/mL) for 1 hour, and microarray analysis was performed using the Affymetrix murine gene array. The results were analyzed using the Transcriptome Analysis Console (TAC) software from Affymetrix. Genes that were changed by more than 1.5-fold were analyzed for pathway enrichment using IPA (Qiagen Bioinformatics).
Promoter transactivation Assay
Murine Cebpb promoter elements (nucleotides −1500 to −1, −800 to −1, and −500 to −1) were cloned from mouse genome of EL4 cells, and inserted to the luciferase reporter pGL4.12[luc2CP] Vector. Murine Arg1 promoter luciferase reporter plasmid (pGL3-mArg1 promoter/enhancer Plasmid #34571) was purchased from Addgene. RAW cells were transfected with 2 μg reporter constructs together with 2 μg c-Rel expression MigR1 vector or empty vector by electroporation. After 48 hours, the luciferase activities of whole cell lysates were analyzed using a Luciferase Assay System (Promega). Data were normalized based on protein concentrations of each sample.
Chromatin Immunoprecipitation (ChIP)
Bone marrow cells were cultured in complete RPMI medium containing GM-CSF (100 ng/mL) and IL-6 (100 ng/mL) for 48 hours. After resting for 4 hours in RPMI medium, cells were treated with GM-CSF (100 ng/mL) and IL-6 (100 ng/mL) for 0–18 hours. ChIP was then performed using the ChIP-IT Express Enzymatic kit, according to the manufacturer’s instruction (Active Motif). Briefly, 10×106 cells were fixed in 1% formaldehyde at room temperature for 10 min and lysed in the lysis buffer. Chromatin solutions were prepared with enzymatic shearing, and immunoprecipitated overnight at 4°C using 2 μg of antibodies to c-Rel, C/EBPβ, p65, or pSTAT3, or control IgG. Input and immunoprecipitated chromatins were incubated for 15 min at 95°C to reverse cross-link. After 1h proteinase K digestion at 37°C, Proteinase K Stop Solution was added to abolish proteinase K activity. ChIP DNA was then analyzed by PCR using the following primer sets:
Cebpb-promoter-forward: 5′-CAATGACGCGCACCGAC -3′;
Cebpb -promoter-reverse: 5′-AGCGGGAGGTTTATAAGGCG -3′.
Arg1-promoter -forward: 5′-GTCATCCAGCTGGCTTTTTC -3′;
Arg1-promoter-reverse: 5′-ACCTCCCCATCAGAGGAACT -3′;
Il12b-promoter-forward: 5′-TTCCCCCAGAATGTTTTGACAC-3’;
Il12b-promoter-reverse: 5′-TGGCTGCTCCTGGTGCTTAT-3’.
For Re-ChIP, c-Rel:DNA complexes from the first immunoprecipitation (with anti-c-Rel) were subjected to an additional round of immunoprecipitation with other antibodies.
Measurement of reactive oxygen species (ROS)
2×10⁵ MDSCs were incubated with 0.5 μM DC-FDA dye in HBSS. For stimulation, cells were incubated with PMA(1ug/ml) for 20 min, The fluorescence intensity was measured using a plate reader (at 490/520), and the signal was normalized to the total number of cells.
Generation of REL KO cells using the CRISPR/Cas9 system
REL KO human Jurkat T cells were generated using the CRISPR/Cas9 system. pCW-Cas9 and pLX-sgRNA were a gift from Eric Lander & David Sabatini (Addgene plasmid # 50661 & 50662). The first vector (pCW-CAS9) carries the Cas9 endonuclease under the control of Tet-On tetracycline inducible expression system, as well as a constitutively expressed puromycin resistance gene. The second vector (pLX-SgRNA) carries a sgRNA driven by the U6 RNA polymerase III promoter, as well as a blasticidin resistance gene. Candidate sgRNA target sequences were generated based on complementarity to the N-terminus region of the c-Rel coding sequence. These target sequences were then fused to the sgRNA scaffold sequence and cloned into the pLX-sgRNA vector using the XhoI and NheI restriction sites. The resulting vectors were used to produce lentiviruses in 293T cells by co-transfection with the 3rd generation packaging system. Jurkat cells were first transduced by lentiviruses produced from the doxycycline-inducible Cas9 vector (pCW-Cas9) and selected under 1.5μg/mL puromycin for 3 days. The resulting cells were expanded and transduced by the c-Rel-targeting pLX-sgRNA lentiviruses and subsequently selected under 6μg/mL blasticidin in the presence of 750ng/mL doxycycline for one week. The cells were then expanded without doxycycline until sufficient numbers were obtained. To obtain pure KO clones, Jurkat cells were serially diluted to 0.5 cells / 200μL / well in 96-well plates. For PCR experiments, 1×10⁶/mL Jurkat cells were stimulated in culture medium containing 10% fetal bovine serum, 10ng/mL PMA plus 1μM ionomycin for 4 hours.
Cell viability assay
CellTiter-Glo luminescent kit (Promega) was used to determine the cell viability of bone marrow-derived MDSCs and cell lines. Cells were cultured in 96-well plate, and the CTG reagent was added to cell medium. The plate was incubated for 10 min at room temperature on the shaker, followed by luminescence measurement.
Co-immunoprecipitation
Cells were collected, washed with PBS, and then harvested with ice-cold RIPA lysis buffer in the presence of protease inhibitor cocktail and PhosStop phosphatase inhibitor cocktail (Roche). After incubation with protein G beads for 2 hours at 4°C, 2μg anti-c-Rel or anti-IgG (SantaCruz Biotech Inc) was added, and samples were incubated overnight at 4°C. Proteins bound to the beads were eluted with 2×SDS loading buffer at 95 °C for 10 min, and detected by Western blot.
Retrovirus production and infection
PLAT-E packaging cells were plated at 107 cells per 150 mm dish and incubated overnight. Cells were transfected with MSCV-IRES-GFP and MSCV-IRES-GFP-CEPBb with Lipofactamine 2000 reagent (Invitrogen). 24 hours after the transfection, the medium was changed. After an additional 3 days of culture, the medium was collected and filtered through a 0.45 mm filter. Using the Retro X concentrator (Takara), the virus was concentrated for ~100-fold. For transfection, the virus was mixed with TransDux MAX (System Biosciences) reagent and added to the cultured MDSCs. 24 hours after the infection, the medium was changed. After an additional 3 days of culture, cells were harvested for further studies.
DNA pull-down assay
Total splenocytes from WT and Rel−/− mice were treated with or without 5μM c-Rel inhibitor in the presence of 5 μg/ml plate-bound anti-CD3 and 5 μg/ml soluble anti-CD28 for 6 hours. After nuclear extracts were prepared, biotinylated oligonucleotides (5’-AGTTGAGGGGACTTTCCCAGGC-3’) containing an NF-B consensus binding site were absorbed by streptavidin-agarose beads, and then added to the nuclear extracts. The amount of c-Rel, p65/RelA, RelB and p50 proteins in the precipitates were assessed by Western blot.
Statistics & Reproducibility
Sample size calculations for the tumor studies were based on the effects observed in pilot experiments. Power calculations were performed via bootstrap sampling to ensure that the null hypothesis would be correctly rejected with >80% power at the 0.05 significance level. No data were excluded from the analyses. For in vivo cancer studies, mice were randomly assigned into experimental groups. The Investigators were not blinded to allocation during experiments and outcome assessment. Statistical analyses were performed using GraphPad Prism 7 software (GraphPad Software). For comparisons between two groups, two-tailed Student t test was used for evaluation of statistical significance or, when the data were not normally distributed, a nonparametric Mann-Whitney U test was used. For comparisons across multiple groups, one-way ANOVA with Turkey post-test adjustment was used or, when the data were not normally distributed, the data were analyzed using one-way ANOVA with the Kruskal-Wallis test, followed by pairwise comparison using the Dunn test.
Reporting summary
Further information on research design is available in the Nature Research Reporting Summary linked to this article.
Data Availability
Microarray and RNA sequencing data that support the findings of this study have been deposited in the ArrayExpress under accession codes E-MTAB-8674 and E-MTAB-8714. Source data for all figures are provided with the paper online. All other data supporting the findings of this study are available from the corresponding author on reasonable request.
Code Availability
None
Extended Data
Extended Data Fig. 1 |. Global and myeloid Rel gene deletion blocks tumor growth and reduces MDSCs in mice.
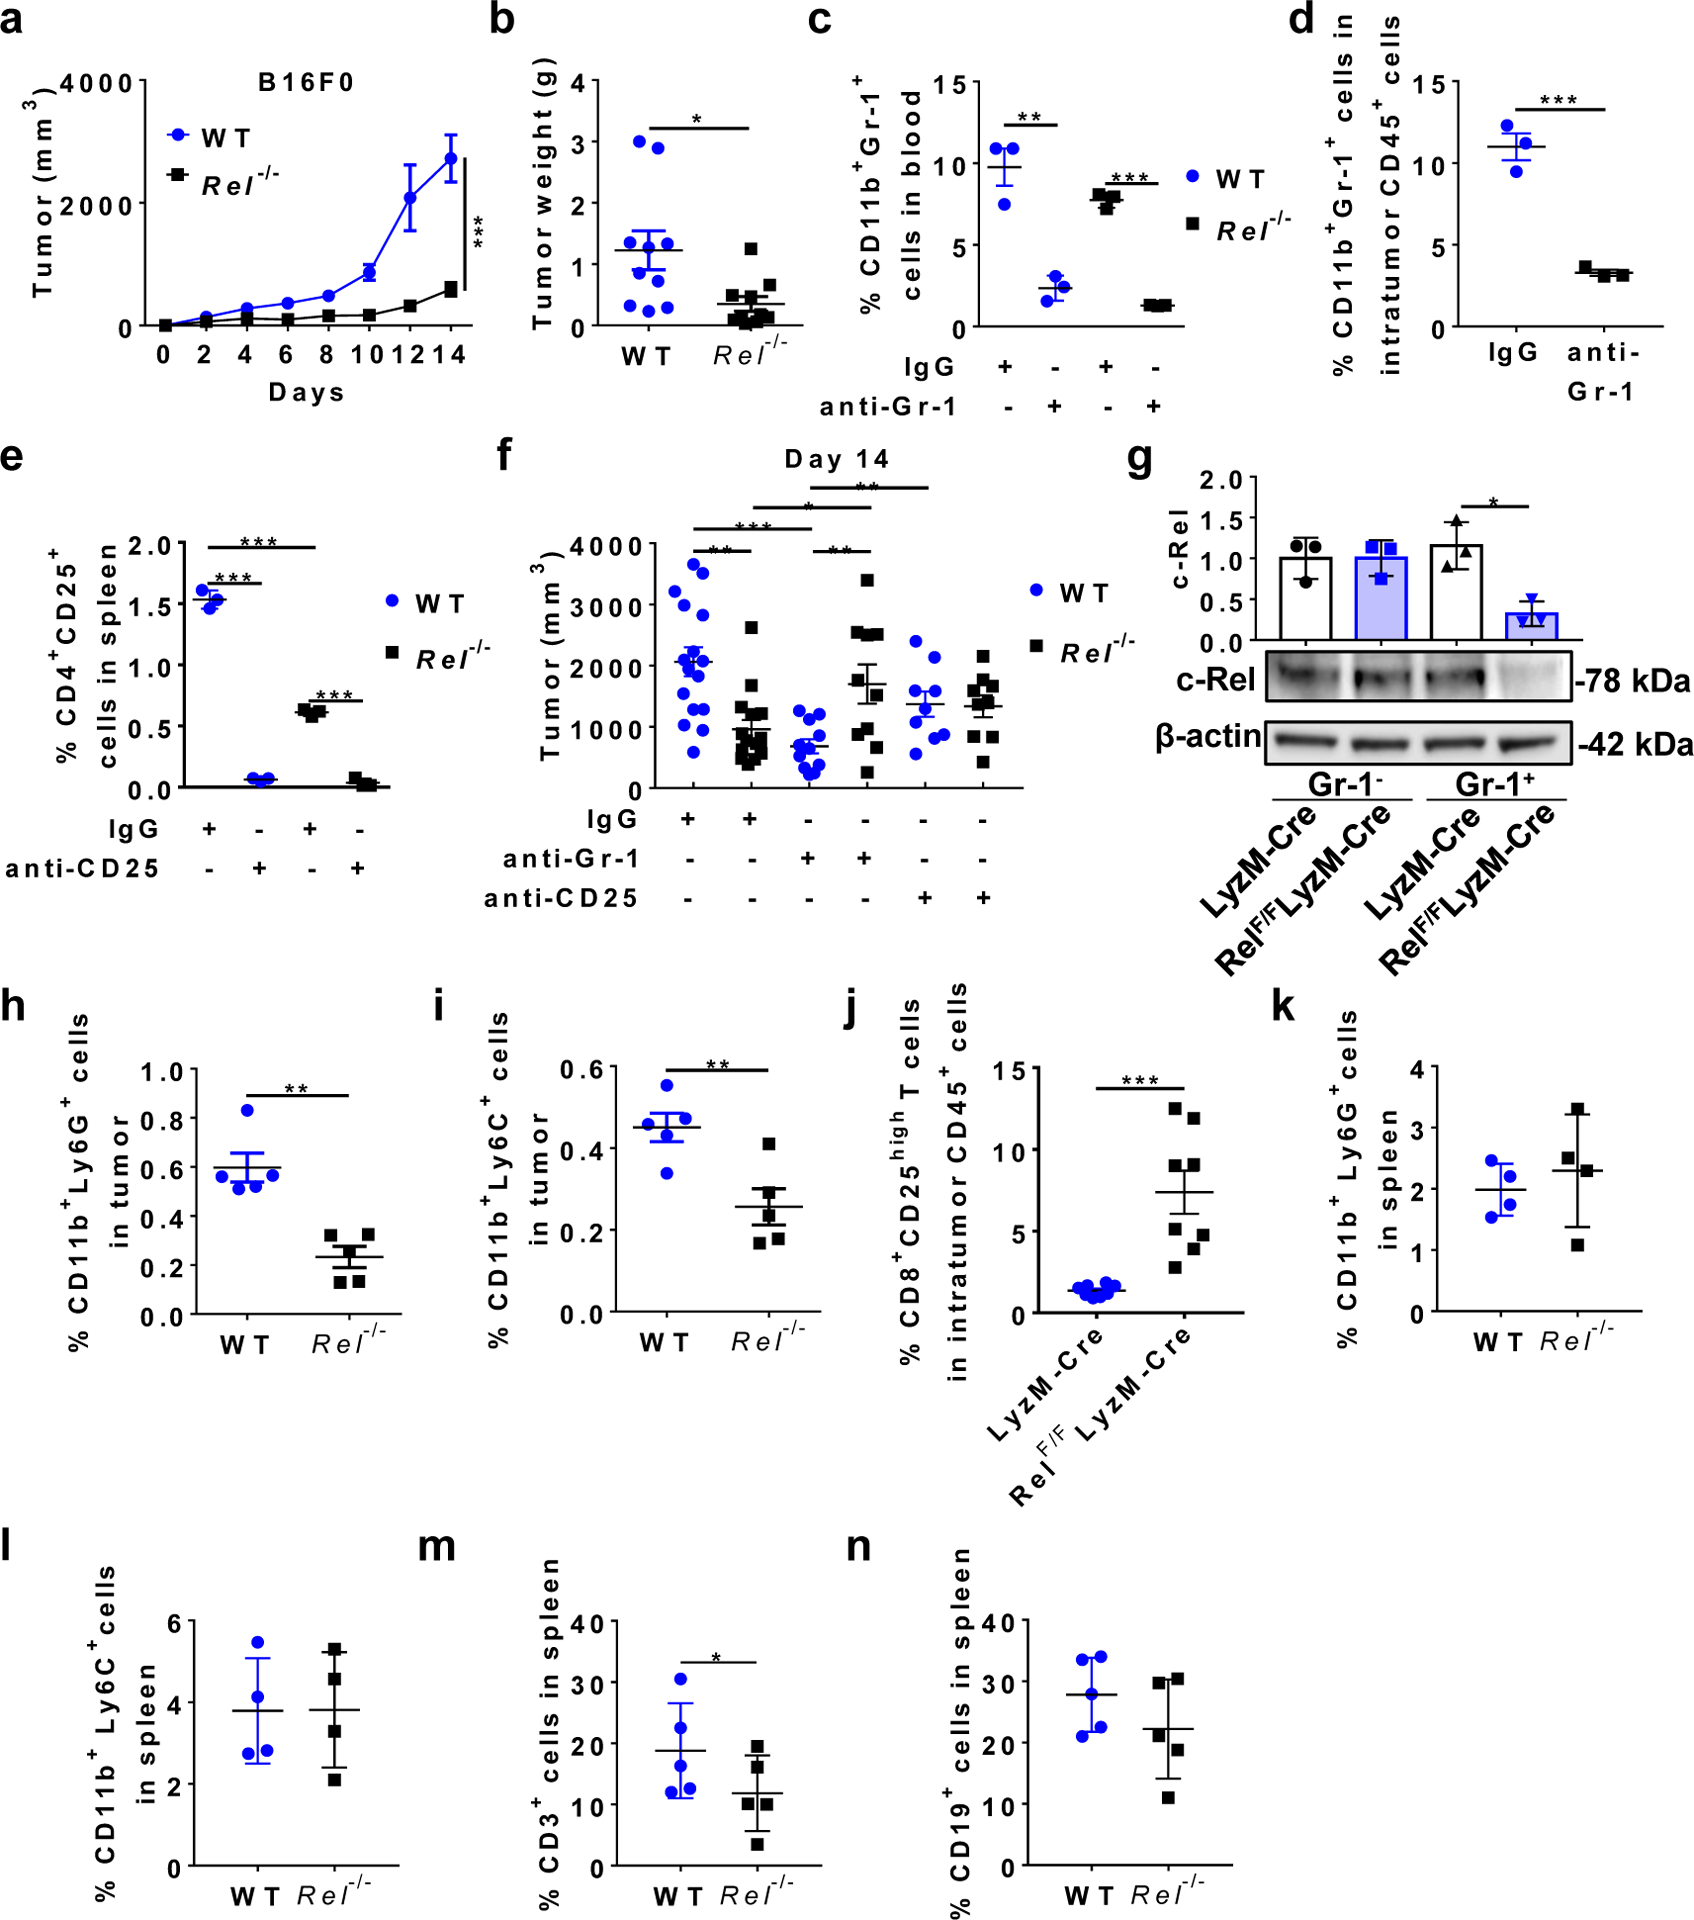
a, Tumor growth in WT and Rel−/− mice (n=5 mice/group) injected s.c. with B16F0 tumor cells (***, P<0.0001). b, Tumor weight of WT and Rel−/− mice (n=10 mice/group) treated in Fig. 1a (*, P=0.0188). c, Percentages of CD11b+Gr-1+ cells in the blood of WT and Rel−/− mice treated with anti-Gr-1 or IgG isotype control (n=3 mice/group), 7 days post B16F10 tumor cell inoculation (**, P=0.0037; ***, P<0.0001). d, Percentages of CD11b+Gr-1+ cells in the tumor of WTmice treated with anti-Gr-1 or IgG isotype control (n=3 mice/group), 7 days post B16F10 tumor cell inoculation (***, P=0.0008). e, Percentages of CD4+CD25+ cells in the spleen of WT and Rel−/− mice treated with anti-CD25 or IgG isotype control (n=3 mice/group), 14 days post B16F10 tumor cell inoculation (***, P<0.0001). f, Tumor size on Day 14 of WT and Rel−/− mice treated as in Fig. 1c–e. n=16 for the WT+IgG group, n=15 for the Rel−/−+IgG group, n=11 for the WT+anti-Gr1 group, n=10 for the Rel−/−+anti-Gr1 group, n=9 for the WT+anti-CD25 group, and n=9 for the Rel−/−+anti-CD25 group (*, P=0.0303; **, P<0.01; ***, P=0.0001). g, c-Rel expression in Gr-1+ and Gr-1- splenocytes of LyzM-Cre (Cre) and LyzM-Cre RelF/F (RelF/F) tumor-bearing mice as determined by Western blot. Representative blots from biologically independent experiments were shown and the bar graph shows the relative quantities of the c-Rel protein in the corresponding group shown below (n=3 mice for each group; *, P=0.0101). h, i, Percentages of CD11b+Ly6G+ (h) and CD11b+Ly6C+ (i) leukocytes in the tumor of WT and Rel−/− mice treated in Fig. 1a (n=5 mice/group). **, P=0.0011 for panel h; **, P=0.0087 for panel i. j, Percentages of CD8+CD25+ leukocytes in the tumor of LyzM-Cre and LyzM-Cre RelF/F mice treated in Fig. 1f (n=8 mice/group; ***, P=0.0005). k-n, Percentages of the indicated leukocyte subsets in the spleen of WT and Rel−/− mice treated in Fig. 1a. (n=4 mice/group in the panels k and l; n=5 mice/group in the panels m and n; *, P=0.037) Statistical significance was determined by two-tailed Mann-Whitney U-test (a), two-tailed unpaired t-test (b-f, h-j, m), or one-way ANOVA with Turkey post-hoc test (g). For all panels, data are presented as means ± s.e.m.
Extended Data Fig. 2 |. Percentages of immune cell subsets in cancer-bearing and naïve LyzM-Creand LyzM-CreRelF/F mice.
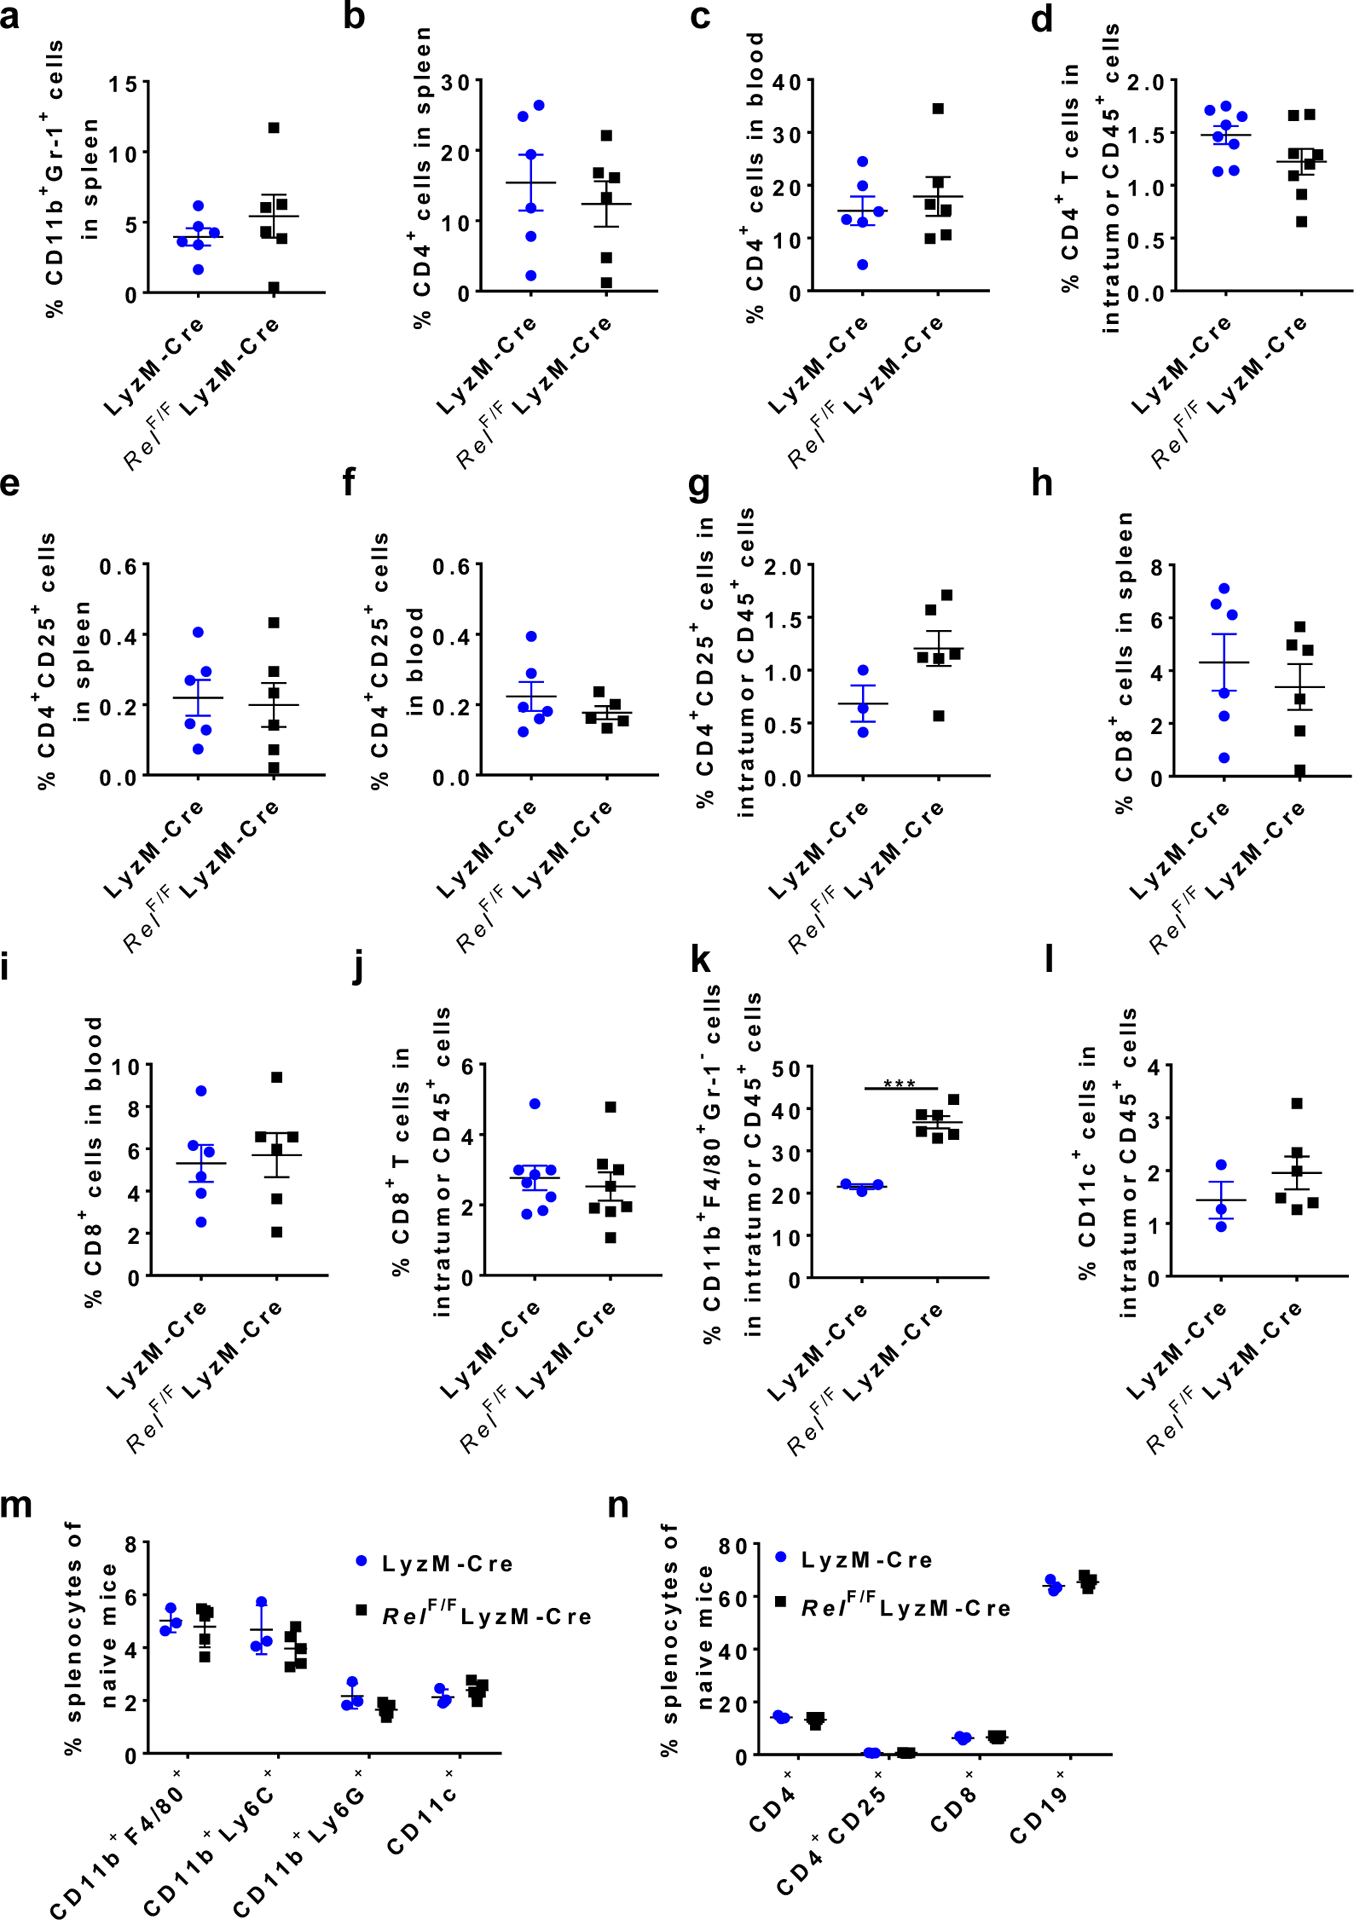
a,Percentages of CD11b+Gr-1+cells in the spleen of mice treated in Fig. 1f. n=6 mice/group. b-d,Percentages of CD4+cells in the spleen (b, n=6/group), blood (c, n=6/group), and tumor (d, n=8/group) of mice treated in Fig. 1f. e-g,Percentages of CD4+CD25+cells in the spleen (e, n=6/group), blood (f, n=6 for the LyzM-Cregroup and n=5 for the LyzM-CreRelF/F group), and tumor (g, n=3 for the LyzM-Cregroup and n=6 for the LyzM-CreRelF/F group) of mice treated in Fig. 1f. h-j,Percentages of CD8+cells in the spleen (h, n=6/group), blood (i, n=6/group), and tumor (j, n=8/group) of mice treated in Fig. 1f. k-n,Percentages of the indicated leukocyte subsets in the tumor (n=3 for the LyzM-Cregroup and n=6 for the LyzM-CreRelF/F group) of mice treated in Fig. 1f (k, l), and the spleen (n=3 for the LyzM-Cregroup and n=5 for the LyzM-CreRelF/F group) ofnaïvemice (m, n). (***, P=0.0002) Statistical significance was determined by two-tailed unpaired t-test (k). For all panels, data are presented as means ±s.e.m.
Extended Data Fig. 3 |. Reduced suppressive function, reactive oxygen species (ROS) production, and cell growth in Rel−/− MDSCs.
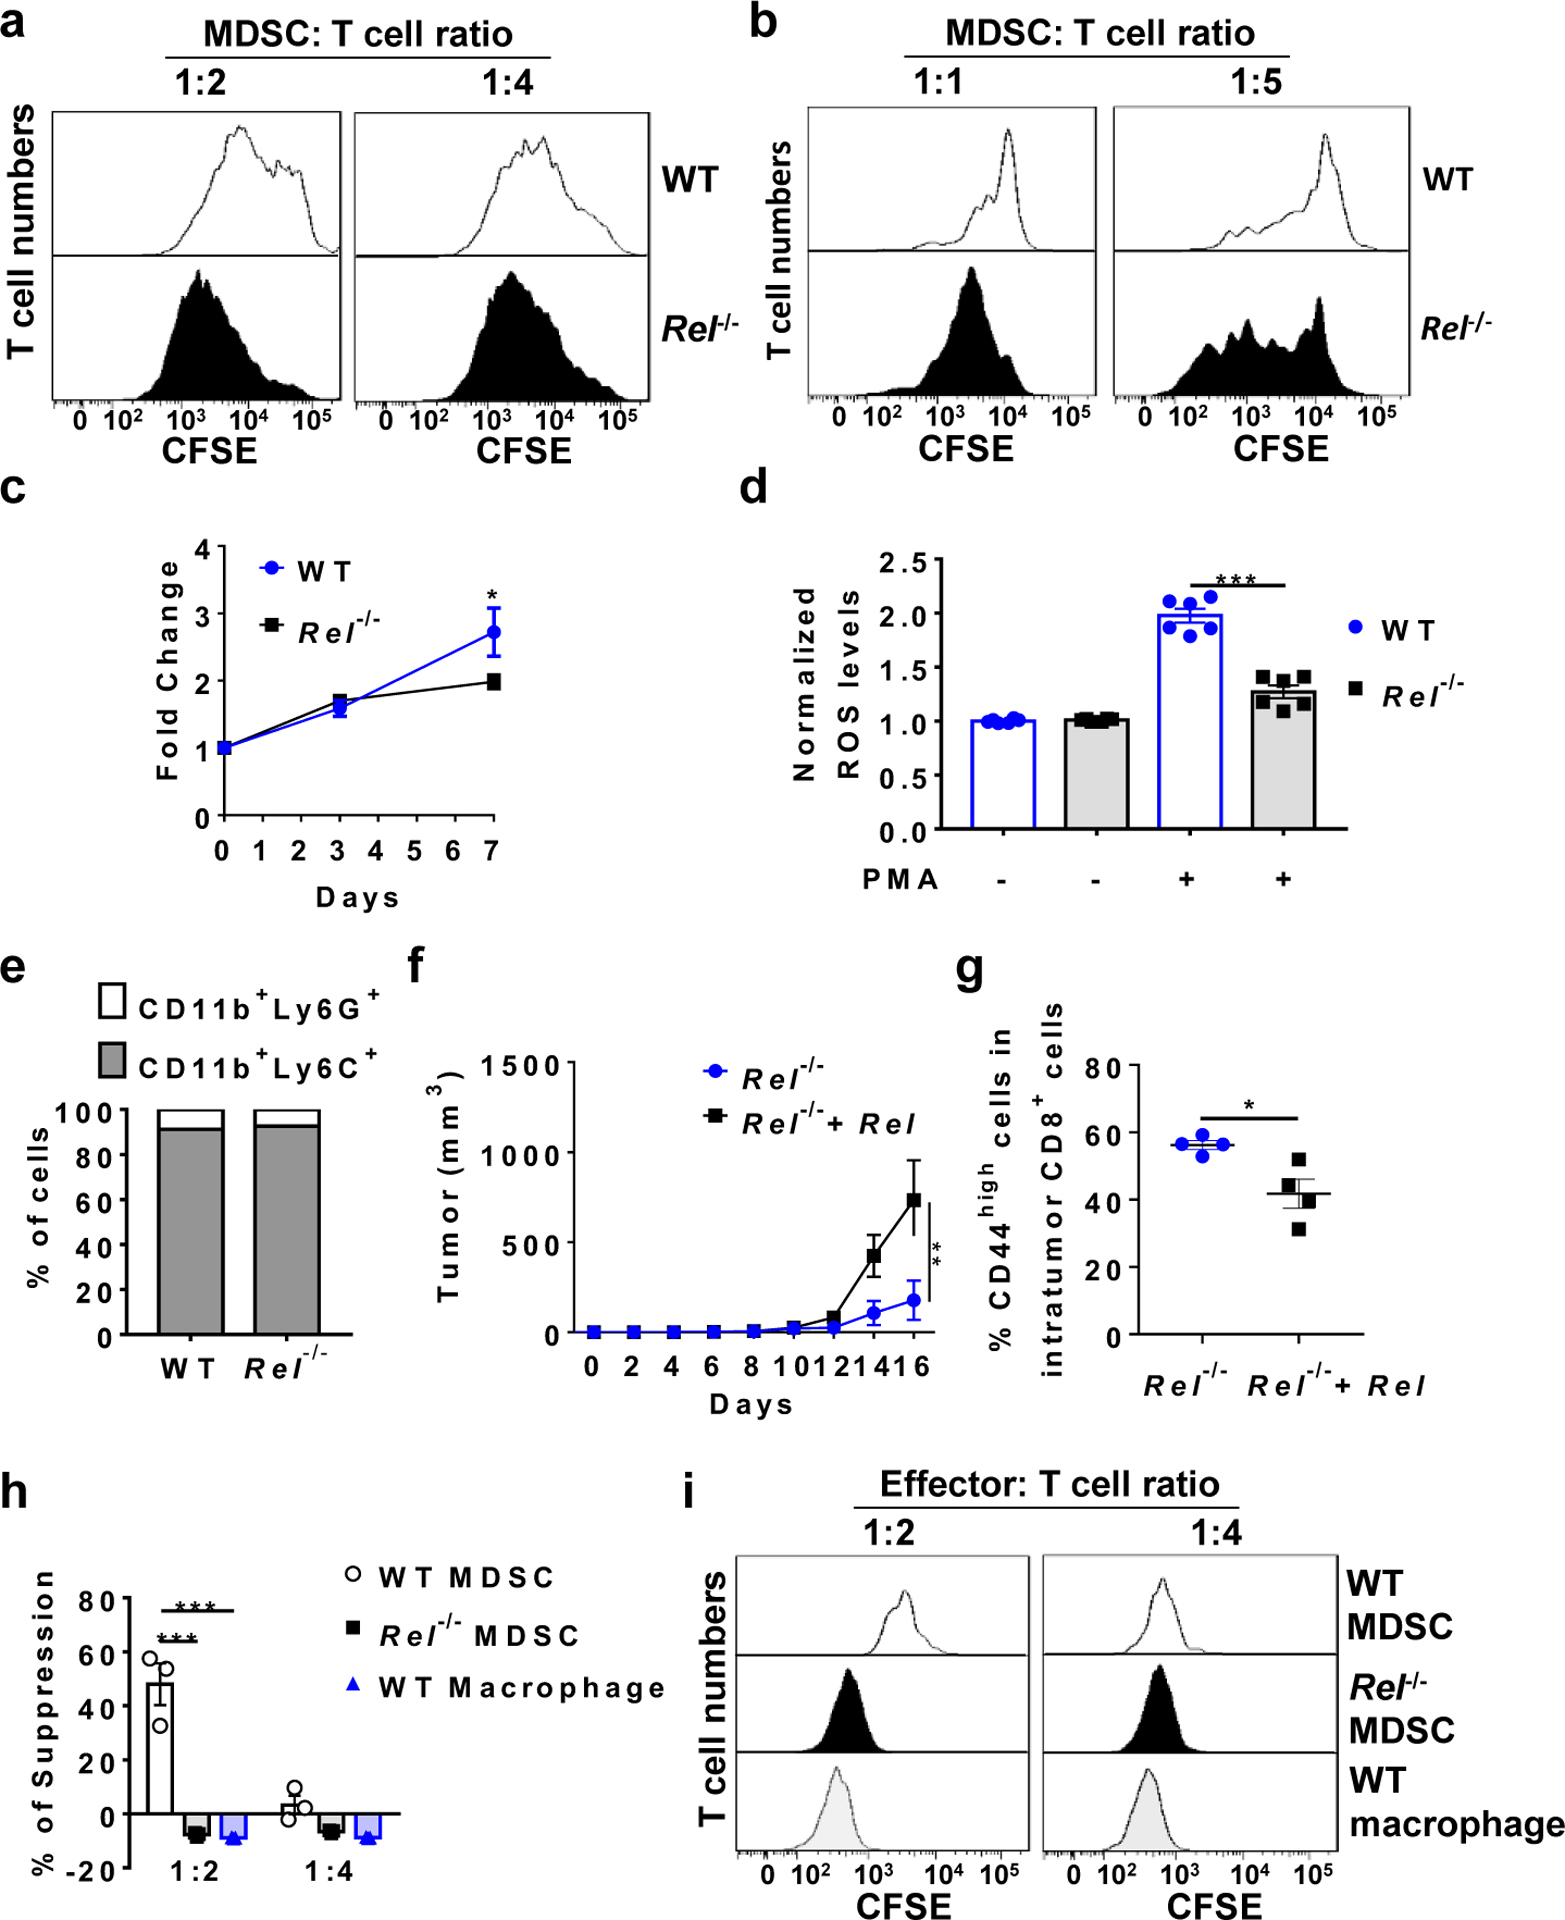
a, b, Representative flow cytometry plots from the MDSC-T cell suppression assay for Fig. 2a (a) and Fig. 2b (b). c, Growth of bone marrowderived MDSCs from WT (n=4 mice/group) and Rel−/− (n=9 mice/group) mice (*, P=0.03299). d, ROS production by bone marrow-derived MDSCs from WT and Rel−/− mice (n=6 mice/group; ***, P<0.0001). e, Percentages of CD11b+Ly6G+ and CD11b+Ly6C+ cells in bone marrow-derived MDSCs from WT and Rel−/− mice. Data representative of three independent experiments. f, Tumor growth in WT mice injected s.c. with B16F10 tumor cells plus Rel−/− MDSCs infected with control (n=5 mice) or Rel-expressing retroviruses (n=6 mice) (**, P=0.0041). g, Percentages of CD44high cells in intratumor CD8+ cells of WT mice treated as in panel f. (n=4 mice/group; *, P=0.0187). h, The degree of suppression, at the indicated Effector:T cell ratio, of CD8+ T cell Extended Data proliferation by bone marrow-derived MDSCs and BMDMs from naïve mice (n=3 mice/group). The concentrations of anti-CD3 and anti-CD28 used (125 ng/mL each) were half of those in Fig. 2b (***, P<0.0001). i, Representative flow cytometry plots for the MDSC-T cell suppression assay for Panel h. Statistical significance was determined by two-tailed unpaired t-test (c-e, g), two-tailed Mann-Whitney U-test (f), or two-way ANOVA with Turkey post-hoc test (h). Data are presented as means ± s.e.m. (c, d, f, h).
Extended Data Fig. 4 |. Rel gene deletion in MDSC leads to upregulated expression of inflammatory genes and decreased Cebpb downstream genes.
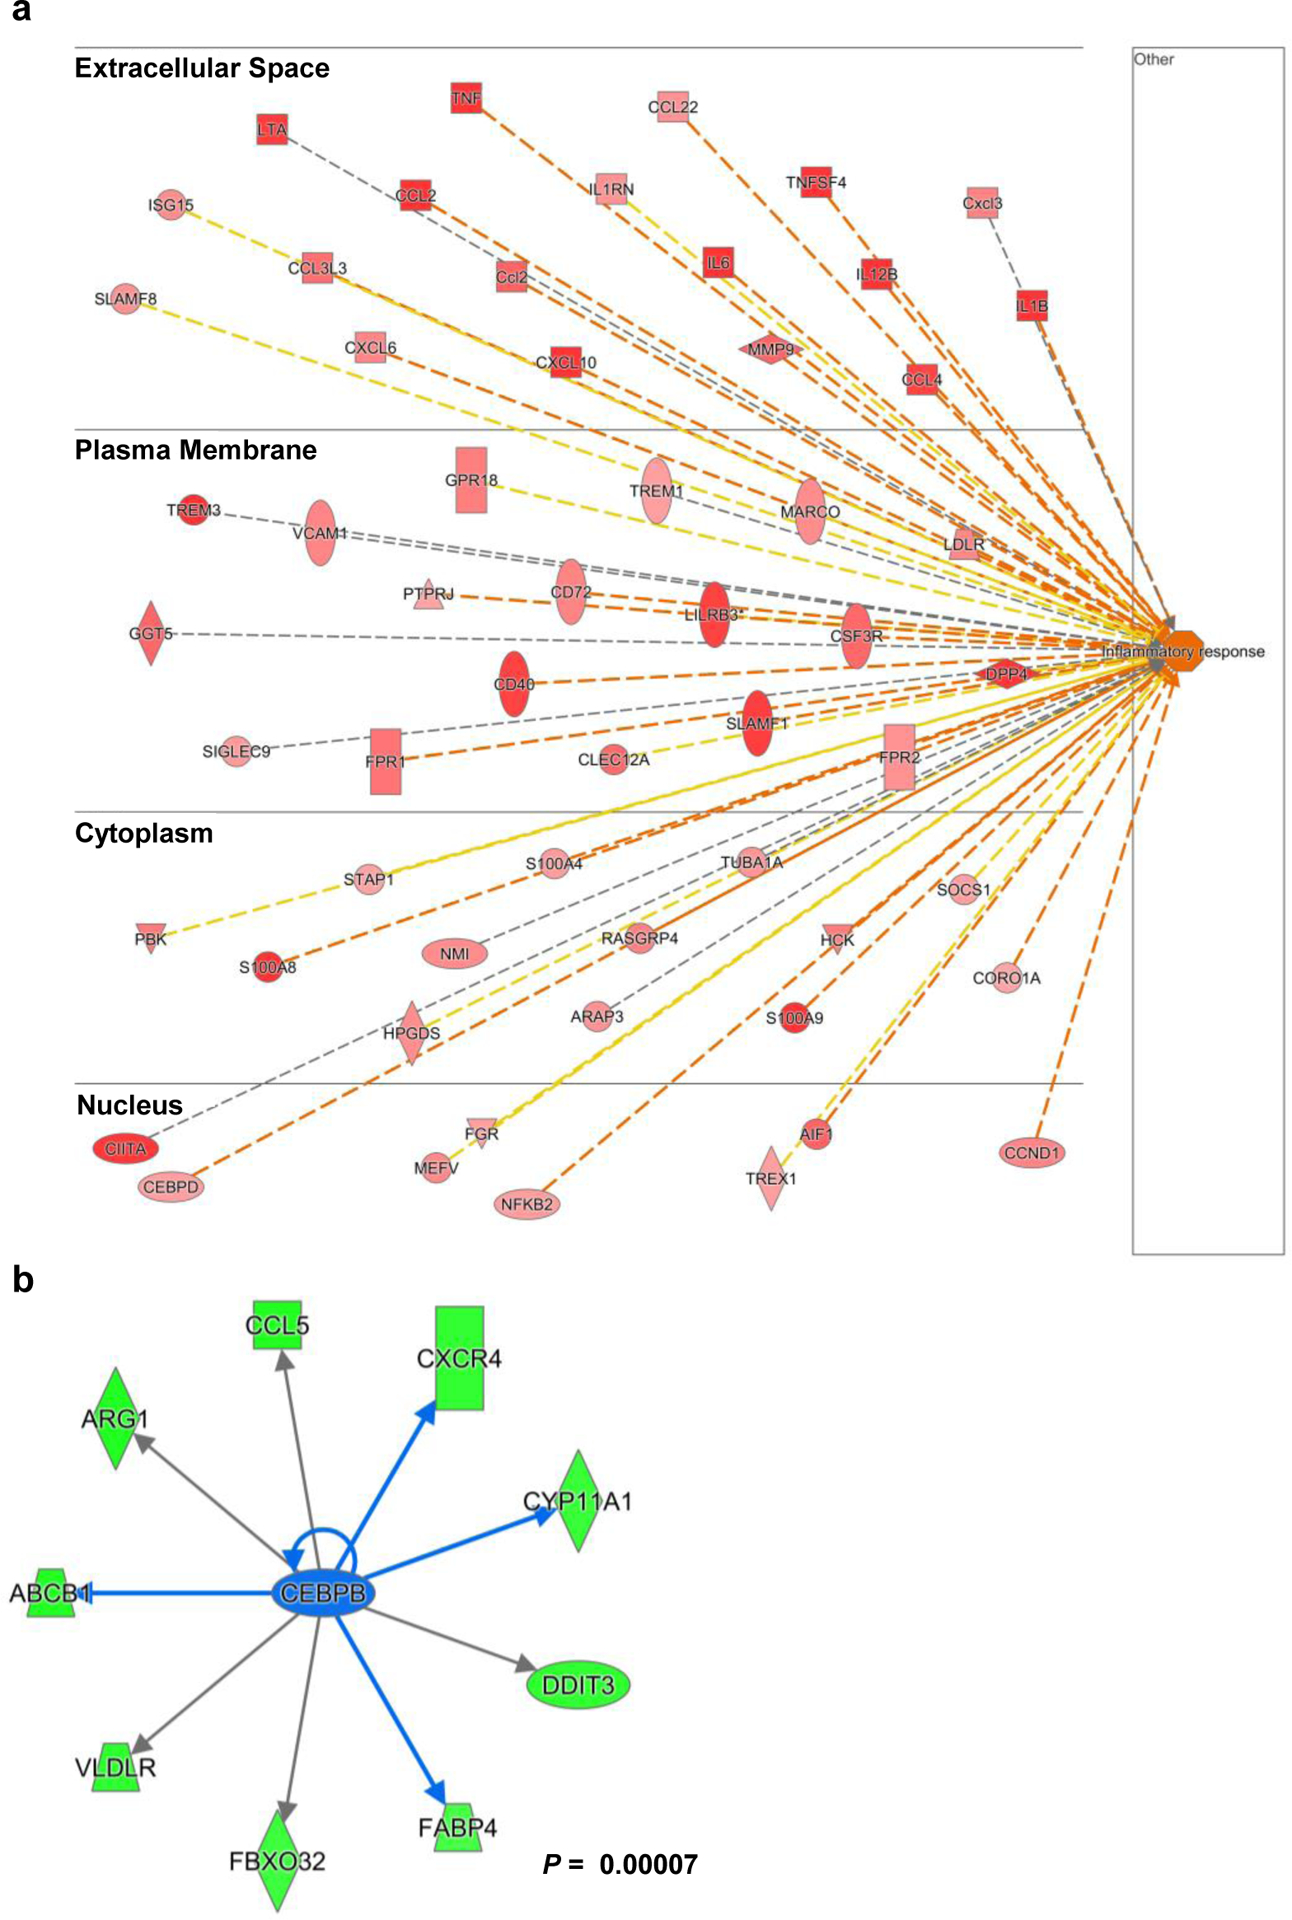
a, b, Results from ingenuity Pathway analysis of the RNA-seq data of bone marrorw-derived WT and Rel−/− MDSCs, showing upregulatated “infla,, atory response” genes(a, red) and downregulated Cebpb downstream genes (b, green) in Rel−/− MDSCs. Statistical significance was determined by calculated a right-tailed Fisher’s Exact Test. All data are pooled from 3 independent experiments.
Extended Data Fig. 5 |. Rel gene deletion in macrophage results in decreased expression of inflammatory genes.
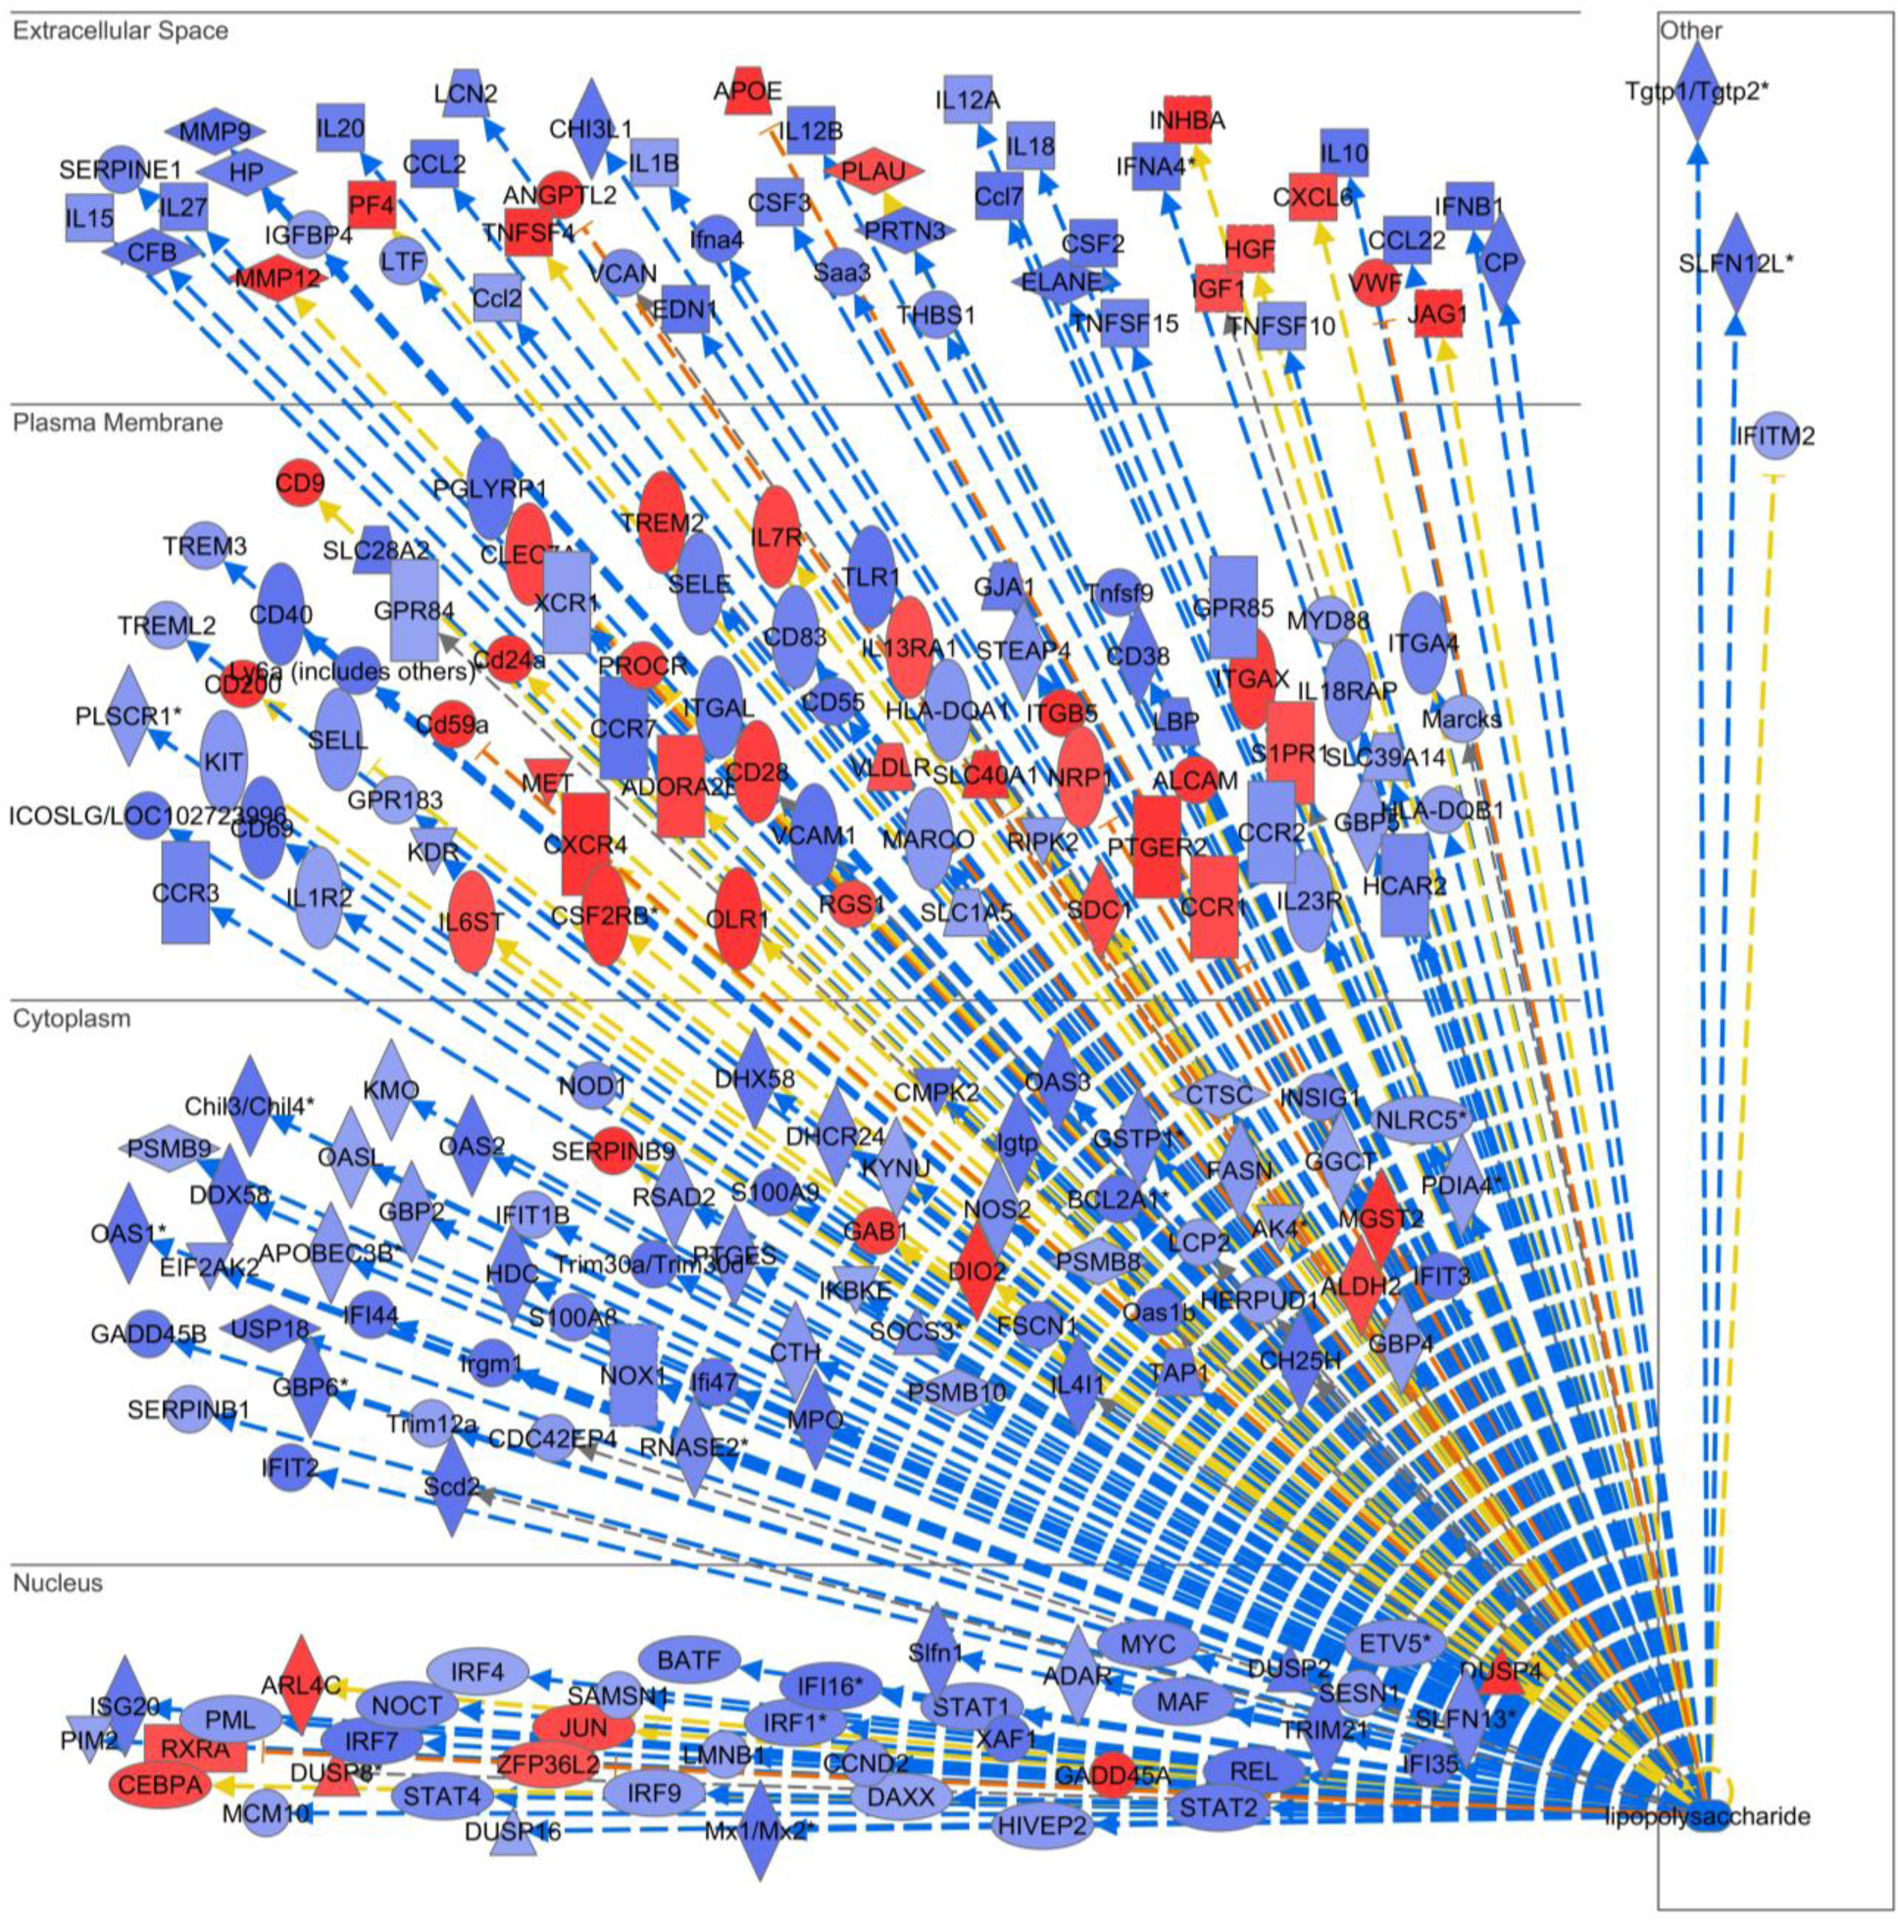
BMDMs from WT and Rel−/− mice were treated with vehicle or LPS (100 ng/mL) for 1 hour and gene microarray analysis was performed for ~30,000 murine genes. Ingenuity Pathway Analysis was performed to identify c-Rel-regulated genes that were downstream of LPS response. Blue genes were decreased, and red genes were increased in Rel−/− cells as compared to WT cells, after LPS treatment.
Extended Data Fig. 6 |. The inhibitor is c-Rel specific and blocks MDSC suppressive functions.
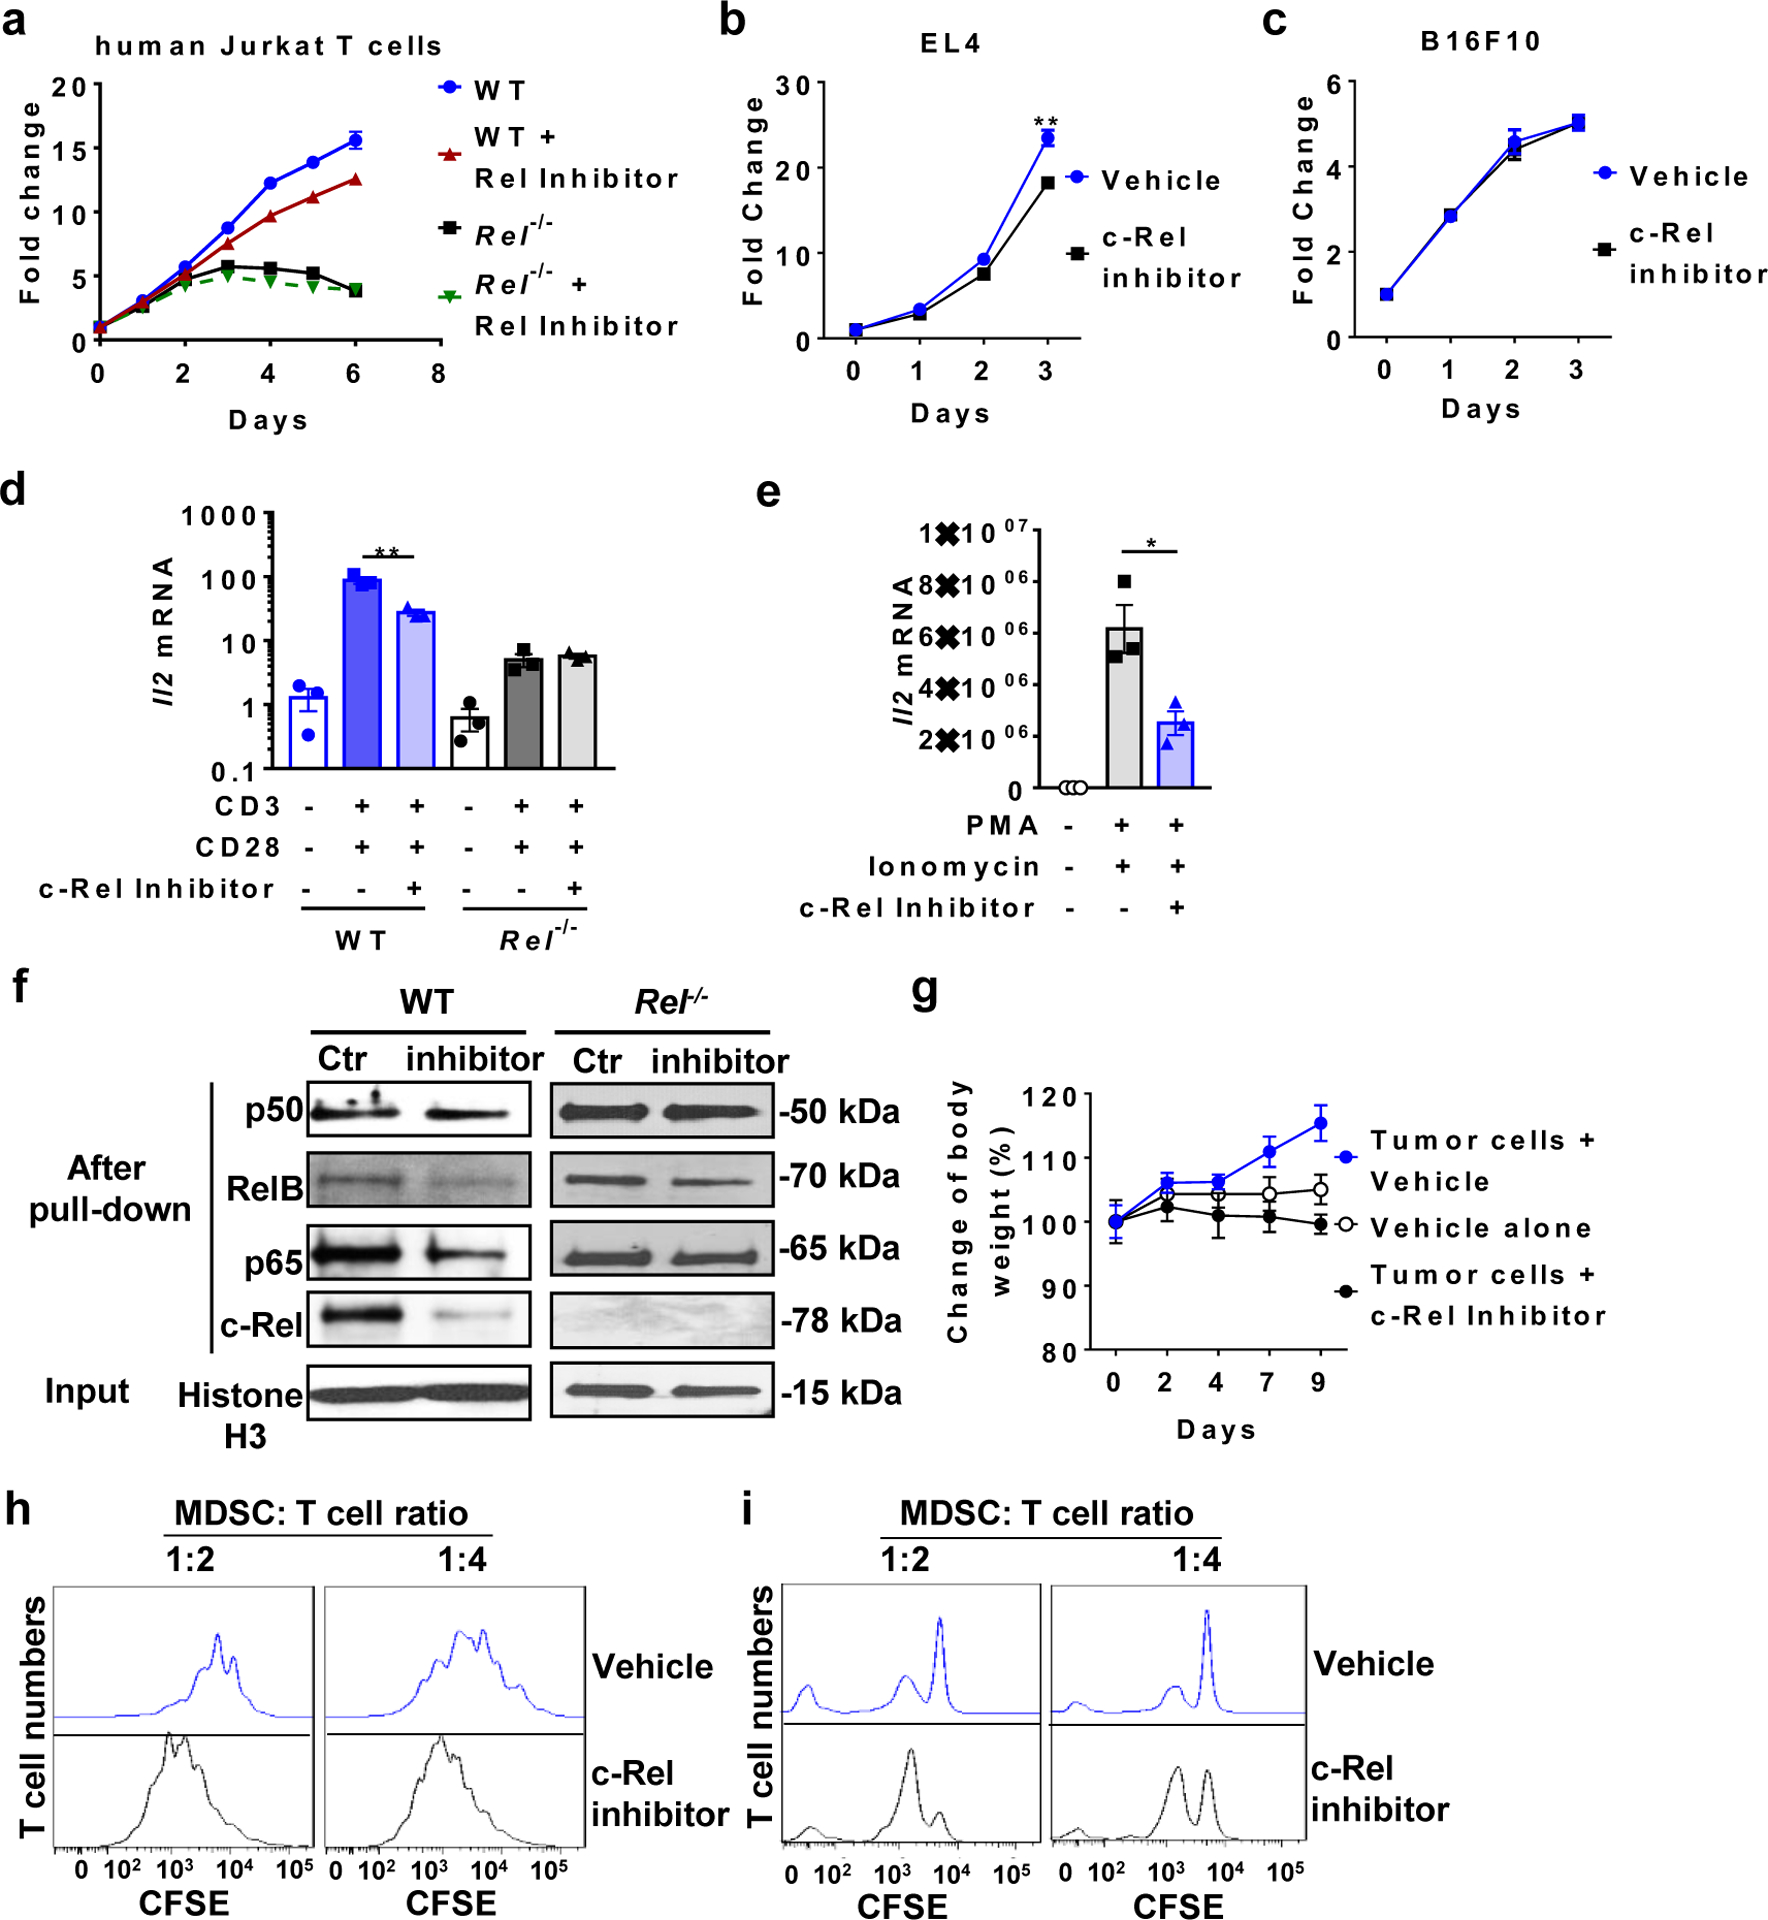
a, Relative numbers of WT and Rel−/− human Jurkat T cells treated with the c-Rel inhibitor (2.5 |jM) or vehicle for the indicated times (n=3 biologically independent cultures/group). b, c, Relative numbers of EL4 (b, n=3 biologically independent cultures/group) and B16F10 (c, n=3 biologically independent cultures/group) cells treated with or without the c-Rel inhibitor (5jM) (**, P=0.00767). d, e, Relative mRNA levels of IL-2 in WT, Rel−/− human Jurkat T cells (d, n=3 biologically independent cultures/group; **, P=0.0047), and normal human PBMCs (e, n=3 biologically independent cultures/group; *, P=0.0241) that were treated with or without c-Rel inhibitor (1 jM). For stimulation, plate-coated anti-mouse CD3 (250 ng/ml) plus soluble anti-mouse CD28 (250 ng/ml), or PMA (10ng/ml) plus ionomycin (1 |jM) were added to the culture for 4 hours, as indicated. f, Preferential inhibition of c-Rel binding to DNA by the c-Rel inhibitor. Western blot for the indicated NF-kB proteins after the NF-kB oligonucleotide pull-down of the nuclear extracts of WT and Rel−/− splenocytes treated with the c-Rel inhibitor (5jM) or vehicle control (Ctr). g, Body weight change of mice that were injected i.p. with vehicle control only (n=7 mice), or injected s.c. with B16F10 cells and i.p. with the c-Rel inhibitor (n=3 mice) or vehicle control (n=4 mice) as indicated. h, i, Representative flow cytometry plots of the MDSC-T cell suppression assay for Fig. 6e (h) and Fig. 6f (i). Data are presented as means ± s.e.m (a-e, g, and i). n=3 mice/group (d, e, j). Statistical significance was determined by two-tailed unpaired West (b-e).
Supplementary Material
Acknowledgements:
We thank Drs. Hsiou-Chi Liou (Cornell University), Wendy Weinberg (US FDA), and Johannes Zakrzewski (Cornell University) for providing the breeding pair of the Rel−/− mice. We are grateful to Drs. Dmitry Gabrilovich, Jason Goldsmith, Pu Fang, Lin Wan, Mei Lin, Duo Zhang, Lei Guan, Jennifer Devergiilis, and Jing Sun for valuable discussions, technical support, and reagents. We thank University of Pennsylvania Pancreatic Islet Cell Biology Core and Dr. Daniel P. Beiting from Penn Vet for technical support. This work was supported in part by grants from the National Institutes of Health (NIH), USA (R01-AI152195, R01-AI099216, R01-AI121166, R01-AI143676, and R01-AI136945 to Y.H.C.); X.L. was partially supported by NIH-T32-DK007780
Footnotes
Competing Interests: YHC and RM are inventors of the following patent that describes the c-Rel inhibitor used in this study: Chen, Y. H., R. Murali, J. Sun: REL INHIBITORS AND METHODS OF USE THEREOF. USA Patent Number US8609730B2, 2013. YHC is a member of the advisory board of Amshenn Co., and Binde Co.
References
- 1.Topalian SL, et al. Safety, activity, and immune correlates of anti-PD-1 antibody in cancer. N Engl J Med 366, 2443–2454 (2012). [DOI] [PMC free article] [PubMed] [Google Scholar]
- 2.Havel JJ, Chowell D, Chan TA. The evolving landscape of biomarkers for checkpoint inhibitor immunotherapy. Nat Rev Cancer 19, 133–150 (2019). [DOI] [PMC free article] [PubMed] [Google Scholar]
- 3.Pardoll DM. The blockade of immune checkpoints in cancer immunotherapy. Nat Rev Cancer 12, 252–264 (2012). [DOI] [PMC free article] [PubMed] [Google Scholar]
- 4.Kumar V, Patel S, Tcyganov E, Gabrilovich DI. The Nature of Myeloid-Derived Suppressor Cells in the Tumor Microenvironment. Trends Immunol 37, 208–220 (2016). [DOI] [PMC free article] [PubMed] [Google Scholar]
- 5.Manjili MH. Phenotypic plasticity of MDSC in cancers. Immunol Invest 41, 711–721 (2012). [DOI] [PubMed] [Google Scholar]
- 6.Solito S, Pinton L, Damuzzo V, Mandruzzato S. Highlights on molecular mechanisms of MDSC-mediated immune suppression: paving the way for new working hypotheses. Immunol Invest 41, 722–737 (2012). [DOI] [PubMed] [Google Scholar]
- 7.Trikha P, Carson WE 3rd. Signaling pathways involved in MDSC regulation. Biochim Biophys Acta 1846, 55–65 (2014). [DOI] [PMC free article] [PubMed] [Google Scholar]
- 8.Bronte V, et al. Recommendations for myeloid-derived suppressor cell nomenclature and characterization standards. Nat Commun 7, 12150 (2016). [DOI] [PMC free article] [PubMed] [Google Scholar]
- 9.Srivastava MK, et al. Myeloid suppressor cell depletion augments antitumor activity in lung cancer. PLoS One 7, e40677 (2012). [DOI] [PMC free article] [PubMed] [Google Scholar]
- 10.Stromnes IM, et al. Targeted depletion of an MDSC subset unmasks pancreatic ductal adenocarcinoma to adaptive immunity. Gut 63, 1769–1781 (2014). [DOI] [PMC free article] [PubMed] [Google Scholar]
- 11.Steinberg SM, et al. Myeloid Cells That Impair Immunotherapy Are Restored in Melanomas with Acquired Resistance to BRAF Inhibitors. Cancer Res 77, 1599–1610 (2017). [DOI] [PMC free article] [PubMed] [Google Scholar]
- 12.Enciso-Mora V, et al. A genome-wide association study of Hodgkin’s lymphoma identifies new susceptibility loci at 2p16.1 (REL), 8q24.21 and 10p14 (GATA3). Nat Genet 42, 1126–1130 (2010). [DOI] [PMC free article] [PubMed] [Google Scholar]
- 13.Trynka G, et al. Coeliac disease-associated risk variants in TNFAIP3 and REL implicate altered NF-kappaB signalling. Gut 58, 1078–1083 (2009). [DOI] [PubMed] [Google Scholar]
- 14.Gregersen PK, et al. REL, encoding a member of the NF-kappaB family of transcription factors, is a newly defined risk locus for rheumatoid arthritis. Nat Genet 41, 820–823 (2009). [DOI] [PMC free article] [PubMed] [Google Scholar]
- 15.Hussman JP, et al. GWAS analysis implicates NF-kappaB-mediated induction of inflammatory T cells in multiple sclerosis. Genes Immun 17, 305–312 (2016). [DOI] [PMC free article] [PubMed] [Google Scholar]
- 16.Himmelstein DS, Baranzini SE. Heterogeneous Network Edge Prediction: A Data Integration Approach to Prioritize Disease-Associated Genes. PLoS Comput Biol 11, e1004259 (2015). [DOI] [PMC free article] [PubMed] [Google Scholar]
- 17.International Multiple Sclerosis Genetics C, et al. Analysis of immune-related loci identifies 48 new susceptibility variants for multiple sclerosis. Nat Genet 45, 1353–1360 (2013). [DOI] [PMC free article] [PubMed] [Google Scholar]
- 18.Consortium IMSG. Network-Based Multiple Sclerosis Pathway Analysis with GWAS Data from 15,000 Cases and 30,000 Controls. Am J Hum Genet 92, 854–865 (2013). [DOI] [PMC free article] [PubMed] [Google Scholar]
- 19.Simek S, Rice NR. Detection and characterization of the protein encoded by the chicken c-rel protooncogene. Oncogene Research 2, 103–119 (1988). [PubMed] [Google Scholar]
- 20.Grumont RJ, Gerondakis S. The murine c-rel proto-oncogene encodes two mRNAs the expression of which is modulated by lymphoid stimuli. Oncogene Research 5, 245–254 (1990). [PubMed] [Google Scholar]
- 21.Artis D, et al. Differential requirement for NF-kappa B family members in control of helminth infection and intestinal inflammation. Journal of Immunology 169, 4481–4487 (2002). [DOI] [PubMed] [Google Scholar]
- 22.Carrasco D, et al. Multiple hemopoietic defects and lymphoid hyperplasia in mice lacking the transcriptional activation domain of the c-Rel protein. Journal of Experimental Medicine 187, 973–984 (1998). [DOI] [PMC free article] [PubMed] [Google Scholar]
- 23.Reinhard K, et al. c-Rel promotes type 1 and type 17 immune responses during Leishmania major infection. Eur J Immunol 41, 1388–1398 (2011). [DOI] [PubMed] [Google Scholar]
- 24.Harling-McNabb L, Deliyannis G, Jackson DC, Gerondakis S, Grigoriadis G, Brown LE. Mice lacking the transcription factor subunit Rel can clear an influenza infection and have functional anti-viral cytotoxic T cells but do not develop an optimal antibody response. Int Immunol 11, 1431–1439 (1999). [DOI] [PubMed] [Google Scholar]
- 25.Liou HC, Jin Z, Tumang J, Andjelic S, Smith KA, Liou ML. c-Rel is crucial for lymphocyte proliferation but dispensable for T cell effector function. International Immunology 11, 361–371 (1999). [DOI] [PubMed] [Google Scholar]
- 26.Kontgen F, et al. Mice lacking the c-rel proto-oncogene exhibit defects in lymphocyte proliferation, humoral immunity, and interleukin-2 expression. Genes & Development 9, 1965–1977 (1995). [DOI] [PubMed] [Google Scholar]
- 27.Campbell IK, Gerondakis S, O’Donnell K, Wicks IP. Distinct roles for the NF-kappaB1 (p50) and c-Rel transcription factors in inflammatory arthritis. Journal of Clinical Investigation 105, 1799–1806 (2000). [DOI] [PMC free article] [PubMed] [Google Scholar]
- 28.Hilliard B, et al. Critical Roles of c-Rel in Autoimmune Inflammation and Helper T Cell Differentiation. Journal of Clinical Investigation 110, 843–850 (2002). [DOI] [PMC free article] [PubMed] [Google Scholar]
- 29.Lamhamedi-Cherradi SE, et al. Transcriptional regulation of type I diabetes by NF-kappa B. Journal of Immunology 171, 4886–4892 (2003). [DOI] [PubMed] [Google Scholar]
- 30.Wang Y, et al. c-Rel is essential for the development of innate and T cell-induced colitis. J Immunol 180, 8118–8125 (2008). [DOI] [PMC free article] [PubMed] [Google Scholar]
- 31.Jordan KA, Dupont CD, Tait ED, Liou HC, Hunter CA. Role of the NF-kappaB transcription factor c-Rel in the generation of CD8+ T-cell responses to Toxoplasma gondii. Int Immunol 22, 851–861 (2010). [DOI] [PMC free article] [PubMed] [Google Scholar]
- 32.Ruan Q, et al. Development of Foxp3(+) regulatory T cells is driven by the c-Rel enhanceosome. Immunity 31, 932–940 (2009). [DOI] [PMC free article] [PubMed] [Google Scholar]
- 33.Oh H, et al. An NF-kappaB Transcription-Factor-Dependent Lineage-Specific Transcriptional Program Promotes Regulatory T Cell Identity and Function. Immunity, (2017). [DOI] [PMC free article] [PubMed] [Google Scholar]
- 34.Grinberg-Bleyer Y, et al. NF-kappaB c-Rel Is Crucial for the Regulatory T Cell Immune Checkpoint in Cancer. Cell 170, 1096–1108 e1013 (2017). [DOI] [PMC free article] [PubMed] [Google Scholar]
- 35.Ruan Q, et al. The Th17 immune response is controlled by the Rel-ROR{gamma}-ROR{gamma}T transcriptional axis. J Exp Med 208, 2321–2333 (2011). [DOI] [PMC free article] [PubMed] [Google Scholar]
- 36.Youn JI, Collazo M, Shalova IN, Biswas SK, Gabrilovich DI. Characterization of the nature of granulocytic myeloid-derived suppressor cells in tumor-bearing mice. J Leukoc Biol 91, 167–181 (2012). [DOI] [PMC free article] [PubMed] [Google Scholar]
- 37.Gato-Canas M, et al. A core of kinase-regulated interactomes defines the neoplastic MDSC lineage. Oncotarget 6, 27160–27175 (2015). [DOI] [PMC free article] [PubMed] [Google Scholar]
- 38.Oh H, et al. An NF-kappaB Transcription-Factor-Dependent Lineage-Specific Transcriptional Program Promotes Regulatory T Cell Identity and Function. Immunity 47, 450–465 e455 (2017). [DOI] [PMC free article] [PubMed] [Google Scholar]
- 39.Chen YH, Murali R, Sun J. Rel inhibitors and methods of use thereof. US patent number: 8609730; PCT/US2009/030325. https://patentscope.wipo.int/search/en/detail.jsf?docId=WO2009089277 (2009).
- 40.Marvel D, Gabrilovich DI. Myeloid-derived suppressor cells in the tumor microenvironment: expect the unexpected. J Clin Invest 125, 3356–3364 (2015). [DOI] [PMC free article] [PubMed] [Google Scholar]
- 41.Marigo I, et al. Tumor-induced tolerance and immune suppression depend on the C/EBPbeta transcription factor. Immunity 32, 790–802 (2010). [DOI] [PubMed] [Google Scholar]
- 42.Kaneda MM, et al. PI3Kgamma is a molecular switch that controls immune suppression. Nature 539, 437–442 (2016). [DOI] [PMC free article] [PubMed] [Google Scholar]
- 43.Ostrand-Rosenberg S, Sinha P, Beury DW, Clements VK. Cross-talk between myeloid-derived suppressor cells (MDSC), macrophages, and dendritic cells enhances tumor-induced immune suppression. Semin Cancer Biol 22, 275–281 (2012). [DOI] [PMC free article] [PubMed] [Google Scholar]
- 44.Srivastava MK, et al. Targeting myeloid-derived suppressor cells augments antitumor activity against lung cancer. Immunotargets Ther 2012, 7–12 (2012). [DOI] [PMC free article] [PubMed] [Google Scholar]
- 45.Zilio S, Serafini P. Neutrophils and Granulocytic MDSC: The Janus God of Cancer Immunotherapy. Vaccines (Basel) 4, (2016). [DOI] [PMC free article] [PubMed] [Google Scholar]
- 46.Zhao Y, Wu T, Shao S, Shi B, Zhao Y. Phenotype, development, and biological function of myeloid-derived suppressor cells. Oncoimmunology 5, e1004983 (2016). [DOI] [PMC free article] [PubMed] [Google Scholar]
- 47.Knopp MM, Lobmann K, Elder DP, Rades T, Holm R. Recent advances and potential applications of modulated differential scanning calorimetry (mDSC) in drug development. Eur J Pharm Sci 87, 164–173 (2016). [DOI] [PubMed] [Google Scholar]
- 48.Merika M, Thanos D. Enhanceosomes. Current Opinion in Genetics & Development 11, 205–208 (2001). [DOI] [PubMed] [Google Scholar]
- 49.Panne D The enhanceosome. Current Opinion in Structural Biology 18, 236–242 (2008). [DOI] [PubMed] [Google Scholar]
- 50.Arnosti DN, Kulkarni MM. Transcriptional enhancers: Intelligent enhanceosomes or flexible billboards? Journal of Cellular Biochemistry 94, 890–898 (2005). [DOI] [PubMed] [Google Scholar]
- 51.Tumang JR, et al. c-Rel is essential for B lymphocyte survival and cell cycle progression. European Journal of Immunology 28, 4299–4312 (1998). [DOI] [PubMed] [Google Scholar]
Associated Data
This section collects any data citations, data availability statements, or supplementary materials included in this article.
Supplementary Materials
Data Availability Statement
Microarray and RNA sequencing data that support the findings of this study have been deposited in the ArrayExpress under accession codes E-MTAB-8674 and E-MTAB-8714. Source data for all figures are provided with the paper online. All other data supporting the findings of this study are available from the corresponding author on reasonable request.


