Abstract
Purpose
The purpose of the study was to examine the impact of the first wave of COVID-19 on National Health Service (NHS) 18F-fluorodeoxyglucose positron emission tomography computed tomography (FDG PET-CT) scanning activity across England.
Methods
Monthly FDG PET-CT scanning activity was collected from 41/48 NHS England provider sites. Data from 31/41 sites were stratified by nononcology/oncology, cancer type, with lung cancer and lymphoma split into specific indications, turn-around times and delays due to radiotracer.
Results
In April and May 2020, a 32 and 31% decrease in activity was observed, a larger decrease for noncancer compared with cancer FDG PET-CT. In June 2020, activity started to recover with 6% fewer scans recorded compared with June 2019. Of the six most common indications, lung and oesophageal cancer had the largest decrease in activity and slowest recovery. Lymphoma and melanoma showed the smallest decrease and fastest recovery. Lung cancer scans for initial diagnosis/staging saw the largest fall and slowest recovery compared with scans for known lung cancer. There was no percentage increase in overall turn-around time compared with the same months in 2019, and no increase in turn-around time of more than 7 working days due to FDG supply during April and May 2020 compared with the 3 previous months.
Conclusions
There is no correlation between FDG PET-CT activity (fall and recovery) in England and the ability to provide the service by NHS England. It most likely reflects a combination of changes in health-seeking behaviour, NHS health policy and a decrease in the use of investigations that carry a high risk of COVID-19 transmission.
Keywords: COVID-19, imaging, nuclear medicine, PET-CT
Introduction
The coronavirus disease (COVID-19) has resulted in 21 213 649 million confirmed infections and 760 421 deaths as of 15 August 2020 and the pandemic shows little sign of abating [1]. The COVID-19 pandemic has had a substantial impact on healthcare systems and that includes diagnostic imaging services. A special report of the Radiological Society of North America COVID-19 task force reported a 40–90% decline of examination volumes in radiology practices during the COVID-19 pandemic [2]. Further, a retrospective review of imaging volumes from the largest healthcare system in New York state reported a 28% reduction in imaging volume during the first-wave COVID-19 pandemic [3]. Several surveys have evaluated the impact of COVID-19 on nuclear medicine services [3–6]. Across the world, all surveys showed that COVID-19 had resulted in a significant decline in nuclear medicine scanning, with some centres experiencing a decrease in activity of up to 85% [6]. However, none of these studies were PET-CT focussed and as such do not analyze the variation or magnitude of change in PET-CT imaging volumes during the period using present real-world data.
PET-CT is one of the main diagnostic tests in the investigation of people with cancer [7,8]. It is also used for the assessment of some nononcological disorders, including sarcoidosis, vasculitis, infection, orthopaedics and some neurological and cardiac conditions [7,8]. National Health Service (NHS) England commissions PET-CT services across England through a number of NHS Trusts, research institutes, charitable trusts and independent sector providers with a total of over 130 000 PET-CT scans performed during the calendar year 2019.
Throughout the first wave of the COVID-19 pandemic, NHS England PET-CT sites continued to provide services. Moving out of the first wave, the priority within NHS England, has been to return healthcare services to as near as possible to pre-COVID levels. With this comes the requirement for diagnostic services, including PET-CT, to meet demand while conforming to new COVID-19 well-tolerated measures [9,10]. An accurate and detailed understanding of the changes in PET-CT scanning activity during the first wave, and the ability of PET-CT services to recover, can contribute to ensuring that management plans for people with cancer are not delayed in the future and that relapse of disease in cancer survivors is detected in a timely fashion. This is particularly relevant, as at the time of writing, the UK is experiencing a sharp rise in incidence of COVID-19 and a second wave of the pandemic [11].
The study examined the impact of the first wave of the COVID-19 pandemic on 18F-fluorodeoxyglucose positron emission tomography computed tomography (FDG PET-CT) scanning across England. The primary aim of the study was to describe the impact of the first wave of the pandemic on nononcology and oncology FDG PET-CT activity across NHS England sites. The secondary aim of the study was to assess the ability of NHS England PET-CT services to meet demand by evaluating the time taken for booked FDG PET-CT scans to be completed and the extent to which FDG supply impacted on FDG PET-CT service.
Methodology
NHS England provides healthcare to a population of 55.98 million. A retrospective review of the FDG PET-CT scanning activity within NHS England was undertaken. FDG PET-CT scanning activity data from January to June 2019 and January to June 2020 was collected from 41 sites out of a total of 48 NHS England provider sites from which data were requested. In total, the data collected accounted for more than 90% of all FDG PET-CT scanning across NHS England. The data provided from each of the sites were aggregated monthly data. Within 31 of the 41 sites, the data were further stratified according to nononcology and oncology. The oncology data included the number of FDG PET-CT scans completed for the six most common indications for FDG PET-CT in England: lymphoma, melanoma, lung, oesophageal, colorectal and head and neck cancer. Lung cancer scanning activity was further split between FDG PET-CT for initial diagnosis/staging and FDG PET-CT for subsequent diagnosis of recurrence, surveillance and restaging. Lymphoma FDG PET-CT activity was further split between FDG PET-CT for initial staging and FDG PET-CT for subsequent management. Analysis of the cancer subgroups was restricted to the 31 sites that we requested data from. For the 31 sites, the percentage of booked FDG PET-CT scans completed in less than 5 working days, the percentage of booked FDG PET-CT scans completed within 7 working days and the percentage of FDG PET-CT scans which took more than 7 working days to complete were evaluated as markers to assess the impact of COVID-19 on the ability of PET-CT services to meet demand during pandemic. An FDG PET-CT scan is completed when a clinical report has been made and the report has been sent to the referrer of the FDG PET-CT scan. In addition, for the 31 sites, the percentage of booked FDG PET-CT scans not completed within 7 days due to FDG was evaluated.
Statistics
The quantitative data collected were compiled in a database using Excel before being analysed using Stata software to assess the distribution and statistical significance of the variation in monthly FDG PET-CT scanning activity. Data variables were generated to facilitate a comparison of the pre-COVID-19 period (January to June 2019) and COVID period (January to June 2020). The imaging volumes for each month were summed and descriptive statistical methods were applied to demonstrate the variation and trend in imaging activity for both periods. The variation in activity during January to June 2020 was then compared with the same months in 2019. The percentage change values and mean activity volumes for each month were calculated and independent t-tests were undertaken to assess the statistical significance for P values <0.05.
Results
The data show a decrease in the number of FDG PET-CT scans done between January and June 2020 compared with the same period in the previous year. The decrease was mainly due to a lower volume of FDG PET-CT scanning activity between April 2020 and May 2020 (Fig. 1). A total of 50 879 FDG PET-CTs were completed between January 2020 and June 2020, compared with 52 460 FDG PET-CTs completed for the same period in 2019. Overall, there was a −32% fall in total volume of FDG PET-CTs performed in April 2020 compared with April 2019 and a fall of −31% in May 2020 compared with May 2019 (Table 1, Fig. 2).
Fig. 1.
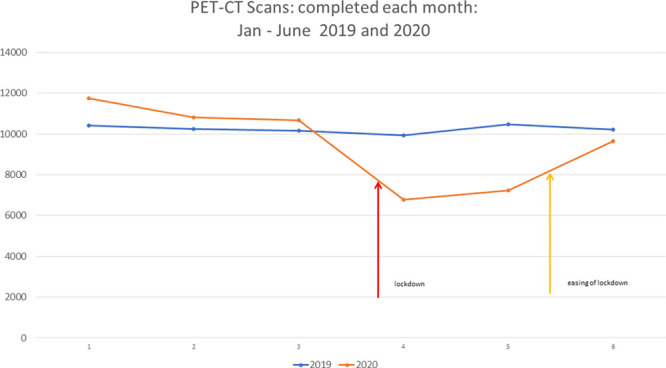
Comparison of total volume of PET-CTs completed: January to June for the years 2019 and 2020. 1 – January, 2 – February, 3 – March, 4 – April, 5 – May, 6 – June.
Table 1.
Total monthly PET-CT activity and percentage change year-on-year for January–June 2020
| January | February | March | April | May | June | |
|---|---|---|---|---|---|---|
| 2019 total no. Scans | 10 421 | 10 244 | 10 168 | 9 927 | 10 471 | 10 229 |
| 2019 mean | 254 | 250 | 248 | 242 | 255 | 249 |
| 2020 total no. Scans | 11 744 | 10 810 | 10 672 | 6 778 | 7 323 | 9 652 |
| 2020 Mean | 286 | 264 | 260 | 165 | 176 | 235 |
| P value | 0.44 | 0.73 | 0.74 | 0.01* | 0.01* | 0.69 |
| Change year-on-year (%) | 13 | 6 | 5 | −32 | −31 | −6 |
P value reported is based on an independent t-test comparing two means.
* P < 0.05
Fig. 2.
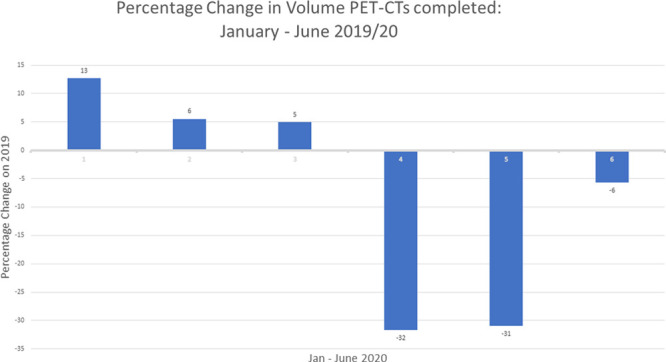
Percentage change year-on-year in volume of PET-CTs completed for months January to June 2020. 1 – January, 2 – February, 3 – March, 4 – April, 5 – May, 6 – June.
Table 2.
Total percentage change (year-on-year over the period January–June 2020) in the number of PET-CT scans completed across six cancers
| Total number of PET-CT scans done |
2019 | 2020 | Change (%): 2019/20 |
|---|---|---|---|
| Lung cancer | 10 606 | 9399 | −11 |
| Oesophageal cancer | 1816 | 1367 | −25 |
| Melanoma | 1294 | 1465 | 13 |
| Head and neck cancer | 2525 | 2452 | −3 |
| Colorectal cancer | 2376 | 2332 | −2 |
| Lymphoma | 6907 | 6850 | −1 |
In June 2020, FDG PET-CT scanning activity returned to a level of activity that was closer to that of the previous year with an overall percentage decrease of −6% compared with June 2019 (Fig. 2, Table 1). Out of 41 sites in June 2020, 16 sites showed a percentage increase in activity, whereas 25 sites reported a percentage decrease in activity compared to June 2019. With respect to range, 20 sites were within an interquartile range of between −15 and +6% for percentage change in activity, whereas 10 sites were below the 25 percentile (marked as red dots in Fig. 3) and 11 sites reported a percentage change above the 75 percentile (Figs. 3).
Fig. 3.
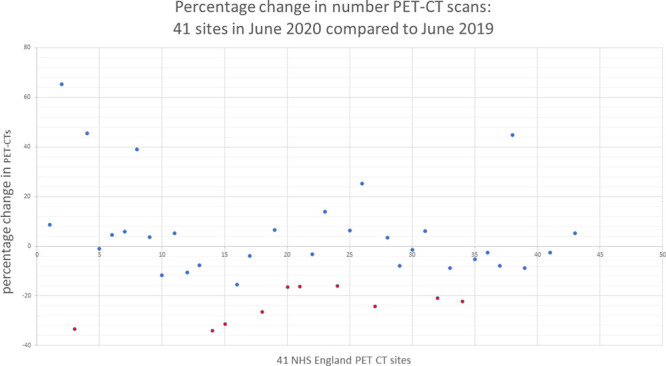
Percentage change in PET-CT activity at site level: year-on-year for the month June 2020.
On closer inspection of the data, a more pronounced decrease in activity was observed in nononcology FDG PET-CT scanning. In 2020, 30 616 oncology scans were completed and 1817 nononcology scans were completed compared with 31 845 oncology scans and 1852 nononcology scans in 2019. As a percentage, nononcology FDG PET-CT scanning decreased by −55 and −33%, respectively, during April and May 2020, compared with a decrease of −23 and −26%, respectively, for oncology (Fig. 4).
Fig. 4.
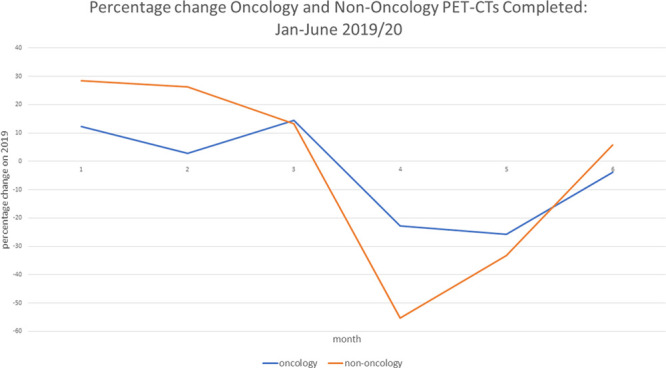
Percentage change in volume of oncology and nononcology PET-CTs completed: year-on-year for the months January–June 2020. 1 – January, 2 – February, 3 – March, 4 – April, 5 – May, 6 – June.
Within oncology, a dip in FDG PET-CT scanning activity over April and May 2020 was associated with the type of cancer investigated. In April 2020, the percentage decrease was most marked for oesophageal cancer, followed by lung cancer, head and neck cancer, colorectal cancer and melanoma, with lymphoma showing the smallest dip. A similar trend was observed in May 2020 for oesophageal cancer, lung cancer, colorectal cancer, head and neck cancer and lymphoma. Melanoma, however, did not show this trend; instead it showed an increase in activity above that of June 2019 (Fig. 5, Table 3).
Fig. 5.
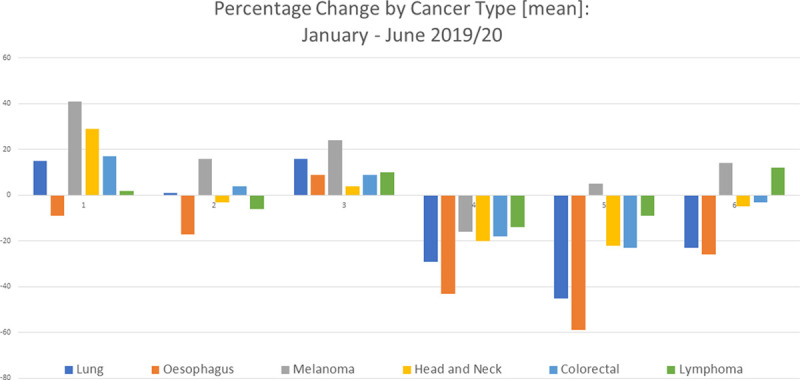
Percentage change year-on-year for the months January–June 2020 in global FDG PET-CT scanning activity related to indications for PET-CT. 1 – January, 2 – February, 3 – March, 4 – April, 5 – May, 6 – June. FDG PET-CT, 18F-fluorodeoxyglucose positron emission tomography computed tomography.
Table 3.
Monthly percentage change (year-on-year for months January–June 2020) in the number of PET-CT scans completed across six cancers
| Cancer | January | February | March | April | May | June |
|---|---|---|---|---|---|---|
| Lung | 15 | 1 | 16 | −29 | −45 | −23 |
| Oesophagus | −9 | −17 | 9 | −43 | −59 | −26 |
| Melanoma | 41 | 16 | 24 | −16 | 5 | 14 |
| Head and neck | 29 | −3 | 4 | −20 | −22 | −5 |
| Colorectal | 17 | 4 | 9 | −18 | −23 | −3 |
| Lymphoma | 2 | −6 | 10 | −14 | −9 | 12 |
In June 2020, FDG PET-CT scanning activity related to melanoma and lymphoma returned to their previous year’s performance. In addition, scanning activity in colorectal and head and neck cancer returned near to their previous year’s performance at −3 and −5%, respectively. In contrast, lung and oesophageal cancer reported a −23 and −26% decrease in activity compared with the previous year (Fig. 5, Table 3). With regard to lung cancer, the level of scanning activity at all 31 sites remained below that of the previous year. At an individual site level, the median level of activity for lung cancer in June 2020 was −26% with an interquartile range of between −33 and −10% (Fig. 6).
Fig. 6.
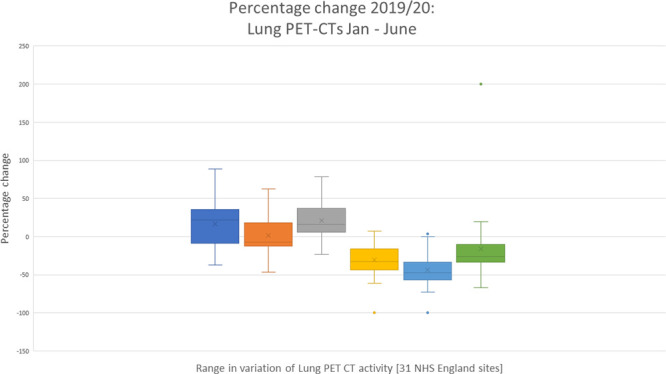
Monthly percentage change (year-on-year for the months January–June 2020) in PET-CT lung cancer activity across 31 NHS England sites. NHS, National Health Service; PET CT, positron emission tomography computed tomography.
Comparing lymphoma and lung cancer FDG PET-CT scanning activity, scans related to the diagnosis and staging of lung cancer saw a fall in activity of −29% in April 2020, −47% in May 2020 and −26 % in June 2020 compared with −9% in April 2020, −28% in May 2020 and −14 % in June 2020 for lymphoma. FDG PET-CT scanning related to the care of people with lymphoma following their diagnosis showed a fall in activity of −17% in April 2020, +5% in May 2020 and +31% in June 2020 compared with −29% in April 2020, −19% in May 2020 and +2% in June 2020 for PET-CTs for the care of people with lung cancer following their diagnosis (Fig. 7).
Fig. 7.
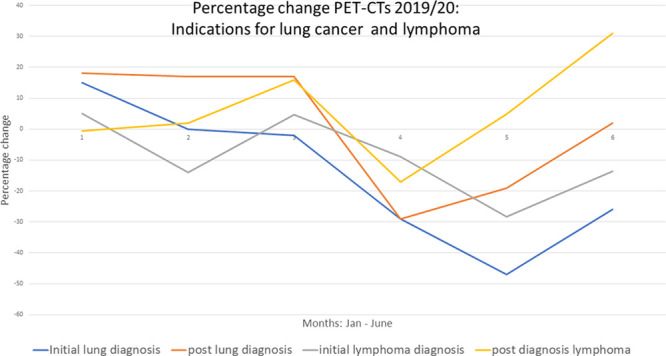
Monthly percentage change (year-on-year for the months January–June 2020) in PET CT related to specific indications for lung cancer and lymphoma.1 – January, 2 – February, 3 – March, 4 – April, 5 – May, 6 – June.
An analysis of the ability of the PET-CT service to meet demand showed that the percentage of FDG PET-CT scans that had a turn-around time of more than 7 working days during April and May 2020 was lower compared with the same months in 2019. Further, there was an increase in the percentage of FDG PET-CT scans that had a turn-around time of less than 5 days during April and May 2020 during the same period in 2019 (Fig. 8a,b). In addition, the data showed that there was no increase in turn-around time of more than 7 working days due to FDG supply during April and May 2020 compared with the January, February and March 2020 (Table 4).
Fig. 8.
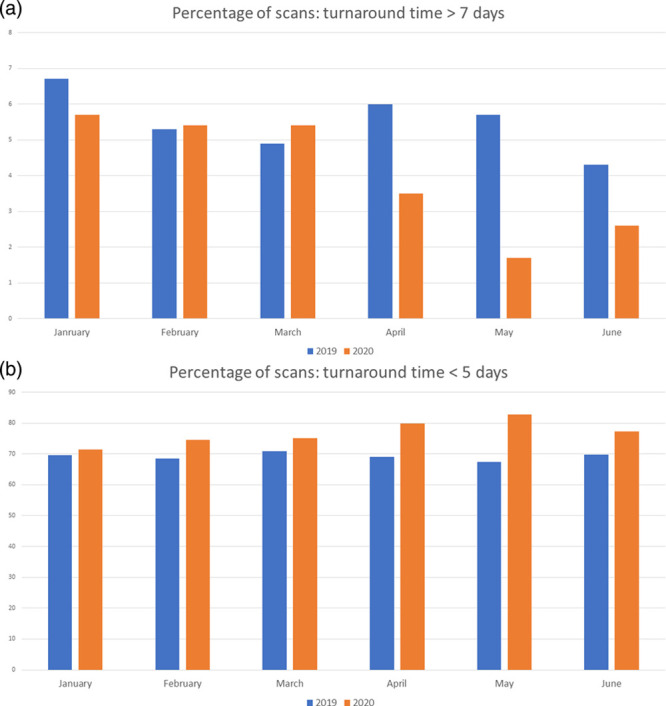
(a) Monthly percentage of FDG PET-CT scans turned around in more than 7 working days. (b) Monthly percentage of FDG PET-CT scans turned around in less than 5 working days. FDG PET-CT, 18F-fluorodeoxyglucose positron emission tomography computed tomography.
Table 4.
Percentage of scans with turn-around time >7 working days due to FDG supply problems
| 2020 | |
|---|---|
| January | 59/6592 (0.9%) |
| February | 50/5889 (0.8%) |
| March | 55/6218 (0.9%) |
| April | 22/4127 (0.5%) |
| May | 17/4261 (0.4%) |
| June | 48/5469 (0.9%) |
Fig. 9.
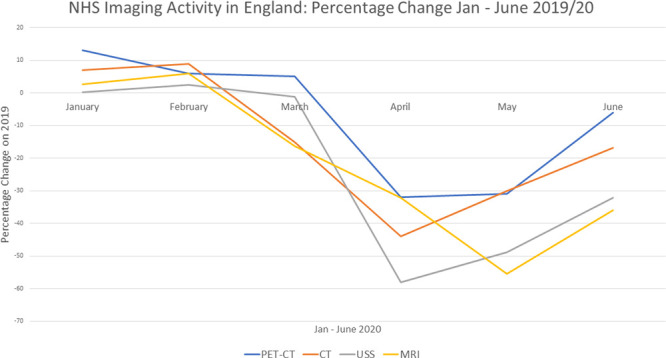
Comparison of percentage change in total volume of PET-CTs, CT, MRI and ultrasound (USS) completed: January to June for the years 2019 and 2020.
Discussion
The study gives rise to several key findings [1]. Our data show that FDG PET-CT scanning in England fell significantly during the first wave of the COVID-19 pandemic [2]. However, FDG PET-CT oncology activity was less affected when compared with nononcology FDG PET-CT [3]. The pace of recovery post COVID-19 shows that by June 2020 most sites had returned to the previous years’ level of activity with the percentage change in nononcology activity 6% higher than 2019 and oncology −4% lower.
Drawing from the diagnostic imaging databases, a similar trend of decrease and recovery to FDG PET-CT was seen in the magnetic resonance, CT and ultrasound activity over the first wave of the pandemic. However, the decrease in activity for these imaging modalities was more severe compared with FDG PET-CT. In addition, the recovery of FDG PET-CT activity was more rapid compared with the other modalities (Fig. 8, Table 5).
Table 5.
Total monthly CT, ultrasound (USS), magnetic resonance activity and percentage change year-on-year for January- June 2020.
| CT | January | February | March | April | May | June |
|---|---|---|---|---|---|---|
| 2019 total no. of scans | 499 632 | 452 740 | 494 920 | 479 215 | 501 830 | 487 155 |
| 2020 total no. of scans |
534 605 | 493 035 | 420 070 | 269 830 | 351 185 | 404 695 |
| % change | +7.0% | +8.9% | −15.1% | −44.0% | −30.0% | −16.9% |
| USS | ||||||
| 2019 total no. of scans | 912 130 | 801 285 | 864 995 | 851 880 | 840 450 | 840 450 |
| 2020 total no. of scans | 913 220 | 820 455 | 704 450 | 357 840 | 429 605 | 569 530 |
| % change | 0.12% | 2.4% | −1.22% | −58.0% | 48.9% | −32.2% |
| MRI | ||||||
| 2019 total no. of scans | 324 475 | 296 565 | 323 100 | 308 065 | 315 900 | 315 900 |
| 2020 total no. of scans | 333 005 | 314 410 | 270 555 | 99 225 | 140 795 | 202 330 |
| % change | +2.6% | +6.0% | −16.3% | −32.1% | −55.4% | −35.9% |
Source: Diagnostic imaging dataset https://www.england.nhs.uk/statistics/statistical-work-areas/diagnostic-imaging-dataset/ accessed 11 November 2020
The extent of the decrease in FDG PET-CT scanning activity corroborates the findings from a British Nuclear Medicine Society (BNMS) survey completed by 138 members between 23 March and mid May 2020. The BNMS members’ survey findings reported an average reduction in PET-CT scanning activity of 32%, which exactly matched the activity data from our study [12]. Further, our results also support the findings of a web-based survey by Freudenberg et al. which surveyed 434 respondents from 72 countries between 16 April 2020 and 3 May 2020. Their study found an average decline in PET-CT services of 36% [4]. In our study, the decrease in scanning activity coincided with the peak of incidence of COVID-19 in England and the period of national lock down [12]. The decline was most marked between April and May 2020 when a decrease of 32 and 31%, respectively, was observed when compared to the same months in the previous year.
Our study’s findings indicate that the fall in activity was not associated with any inability to deliver PET-CT services. There was no increase in turnaround times for people booked for FDG PET-CT scanning during April and May 2020, the period which saw the biggest fall in FDG PET-CT scanning activity. Instead, the percentage of booked scans completed which took more than 7 working days was lower in April and May compared to the same period during the previous year. Furthermore, the percentage of booked FDG PET-CT scans completed in less than 5 working days increased. There was also no increase in turn-around time of FDG PET-CT scans because of FDG supply problems during April and May 2020. Instead, there was a decrease in the percentage of FDG PET-CTs delayed because of FDG supply.
Our study suggests that factors beyond the control of FDG PET-CT sites were responsible for the decrease in FDG PET-CT activity. First, prioritisation of service was a major factor. Prioritisation of people with COVID-19 and cancer services in preference to nononcology services during the first wave had a major impact on scanning activity. European guidance published at the time advised on the importance of prioritising essential nuclear medicine procedures over nonessential procedures if possible [10,13,14]. In the UK, the BNMS recommended prioritising PET-CT for people with new cancers and sepsis over other PET-CTs if possible [15]. Our data showed that the decrease in nononcology FDG PET-CT activity was much higher compared with the decrease in cancer scanning activity. This observation is concordant with four other studies which showed that during the COVID-19 pandemic, noncancer nuclear medicine scan activity was more affected when compared with cancer nuclear medicine scans [4,16,17]. Specifically, a study by Freudenberg et al. found that while PET-CT cancer scanning activity decreased by an average of 36%, the number of thyroid studies fell by 67%, myocardial studies 66%, bone scans 60%, lung scans 65% and sentinel node procedures by 45% [4]. Second, a web-based survey carried out by Fruedenberg et al. over 6 days in April 2020 with respondents from Germany, Austria and Switzerland, reported a decline in PET-CT of -14.4% compared with a decline in myocardial perfusion imaging of −47.2% and radiosynoviothesis of −58.4% [16]. Third, the survey of BNMS members reported that the decline in PET-CT was less pronounced than that compared with other nuclear medicine investigations. It reported that ‘the most affected area of nuclear medicine in conventional diagnostic nuclear medicine was thyroid, parathyroid and renal imaging, they were all reduced by more than 75%. Oncology PET-CT and some therapies such as selective internal radiation therapy and Ra-233 were the least effected’ [12]. Finally, in an Italian single centre study in which 94% of PET-CT scans were conducted for cancer, no statistically significant difference was found in the number of PET-CTs done between February and April 2020 compared with the same period in 2019 [17].
A further factor that contributed to the decrease in FDG PET-CT activity was changes in decision making within multidisciplinary team (MDT) meetings. Some colleagues and MDTs coped with COVID-19 by bypassing or delaying PET-CT scans for initial staging and for one of the response assessment scans1: ‘when I am told we have a theatre slot available at the end of the week, I go ahead with surgery and bypass the planned PET-CT, especially when I think it is probably unlikely that the person has distant metastases’. There was also in some centres a reduction in the use of surveillance PET-CT scanning: ‘if a person is well, and for whatever reason missed a planned follow-up PET-CT, we will just wait till the next time the person is due for a scan to do the scan’.
Service prioritisation and changes in decision making at MDTs were not the only factors. Another factor which would have added to the decrease in activity was a change in health-seeking behaviour, which resulted in a fall in the number of people going to their general practitioner (GP) with signs and symptoms of cancer and as a result the number of suspected cancer referrals to hospital [18,19]. By contrast to nononcology FDG PET-CT, there was a clear message from professional organisations that PET-CT services for people with cancer should as far as possible remain uninterrupted, and this was reflected in published guidance [14]. Nevertheless, there was a fall in activity in cancer FDG PET-CT, all be it not as great as nononcology FDG PET-CT.
However, these factors do not account fully for the difference observed in activity between the tumor types. Lung cancer showed a statistically significant larger fall in activity and also a significantly slower recovery compared to lymphoma. The suspension or operation under reduced capacity of essential diagnostic services, including endoscopy and bronchoscopy, likely contributed significantly to this. The number of endoscopies done in April 2020 was 90% fewer than that performed in the first three months of 2020 [20]. Bronchoscopy and endoscopy are aerosol-generating procedures that carry a risk of severe acute respiratory syndrome coronavirus 2 transmission; risk mitigation strategies mean that the number of colonoscopies bronchoscopies that can be done per day had to be much lower than before the pandemic.
With regard the to the overall recovery of FDG PET-CT services, the data from this study demonstrated that by June 2020, most sites had returned to their previous year’s level of activity with the percentage change in nononcology activity 6% higher than 2019 and oncology −4% lower. However, as with decline in activity, the extent of the recovery was not uniform across the cancer types. FDG PET-CT scanning in lung cancer showed a slower recovery compared with scanning for lymphoma. This further supports the impact of decreased bronchoscopy and endoscopy on FDG PET-CT activity. As of June 2020, these diagnostic services had restarted but at reduced capacity [21].
With regard to the pace of recovery, data from 31 sites show that the pace of recovery since June 2020 has been variable across sites. Comparing June 2020 with the same month in the previous year, scanning activity for the best performing sites improved by up to +65% compared with −34% for the lowest performing site. By August 2020, the gap in scanning activity between sites had widened with scanning activity improving by as much as +650% in the best performing site compared with up to −1% for the slowest sites. The difference highlights the variation in pace of regional recovery. Contributing to this divergence is the ability of bronchoscopy and endoscopy services to recover. There is also an increasing awareness of the regional differences in health-seeking behaviour of people during COVID-19, magnified by social inequalities [18–24].
Three caveats need to be considered when evaluating the extent of the recovery in PET-CT activity during the first wave of the pandemic. First, the activity data do not take account of any increase in the trend rate of growth in FDG PET-CT activity, which pre-COVID-19 was growing at a rate of somewhere between 5 and 15% per annum. Second, a possible backlog of FDG PET-CTs has not been taken into account when considering the recovery in activity in June 2020. According to Cancer Research UK at the start of June 2020, there was an estimated 2.4 million people in the backlog for screening, tests or treatment. Further, NHS England data from 11 June 2020 show that the number of urgent GP referrals for cancer dropped by 60% in April compared with the same month in the previous year, and the number of people starting treatment following an urgent GP referral declined by 18% [17]. The third caveat concerns the fact that the activity data for June 2020 do not factor in the alternative treatment plans that may have been adopted by clinicians during the peak of the pandemic so as to circumvent the need for a PET-CT scan. In line with national and local guidance, nonsurgical treatment was considered in favour of surgery. Systemic treatment and radiotherapy regimens were changed and modified all in an effort to reduce the risk of spread of COVID-19 infection and to conserve healthcare resources for COVID-19 patients [18]. In short, the above considerations need to be taken in consideration when an attempt is made to predict future PET-CT demand.
Some of the observations and lessons learnt from this study can be useful for assisting with planning services for the current second wave and possible subsequent waves. First, it highlights that the demand for PET CT is very much dependent on the changes that occur in the clinical pathway upstream. A detailed appreciation of the impact of COVID-19 on clinical pathways, which include PET-CT, will be key to ensuring that PET-CT services are organised to meet demand. In addition, given the relative robustness of PET-CT, during the first wave, commissioners and clinicians should perhaps place PET-CT earlier in the diagnostic pathway during the second and in subsequent waves. Adopting this approach would result in fewer imaging episodes, thus making it safer for patients and staff. In addition, it will improve patient experience and free up other scanning for other use. For example, with respect to people with lung cancer and a relatively high risk of distant metastases, it may be reasonable to consider FDG PET-CT as the initial staging investigation (Table 6).
Table 6.
Lessons learnt from the first wave of the COVID-19 pandemic
| Lessons learnt |
|---|
| (1) During the first wave of the pandemic, NHS England PET-CT sites continued to maintain robust FDG PET-CT services. The decrease in FDG PET-CT activity was due to demand side factors beyond the direct control of NHS PET-CT services. |
| (2) Changes in service prioritisation, the decision making at MDTs and changes in health-seeking behaviour, contributed to a fall in FDG PET-CT scanning activity. The suspension or operation under reduced capacity of endoscopy and bronchoscopy services also contributed to the fall. |
| (3) In future, a better understanding of the impact of COVID-19 on clinical pathways will be key to ensuring that PET-CT services are adapted to meet the changing pattern of demand. |
NHS, National Health Service.
Conclusion
Drawing on activity data from 41 sites across NHS England, this study demonstrated a significant fall of up to 32% in FDG PET-CT scanning activity during the first wave of the COVID-19 pandemic. There is no correlation between FDG PET-CT activity (fall and recovery) in England and the ability of NHS England to provide FDG PET-CT services. It most likely reflects a combination of changes in health-seeking behaviour, NHS health policy and a decrease in the use of investigations that carry a high risk of COVID-19 transmission, specifically endoscopy and bronchoscopy.
Acknowledgements
The authors acknowledge the following people Parthiban Arumugam, Professor Gary Cook, Professor Sabina Dizdarevic, Samantha Harrison, Nabil Huraiji, Professor Peter Johnson, Charlotte Lynch, Professor Iain Lyburn, Prakash Manoharan, Brian Murby, Joanne Page, Ana Ruas, Janet Reed Stevens, Thomas Wagner, Beverley Wallace.
Conflicts of interest
There are no conflicts of interest.
FOOTNOTE
This was a contributory factor identified on interview with MDT leads at the Mount Vernon Cancer centre.
References
- 1.https://www.ecdc.europa.eu/en/covid-19-pandemic. [Accessed 1 September 2020].
- 2.Sharpe RE, Kuszyk BS, Mossa-Basha M; RSNA COVID-19 Task Force. Special report of the RSNA task force: the short and long term financial impact of COVID-19 pandemic on private radiology practices. Radiology 2020:202517. doi: 10.1148/radiol.2020202517. [DOI] [PMC free article] [PubMed] [Google Scholar]
- 3.Naidich JJ, Boltyenkov A, Wang JJ, Chusid J, Hughes D, Sanelli PC. Impact of the coronavirus disease 2019 (COVID-19) pandemic on imaging case volumes. J Am Coll Radiol 2020; 17:865–872. [DOI] [PMC free article] [PubMed] [Google Scholar]
- 4.Freudenberg LS, Paez D, Giammarile F, Cerci J, Modiselle M, Pascual TNB, et al. Global Impact of COVID-19 on nuclear medicine departments: an International Survey in April 2020. J Nucl Med 2020; 61:1278–1283. [DOI] [PMC free article] [PubMed] [Google Scholar]
- 5.Annunziata S, Bauckneht M, Albano D, Argiroffi G, Calabrò D, Abenavoli E, et al. ; Young Committee of the Italian Association of Nuclear Medicine (AIMN). Impact of the COVID-19 pandemic in nuclear medicine departments: preliminary report of the first international survey. Eur J Nucl Med Mol Imaging 2020; 47:2090–2099. [DOI] [PMC free article] [PubMed] [Google Scholar]
- 6.Parikh KD, Ramaiya NH, Kikano EG, Tirumani SH, Pandya H, Stovicek B, et al. COVID-19 Pandemic Impact on Decreased Imaging Utilization: A Single Institutional Experience. Acad Radiol 2020; 27:1204–1213. [DOI] [PMC free article] [PubMed] [Google Scholar]
- 7.Evidence-based indications for the use of PET-CT in the UK 2016. https://www.rcr.ac.uk/system/files/publication/field_publication_files/bfcr163_pet-ct.pdf. [Accessed 1 September 2020].
- 8.Clinical Commissioning Policy Statement NHS England. 2016. BFCR(16)3. https://www.england.nhs.uk/commissioning/spec-services/npc-crg/group-b/specialised-cancer-diagnostics/. [Accessed 1 September 2020].
- 9.Stevens S. IMPORTANT- for action- third phase of the NHS response to Covid-19. Simon Steven’s letter July 31st 2020. https://www.england.nhs.uk/coronavirus/wp-content/uploads/sites/52/2020/07/Phase-3-letter-July-31-2020.pdf. [Accessed 1 September 2020].
- 10.Huang HL, Gnanasegaran G, Fanti S, Hacker M, Sathekge S, Bom HS, et al. Nuclear medicine services after COVID-19: gearing up back to normality. EJNMMI 2020; 47:248–253. [DOI] [PMC free article] [PubMed] [Google Scholar]
- 11.https://www.bbc.co.uk/news/uk-54212654. [Accessed October 20, 2020].
- 12.Dizdaravic S, Weston C, Oxley C, Buscombe J. Headlines for COVID-19 BNMS survey [part 1]. 2020. https://www.bnms.org.uk/news/522112/BNMS-COVID-19-Survey---Results.htm. [Accessed 1 September 2020].
- 13.UK Government. Covid-19 guidance. 2020. http://www.gov.uk/government collections/coronavirus-covid-19-list-of-guidance. [Accessed 1 September 2020].
- 14.Paez D, Gnanasegran G, Fanti S, Bomanji J, Hacker M, Sathekge M, et al. COVID-19 pandemic: guidance for nuclear medicine departments. EJNMMI 2020; 47:1615–1619. [DOI] [PMC free article] [PubMed] [Google Scholar]
- 15.Buscombe JR, Notghi A, Croasdale J, Pandit M, O'Brien J, Graham R, et al. Covid-19: guidance of infection prevention and control in nuclear medicine. NMC 2020; 41:499–504. [DOI] [PubMed] [Google Scholar]
- 16.Fruedenberg LS, Dittmer U, Hermann K. Auswikungen von COVID 19 auf die Nuclearmedizin in Deutchland Osterreich und der Schweiz: eine internationale Umfrage im April 2020. Nuclearmedizin 2020; 59:294–299. [DOI] [PubMed] [Google Scholar]
- 17.Maurea S, Mainolfi C, Bombace C, Annunziata A, Attanasio L, Petretta M, et al. FDG PET CT imaging during the COVID 19 emergency: a southern Italian perspective. Euro J Nucl Med Mol Imaging 2020; 47:2691–2697. [DOI] [PMC free article] [PubMed] [Google Scholar]
- 18.Wilkinson E. How cancer services are fighting to counter covid-19’s impact. BMJ 2020; 370:m2747. [DOI] [PubMed] [Google Scholar]
- 19.CRUK. https://scienceblog.cancerresearchuk.org/2020/03/19/coronavirus-and-cancer-latest-updates. [Last Accessed October 15, 2020].
- 20.Jones D, Neal RD, Duffy SRG, Scott SE, Whitaker KL, Brain K. Impact of the COVID-19 pandemic on the symptomatic diagnosis of cancer: the view from primary care. Lancet Oncol 2020; 21:748–750. [DOI] [PMC free article] [PubMed] [Google Scholar]
- 21.The Lancet Gatroenterology & Hepatology. Resuming bowel cancer screening post COVID-19. Lancet Gatroenterol Heaptol 2020; 1253:30200–30204. [DOI] [PMC free article] [PubMed] [Google Scholar]
- 22.Richards M, Carter P, Ebert BL, Mossialos E. The impact of COVID-19 pandemic on cancer. Nat Cancer 2020; 1:565–567. [DOI] [PMC free article] [PubMed] [Google Scholar]
- 23.Clinical guide for the management of non-coronavirus patients requiring acute treatment: Cancer publ. approval refer 001559. https://www.england.nhs.uk/coronavirus/secondary-care/other-resources/specialty-guides/#cancer. [Accessed 1September 2020].
- 24.D’Dowd A. Covid-19 is magnifying health care inequalities, says health regulator. BMJ 2020; 371:M4035. [DOI] [PubMed] [Google Scholar]


