

Abstract
Single-particle cryo-electron microscopy (cryo-EM) has become a powerful technique in the field of structural biology. However, the inability to reliably produce pure, homogeneous membrane protein samples significantly hampers the progress of their structural determination. Here, we develop a bottom-up iterative method, designated “Build and Retrieve” (BaR), that allows us to identify and solve cryo-EM structures of a variety of inner and outer membrane proteins, including membrane protein complexes of different sizes and dimensions, from a heterogeneous, impure protein sample. We also employ the BaR methodology to elucidate structural information from E. coli K12 crude membrane and raw lysate. Our work demonstrates that it is possible to solve high-resolution structures of a number of relatively small (< 100 kDa) and less abundant (< 10%) unidentified membrane proteins within a single, heterogeneous sample. Importantly, these results highlight the potential of cryo-EM for systems structural proteomics.
Recent developments in the technology of single-particle cryo-electron microscopy (cryo-EM) have opened up a new avenue for three-dimensional structural determination of biomacromolecules at near-atomic resolution1, attaining detailed information for previously unknown structures as well as mechanisms of membrane proteins and other critical biomacromolecules that are important targets for drug discovery. Owing to rapid technological advancements it is now possible to obtain structural information of samples below 100 kDa using this technique2. Additionally, cryo-EM now has the capability of elucidating various structures of different conformational states of a single biomacromolecular sample at high resolution3,4. However, historically, structural determination requires homogenous and pure samples. Sample heterogeneity often hampers the progress of drug design and development, especially those that target membrane proteins and complexes.
Cryo-EM is an imaging technique that uses a state-of-the-art direct-electron detector to collect single-particle images at random orientations in a frozen-hydrated state. We rationalized that as long as we can obtain a sufficiency of single-particle images, we should be able to solve structures of relatively large biomacromolecules (> 100 kDa) to a near atomic resolution. Therefore, a pure and homogeneous sample may not be a prerequisite for this technique. To realize this approach, we have developed an iterative methodology, termed “Build and Retrieve” (BaR), to process heterogeneous cryo-EM sample data sets (Extended Data Figure 1). We perform in silico purification and sorting of images from a large heterogeneous data set that contains several different classes of biomacromolecules. We then isolate and separate these classes. For each class of images, rigorous 2D/3D classifications along with ab initio reconstructions are used to “build” initial 3D maps. The particles are then “retrieved”, where the initial maps are used to increase particle counts. These procedures are repeated to improve the quality of each particle set until the structure of the biomolecule is determined.
We are particularly interested in elucidating structural information of membrane proteins, where sufficient protein expression and purification is often difficult to achieve. To highlight the potential of the BaR method in handling impure, heterogeneous membrane protein samples, we selected a sample of the Burkholderia pseudomallei HpnN (BpHpnN) inner membrane transporter. The expression level of this membrane protein was not high enough to obtain pure, homogeneous BpHpnN protein after purification (Extended Data Figure 2). We reconstituted the impure protein sample into lipidic nanodiscs and collected single-particle images using cryo-EM. BaR enabled us to identify and solve structures of the E. coli cytochrome bo3 complex, the BpHpnN transporter, the E. coli OmpF porin channel and the E. coli succinate dehydrogenase complex to near atomic resolutions.
To demonstrate the potential of using BaR to facilitate elucidation of the membrane proteome and systems structural proteomics, we turned to the E. coli K12 crude cell membrane and raw cell lysate. We collected single-particle images of these two samples. Again, BaR was able to identify and solve structures of multiple proteins to near atomic resolutions.
Results
“Build and Retrieve” (BaR) methodology
BaR is a bottom-up systems structural proteomic approach to identify and obtain near atomic structural models of multiple proteins from raw samples, including crude membranes and cell lysates (Figure 1). Here, we demonstrate that it is possible to simultaneously and rapidly determine several protein structures from a single, heterogeneous sample.
Fig. 1. Build and Retrieve (BaR) methodology.
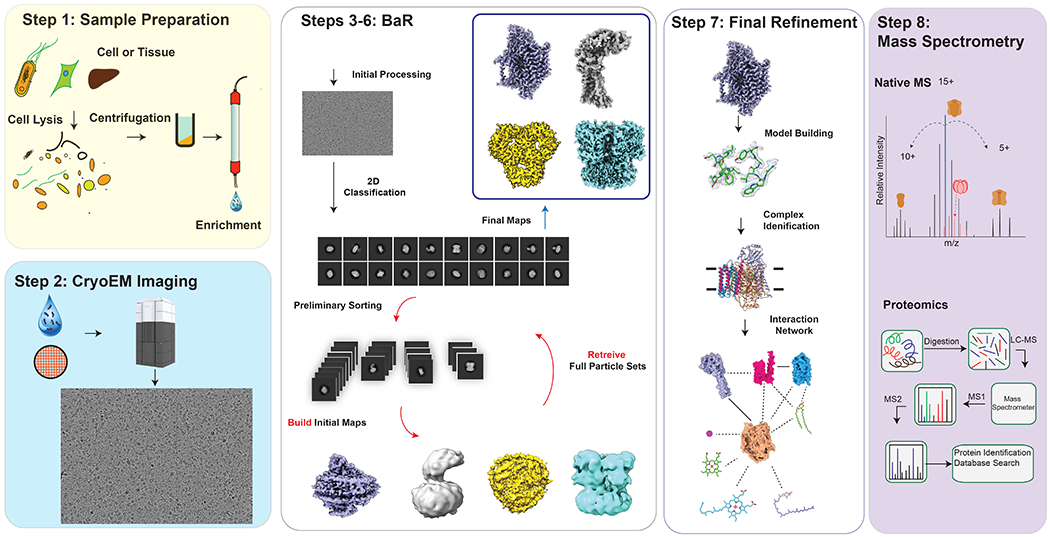
Protein samples are enriched by size extrusion chromatography. Cryo-EM imaging and data processing yield near atomic resolution cryo-EM maps. The data processing procedures of BaR involve extensive 2D and 3D classifications to “build” initial maps and “retrieve” full particle data sets. The near atomic resolution cryo-EM maps generated from BaR are used to reveal the identities of proteins based on the program phenix.sequence_from_map5. Mass spectrometry was used to confirm the presence of these proteins.
Step 1: Sample preparation.
For raw cell membranes, we solubilize the membranes using detergent and reconstitute the solubilized membrane proteins into lipidic nanodiscs from endogenous sources. We then separate and enrich the protein-nanodisc complexes from empty nanodiscs using size exclusion chromatography. For raw cell lysates, we use size exclusion chromatography to enrich protein samples from endogenous sources.
Step 2: Cryo-EM imaging and processing.
We perform data collection and initial imaging processing under standard cryo-EM protocols that are described in the Online Methods. We apply a combination of blob picker followed by 2D classification using a subset of micrographs to generate initial particle templates. We then employ template picker to pick the entire dataset, giving rise to the full particle set.
Step 3: Initial 2D classification.
We perform in silico purification of the full particle set using several rounds of 2D classification. Owing to the heterogeneous nature of the sample, it is not possible to clearly separate particle classes based on results from 2D classification. Therefore, all classes with distinct structural features are selected for continued processing.
Step 4: Preliminary 3D classification.
Next, we sort the full particle set using 2D and 3D ab initio classifications to divide the complete particle set into subsets with similar structural features. Different starting 3D classes for ab initio classification are trialed based on the number of resulting converged classes. After this initial 3D classification, different subsets are treated as separate entities for Step 5.
Step 5: “Build” initial maps.
The subsets of selected classes from step 4 are rigorously cleaned and re-sorted through several rounds of 2D classification. Only classes showing clear high-resolution features are selected. A combination of ab initio and heterogeneous 3D classification are used to clean the resulting particles. Initial maps are solved using non-uniform refinement with C1 symmetry.
Step 6: “Retrieve” full particle sets.
Owing to the rigorous cleaning procedures performed in Step 5, all reconstructions suffer from incomplete views. To increase particle counts and obtain more views for each biomacromolecule, the “built” maps from Step 5 are used as templates for 3D heterogeneous classification of the 2D cleaned particles from Step 3, where each subset is treated separately for final structural refinement. This procedure is vital in “retrieving” enough information and particles for near atomic resolution reconstruction.
Step 7: Final refinement.
Newly retrieved subsets are then cleaned using multiple rounds of 2D and 3D classifications. Non-uniform refinement is used to build the final maps. Symmetry can be applied at this step to enhance the resolution. These near atomic resolution cryo-EM maps can now be used to determine the identities of biomacromolecules using phenix.sequence_from_map implemented in the PHENIX suite5. The protein models are then built using Coot6 and refined using PHENIX5.
Step 8: Mass spectrometry.
Mass spectrometry, such as native mass spectrometry (nMS) and proteomics, are used to confirm the presence of these proteins.
Heterogeneous membrane protein sample
We cloned the full-length BpHpnN inner membrane transporter whose main function is to shuttle hopanoid lipids to the outer membrane of the bacterium for cell wall remodeling7,8. As mentioned earlier, the expression level of this protein was not high enough in order to obtain pure, homogeneous BpHpnN sample after protein purification (Extended Data Figure 2). Mass spectrometry depicted the presence of at least 10 different proteins with various dimensions and molecular weights (Extended Data Figure 2). We reconstituted this heterogeneous membrane protein sample into lipidic nanodiscs and collected single-particle images using cryo-EM. We then processed this heterogeneous sample data set using the BaR methodology following the steps described above. 2D classification of the single-particle images indicated that, besides BpHpnN, there are at least three additional unidentified proteins that coexist in the single nanodisc sample (Extended Data Figure 3). Several iterative rounds of 2D classifications allowed us to sort the images into different protein classes (Extended Data Figure 1). Finally, we were able to determine cryo-EM structures of E. coli cytochrome bo3, BpHpnN, E. coli OmpF and E. coli succinate dehydrogenase (Figure 2 and Supplementary Table 1).
Fig. 2. Cryo-EM structures of proteins from the heterogeneous BpHpnN membrane protein sample.
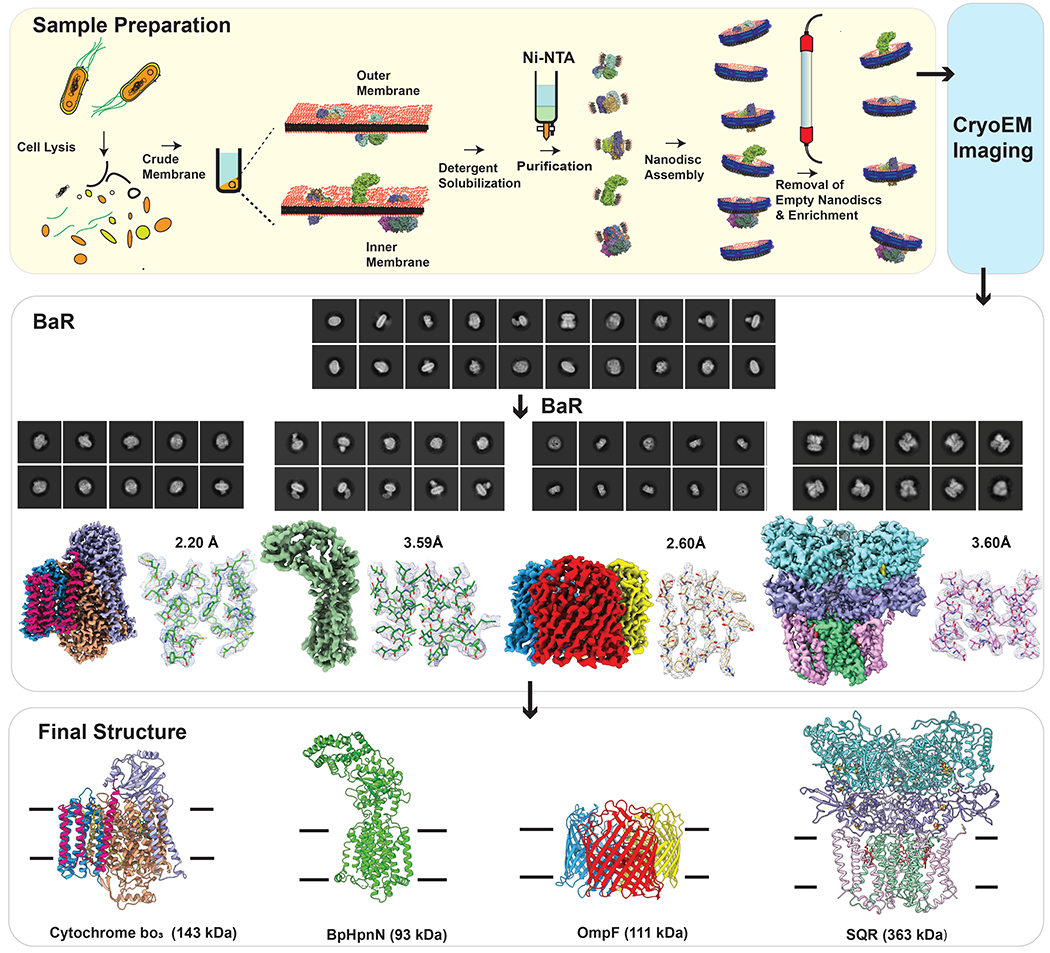
The BaR methodology was used to constructed near atomic resolution cryo-EM density maps, which allowed for the identification of the cytochrome bo3 oxidase complex, the BpHpnN hopanoid transporter, the OmpF porin channel and the SQR complex. The final structures of these membrane proteins were solved to resolutions of 2.20 Å, 3.59 Å, 2.54 Å and 3.60 Å, respectively.
Structure of E. coli cytochrome bo3.
The most abundant single-particle protein molecule in our sample is a membrane protein complex. A total of 334,222 projections were obtained in this protein class. Using BaR, we identified this membrane protein complex as cytochrome bo3. We then resolved the complete, assembled structure of this complex embedded in lipidic nanodiscs to a resolution of 2.20 Å (Figure 2, Extended Data Figure 4 and Supplementary Table 1). At this high resolution, we were able to identify this membrane protein complex using the sequence_from_map program implemented in PHENIX5. The existence of this membrane protein complex was also confirmed by nMS and proteomics (Extended Data Figure 2). Cytochrome bo3 is a member of the large heme-copper oxidoreductase family9. In E. coli, cytochrome bo3 is an abundant terminal oxidase that catalyzes the oxidation of ubiquinol to ubiquinone and reduction of molecular oxygen to water. Previously, the incomplete x-ray structure of cytochrome bo3 was determined to 3.5 Å resolution, with the bound quinone and approximately 25% of this oxidase omitted10.
The cytochrome bo3 oxidase complex contains 1,291 amino acids divided between four different subunits (subunits I-IV). We built a de novo model of this membrane protein complex comprising of 1207 residues. The oxidase consists of 23 transmembrane helices (TMs) with subunits I, II, III and IV possessing 13, two, five and three TMs, respectively.
The high-quality density of our cryo-EM map unambiguously depicts the locations of bound ubiquinol, heme b, heme o3 and CuB within the cytochrome bo3 complex. Interestingly, our cryo-EM data indicate that only one ubiquinol, corresponding to the high affinity QH binding site, is observed to bind in cytochrome bo3.
To date, it has not been established definitively whether this oxidase contains one or two ubiquinol binding sites11,12. Our cryo-EM structure of cytochrome bo3 offers the complete structural information of this assembled complex and strongly indicates that there is only one binding site for ubiquinol. It also provides the first glimpse of the exact location of ubiquinol, which coincides with the proposed QH site12.
Structure of B. pseudomallei HpnN.
The second most abundant protein in our cryo-EM grid is an inner membrane protein. We collected a total of 63,910 single-particle projections for this class of images. The BaR protocol allowed us to identify that this membrane protein as the BpHpnN hopanoid transporter. We determined the first structural information of this membrane protein embedded in lipidic nanodiscs to a resolution of 3.59 Å (Figure 2, Extended Data Figure 5 and Supplementary Table 1). The identity of this membrane transporter was confirmed by comparing our cryo-EM images with the previously determined x-ray structure of B. multivorans HpnN (BvHpnN)13, where these two membrane proteins share 85% protein sequence identity. The presence of this protein in our sample was then confirmed by nMS and proteomics (Extended Data Figure 2). Residues 1-854 are included in the final structure.
B. pseudomallei is classified as a category B bioterrorism agent by the Centers for Disease Control and Prevention (CDC)14. Several countries, including the United States and the former Soviet Union, have identified B. pseudomallei as a potential agent for biological warfare15–17. As B. pseudomallei is intrinsically resistant to a broad range of clinically important antibiotics18, this infection is difficult to treat and often results in high morbidity and mortality.
In Burkholderia spp., hopanoids, which are pentacyclic triterpenoid lipids, play a predominant role in supporting membrane stability and barrier function19,20. Data suggests that the family of the hopanoid biosynthesis-associated resistance-nodulation-cell division (HpnN)8,13 transporters is responsible for shuttling hopanoids from the cytoplasmic membrane to remodel the outer membrane of Burkholderia pathogens, providing a protective barrier against a variety of antimicrobial agents.
Our cryo-EM structure indicates that the BpHpnN hopanoid transporter consists of 12 transmembrane helices (TM1-TM12) and a large periplasmic domain that can be divided into four subdomains (PD1-PD4). The architecture of BpHpnN resembles that of BvHpnN13. TMs 2, 4 and 11 of BpHpnN form a cavity that constitutes the entrance of a channel spanning the outer leaflet of the inner membrane up to the periplasmic domain. This channel is lined with conserved amino acids that have been found to be essential for the function of the BvHpnN transporter.
Structure of E. coli OmpF.
Based on BaR, the third most highly populated particle images belong to an outer membrane protein. We obtained 43,793 single-particle counts for this protein class in our cryo-EM data set. Using the sequence_from_map program implemented in the PHENIX suite5, we were able to identify this outer membrane protein as the E. coli OmpF porin channel. We solved the cryo-EM structure of this membrane protein to a resolution of 2.54 Å (Figure 2, Extended Data Figure 6 and Supplementary Table 1). The existence of this porin in our nanodisc sample was also verified by nMS and proteomics (Extended Data Figure 2).
E. coli OmpF is one of the most abundant porin proteins, with > 105 copies located at the outer membrane of each bacterial cell21. OmpF is a trimeric porin channel responsible for the passive transport of small hydrophilic molecules across the outer membrane barrier of E. coli through aqueous channels. Each molecule of OmpF contains 362 amino acids and its secondary structure is composed almost entirely of β-sheets. Of the 362 amino acids, our final cryo-EM structure includes 340 residues of this outer membrane porin channel.
The structure indicates that each OmpF protomer within the trimer is folded into a 16-stranded anti-parallel, cylindrical β-barrel. This cryo-EM structure is very similar to that of the 2.4 Å structure previously determined by x-ray crystallography22. Each protomer of OmpF forms an aqueous pore at the interior of the 16-stranded β-barrel. A selectivity filter is formed at a position approximately half the height of the OmpF β-barrel. This filter is created by a long loop (L3), which connects strands β5 and β6 and is bent towards the inside of the β-barrel. The L3 loop generates a constriction in the middle of the water channel that only allows smaller sized molecules to pass through.
Structure of E. coli succinate-coenzyme Q reductase.
The fourth protein in our cryo-EM sample is the E. coli succinate-coenzyme Q reductase (SQR) complex. We extracted 12,706 single-particle images for this membrane protein complex and verified its identity using BaR. We then solved the cryo-EM structure of membrane protein complex to a resolution of 3.60 Å (Figure 2, Extended Data Figure 7 and Supplementary Table 1). We initially identified the complex as SQR based on the structural features that this biomacromolecule consists of a threefold symmetry, 18 transmembrane helices and the presence of three hemes within the transmembrane region. The existence of this complex was also validated by nMS and proteomics (Extended Data Figure 2).
E. coli SQR is also known as succinate dehydrogenase (SDH), which is homologous to the mitochondrial respiratory Complex II. SQR is the only enzyme that participates in both the citric acid cycle and the respiratory electron transfer chain. The structure of E. coli SQR has been previously determined by x-ray crystallography23. Both SQR and cytochrome bo3 are critical components of the electron transfer respiratory chain. SQR catalyzes the reduction of ubiquinone to ubiquinol and oxidation of succinate to fumarate, whereas cytochrome bo3 gives rise to the oxidation of ubiquinol to ubiquinone and reduction of O2 to water.
SQR is packed as a trimer. Each monomer is composed of four distinct subunits. The hydrophilic SdhA and SdhB subunits form the cytoplasmic domain and the hydrophobic SdhC and SdhD subunits create the transmembrane region of the complex. Of the 1070 amino acids per monomer of the dehydrogenase, we included 928 residues in our final model. The locations of bound flavin adenine dinucleotide (FAD), [2Fe-2S], [4Fe-4S], [3Fe-4S] and heme b are clearly identified based on the cryo-EM densities. These binding site locations are in good agreement with those from the x-ray structure23.
E. coli K12 crude cell membrane
To validate and demonstrate the utility of the BaR approach for studying membrane proteomes, we chose to analyze the E. coli K12 membrane. After solubilizing the native membrane by detergent, we reconstituted the membrane proteins into lipidic nanodiscs. We then separated the protein-nanodisc complexes from empty nanodiscs and enriched for protein complexes ranging from 100 kDa to 800 kDa using size exclusion chromatography. We selected the top two most abundant particles for structural determinations (Supplementary Figure 1). We found that these particles belong to the OmpC outer membrane osmoporin channel and the SQR membrane protein complex (Figure 3 and Supplementary Table 2).
Fig. 3. Cryo-EM structures of proteins enriched directly from E. coli crude cell membrane.
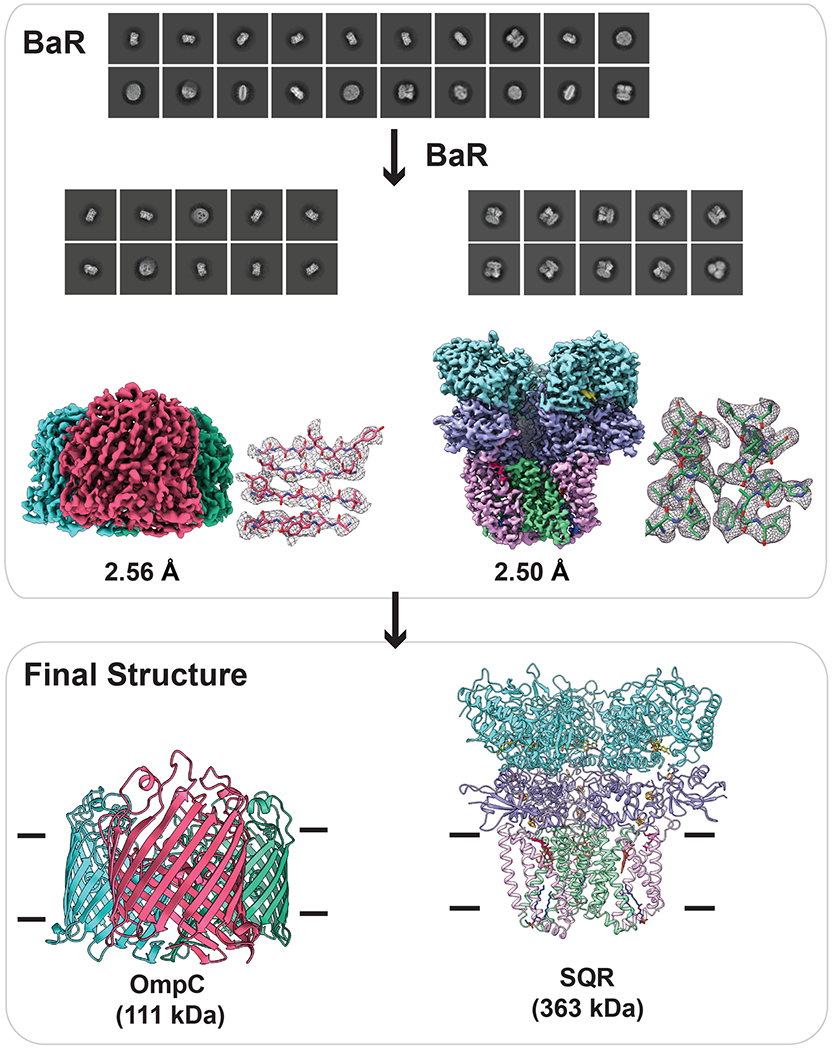
The two cryo-EM density maps were constructed to 2.56-Å and 2.50-Å resolutions, which allowed for the identification of the OmpC porin channel and the SQR complex, respectively.
Structure of OmpC.
The most abundant membrane protein detected had a total count of 68,628 images. The BaR methodology indicated that this protein is the OmpC outer membrane osmoporin channel, although proteomics revealed the protein sequence coverage was only 3% (Supplementary Table 3). This is not surprising as the OmpC membrane protein is not quite accessible to trypsin digestion. We refined the structure of this membrane protein to a resolution of 2.56 Å (Figure 3, Supplementary Figure 2 and Supplementary Table 2). This cryo-EM structure is in good agreement with the previously determined x-ray structure of OmpC24. OmpC shares 60% identity with OmpF and assembles as a trimer. Each molecule of OmpC is folded into a 16-stranded anti-parallel, cylindrical β-barrel. The three OmpC molecules tightly interact with each other to create a three β-barrel porin. Of the 367 amino acids from each molecule of OmpC, we included 346 residues in the final structural model.
Structure of SQR.
We obtained a total number of 38,471 projections for the second most abundant single-particle protein molecule. Using the BaR procedures, we identified that this class of single particles belongs to the SQR membrane protein complex. We then resolved the structure of this complex embedded in lipidic nanodiscs to a resolution of 2.50 Å (Figure 3, Supplementary Figure 3 and Supplementary Table 2). Its presence was also confirmed by proteomics (Supplementary Table 3). The cryo-EM structure of SQR is nearly identical to that resolved from the heterogeneous membrane protein sample as described above. Given the higher resolution of this structure, we were able to observe additional structural features, including the bound ubiquinol located at the SdhA subunit of the cytoplasmic domain of the SQR complex.
E. coli K12 raw cell lysate
To demonstrate that our BaR platform can also be applied to study soluble protein samples, we enriched proteins from E. coli K12 raw lysate and selected the size of these cytoplasmic or periplasmic proteins ranging from 80 kDa to 800 kDa using size exclusion chromatography. We found that the two most abundant proteins in this portion of the lysate are the KatG catalase-peroxidase and glutamate decarboxylase GadB (Figure 4, Supplementary Figure 4 and Supplementary Table 4).
Fig. 4. Cryo-EM structures of proteins enriched directly from E. coli raw cell lysate.
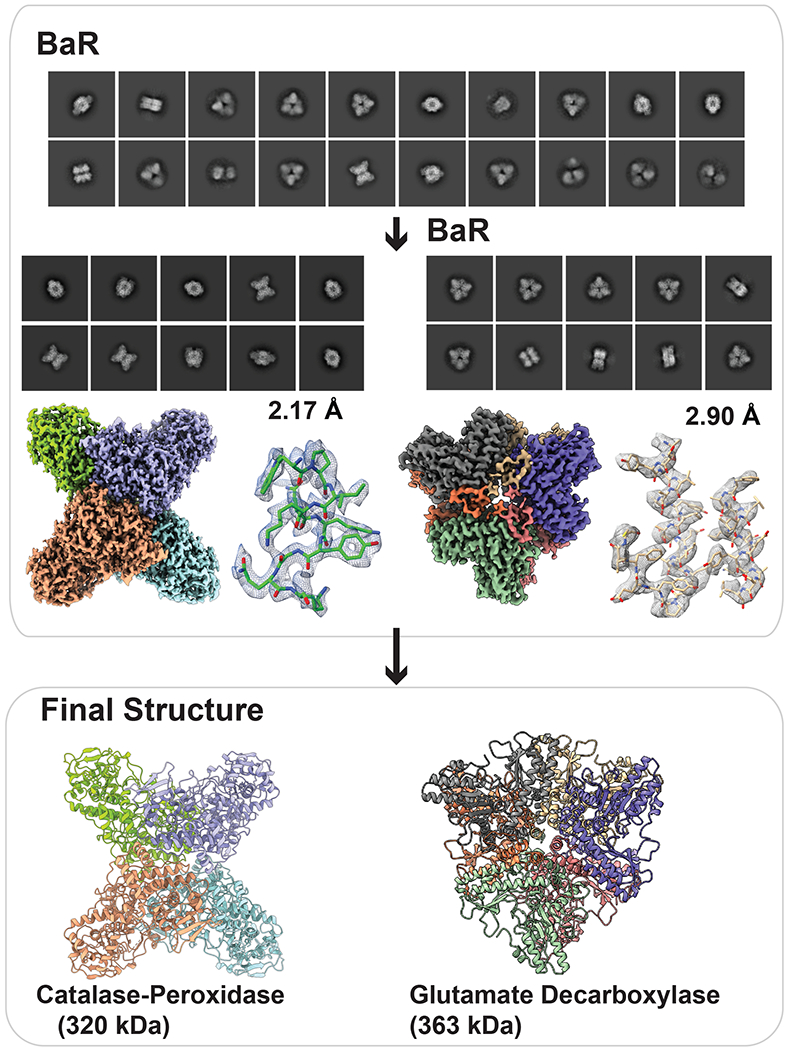
The two cryo-EM density maps were constructed to 2.17-Å and 2.90-Å resolutions, which allowed for the identification of the enzymes KatG catalase-peroxidase and GadB glutamate decarboxylase, respectively.
Structure of the catalase-peroxidase KatG.
We obtained 135,241 single-particle counts for the full-length KatG protein and solved its cryo-EM structure to a resolution of 2.17 Å using the BaR platform (Figure 4, Supplementary Figure 5 and Supplementary Table 4). The existence of this catalase-peroxidase was also validated by proteomics (Supplementary Table 5). KatG is a 726-amino acid protein capable of protecting cellular components by breaking down hydrogen peroxide to prevent its potentially damaging effect. Thus far, the only available structural information of E. coli KatG is the crystal structure of the 309-residue truncated protein consisting of the C-terminal domain25. Our cryo-EM structure indeed provides the first structural information of the full-length E. coli KatG enzyme, which contains both the N- and C-terminal domains.
Structure of the glutamate decarboxylase GadB.
We obtained a total number of 30,422 particles for the second most populated soluble protein. These images belong to the enzyme GadB. GadB is a glutamate decarboxylase that is responsible for catalyzing the α-decarboxylation of L-glutamate to γ-aminobutyrate (GABA). Similar to KatG, we solved the cryo-EM structure of this 466-residue enzyme to a resolution of 2.90 Å using BaR (Figure 4, Supplementary Figure 6 and Supplementary Table 4) and confirmed its existence using proteomics (Supplementary Table 5). The structure indicates that GadB is packed as a hexamer, which is in good agreement with the previously determined crystal structure of this decarboxylase26. Of the 466 residues per molecule of this protein, we included 427 amino acids in our final model.
Discussion
With significant technological breakthroughs in the field of single-particle cryo-EM, it is tempting to claim that obtaining high-quality crystals may no longer be a prerequisite for solving near atomic resolution structures of biomacromolecules. This is particularly important in the area of membrane protein structural biology, where sample preparation and crystallization tend to be more challenging and time consuming. This considerably hinders the progress of structure-guided drug design for novel therapeutics. Our work indicates that it is possible to obtain high-resolution structural information of membrane proteins from a heterogeneous and impure sample. This is the first report demonstrating the feasibility of using cryo-EM to overcome sample homogeneity and purity problems and to solve structures of a mixture of membrane proteins to near atomic resolution.
We believe that the BaR methodology allows us to identify a variety of proteins within a mixture of unknown protein sample. We were able to determine structures of two inner membrane protein complexes, one inner membrane transporter and one outer membrane porin channel from a single cryo-EM sample. Both inner and outer membrane proteins are essential components of Gram-negative bacteria and mitochondria. They often participate in important biological processes, such as mediating bacterial drug resistance and facilitating electron transport in the mitochondrial respiratory chain. Our data strongly suggest that there is a high probability that we can simultaneously determine structures of various membrane bound proteins, either alone or in the form of a complex. Since many membrane proteins are engaged in forming complex machineries that anchor both the inner and outer membranes of Gram-negative bacteria or eukaryotic mitochondria, cryo-EM may allow for the structural study of membrane protein complexes that span these native, intact cell membranes. This is in line with the recent development of nMS27, where the technology can be used to study the membrane proteome and elucidate how membrane proteins contact each other within the inner and outer membrane layers. Recently, a technique of cryoID has been developed that allows for the identification of proteins in the ab initio cryo-EM maps28. We believe that BaR and cryoID can complement each other, as both BaR and cryoID focus on identifying and solving structures of biomacromolecules from impure, heterogeneous samples. CryoID analyzes high-resolution cryo-EM maps to identify proteins. This is a powerful technique, especially for handling relatively large protein complexes (~750 kDa)28. To address the challenge of generating high-resolution maps from a heterogeneous sample of membrane proteins, we developed the BaR platform to deconvolute particle images to produce near atomic resolution cryo-EM maps for individual proteins within a heterogeneous impure sample. We demonstrated that BaR can be used to separate smaller membrane proteins and unfold views that are difficult to differentiate, including those images oriented perpendicular to the lipid bilayer. As indicated in this study, it appears that BaR is capable of elucidating relatively small sized membrane proteins (~100 kDa) as well. Theoretically, BaR and cryoID can be incorporated into the pipeline for systems structural proteomics, where BaR enables the generation of high-resolution cryo-EM maps and cryoID allows for biomacromolecular identification. At low resolution, BaR may not be helpful to reveal the identity of unknown biomacromolecules. In this case, the identification of these biomolecules may need to rely on nMS and proteomics.
Coupled with nMS, the techniques of cryo-EM may allow us to obtain important structural information, possibly at the atomic level, of how various membrane proteins interact to assemble as a functional complex or form an enzymatic chain in native membranes. We were able to determine the structures of cytochrome bo3 and SQR, both part of the same electron transfer respiratory chain, simultaneously using a single sample grid, suggesting that it is feasible to acquire high-resolution structural information of the membrane proteome within a large complex network system using the BaR approach. We also identified important ligands and cofactors for these membrane proteins, such as ubiquinol, FAD, iron-sulfur cluster and heme.
As we identified and determined structures of several membrane proteins without prior knowledge of the identities of these proteins in our sample, this approach conceptually is compatible with the idea of systems proteomics. We were also able to solve structures of relatively small sized membrane proteins (e.g. the molecular weights of BpHpnN and OmpF are 93 kDa and 37 kDa, respectively) with less than 10% abundance in a heterogeneous sample (Extended Data Figure 2), making the BaR methodology distinct from other published works that have been used to determine abundant and large size biomacromolecular complexes, such as fatty acid synthase29, the ribosome30 and the proteasome31. Our studies will help advance a new era of systems structural biology capable of elucidating the cell membrane proteome at atomic resolution.
Online Methods
Cloning, expression and purification of B. pseudomallei HpnN
Briefly, the full-length BpHpnN membrane protein containing a 6xHis tag at the C-terminus was overproduced in E. coli BL21(DE3)ΔacrB cells, which harbors a deletion in the chromosomal acrB gene, generating pET15bΩhpnN. Cells were grown in 6 l of LB medium with 100 μg/ml ampicillin at 37°C. When the OD600 nm reached 0.5, the culture was treated with 0.2 mM isopropyl-β-D-thiogalactopyranoside (IPTG) to induce hpnN expression, and cells were harvested within 4 h. The collected bacteria were resuspended in low salt buffer containing 100 mM sodium phosphate (pH 7.2), 10 % glycerol, 1 mM ethylenediaminetetraacetic acid (EDTA) and 1 mM phenylmethylsulfonyl fluoride (PMSF), and then disrupted with a French pressure cell. The membrane fraction was collected and washed twice with high salt buffer containing 20 mM sodium phosphate (pH 7.2), 2 M KCl, 10 % glycerol, 1 mM EDTA and 1 mM PMSF, and once with final buffer containing 20 mM HEPES-NaOH buffer (pH 7.5) and 1 mM PMSF as described previously32. The membrane protein was then solubilized in 2% (w/v) n-dodecyl-β-D-maltoside (DDM). Insoluble material was removed by ultracentrifugation at 100,000 x g. The extracted protein was then purified using a Ni2+-affinity column. The purified protein was concentrated to 10 mg/ml in a buffer containing 20 mM Tris-HCl (pH 7.5), 100 mM NaCl and 0.05% DDM.
Nanodisc preparation
To assemble BpHpnN into nanodiscs, a mixture containing 10 μM BpHpnN, 30 μM MSP (1E3D1) and 900 μM E. coli total extract lipid was incubated for 15 minutes at room temperature. After, 0.8 mg/ml pre-washed Bio-beads (Bio-Rad) was added. The resultant mixture was incubated for 1 hour on ice followed by overnight incubation at 4°C. The protein-nanodisc solution was filtered through 0.22 μm nitrocellulose-filter tubes to remove the Bio-beads. A Superose 6 column (GE Healthcare) equilibrated with 20 mM Tris-HCl, pH 7.5, and 100 mM NaCl was then used to separate free nanodiscs from the BpHpnN-nanodisc complex. Fractions corresponding to the size of the monomeric BpHpnN-nanodisc complex were collected for cryo-EM study.
E. coli K12 crude cell membrane
E. coli K12 cells (strain BW25113) (Yale CGSC) were grown in 1 l of LB medium at 37°C and harvested when the OD600 nm reached 1.2. The collected cells were resuspended in buffer containing 100 mM sodium phosphate (pH 7.2) and 10 % glycerol, and disrupted with a French pressure cell. The membrane fraction was collected, resuspended in buffer containing 20 mM Tris-HCl (pH 7.5) and 100 mM NaCl, and solubilized in 1% (w/v) DDM. Insoluble material was removed by ultracentrifugation at 100,000 x g. The extracted cell membrane contained a variety of unknown membrane proteins. The procedures for assembling these membrane proteins into nanodiscs were the same as those for the BpHpnN sample as described above. The processes of separating the protein-nanodisc complexes from empty nanodiscs and enriching these protein complexes were done using a Superose 6 column (GE Healthcare) equilibrated with 20 mM Tris-HCl, pH 7.5, and 100 mM NaCl.
E. coli K12 raw cell lysate
E. coli K12 cells (strain BW25113) (Yale CGSC) were grown in 1 l of LB medium at 37°C and harvested when the OD600 nm reached 1.2. The collected cells were resuspended in buffer containing 20 mM Tris-HCl (pH 7.5) and 100 mM NaCl, and disrupted with a French pressure cell. Insoluble material from the cell lysate was removed by ultracentrifugation at 100,000 x g. The extracted cell lysate, containing a variety of unknown periplasmic and cytoplasmic proteins, was enriched using a Superose 6 column (GE Healthcare) equilibrated with 20 mM Tris-HCl, pH 7.5, and 100 mM NaCl.
Electron microscopy sample preparation and data collection
The BpHpnN, E. coli K12 membrane and E. coli K12 cell lysate samples were concentrated to 0.7 mg/ml, 1 mg/ml and 1 mg/ml, respectively. These samples were applied to glow-discharged holey carbon grids (Quantifoil Cu R1.2/1.3, 300 mesh), blotted for 5 s, 7 s and 7 s, respectively, and then plunge-frozen in liquid ethane using a Vitrobot (Thermo Fisher). The grids were transferred into cartridges. A Titan Krios cryo-electron transmission microscope (Thermo Fisher) was used to collect cryo-EM images. The images were recorded at 1-2.5 μm defocus on a K3 direct electron detector (Gatan) with super-resolution mode at a physical pixel size of 1.08 Å/phys. pixel (super resolution 0.54 Å/pixel). For the BpHpnN sample, each micrograph was exposed for 3.2 s with 18.2 e−/sec/phys. pixel dose rate (total specimen dose, 50 e−/A2). 40 frames were captured per specimen area using Latitude (Gatan, Pleasanton, CA). A total of 13,093 images were recorded and processed. For the E. coli K12 cell membrane and cell lysate samples, 7,643 and 5,067 movies were collected over 42 frames (4.2 s exposure time; 11.97 e−/sec/phys. pixel dose rate; 40 e−/A2 total dose) in SerialEM33, respectively.
Data processing
The BpHpnN, E. coli K12 crude cell membrane and E. coli K12 raw cell lysate were processed separately using an identical protocol. Super-resolution image stacks were aligned and binned by 2 using MotionCor234 to give a final pixel size of 1.08 Å/pixel. CTFs were estimated using patch CTF in cryoSPARC35. After manual inspection to discard poor images and estimate particle size, the blob picker in cryoSPARC35 was used to select particles from subsets of micrographs. These particles were classified with one round of 2D classification and clear templates were selected for template picking in cryoSPARC35. Template picker was used to select initial particle sets. Several iterative rounds of 2D classifications were used to clean these particle sets with different circular masks to account for different particle sizes. Featureless classes were removed from each step, resulting in cleaned heterogeneous particle stacks for further processing.
From these cleaned heterogeneous particle sets, particles were classified and final maps were solved using an iterative method termed “Build and Retrieve” (BaR) processing (which is summarized in Extended Data Figure 1, Supplementary Figure 1 and Supplementary Figure 4). Briefly, ab initio methods were used to “build” initial 3D maps from the complete dataset and particles were then “retrieved” based on the maps. To build the initial maps, particles were separated using 2D classification paired with 3D ab initio and heterogeneous classifications. The combination of these techniques was used to divide the dataset into subsets with similar structural features. Each subset was then treated as an individual particle set, where several rounds of 2D classification followed by 3D ab initio reconstruction were used to improve the quality of each subset. Non-uniform refinement was applied to “build” the preliminary maps.
To increase particle counts, these initial maps were used to “retrieve” particles from the cleaned heterogeneous particle stack. 3D heterogeneous refinement using the ab initio maps, determined from the “build” phase of BaR, was applied to the cleaned heterogeneous particle sets. The new particle subsets were then cleaned using multiple rounds of 2D and 3D ab initio classifications. Non-uniform refinement using cryoSPARC35 with symmetry imposed was used to refine all symmetrical protein structures, while non-uniform refinement followed by local refinement with non-uniform sampling was used to refine those protein structures without a distinct symmetry. The maps were further processed using cryo-EM density modification36 in PHENIX5, which enhanced the quality of the maps.
The quality of the maps corresponding to all of these different proteins was excellent, enabling us to trace most of the Cα atoms in these protein molecules. The main-chain (Cα) of these proteins were manually traced using the program Coot6. The phenix.sequence_from_map program in PHENIX5 was then used to generate the best-fitting sequences. The identities of these proteins were revealed based on the protein sequences, and their presence was further confirmed by nMS and proteomics.
Model building and refinement
Model buildings of cytochrome bo3, BpHpnN, OmpF, SQR, OmpC, KatG and GadB were based on the cryo-EM maps generated from the BaR methodology. The subsequent model rebuilding processes were performed using Coot6. Structure refinements were done using the phenix.real_space_refine program37 from the PHENIX suite5. The final atomic models were evaluated using MolProbity38. The statistics associated with data collection, 3D reconstruction and model refinement are included in Supplementary Tables 1, 2 and 4.
Native mass spectrometry
Before MS analysis, the protein sample was buffer exchanged into 200 mM ammonium acetate pH 8.0 and 0.05% LDAO using a Biospin-6 (BioRad) column and introduced directly into the mass spectrometer using gold-coated capillary needles (prepared in-house). Data were collected on a Q-Exactive UHMR mass spectrometer (Thermo Fisher Scientific). The instrument parameters were as follows: capillary voltage 1.1 kV, S-lens RF 100%, quadrupole selection from 1,000 to 20,000 m/z range, collisional activation in the HCD cell 200 V, trapping gas pressure 7.5, temperature 200 °C, resolution of the instrument 12,500. The noise level was set at 3 rather than the default value of 4.64. No in-source dissociation was applied. Data were analyzed using Xcalibur 4.2 (Thermo Scientific) and UniDec39 software packages.
Protein identification by proteomics
For protein identification, tryptic peptides were obtained by either digesting the protein sample directly with trypsin overnight at 37°C, or the proteins were first separated on an SDS-PAGE gel and subsequently treated with trypsin overnight at 37°C40. Peptides were resuspended with 0.1% formic acid and separated by nano-flow reversed-phase liquid chromatography coupled to a Q Exactive Hybrid orbitrap mass spectrometer (Thermo Fisher Scientific). The peptides were trapped onto a C18 PepMap 100 pre-column (inner diameter 300 μm × 5 mm, 100 Å; Thermo Fisher Scientific) using solvent A (0.1% formic acid in water) and separated on an analytical column (75 μm i.d. packed in-house with ReproSil-Pur 120 C18-AQ, 1.9 μm, 120 Å, Dr Maisch GmbH) using a linear gradient from 7 to 30% of solvent B (0.1% formic acid in acetonitrile) for 30 min, at a flow rate of 200 nl/min. The raw data were acquired on the mass spectrometer in a data-dependent mode. Typical mass spectrometric conditions were: spray voltage of 2.1 kV, capillary temperature of 320°C. MS spectra were acquired in the orbitrap (m/z 350–2000) with a resolution of 70,000 and an automatic gain control (AGC) target at 3 × 10e6 with a maximum injection time of 50 ms. After the MS scans, the top 10 most intense ions were selected for HCD fragmentation at an AGC target of 50,000 with maximum injection time of 120 ms. Raw data files were processed for protein identification using MaxQuant (version 1.5.0.35) and searched against the UniProt database (taxonomy filter E. coli), precursor mass tolerance was set to 20 ppm and MS/MS tolerance to 0.05 Da. Peptides were defined to be tryptic with a maximum of two missed cleavage sites. Protein and peptide spectral match false discovery rate was set at 0.01.
Extended Data
Extended Data Figure 1.
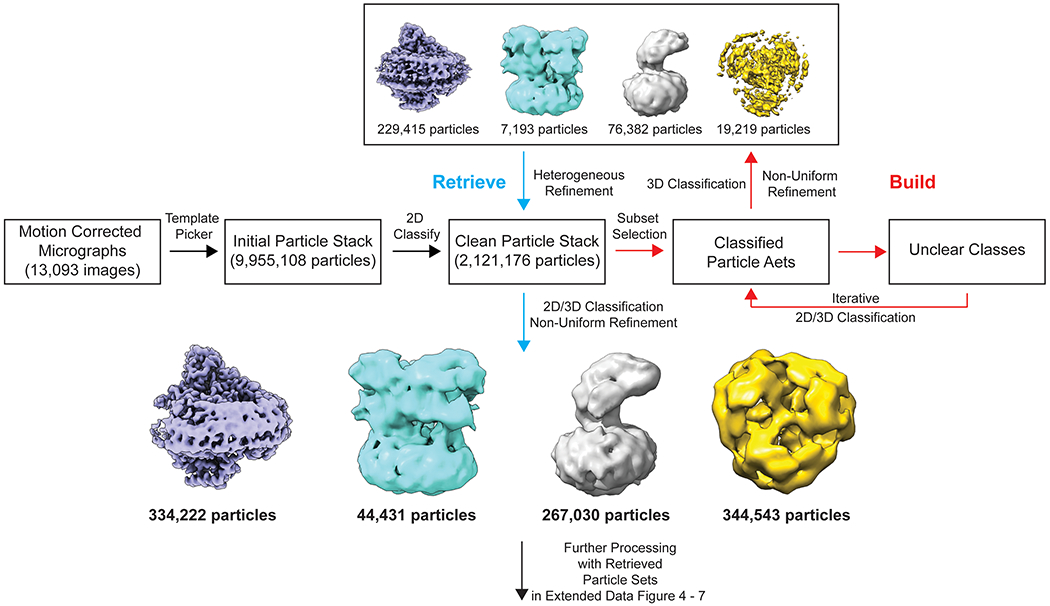
Flowchart of the “Build and Retrieve” (BaR) iterative method for the BpHpnN sample.
Extended Data Figure 2.
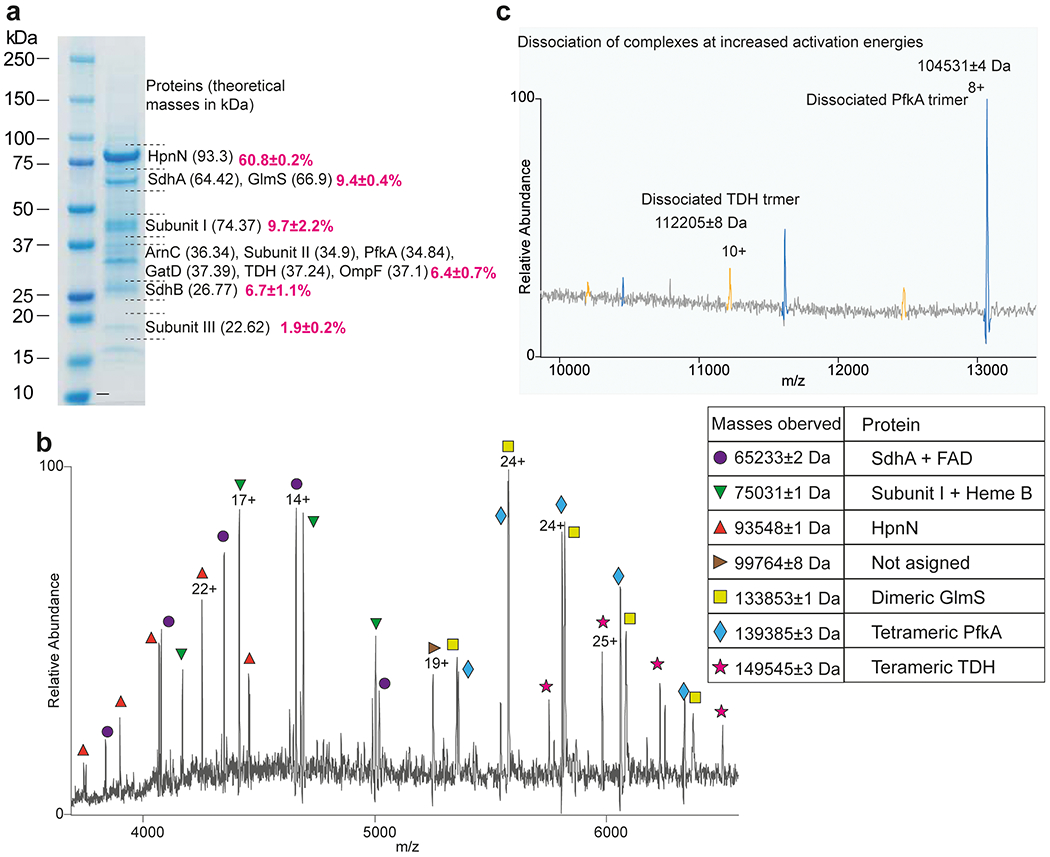
Native mass spectrometry (nMS) and proteomics analysis suggest that the sample of B. pseudomallei HpnN (BpHpnN) was co-purified with several other proteins. (a) SDS-PAGE of the purified sample where the gel bands were sliced and subjected to tryptic digestion to identify the proteins. Proteomics analysis clearly indicated the presence of BpHpnN, OmpF and different components of succinate-coenzyme Q reductase (SQR) (SdhA and SdhB) and cytochrome bo3 oxidase (Subunit I, Subunit II and Subunit III). The protein bands were quantified and replicated three times using ImageJ1, showing the abundance of 60.8% for BpHpnN, 9.4% for SdhA + GlmS, 9.7% for subunit I, 6.4% for ArnC + subunit II + PfkA + GatD + TDH + OmpF, 6.7% for SdhB, and 1.9% for subunit III. (b) Native mass spectra show several charge state distributions whose deconvoluted masses are shown in the Table. Among them, the 93,548 Da can be readily assigned to monomeric BpHpnN and the 133,853 Da to dimeric glucosamine-6-phosphate synthase (GlmS). While the masses 65,233 Da and 75,031 Da can be assigned to SdhA bound to FAD and Subunit I bound to heme b respectively based on the data from (a). Among the proteins identified in (a), PfkA and TDH are known to exist as tetramers. Therefore, the masses 139,385 Da and 149,545 Da can be assigned to the PfkA and TDH tetramers. The collisionally induced dissociated products shown in (c) further supported this assignment.
Extended Data Figure 3.
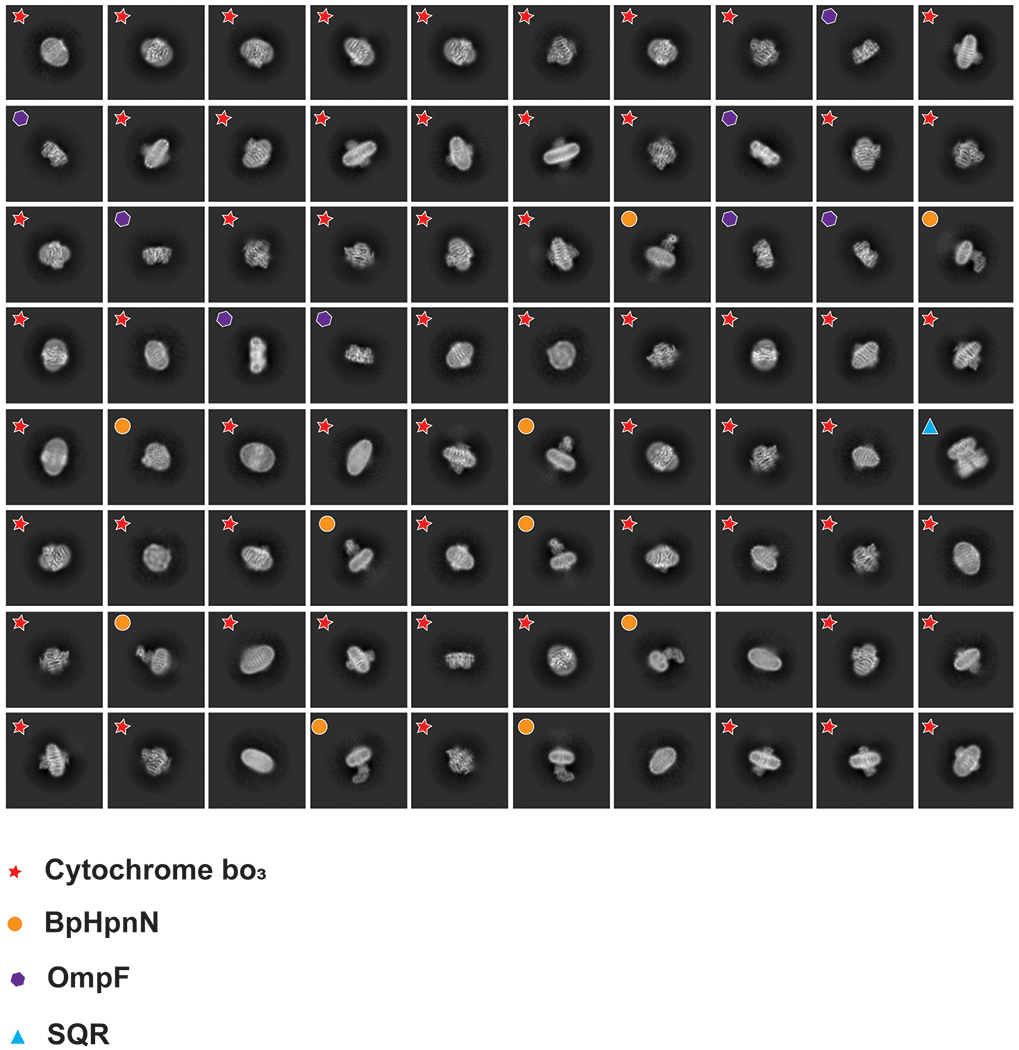
2D classes of the cryo-EM images. The 2D classification indicates that there are at least five different proteins coexisting in the nanodisc sample.
Extended Data Figure 4.
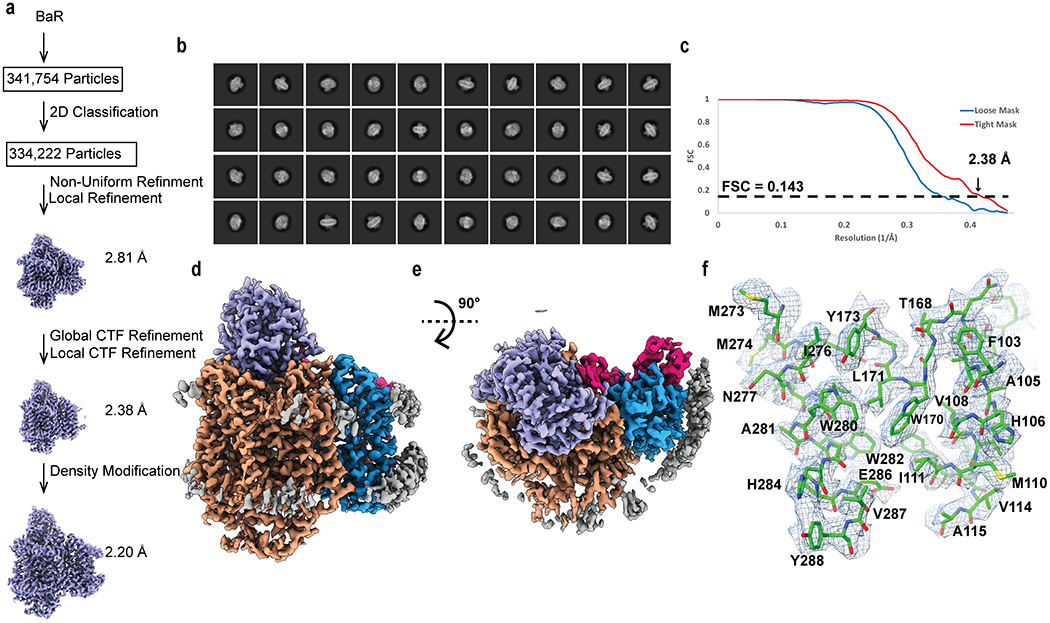
Cryo-EM analysis of the E. coli cytochrome bo3 complex. (a) BaR processing flowchart. (b) Representative 2D classes. (c) Fourier Shell Correlation (FSC) curves. (d) Sharpened cryo-EM map of the cytochrome bo3 complex viewed in the membrane plane. (e) Sharpened cryo-EM map of the cytochrome bo3 complex viewed from the cytoplasmic side. (f) Local EM density map of cytochrome bo3.
Extended Data Figure 5.
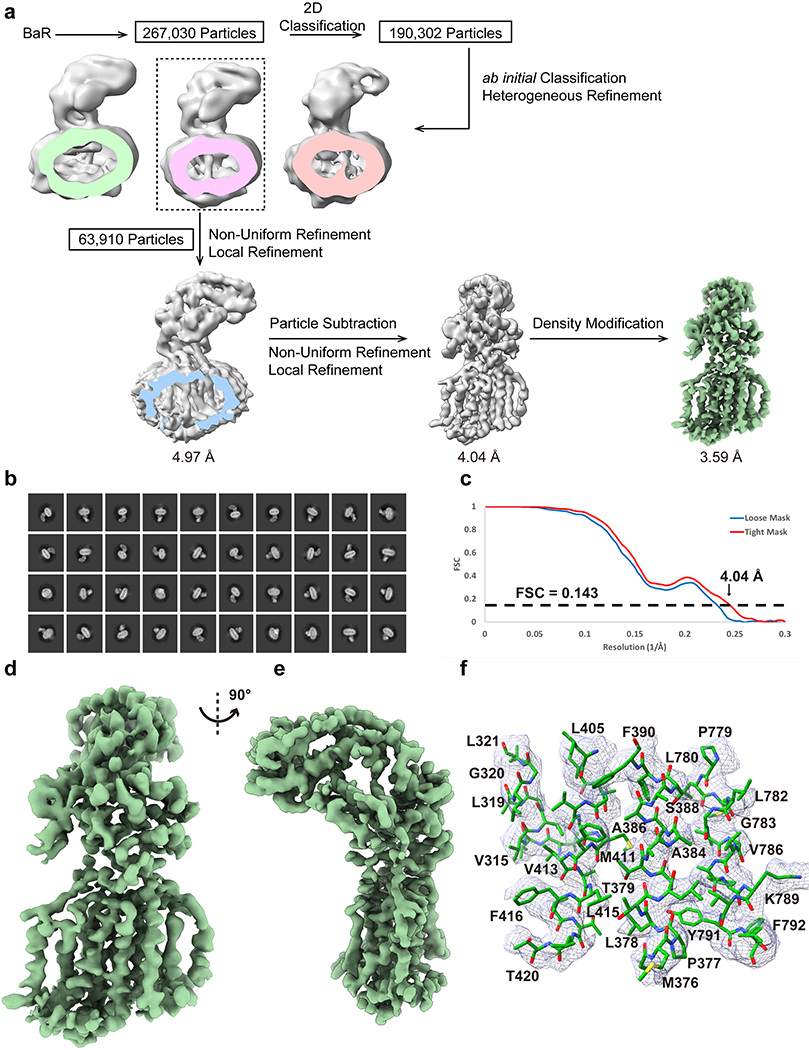
Cryo-EM analysis of the B. pseudomallei HpnN transporter. (a) BaR processing flowchart. (b) Representative 2D classes. (c) Fourier Shell Correlation (FSC) curves. (d and e) Sharpened cryo-EM maps of the BpHpnN transporter viewed in the membrane plane. (f) Local EM density map of BpHpnN.
Extended Data Figure 6.
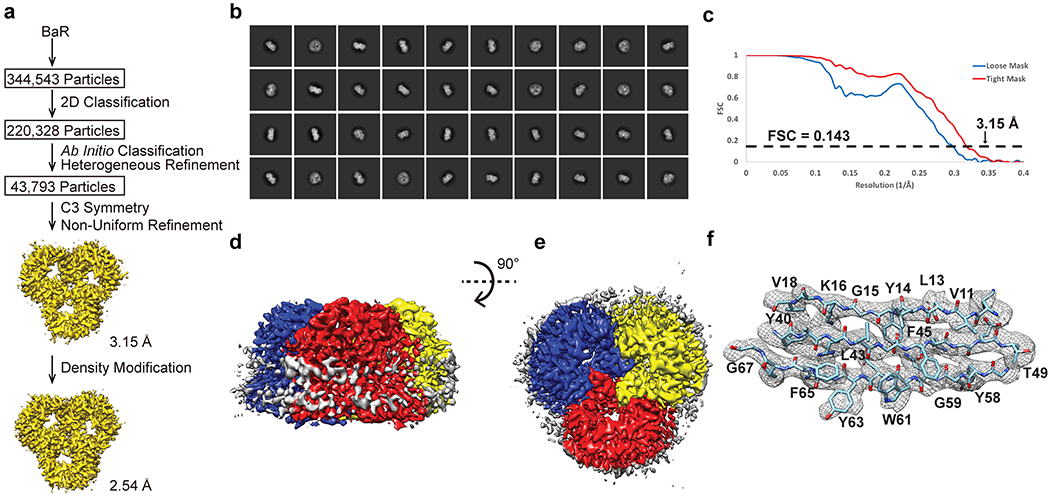
Cryo-EM analysis of the E. coli OmpF porin channel. (a) BaR processing flowchart. (b) Representative 2D classes. (c) Fourier Shell Correlation (FSC) curves. (d) Sharpened cryo-EM map of the OmpF porin viewed in the membrane plane. (e) Sharpened cryo-EM map of the OmpF viewed from the extracellular side. (f) Local EM density map of OmpF.
Extended Data Figure 7.
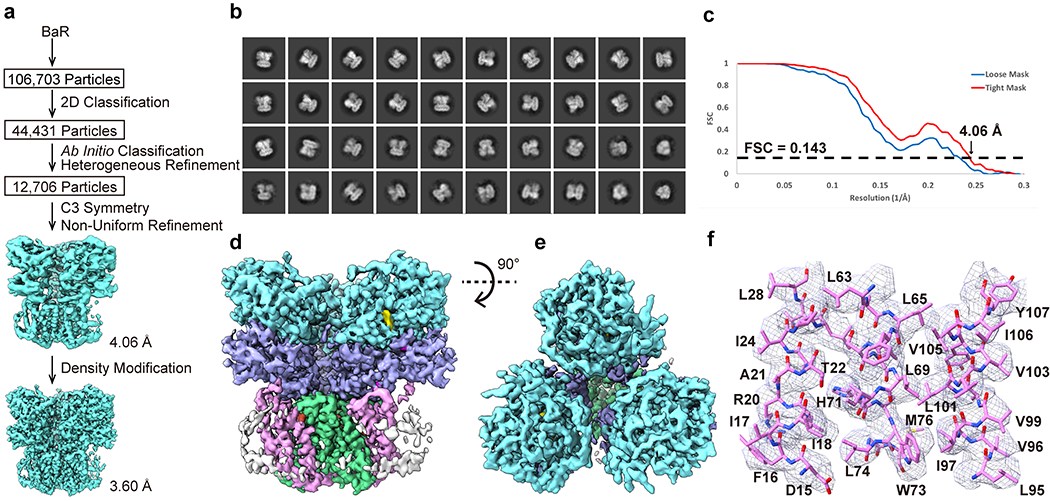
Cryo-EM analysis of the E. coli SQR complex. (a) BaR processing flowchart. (b) Representative 2D classes. (c) Fourier Shell Correlation (FSC) curves. (d) Sharpened cryo-EM map of the SQR complex viewed in the membrane plane. (e) Sharpened cryo-EM map of the SQR complex viewed from the cytoplasmic side. (f) Local EM density map of SQR.
Supplementary Material
Acknowledgements
We thank Dr. Philip A. Klenotic for proofreading the manuscript. We are grateful to the Cryo-Electron Microscopy Core at the CWRU School of Medicine and Dr. Kunpeng Li for access to the sample preparation and Cryo-EM instrumentation. We thank Drs. Di Wu and Tarick El-Baba for help with proteomics analysis. This work was supported by an NIH Grant R01AI145069 (E.W.Y.) and an MRC Grant MR/N020413/1 (C.V.R.). This research was, in part, supported by the National Cancer Institute’s National Cryo-EM Facility at the Frederick National Laboratory for Cancer Research under contract HSSN261200800001E.
Footnotes
Editorial Summary: The iterative “Build and Retrieve” (BaR) methodology facilitates solving cryo-EM structures of multiple membrane (and soluble) proteins simultaneously, including small and low abundance membrane proteins.
Competing interests
The authors declare no competing interests.
Data availability
Atomic coordinates and structure factors have been deposited with accession codes 6WTI (PDB) and EMD-21897 (EMBD) for cytochrome bo3; 6WU0 (PDB) and EMD-21901 (EMDB) for BpHpnN; 6WTZ (PDB) and EMD-21900 (EMDB) for OmpF; 6WU6 (PDB) and EMD-21906 (EMDB) for SQR (3.60 Å); 7JZ3 (PDB) and EMD-22529 (EMDB) for OmpC; 7JZ2 (PDB) and EMD-22528 (EMDB) for SQR (2.50 Å); 7JZ6 (PDB) and EMD-22530 (EMDB) for KatG; and 7JZH (PDB) and EMD-22531 (EMDB) for GadB.
References
- 1.Vinothkumar KR & Henderson R Single particle electron cryomicroscopy: trends, issues and future perspective. Quarterly Reviews of Biophysics 49, 1–25, doi: 10.1017/s0033583516000068 (2016). [DOI] [PubMed] [Google Scholar]
- 2.Herzik MA Jr., Wu M & Lander GC High-resolution structure determination of sub-100 kDa complexes using conventional cryo-EM. Nat Commun 10, 1032 (2019). [DOI] [PMC free article] [PubMed] [Google Scholar]
- 3.Ho CM et al. Malaria parasite translocon structure and mechanism of effector export. Nature 561, 70-+, doi: 10.1038/s41586-018-0469-4 (2018). [DOI] [PMC free article] [PubMed] [Google Scholar]
- 4.Morgan CE et al. Cryo-electron Microscopy Structure of the Acinetobacter baumannii 70S Ribosome and Implications for New Antibiotic Development. Mbio 11, 12, doi: 10.1128/mBio.03117-19 (2020). [DOI] [PMC free article] [PubMed] [Google Scholar]
- 5.Adams PD et al. PHENIX: building new software for automated crystallographic structure determination. Acta Crystallogr D Biol Crystallogr 58, 1948–1954 (2002). [DOI] [PubMed] [Google Scholar]
- 6.Emsley P & Cowtan K Coot: model-building tools for molecular graphics. Acta Crystallogr D Biol Crystallogr 60, 2126–2132 (2004). [DOI] [PubMed] [Google Scholar]
- 7.Daligault HE et al. Whole-genome assemblies of 56 burkholderia species. Genome Announc 2, e01106–01114 (2014). [DOI] [PMC free article] [PubMed] [Google Scholar]
- 8.Doughty DM et al. The RND-family transporter, HpnN, is required for hopanoid localization to the outer membrane of Rhodopseudomonas palustris TIE-1. Proc Natl Acad Sci U S A 108, E1045–1051 (2011). [DOI] [PMC free article] [PubMed] [Google Scholar]
- 9.Sousa FL et al. The superfamily of heme-copper oxygen reductases: Types and evolutionary considerations. Biochimica Et Biophysica Acta-Bioenergetics 1817, 629–637, doi: 10.1016/j.bbabio.2011.09.020 (2012). [DOI] [PubMed] [Google Scholar]
- 10.Abramson J et al. The structure of the ubiquinol oxidase from Escherichia coli and its ubiquinone binding site. Nature Structural Biology 7, 910–917 (2000). [DOI] [PubMed] [Google Scholar]
- 11.Yap LL et al. The quinone-binding sites of the cytochrome bo3 ubiquinol oxidase from Escherichia coli. Biochim Biophys Acta 1797, 1924–1932 (2010). [DOI] [PMC free article] [PubMed] [Google Scholar]
- 12.Choi SK et al. Location of the Substrate Binding Site of the Cytochrome bo(3) Ubiquinol Oxidase from Escherichia coli. Journal of the American Chemical Society 139, 8346–8354, doi: 10.1021/jacs.7b03883 (2017). [DOI] [PubMed] [Google Scholar]
- 13.Kumar N et al. Crystal structures of the Burkholderia multivorans hopanoid transporter HpnN. Proc Natl Acad Sci U S A 114, 6557–6562, doi: 10.1073/pnas.1619660114 (2017). [DOI] [PMC free article] [PubMed] [Google Scholar]
- 14.NIAID. (National Institute of Allergy and Infectious Diseases, Bethesda, MD, 2003). [Google Scholar]
- 15.Wagar E Bioterrorism and the Role of the Clinical Microbiology Laboratory. Clinical Microbiology Reviews 29, 175–189, doi: 10.1128/cmr.00033-15 (2016). [DOI] [PMC free article] [PubMed] [Google Scholar]
- 16.Christopher GW, Cieslak TJ, Pavlin JA & Eitzen EM Biological warfare - A historical perspective. Jama-Journal of the American Medical Association 278, 412–417, doi: 10.1001/jama.278.5.412 (1997). [DOI] [PubMed] [Google Scholar]
- 17.Nierman WC et al. Structural flexibility in the Burkholderia mallei genome. Proceedings of the National Academy of Sciences of the United States of America 101, 14246–14251, doi: 10.1073/pnas.0403306101 (2004). [DOI] [PMC free article] [PubMed] [Google Scholar]
- 18.Schweizer HP Mechanisms of antibiotic resistance in Burkholderia pseudomallei: implications for treatment of melioidosis. Future Microbiology 7, 1389–1399, doi: 10.2217/fmb.12.116 (2012). [DOI] [PMC free article] [PubMed] [Google Scholar]
- 19.Malott RJ, Steen-Kinnaird BR, Lee TD & Speert DP Identification of Hopanoid Biosynthesis Genes Involved in Polymyxin Resistance in Burkholderia multivorans. Antimicrobial Agents and Chemotherapy 56, 464–471, doi: 10.1128/aac.00602-11 (2012). [DOI] [PMC free article] [PubMed] [Google Scholar]
- 20.Malott RJ et al. Fosmidomycin Decreases Membrane Hopanoids and Potentiates the Effects of Colistin on Burkholderia multivorans Clinical Isolates. Antimicrobial Agents and Chemotherapy 58, 5211–5219, doi: 10.1128/aac.02705-14 (2014). [DOI] [PMC free article] [PubMed] [Google Scholar]
- 21.Nikaido H Molecular basis of bacterial outer membrane permeability revisited. Microbiology and Molecular Biology Reviews 67, 593-+, doi: 10.1128/mmbr.67.4.593-656.2003 (2003). [DOI] [PMC free article] [PubMed] [Google Scholar]
- 22.Cowan SW et al. CRYSTAL-STRUCTURES EXPLAIN FUNCTIONAL-PROPERTIES OF 2 ESCHERICHIA-COLI PORINS. Nature 358, 727–733, doi: 10.1038/358727a0 (1992). [DOI] [PubMed] [Google Scholar]
- 23.Yankovskaya V et al. Architecture of succinate dehydrogenase and reactive oxygen species generation. Science 299, 700–704, doi: 10.1126/science.1079605 (2003). [DOI] [PubMed] [Google Scholar]
- 24.Baslé A, Rummel G, Storici P, Rosenbusch JP & Schirmer T, doi: 10.1016/j.jmb.2006.08.002. [DOI] [PubMed] [Google Scholar]
- 25.Carpena X, Melik-Adamyan W, Loewen PC & Fita I Structure of the C-terminal domain of the catalase-peroxidase KatG from Escherichia coli. Acta Crystallographica Section D-Structural Biology 60, 1824–1832, doi: 10.1107/s0907444904020621 (2004). [DOI] [PubMed] [Google Scholar]
- 26.Capitani G et al. Crystal structure and functional analysis of Escherichia coli glutamate decarboxylase. Embo Journal 22, 4027–4037, doi: 10.1093/emboj/cdg403 (2003). [DOI] [PMC free article] [PubMed] [Google Scholar]
- 27.Chorev DS et al. Protein assemblies ejected directly from native membranes yield complexes for mass spectrometry. Science 362, 829–834, doi: 10.1126/science.aau0976 (2018). [DOI] [PMC free article] [PubMed] [Google Scholar]
- 28.Ho CM et al. Bottom-up structural proteomics: cryoEM of protein complexes enriched from the cellular milieu. Nature Methods 17, 79-+, doi: 10.1038/s41592-019-0637-y (2020). [DOI] [PMC free article] [PubMed] [Google Scholar]
- 29.Kastritis PL et al. Capturing protein communities by structural proteomics in a thermophilic eukaryote. Molecular systems biology 13, 936, doi: 10.15252/msb.20167412 (2017). [DOI] [PMC free article] [PubMed] [Google Scholar]
- 30.Yi X, Verbeke EJ, Chang Y, Dickinson DJ & Taylor DW Electron microscopy snapshots of single particles from single cells. The Journal of biological chemistry 294, 1602–1608, doi: 10.1074/jbc.RA118.006686 (2019). [DOI] [PMC free article] [PubMed] [Google Scholar]
- 31.Schmidli C et al. Microfluidic protein isolation and sample preparation for high-resolution cryo-EM. Proceedings of the National Academy of Sciences 116, 15007–15012, doi: 10.1073/pnas.1907214116 (2019). [DOI] [PMC free article] [PubMed] [Google Scholar]
- 32.Long F et al. Crystal structures of the CusA efflux pump suggest methionine-mediated metal transport. Nature 467, 484–488, doi: 10.1038/nature09395 (2010). [DOI] [PMC free article] [PubMed] [Google Scholar]
- 33.Mastronarde DN Automated electron microscope tomography using robust prediction of specimen movements. J Struct Biol 152, 36–51 (2005). [DOI] [PubMed] [Google Scholar]
- 34.Zheng SQ et al. MotionCor2: anisotropic correction of beam-induced motion for improved cryo-electron microscopy. Nature Methods 14, 331–332, doi: 10.1038/nmeth.4193 (2017). [DOI] [PMC free article] [PubMed] [Google Scholar]
- 35.Punjani A, Rubinstein JL, Fleet DJ & Brubaker MA cryoSPARC: algorithms for rapid unsupervised cryo-EM structure determination. Nat Methods 14, 290–296 (2017). [DOI] [PubMed] [Google Scholar]
- 36.Terwilliger TC, Ludtke SJ, Read RJ, Adams PD & Afonine PV Improvement of cryo-EM maps by density modification. Nat Methods 17, 923–927 (2020). [DOI] [PMC free article] [PubMed] [Google Scholar]
- 37.Afonine PV et al. Real-space refinement in PHENIX for cryo-EM and crystallography. Acta Crystallogr D Struct Biol 74, 531–544 (2018). [DOI] [PMC free article] [PubMed] [Google Scholar]
- 38.Chen VB et al. MolProbity: all-atom structure validation for macromolecular crystallography. Acta Crystallogr D Biol Crystallogr 66, 12–21 (2010). [DOI] [PMC free article] [PubMed] [Google Scholar]
- 39.Marty MT et al. Bayesian Deconvolution of Mass and Ion Mobility Spectra: From Binary Interactions to Polydisperse Ensembles. Analytical Chemistry 87, 4370–4376, doi: 10.1021/acs.analchem.5b00140 (2015). [DOI] [PMC free article] [PubMed] [Google Scholar]
- 40.Shevchenko A, Wilm M, Vorm O & Mann M Mass spectrometric sequencing of proteins from silver stained polyacrylamide gels. Analytical Chemistry 68, 850–858, doi: 10.1021/ac950914h (1996). [DOI] [PubMed] [Google Scholar]
Associated Data
This section collects any data citations, data availability statements, or supplementary materials included in this article.