

Supplemental Digital Content is available in the text
Keywords: liraglutide, obesity, weight loss, body mass index, treatment outcome
Abstract
Among Asian countries, South Korea was the first to approve liraglutide as a treatment for obesity. Thus, the clinical effectiveness of liraglutide has not been studied in Asian populations.
In this study, we retrospectively analyzed obese patients [body mass index (BMI) >27 kg/m2] who were treated with liraglutide between March 2018 and March 2019 in a single clinic. Weight, BMI, HbA1c, and clinical data were collected before liraglutide treatment. Changes in body weight and composition and their relationships with clinical variables were examined at re-prescription dates within 30, 60, 90, and 180 days.
A total of 169 subjects were studied. The average age was 41.5 years, and 42% of the subjects were male. The average weight was 85.2 kg, and the average BMI was 30.8 kg/m2. Weight reduction was significant (–5.5 ± 3.4 kg, 30 days: –3.2 ± 1.8 kg, 60 days: –4.5 ± 2.3 kg, 90 days: –6.3 ± 2.6 kg, 180 days: –7.8 ± 3.5 kg) during the follow-up period and increased with longer treatment time (P < .001). The percentages of subjects that showed ≥ 5% and ≥ 10% body weight reduction were 62.1% and 17.2%, respectively. In the body composition analysis, skeletal muscle weight loss was –3.56 ± 29.7%, which was significantly smaller than fat weight loss of –11.06 ± 10.4% (P = .03). Weight loss was not significantly related to age, sex, baseline BMI, baseline HbA1c, smoking status, alcohol consumption, coffee intake.
In conclusion, Liraglutide treatment led to meaningful weight loss in South Korean patients, and fat mass reduction was prominent during treatment. Furthermore, liraglutide showed greater clinical effectiveness with longer treatment time.
1. Introduction
Obesity is a globally prevalent chronically relapsing disease that requires continuous efforts toward prevention and treatment.[1] Weight loss of over 5% is known to improve the risk of morbidity and mortality and meaningfully improve health-related quality of life.[2,3] One of the most well-known methods of weight loss is changing lifestyle via modifying diet and increasing physical activity. However, the overall effects of behavioral therapies in weight loss maintenance can be meaningful yet small, and can result in a gradual regain of the weight.[4,5] Pharmacological treatments can act as an adjunct to behavioral treatments, especially for cases in which lifestyle changes fail to produce the desired weight loss.[6,7] However, there are limited options for antiobesity medications, especially for long-term use.
Liraglutide is an acylated glucagon-like peptide-1 (GLP-1) analog that has 97% similarity to human GLP-1 and is known to lower body weight by reducing appetite and calorie intake.[8,9] Randomized controlled studies have proven that liraglutide prescribed up to 3.0 mg a day successfully induced clinically meaningful weight loss compared to a placebo, and improvements in body weight were maintained for up to 2 years.[10,11] Liraglutide has been approved for 3-year use in overweight and obese patients in various countries, including the US and the EU. The effects of liraglutide combined with diet and exercise have also been demonstrated using real-world data in Canada, with over 60% of the enrolled population losing more than 5% of their body weight.[12]
In Asia, an accelerating increase in mean body mass index (BMI) has been observed since approximately 2000, and the transition from underweight to overweight has been rapid.[13] Central fat deposition is more prominent in Asians, and metabolic problems such as nonalcoholic fatty liver disease, diabetes, and cardiovascular disease have increased among those with central fat deposition, even with lower BMI.[14,15] Among Asian countries, South Korea was the first country to approve liraglutide for treating obesity; its use began in March 2018. Thus, the real-world clinical effectiveness of liraglutide has not yet been studied in Asian populations. This study retrospectively analyzed real-world data of overweight and obese patients (BMI > 27 kg/m2) who were treated with liraglutide in South Korea. Weight reduction outcomes according to liraglutide usage and predictive factors for the effect of liraglutide were examined.
2. Methods
2.1. Ethical consideration
This study protocol was approved by the Public Institutional Bioethics Committee designated by the Ministry of Health and Welfare, Republic of Korea (IRB approved No. P10-201909-21-007). Written consent was waived.
2.2. Patients and study design
Data were retrospectively collected for patients with BMI ≥27 who were prescribed liraglutide for obesity treatment between March 23, 2018, and March 31, 2019, at the Seoul Happiness Clinic of Internal Medicine. The exclusion criteria were as follows: age under 18, no baseline exam (body weight and height), or no follow-up data for body weight. The study design is shown in Fig. 1A. For enrolled patients, initial height, weight, BMI, age, sex, and HbA1c data were collected. Patients were recommended to visit the clinic once a month. Patients’ weight, skeletal muscle weight, and fat weight data were collected at liraglutide re-prescription dates closest to 30, 60, 90, and 180 days after the first prescription; measurements were acquired using ACCUNIQ BC380 (SELVAS Healthcare Inc., Daejeon, Korea) as described in previous papers.[16] Final weight loss was measured at the final prescription visit. Changes in body weight, muscle weight, and fat weight during the time period were analyzed. Then the effects of baseline BMI, age, sex, Hemoglobin A1c level, early responders, behavioral characteristics on final weight loss were examined. For BMI, patients were divided into groups 27 ≤ BMI < 30, 30 ≤ BMI < 33, BMI ≥ 33. Age groups were divided into groups under age 30, 30 to 39, 40 to 49, 50 to 59, and ≥60. Sex was divided into male and female. Hemoglobin A1c levels were divided into HbA1c up to 5.6 (normal), 5.7 to 6.4 (prediabetes), and over 6.5 (diabetes). Early responders were defined as weight loss in 30 or 60 days after the first prescription, which was compared with weight loss in later time periods and final weight loss. Behavioral characteristics were measured by lifestyle questionnaires, discussed below.
Figure 1.
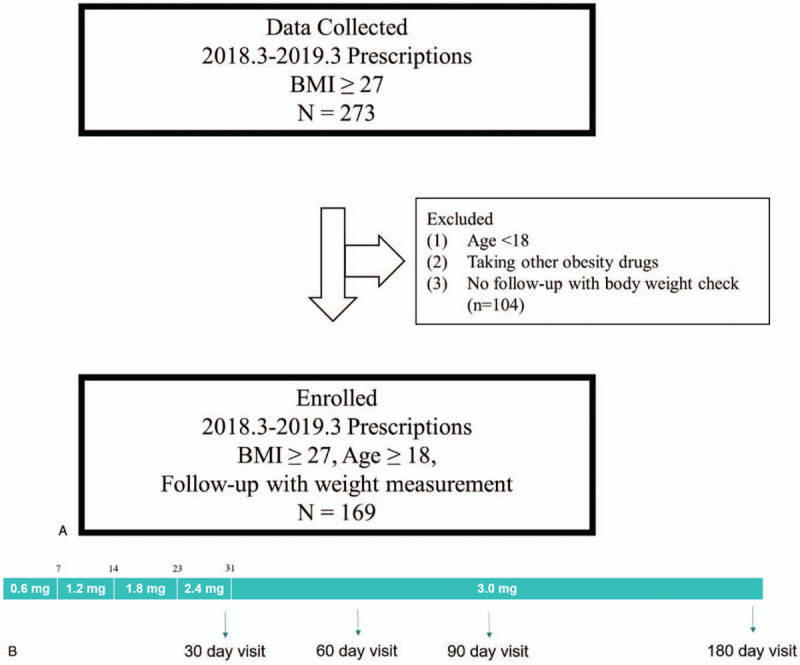
(A) Flow chart of the study. (B) Dose escalation schedule of liraglutide treatment.
2.3. Dose escalation schedule of liraglutide
Dose escalation of liraglutide was generally recommended as follows: liraglutide was initiated at a dose of 0.6 mg. The dose was increased by approximately 0.6 mg each week to 1.2 mg by 7 days, 1.8 mg by 14 days, 2.4 mg by 23 days, and 3.0 mg by 31 days. Those who continued to visit the clinic after 31 days were treated with 3.0 mg daily. This schedule is shown in Fig. 1B.
2.4. Lifestyle questionnaire
A questionnaire that was designed for obesity care in Seoul Happiness Clinic of Internal Medicine were completed by every patient at their first visit. Participants were asked whether they smoked or drank alcohol and how much coffee they drank each day. They were also asked if their daily water intake was over 1 L and whether they preferred soft drinks. Questions regarding body image concerns were also asked. To understand the patient's eating habits, the questionnaire included questions about their preference for fast food and greasy food, frequency of eating breakfast, eating outside the home, and watching television while eating. The levels of bulimia, impulsive eating, restrained eating, and emotional eating, and number of obese family members were assessed. Aside from the questions with yes or no answers, the questionnaire response options were divided into “strongly disagree, somewhat disagree, somewhat agree, and strongly agree.” The questionnaire responses, “strongly disagree, somewhat disagree, somewhat agree, strongly agree,” were assigned values of 1, 2, 3, and 4, respectively, and the data were analyzed by calculating the total sum of the question responses; the population was then divided into 4 groups, “low, medium, high, very high,” according to quartiles of the sum. The questionnaire is described in detail in S1, http://links.lww.com/MD/F494.
2.5. Statistical analysis
The mean and standard deviations (SDs) for all continuous variables in the paper were calculated and reported in the form of mean ± SD. Categorical variables were expressed as proportions (%). Statistical analyses were performed by comparing weight loss data according to variable groups. Imputation of missing data was not done, and normality assumption was examined using Q-Q plot and the Shapiro-Wilk test. Generalized estimating equation analysis was performed to analyze the difference of weight loss at 30 days, 60 days, 90 days, and 180 days after the first prescription to deal with missing data. Paired t-tests were performed to check if final weight reduction during liraglutide treatment was significant, and to compare the amount of muscle weight loss and fat weight loss in kg and %. Student t-tests and analysis of variance were used to check if final weight loss was significantly different between different groups of baseline BMI, age, sex, HbA1c level, early responders, and behavioral factors when normal distribution could be assumed in all the groups. For behavioral factors that had groups in which normal distribution could not be assumed, Kruskal-Wallis test was performed. Post trend analysis was performed if necessary. Linear regression analysis was performed to see the correlation between liraglutide treatment duration, baseline BMI, age, early responders, and final weight loss. All statistical analyses were performed using R Statistical Software (Version 3.5.2; R Foundation for Statistical Computing, Vienna, Austria) and PRISM software (version 5; GraphPad, La Jolla, CA). A P value of <.05 was considered statistically significant.
3. Results
3.1. Baseline characteristics
Of a total of 273 patients, 104 patients were excluded due to a lack of follow-up or lack of body weight measurements during follow-up. A total of 169 subjects were studied. The average follow-up days were 73.7 days, and the total study period was a year. The average age was 41.5 ± 9.6 years, and 42% of the subjects were male. At baseline, the average weight was 85.2 ± 14.6 kg, and the average BMI was 30.8 ± 3.5 kg/m2. The number of people who were re-prescribed liraglutide within 30 days after the first prescription was 67; 111 patients within 60 days, 53 patients visited within 90 days, and 51 patients within 180 days.
Of those whose HbA1c data were collected (n = 149), 34.9% had prediabetes (5.7% ≤ HbA1c ≤ 6.4%), and 10.1% had diabetes (6.5% ≤ HbA1c). The average baseline value for HbA1c was 5.8 ± 0.8%. Of those whose data were collected, 19.2% were smokers, 59.8% drank alcohol, and 45.5% drank less than 1 L of water per day. The data are described in Table 1.
Table 1.
Baseline characteristics of enrolled patients.
| Physical characteristics | Patients N | Data∗ |
| Age, yrs | 169 | 41.5 ± 9.6 |
| Sex (male), n (%) | 169 | 71 (42.0) |
| Baseline body weight | 169 | 85.2 ± 14.6 |
| Baseline muscle weight | 169 | 28.4 ± 6.9 |
| Baseline fat weight | 169 | 32.2 ± 7.5 |
| Baseline BMI | 169 | 30.8 ± 3.5 |
| Follow-up duration, days | 169 | 73.7 ± 51.9 |
| HbA1c at starting point | 149 | 5.8 ± 0.8 |
| HbA1c ≤ 5.6%, n (%) | 82 (55.0) | |
| 5.7% ≤ HbA1c ≤ 6.4%, n (%) | 52 (34.9) | |
| 6.5% ≤ HbA1c, n (%) | 15 (10.1) |
| Behavioral characteristics | Patient N | Data∗ |
| Smoker | 125 | 24 (19.2) |
| Alcohol drinker | 127 | 76 (59.8) |
| Coffee | 122 | |
| <1 cup | 43 (35.3) | |
| 2–4 cups | 71 (58.2) | |
| More than 4 cups | 8 (6.6) | |
| Daily water intake | 123 | |
| <1 L | 56 (45.5) | |
| >1 L | 67 (54.5) | |
| Soft drinks | 91 | |
| Nonpreferred | 73 (80.2) | |
| Preferred | 18 (19.8) | |
| Body image concern | 119 | |
| Low | 34 (28.6) | |
| Medium | 3 (2.5) | |
| High | 36 (30.3) | |
| Very high | 46 (38.7) | |
| Frequency of breakfast | 123 | |
| Low | 19 (15.4) | |
| Medium | 25 (20.3) | |
| High | 34 (27.6) | |
| Very high | 45 (36.6) | |
| Preference for fast food | 124 | |
| Low | 15 (12.1) | |
| Medium | 70 (56.5) | |
| High | 33 (26.6) | |
| Very high | 6 (4.8) | |
| Preference for greasy food | 124 | |
| Low | 5 (4.0) | |
| Medium | 21 (16.9) | |
| High | 70 (56.5) | |
| Very high | 28 (22.6) | |
| Preference for eating outside the home | 124 | |
| Low | 11 (8.9) | |
| Medium | 17 (13.7) | |
| High | 44 (35.5) | |
| Very high | 52 (41.9) | |
| Watching television while eating | 111 | |
| Rarely | 15 (13.5) | |
| Sometimes | 17 (15.3) | |
| Often | 41 (36.9) | |
| Always | 38 (34.2) | |
| Level of bulimia | 124 | |
| Low | 7 (5.6) | |
| Medium | 23 (18.5) | |
| High | 80 (64.5) | |
| Very high | 14 (11.3) | |
| Level of impulsive eating | 123 | |
| Low | 7 (5.7) | |
| Medium | 36 (29.3) | |
| High | 57 (46.3) | |
| Very high | 23 (18.7) | |
| Level of restrained eating | 119 | |
| Low | 49 (41.2) | |
| Medium | 47 (39.5) | |
| High | 14 (11.8) | |
| Very high | 9 (7.6) | |
| Level of emotional eating | 122 | |
| Low | 8 (6.6) | |
| Medium | 30 (24.6) | |
| High | 42 (34.4) | |
| Very high | 42 (34.4) | |
| Number of obese family members | 122 | |
| 0 | 33 (30.0) | |
| 1 | 33 (30.0) | |
| 2 | 32 (29.1) | |
| ≥ 3 | 12 (10.9) |
The data are presented in the form of mean ± SD or n (%).
3.2. Clinical effectiveness of liraglutide 3.0 mg injection
3.2.1. Change in body weight during treatment periods
Weight reduction during liraglutide treatment was significant (–5.5 ± 3.4 kg, P < .001), and the percent weight loss was significantly correlated with liraglutide treatment duration (R2 = .35, P < .001). The data are shown in Fig. 2A. Weight loss according to time duration since the first visit was as follows: at 30 days: –3.2 ± 1.8 kg, 60 days: –4.5 ± 2.3 kg, 90 days: –6.3 ± 2.6 kg, 180 days: –7.8 ± 3.5 kg. The weight loss percentages according to the time duration since the first prescription were as follows: at 30 days: –3.8 ± 2.1%, 60 days: –5.3 ± 2.6%, 90 days: –7.5 ± 2.9%, 180 days: –9.1 ± 3.6%. The weight loss at 30 days, 60 days, 90 days, and 180 days after the first prescription differed significantly according to generalized estimating equation analysis (P < .001 for each coefficient). The proportion of people who had ≥5% weight loss was 26.9% after 30 days, over 50% after 60 days (55.0%), and over 80% after 90 and 180 days (84.9% and 86.0%, respectively). Additionally, ≥10% weight loss was achieved by 17.0% of the patients after 90 days and 41.2% of the patients after 180 days. In total, 62.1% and 17.2% of subjects showed ≥5% and ≥10% body weight reduction during the observed period, respectively. The data are described in Table 2.
Figure 2.
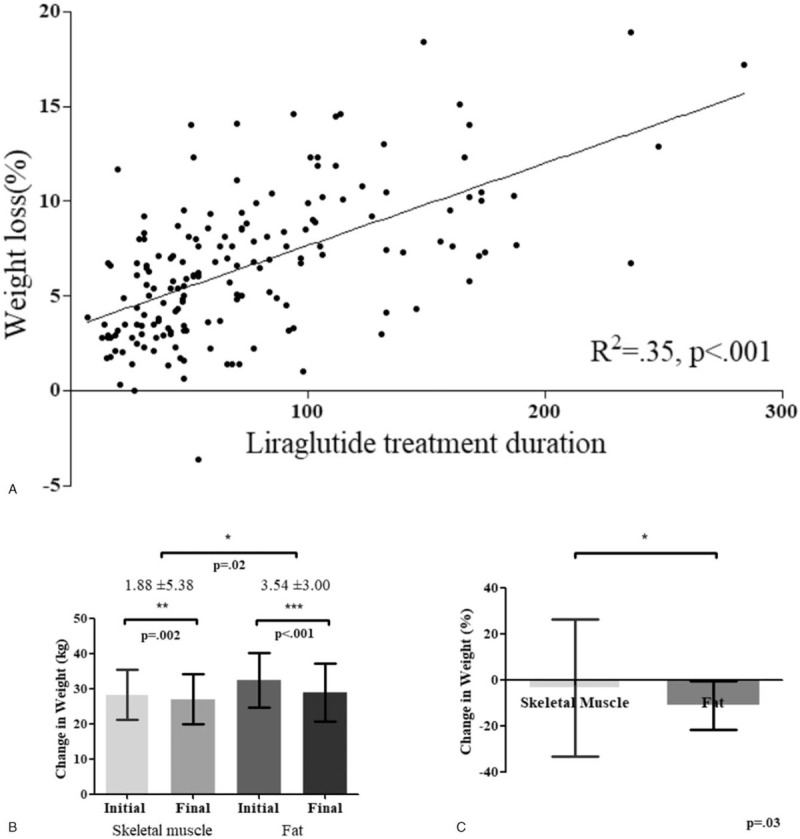
(A) Weight loss (%) according to the duration of liraglutide treatment. Longer use of liraglutide significantly reduced body weight. Linear regression analysis was performed. (B) Change in muscle weight and fat weight by kg (B) and percentage (C). During liraglutide treatment, fat mass was significantly more reduced compared with muscle mass. Error bars represent ± SD. Student t-tests were performed.
Table 2.
Change in body weight during the treatment periods.
| 30 d | 60 d | 90 d | 180 d | P-value | Overall | |
| Patients (number)∗ | 67 | 111 | 53 | 51 | 169 | |
| Weight loss, kg† | 3.2 ± 1.8 | 4.5 ± 2.3 | 6.3 ± 2.6 | 7.8 ± 3.5 | <.001 | 5.5 ± 3.4 |
| Weight loss, %† | 3.8 ± 2.1 | 5.3 ± 2.6 | 7.5 ± 2.9 | 9.1 ± 3.6 | <.001 | 6.5 ± 3.8 |
| Patients (number)∗ | 67 | 111 | 53 | 51 | 169 | |
| R2 of correlation with weight loss at 30 d‡ | .38 | .09 | .17 | |||
| P value of correlation with weight loss at 30 d‡ | <.001 | .25 | .09 | |||
| R2 of correlation with weight loss at 60 d‡ | .36 | .04 | ||||
| P value of correlation with weight loss at 60 d‡ | <.001 | .22 | ||||
| Over 5% weight loss, n (%) | 18 (26.9) | 61 (55.0) | 45 (84.9) | 44 (86.0) | 105 (62.1) | |
| Over 10% weight loss, n (%) | 1 (1.0) | 4 (3.6) | 9 (17.0) | 21 (41.2) | 29 (17.2) |
Patients (number) indicates the number of patients who had their body checked by ACCUNIQ BC380 at that time point.
Repeated measured analysis of variance was performed. Data are presented in the form of mean ± SD.
Linear regression analysis was performed.
3.2.2. Changes in muscle and fat weight
We examined patients who received a dose over 3.0 mg and were prescribed more than 30 days of liraglutide (n = 140). We compared muscle and fat weight on their first prescription with muscle and fat weight on their final prescription within the study period. The data are also shown in Figure 2B. Weight loss was significant both in muscle and fat when comparing baseline and follow-up weights (P < .001 for both). Muscle weight loss was –1.9 ± 5.4 kg, while fat weight loss was –3.5 ± 3.0 kg, and fat weight loss was significantly greater than muscle weight loss (P = .02) (Fig. 2B). In percentages, muscle weight loss (SD) was –3.6 ± 29.7%, while fat weight loss (SD) was –11.1 ± 10.5% and the percentage of fat weight loss was significantly larger than the percentage of muscle weight loss (P = .03) (Fig. 2C).
3.3. Analysis of predictive factors for the effect of liraglutide
We analyzed whether there were factors that could predict the effects of liraglutide for patients.
3.3.1. Weight loss according to baseline BMI, age, sex, and HbA1c level
Weight loss was evident regardless of baseline BMI. No significant correlation was observed between BMI and final weight loss (%) (R2 = .001, P = .58). Patients with 27 ≤ BMI < 30 did not show significantly different weight loss when compared with the 30 ≤ BMI < 33 group and the BMI ≥ 33 group (P = .72). Next, we examined age, sex, and HbA1c levels. Age and weight loss (%) had no significant correlation (R2 < .001, P = .90), and there was no significant difference in weight loss between age groups (P = .96). Men and women did not show a significant difference in weight loss (%) (P = .76). Groups with different HbA1c levels (HbA1c up to 5.6, over 5.6–6.4, over 6.4) did not show significant differences in weight loss (%) (P > .99). Thus, weight loss with liraglutide was evident regardless of age, sex, or diabetes risk level. The data are described in Table 3.
Table 3.
Weight loss according to physical characteristics.
| Patients (N) | Weight loss (%)† | P-value | |
| Age | .96∗ | ||
| <30 | 17 | 6.8 ± 3.7 | |
| 30–39 | 60 | 6.2 ± 3.6 | |
| 40–49 | 59 | 6.6 ± 3.7 | |
| 50–59 | 27 | 6.7 ± 2.8 | |
| 60≤ | 6 | 7.2 ± 3.4 | |
| Sex | .76∗ | ||
| Male | 71 | 6.6 ± 3.8 | |
| Female | 98 | 6.4 ± 3.9 | |
| Baseline BMI | .72∗ | ||
| 27 ≤ BMI <30 | 89 | 6.7 ± 3.5 | |
| 30 ≤ BMI <33 | 46 | 6.2 ± 4.1 | |
| 33 ≤ BMI | 34 | 6.4 ± 4.3 | |
| Baseline HbA1c | >.99∗ | ||
| HbA1c ≤ 5.6% | 82 | 6.5 ± 3.8 | |
| 5.7% ≤ HbA1c ≤ 6.4% | 52 | 6.4 ± 3.7 | |
| 6.5% ≤ HbA1c | 15 | 6.6 ± 3.3 |
Student t-test was performed.
Weight loss data are all presented in the form of mean ± SD.
3.3.2. Early responders
Previous studies defined early responders as those achieving weight loss of ≥5% after 16 weeks, including dose escalation.[17] Early weight loss with liraglutide 3.0 mg is known to predict clinically meaningful weight loss at 56 weeks.[18] We checked whether early response with different criteria could predict future weight loss (%) by determining the correlation of weight loss 30 days after the first visit with weight loss 60 days, 90 days, and 180 days after the first prescription. Correlation of % weight loss was observed between 30 and 60 days (R2 = .38, P < .001) but not between 30 and 90 days (R2 = .09, P = .25) or 30 and 180 days (R2 = .17, P = .09). Among patients who received 3.0 mg liraglutide, we also observed a correlation between weight loss 60 days after the first visit and weight loss 90 days and 180 days after the first visit. There was a correlation of % weight loss between 60 and 90 days (R2 = .36, P < .001) but not between 60 and 180 days (R2 = .04, P = .22). In addition, patients who achieved weight loss of ≥5% at 30 days did not show significantly more weight loss at 180 days than nonearly responders even when HbA1c levels or BMI levels were considered (P = .70 and P = .33, respectively). Patients that had weight loss of ≥5% at 60 days also did not show significantly more weight loss at 180 days than nonearly responders, even when HbA1c levels or BMI levels were considered (P = .56 and P = .40, respectively). Thus, in our study, early response, defined as weight loss evident after either 30 days or 60 days, cannot predict also weight loss at 180 days. The data are described in Table 2.
3.3.3. Behavioral characteristics
Finally, we analyzed the effects of behavioral factors on weight loss based on questionnaire data. No significant difference in weight loss was observed related to smoking status or coffee, water, or soft drink intake (P = .69, P = .24, P = .98, P = .31, respectively). Those who consumed alcohol showed less but not significant weight loss, with a mean weight loss of 5.9% for alcohol drinkers and 7.1% for nondrinkers. (P = .08). Weight loss (%) also did not significantly differ according to body image concerns (P = .48).
As for eating patterns, no significant effect was observed according to preference for fast food or greasy food (P = .23, P = .46, respectively). Additionally, eating environment factors, such as preference for eating outside home and watching television while eating, did not significantly change weight loss (P = .36, P = .40, respectively). The levels of bulimia, impulsive eating, restrained eating, and emotional eating and the number of obese family members also did not significantly affect weight loss (P = .65, P = .15, P = .63, P = .33, P = .41, respectively). Posthoc analysis showed no significant difference between groups for all behavioral factors stated above. Those who ate breakfast more frequently showed a trend of less weight loss, with a mean of 8.5%, 6.1%, 6.1%, and 5.8% for patients with low, medium, high, and very high frequencies of breakfast, respectively (P = .07, post trend analysis P = .01); the data are described in Table 4.
Table 4.
Weight loss according to behavioral characteristics.
| Patients N | Weight loss (%)§ | P-value | |
| Smoking∗ | .69 | ||
| Smoker | 24 | 6.6 ± 4.2 | |
| Nonsmoker | 101 | 6.3 ± 3.7 | |
| Alcohol∗ | .08 | ||
| Drinker | 76 | 5.9 ± 3.6 | |
| Nondrinker | 51 | 7.1 ± 4.0 | |
| Coffee‡ | .24 | ||
| <1 cup | 43 | 5.6 ± 3.5 | |
| 2–4 cup | 71 | 6.6 ± 4.0 | |
| ≥ 5 cups | 8 | 7.2 ± 3.8 | |
| Daily water intake∗ | .98 | ||
| <1 L | 56 | 6.3 ± 3.8 | |
| >1 L | 67 | 6.4 ± 3.9 | |
| Soft drinks∗ | .31 | ||
| Nonpreferred | 73 | 6.1 ± 3.6 | |
| Preferred | 18 | 7.1 ± 4.8 | |
| Body image concern‡ | .48 | ||
| Low | 34 | 6.5 ± 3.6 | |
| Medium | 3 | 12.1 ± 7.8 | |
| High | 36 | 5.9 ± 3.7 | |
| Very high | 46 | 6.4 ± 3.7 | |
| Frequency of breakfast† | .07 | ||
| Low | 19 | 8.5 ± 4.9 | |
| Medium | 25 | 6.1 ± 3.0 | |
| High | 34 | 6.1 ± 3.8 | |
| Very high | 45 | 5.8 ± 3.6 | |
| Preference for fast food‡ | .23 | ||
| Low | 15 | 6.2 ± 3.4 | |
| Medium | 70 | 6.5 ± 3.8 | |
| High | 33 | 5.5 ± 3.7 | |
| Very high | 6 | 9.7 ± 5.0 | |
| Preference for greasy food† | .46 | ||
| Low | 5 | 6.6 ± 4.9 | |
| Medium | 21 | 6.1 ± 3.3 | |
| High | 70 | 6.0 ± 3.5 | |
| Very high | 28 | 7.4 ± 4.7 | |
| Preference for eating outside† | .36 | ||
| Low | 11 | 7.6 ± 4.5 | |
| Medium | 17 | 6.4 ± 3.5 | |
| High | 44 | 5.6 ± 3.8 | |
| Very high | 52 | 6.7 ± 3.8 | |
| Watching television while eating‡ | .40 | ||
| Rarely | 15 | 8.3 ± 4.7 | |
| Sometimes | 17 | 6.4 ± 4.1 | |
| Often | 41 | 5.8 ± 3.8 | |
| Always | 38 | 6.3 ± 3.4 | |
| Level of bulimia† | .65 | ||
| Low | 7 | 8.1 ± 3.6 | |
| Medium | 23 | 6.2 ± 3.4 | |
| High | 80 | 6.3 ± 4.0 | |
| Very High | 14 | 6.4 ± 3.3 | |
| Level of impulsive eating‡ | .15 | ||
| Low | 7 | 9.4 ± 3.8 | |
| Medium | 36 | 5.7 ± 4.0 | |
| High | 57 | 6.6 ± 3.8 | |
| Very high | 23 | 5.9 ± 3.4 | |
| Level of restrained eating‡ | .63 | ||
| Low | 49 | 5.9 ± 3.7 | |
| Medium | 47 | 6.9 ± 4.1 | |
| High | 14 | 6.7 ± 4.0 | |
| Very high | 9 | 6.2 ± 3.6 | |
| Level of emotional eating† | .33 | ||
| Low | 8 | 6.3 ± 2.6 | |
| Medium | 30 | 6.1 ± 3.3 | |
| High | 42 | 5.7 ± 3.9 | |
| Very high | 42 | 7.2 ± 4.3 | |
| Number of obese family members‡ | .41 | ||
| 0 | 33 | 6.8 ± 4.7 | |
| 1 | 33 | 7.0 ± 3.7 | |
| 2 | 32 | 5.4 ± 3.6 | |
| ≥ 3 | 12 | 6.4 ± 2.6 |
Student t-test was performed.
Analysis of variance was performed.
Kruskal-Wallis test was performed.
Weight loss data are all presented in the form of mean ± SD.
4. Discussion
This is the first study of Asian populations based on real-world data for liraglutide 3.0 mg, prescribed to overweight and obese South Korean patients. The average weight loss ± SD was 3.8% ± 2.1 at 30 days after treatment initiation (n = 67), 5.3% ± 2.6 at 60 days (n = 111), 7.5% ± 2.9 at 90 days (n = 53), and 9.1% ± 3.6 at 180 days (n = 51). The average follow-up days were 73.7 days, and the total study period was a year.
With respect to other studies, a randomized controlled trial, a Spanish real-world data study, and a Canadian real-world data study reported percentages of patients with ≥5% weight loss of 63.2%, 64.7%, and 64.1% and percentages of patients who achieved ≥10% weight loss of 33.1%, 20.0%, and 34.5%, respectively.[10,12,19] In our study, 61.54% and 17.16% of subjects showed ≥5% and ≥10% body weight reduction, respectively, at their final visit within our study period. Thus, weight loss was evident in real-world South Korean populations as well, which is consistent with clinical trial settings and real-world Western data.
In this study, the baseline average BMI ± SD was 30.8 ± 3.5 kg/m2, which was lower than that in previous studies of liraglutide for Western obese populations, which had an average BMI over 38.[10–12] However, the data about the effect of liraglutide in slightly obese patients, such as those with obesity class I (BMI 30.0 – 34.9) and overweight (BMI 25.0–29.9), were not clearly defined. In Asian populations, people with relatively lower BMI values can be obese; thus, the international classification of obesity defines BMI ≥ 25 as obese for Asian populations.[20] We found that those with 27 ≤ BMI < 30, 30 ≤ BMI < 33, and 33 ≤ BMI achieved statistically similar weight loss (6.7%, 6.2%, and 6.4%, respectively). Thus, this study shows that weight loss was still evident in real-world data despite the lower BMI criteria for Asian populations.
The observed weight loss in fat mass was conspicuously larger than that observed in muscle mass. We excluded the data collected within 30 days, as factors such as partial dehydration due to decreased food consumption could cause unnecessary noise.[21] Notably, the mean fat weight loss was significantly greater than muscle weight loss (P = .02). Previous studies in Japanese patients also reported that liraglutide treatment with a dose of 0.9 mg reduced body fat (–10.9%) but did not significantly change skeletal muscle mass.[22] For Italian populations prescribed liraglutide at a dose of 3.0 mg, no significant difference was observed in relative skeletal muscle mass (+0.07%), whereas a significant decrease in fat mass was observed (–1.45%).[23] However, the decrease in skeletal muscle mass in our study may have occurred due to relatively higher weight loss in our study and less encouraging exercise during treatment periods than clinical trials.
As for predictive factors for weight loss via liraglutide, no statistically significant factor was found in this study. Age, sex, initial BMI, HbA1c level, and lifestyle were not significantly associated with final weight loss. Liraglutide was first introduced as an antidiabetic medication, as weight reduction leads to the delay of diabetes.[24] The effect of liraglutide on the population without diabetes was a problem of concern. In this study, groups with HbA1c ≤ 5.6%, 5.7% ≤ HbA1c ≤ 6.4%, 6.5% ≤ HbA1c showed no significant difference in the percentage of weight loss (6.5%, 6.4%, 6.6%, respectively, P > .99). Behavioral factors also did not significantly affect final weight loss (%). Therefore, the effect of liraglutide seems to be robust regardless of differences in physical or behavioral factors.
Because of the high cost of liraglutide treatment, an early predictive factor for the effect of liraglutide is required in a real-world setting. However, early response indices, such as weight loss in re-prescription dates within 30-days and 60-days after the first prescription, were not significant for predicting 180-day weight loss in our study. Previous studies have shown that ≥4% weight loss after 16 weeks of liraglutide treatment can strongly predict clinically meaningful weight loss at 56 weeks.[18] In this study, we also found that those with weight loss over 5% at 30-days and 60-days showed significantly higher final weight loss during the study period than those with weight loss not more than 5% (P < .001) (Sup 2A, 2B, http://links.lww.com/MD/F494). However, higher compliance of earlier responders may account for these findings. Prospective studies to find early predictive factors are needed.
Alcohol consumers showed a trend of achieving less weight loss compared with those who did not drink alcohol (P = .08). We can assume that patients can be informed that restriction of alcohol drinking may be helpful in weight loss during liraglutide treatment, although GLP-1 analogs are known to decrease alcohol intake and reduce the activation of the nervous system by alcohol.[25] However, there are limits to what we can conclude, as we did not inquire about the type and amount of alcohol consumed by each patient or the drinking behavior during treatment.
We also observed that there were more patients with a higher frequency of eating breakfast, and there was a trend in which those who had a higher frequency of eating breakfast showed lower weight loss (P = .07, post trend analysis P = .01). In this study, the patients were recommended to inject their liraglutide dose in the morning. The elimination half-life of liraglutide 3.0 mg is 13 hours, and liraglutide can reach a plateau with once-daily subcutaneous administration at a dose of 3.0 mg.[9,26] One possible explanation is that our study period may have been too short for patients to reach this plateau, and therefore the ability to control the amount or frequency of breakfast may have decreased. However, the effect of liraglutide tended to be greater in patients who skipped breakfast. Further research is needed to determine the effect of limiting breakfast during liraglutide treatment, such as combining liraglutide with time-restricted eating.
Our study has some limitations. First, patients were recommended to visit the clinic once a month and reach a dose of 3.0 mg, but as this was a real-world environment,[27] the prescription was not always exactly followed, and we cannot confirm that the 3.0 mg dose was always initiated at the planned date. However, our study was performed in a single clinic, with relative consistency in treating and educating patients. Second, there were missing data at the 30-, 60-, 90-, and 180-day time points. In our study, the number of patients who visited for 60 days was greater than 30 days. This was because we prescribed 5 liraglutide pens (1 box) to our patients at the first visit, and some patients did not come to the 30-day check-up because they had leftover doses, and came back for re-prescription after 60 days. To consider the effects of missing data, we performed generalized linear model analysis. Third, we did not know the exact final weight because patients were weighed on the day that they were last prescribed liraglutide. Fourth, some of the patients had not yet reached the 180-day follow-up within our study period because several patients started treatment relatively recently. The study period began the first year after liraglutide was introduced as an antiobesity drug. Further studies with longer-term data collection after treatment initiation are needed. Also, those who had other diseases or were prescribed other drugs were not completely tracked. However, during the study periods, combination of other antiobesity drugs or supplements was prohibited by the doctors. Finally, this was a retrospective study in a real-world situation; therefore, questionnaires for behavioral data were not developed for clinical study purposes, so the validation of questionnaires was limited. Data regarding changes in behavioral characteristics during the study period were not collected, and adverse effects were also not examined. (Suppfig, http://links.lww.com/MD/F494).
In conclusion, liraglutide treatment led to meaningful weight loss in real-world South Korean patients. This study showed that liraglutide can have a positive effect in Asian populations, with patients with relatively small BMI and patients with low HbA1c levels showing no significant difference with patients with relatively high BMI and patients with high HbA1c levels, respectively. A significantly greater weight loss in fat mass than muscle mass was also observed, which may imply a positive metabolic effect. Furthermore, longer treatment with liraglutide showed greater clinical effectiveness.
Author contributions
This study was designed, directed and coordinated by C. Lee and H. J. Choi, as the principal investigator. Data collection and analysis was conducted by J. Kwon and J. S. Park. The manuscript was written by J. S. Park and C. Lee. Manuscript revision/review and final version approval, all authors.
Glossary
Abbreviations: BMI = body mass index, GLP-1 = Glucagon-like peptide-1, SD = standard deviation, P-value = probablility value.
References
- [1].Heymsfield SB, Wadden TA. Mechanisms, pathophysiology, and management of obesity. N Engl J Med 2017;376:254–66. [DOI] [PubMed] [Google Scholar]
- [2].Poobalan AS, Aucott LS, Smith WC, et al. Long-term weight loss effects on all cause mortality in overweight/obese populations. Obes Rev 2007;8:503–13. [DOI] [PubMed] [Google Scholar]
- [3].Wright F, Boyle S, Baxter K, et al. Understanding the relationship between weight loss, emotional well-being and health-related quality of life in patients attending a specialist obesity weight management service. J Health Psychol 2013;18:574–86. [DOI] [PubMed] [Google Scholar]
- [4].Dombrowski SU, Knittle K, Avenell A, et al. Long term maintenance of weight loss with non-surgical interventions in obese adults: systematic review and meta-analyses of randomised controlled trials. BMJ 2014;348:g2646. [DOI] [PMC free article] [PubMed] [Google Scholar]
- [5].Wing RR, Phelan S. Long-term weight loss maintenance. Am J Clin Nutr 2005;82: (1 Suppl): 222s–5s. [DOI] [PubMed] [Google Scholar]
- [6].Bray GA. Why do we need drugs to treat the patient with obesity? Obesity (Silver Spring) 2013;21:893–9. [DOI] [PubMed] [Google Scholar]
- [7].Saltiel AR. New therapeutic approaches for the treatment of obesity. Sci Transl Med 2016;8:323rv2. [DOI] [PubMed] [Google Scholar]
- [8].van Can J, Sloth B, Jensen CB, Flint A, Blaak EE, Saris WH, et al. Effects of the once-daily GLP-1 analog liraglutide on gastric emptying, glycemic parameters, appetite and energy metabolism in obese, non-diabetic adults. Int J Obes (Lond) 2014;38:784–93. [DOI] [PMC free article] [PubMed] [Google Scholar]
- [9].Scott LJ. Liraglutide: a review of its use in the management of obesity. Drugs 2015;75:899–910. [DOI] [PubMed] [Google Scholar]
- [10].Pi-Sunyer X, Astrup A, Fujioka K, et al. A randomized, controlled trial of 3.0 mg of liraglutide in weight management. N Engl J Med 2015;373:11–22. [DOI] [PubMed] [Google Scholar]
- [11].Wadden TA, Hollander P, Klein S, et al. Weight maintenance and additional weight loss with liraglutide after low-calorie-diet-induced weight loss: the SCALE maintenance randomized study. Int J Obes (Lond) 2013;37:1443–51. [DOI] [PubMed] [Google Scholar]
- [12].Wharton S, Liu A, Pakseresht A, et al. Real-world clinical effectiveness of liraglutide 3.0 mg for weight management in Canada. Obesity (Silver Spring) 2019;27:917–24. [DOI] [PMC free article] [PubMed] [Google Scholar]
- [13].Worldwide trends in body-mass index, underweight, overweight, and obesity from 1975 to 2016: a pooled analysis of 2416 population-based measurement studies in 128.9 million children, adolescents, and adults. Lancet. 2017;390 (10113):2627–42. [DOI] [PMC free article] [PubMed] [Google Scholar]
- [14].Chan JC, Malik V, Jia W, et al. Diabetes in Asia: epidemiology, risk factors, and pathophysiology. JAMA 2009;301:2129–40. [DOI] [PubMed] [Google Scholar]
- [15].Appropriate body-mass index for Asian populations and its implications for policy and intervention strategies. Lancet. 2004;363(9403):157–63. [DOI] [PubMed] [Google Scholar]
- [16].Yang SW, Kim TH, Choi HM. The reproducibility and validity verification for body composition measuring devices using bioelectrical impedance analysis in Korean adults. J Exerc Rehabil 2018;14:621–7. [DOI] [PMC free article] [PubMed] [Google Scholar]
- [17].Mancini MC, de Melo ME. The burden of obesity in the current world and the new treatments available: focus on liraglutide 3.0 mg. Diabetol Metab Syndr 2017;9:44.doi: 10.1186/s13098-017-0242-0. [DOI] [PMC free article] [PubMed] [Google Scholar]
- [18].Fujioka K, O’Neil PM, Davies M, et al. Early weight loss with liraglutide 3.0 mg predicts 1-year weight loss and is associated with improvements in clinical markers. Obesity (Silver Spring) 2016;24:2278–88. [DOI] [PMC free article] [PubMed] [Google Scholar]
- [19].Gorgojo-Martinez JJ, Basagoiti-Carreno B, Sanz-Velasco A, et al. Effectiveness and tolerability of orlistat and liraglutide in patients with obesity in a real-world setting: the XENSOR Study. Int J Clin Pract 2019;73:e1339.doi: 10.1111/ijcp.1339. [DOI] [PubMed] [Google Scholar]
- [20].Fan JG, Kim SU, Wong VW. New trends on obesity and NAFLD in Asia. J Hepatol 2017;67:862–73. [DOI] [PubMed] [Google Scholar]
- [21].Lykkegaard K, Larsen PJ, Vrang N, et al. The once-daily human GLP-1 analog, liraglutide, reduces olanzapine-induced weight gain and glucose intolerance. Schizophr Res 2008;103:94–103. [DOI] [PubMed] [Google Scholar]
- [22].Ishii S, Nagai Y, Sada Y, et al. Liraglutide reduces visceral and intrahepatic fat without significant loss of muscle mass in obese patients with type 2 diabetes: a prospective case series. J Clin Med Res 2019;11:219–24. [DOI] [PMC free article] [PubMed] [Google Scholar]
- [23].Rondanelli M, Perna S, Astrone P, Grugnetti A, et al. Twenty-four-week effects of liraglutide on body composition, adherence to appetite, and lipid profile in overweight and obese patients with type 2 diabetes mellitus. Patient Prefer Adher 2016;10:407–13. [DOI] [PMC free article] [PubMed] [Google Scholar]
- [24].Oh TJ. The role of anti-obesity medication in prevention of diabetes and its complications. J Obes Metab Syndr 2019;28:158–66. [DOI] [PMC free article] [PubMed] [Google Scholar]
- [25].Jerlhag E. GLP-1 signaling and alcohol-mediated behaviors; preclinical and clinical evidence. Neuropharmacology 2018;136(Pt B):343–9. [DOI] [PubMed] [Google Scholar]
- [26].Pastor R, Tur JA. Liraglutide for the treatment of obesity: analyzing published reviews. Curr Pharm Des 2019;25:1783–90. [DOI] [PubMed] [Google Scholar]
- [27].Lin KJ, Schneeweiss S. Considerations for the analysis of longitudinal electronic health records linked to claims data to study the effectiveness and safety of drugs. Clin Pharmacol Ther 2016;100:147–59. [DOI] [PubMed] [Google Scholar]