

Summary
Single cell sequencing technologies, including transcriptomic and epigenomic assays, are transforming our understanding of the cellular building blocks of neural circuits. By directly measuring multiple molecular signatures in thousands to millions of individual cells, single cell sequencing methods can comprehensively characterize the diversity of brain cell types. These measurements uncover gene regulatory mechanisms that shape cellular identity and provide insight into developmental and evolutionary relationships between brain cell populations. Single cell sequencing data can aid the design of tools for targeted functional studies of brain circuit components, linking molecular signatures with anatomy, connectivity, morphology and physiology. Here, we discuss the fundamental principles of single cell transcriptome and epigenome sequencing, integrative computational analysis of the data, and key applications in neuroscience.
Keywords: Single cell sequencing, Transcriptome, Epigenome, DNA methylation, ATAC-seq, Open chromatin, Cell type, Spatial transcriptomics, Multi-omics, Cell state
Graphical Abstract
eTOC/In Brief:
Sequencing the transcriptomes and epigenomes of single cells enables deep molecular characterization of brain cells with high throughput. Armand, Li, Xie et al. review the key experimental principles and computational methods and discuss recent landmark applications in neuroscience.
Introduction
Brain cells are complex biological machines whose function is defined at the molecular level by conserved gene expression programs. Understanding the molecular identity of neural cell types requires measuring thousands of genes to uncover fine-grained distinctions between cells. At the same time, a large sample of cells is required to capture rare types and accurately assess heterogeneity. Fine-grained analysis using many genes and broad scope of coverage for many cells have often been viewed as mutually exclusive goals: experiments typically probe many molecular signatures in a limited number of samples or target a small number of genes in a large number of samples. In this Primer, we describe how high-throughput single-cell sequencing assays enable high-resolution, broad-scope analysis of brain cell types.
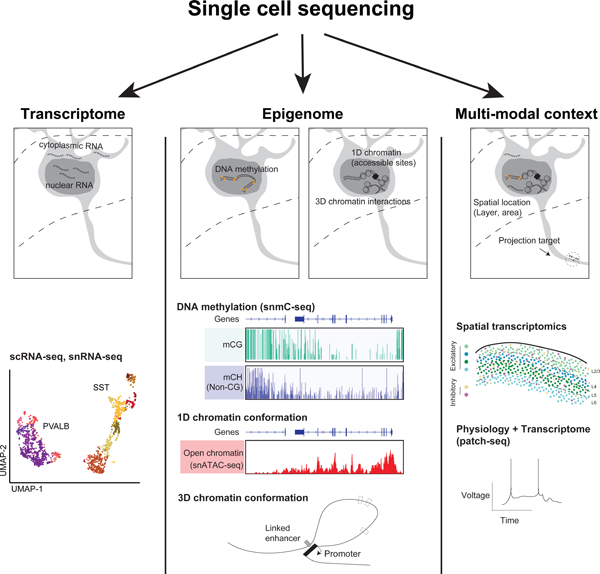
Sequencing DNA and/or RNA quantifies the information-bearing molecules that encode and enact each cell’s biological identity. The abundance of RNA molecules defines the transcriptome, while chemical modifications of DNA and histone proteins along with the physical conformation of DNA within the nucleus define the epigenome (Fig. 1a). The interaction among thousands of genes and hundreds of thousands of gene regulatory DNA sequence elements gives rise in each cell to one of hundreds of robust cellular phenotypes. Neuroscience is fundamentally oriented toward understanding information processing in biological networks, and computational- and systems-neuroscientists seek to understand the emergence of complex adaptive behavior. It is thus natural that neuroscientists recognize the opportunity to use fine-grained, broad-scope single cell sequencing data to advance understanding of the transcriptomic and epigenomic identity of brain cell types.
Figure 1.

Single cell sequencing modalities for neuroscience. (A) Transcriptome and epigenome signatures that can be assayed by single cell sequencing, alongside spatial context, connectivity, and physiology. (B) Comparison of single-cell molecular assays in terms of the number of cells (scope, x axis) and number of unique molecules characterized per cell (depth, y axis). Below: spatial resolution for imaging and spatial transcriptomics. Shaded boxes show the range of values achieved in recent single-cell studies of brain cells. The estimated number of cells in an adult human brain (Azevedo et al., 2009) or mouse brain (Erö et al., 2018), the typical size of a neuronal cell body (Zhang et al., 2020a), and the estimated number of mRNA molecules in a mammalian cell (Shapiro et al., 2013) are indicated for comparison.
We focus on the fundamental principles that define the resolution and scope of single cell transcriptome and epigenome sequencing; recent reviews provide more technical introductions to specific technologies (Luecken and Theis, 2019; Rostom et al., 2017; Stuart and Satija, 2019; Zhu et al., 2020) and applications to neurobiology (Fishell and Kepecs, 2019; Huang and Paul, 2019; Tosches and Laurent, 2019; Zeng and Sanes, 2017). We also describe key computational techniques for analyzing and interpreting single cell sequencing data. Although some bioinformatic methods may be unfamiliar to neuroscientists, many computational techniques used for electrophysiology and microscopy data also play a prominent role in single-cell sequencing. Indeed, computational neuroscience has a distinct perspective on understanding complex biological datasets compared with the field of bioinformatics (De Schutter, 2008), emphasizing synthetic modeling rather than hypothesis testing. We believe that this neuroscience perspective can inspire new ways of understanding the rich information provided by single cell genomics.
1. Single cell sequencing samples the cell’s information-bearing molecules
Until recently, analysis of RNA and DNA in brain tissue was largely limited to bulk assays of the average composition of a tissue. By making a molecular smoothie, bulk assays destroy the association of transcripts or DNA modifications with individual cells and may fail to detect rare cell type signatures. Gene expression signatures of one cell type may be masked by complementary patterns in other cell types. Techniques for purifying whole cells or nuclei from specific cell populations can partially overcome these limitations. Yet, these require highly selective RNA or protein markers or genetic tools (e.g. mouse CRE lines), and can only be applied to previously characterized cell types.
Single-cell sequencing technologies measure RNA or DNA from individual cells without the need for selective cell purification. These techniques can be summarized by three characteristics: scope (number of cells), granularity (number of genes or epigenetic features), and spatial resolution (Fig. 1b). Moreover, single cell technologies measure different types of RNA transcripts or epigenetic modifications. Although single cell sequencing does not require cell purification, it does rely on high-quality primary or frozen tissue obtained from careful expert dissection of neuroanatomical regions.
The transcriptome of mammalian cells consists of 105–106 individual messenger RNA (mRNA) molecules (Shapiro et al., 2013). These messages represent some 4,000–12,000 different genes per cell (Yao et al., 2020a), including many distinct mRNA isoforms encoding multiple variants of each gene. Although post-transcriptional regulation is complex, the number of mRNA transcripts in a cell correlates with the abundance of the encoded protein and is thus a signature of cell identity and function (Liu et al., 2016).
Single cell epigenome assays measure DNA methylation, chromatin accessibility and/or chromatin conformation. These chemical and physical modifications of DNA are established during development and regulate gene expression through the lifespan. Whereas the transcriptome is a snapshot of gene expression, reflecting in part the cell’s state and the impact of neural activity around the time of tissue collection (Hrvatin et al., 2018), epigenetic marks include both transient and stable modifications of long-lived chromatin components. Epigenomic data also reveal cis-regulatory elements such as enhancers that establish and maintain cell type-specific gene expression.
Together, single cell transcriptome and epigenome sequencing constitute a powerful toolkit for understanding the brain’s cellular components, enabling functional studies of the roles of specific cell types in healthy and diseased brains.
2. Single cell transcriptomes
Single-cell mRNA sequencing (scRNA-seq) initiated a new era of molecular studies of brain cell types (Darmanis et al., 2015; Macosko et al., 2015; Tasic et al., 2016; Zeisel et al., 2015). Like bulk RNA-Seq, scRNA-Seq performs reverse transcription using mRNA molecules as the template to synthesize complementary DNA (cDNA). Next-generation sequencing (NGS) libraries are generated by amplifying cDNA, followed by fragmentation, additional amplification, and quantification by NGS.
2a. Plates and droplets
Individual cells or nuclei can be physically separated using plate-based cell sorting or droplets. Plate-based methods distribute individual cells or groups of cells into wells using fluorescence-activated cell sorting (FACS) (Tasic et al., 2016) or microscope-guided capillary pipettes (Paul et al., 2017). Droplet-based methods segregate cells into individual aqueous compartments in a lipid suspension (Macosko et al., 2015). Cells are lysed within droplets and mRNA molecules are reverse-transcribed and tagged with oligonucleotide barcodes that uniquely identify the cell. Droplet-based scRNA-seq is efficient due to the small reaction volume, and rapidly processes thousands of cells by continuous flow in microfluidic devices.
An alternative to physically isolating cells is multiplexed sequencing of cDNA indexed with unique combinations of cell-specific barcodes (Rosenberg et al., 2018). Groups of cells are distributed into wells and tagged with well-specific barcodes, then pooled, re-split, and tagged with another barcode. By repeatedly pooling, splitting and tagging, cells acquire random barcode combinations. The number of cells per pool can be adjusted to ensure most cells have a unique barcode combination with high probability. The cDNA from all cells is then pooled and sequenced, and data computationally demultiplexed. Combinatorial indexing and droplet-based methods have higher throughput and lower cost per cell, whereas plate-based methods provide more sensitive gene detection and are more customizable (Ziegenhain et al., 2017).
Importantly, these strategies differ in how they quantify mRNA abundance (Fig. 2A). Droplet-based scRNA-Seq methods count the 5’ or 3’ ends of mRNA molecules, incorporating unique molecular identifiers (UMIs) to avoid double-counting PCR products of the same molecule (Kivioja et al., 2011). These data do not distinguish mRNA isoforms that share the same promoter (5’ end) or transcription termination site (3’ end). By contrast, plate-based strategies can sequence fragments of full-length transcripts, including internal fragments covering all expressed exons and splice junctions (Gupta et al., 2018; Tasic et al., 2016). These methods have shown that isoform usage differs between brain cell types. By combining full-transcript sequencing with UMIs, thousands of unique mRNA molecules can be reconstructed in single cells (Hagemann-Jensen et al., 2020).
Figure 2.

Single cell transcriptomics applications in neuroscience. (A) The mouse gene Tac1, encoding the neuropeptide precursor Tachykinin-1 which is a specific marker of a subset of MGE-derived GABAergic neurons in cortex (Yao et al., 2020a), has five isoforms with different promoters, exon usage, and end sites (black gene models). Schematic tracks illustrate full-length RNA-sequencing (red) or 3’-end tagging (blue). (B) Hierarchical clustering of cell types in human medial temporal gyrus adapted from (Hodge et al., 2019), focusing on medial ganglionic eminence (MGE)-derived GABAergic interneurons. Branches from other cell classes truncated to (double-slash). CGE: caudal ganglionic eminence. (C) A two-dimensional embedding of 2,260 single nucleus transcriptomes computed using Uniform Manifold Approximation and Projection (UMAP) (McInnes et al., 2018). Each point represents one cell, and the arrangement of cells is an approximate representation of their degree of similarity (nearby points) or difference (distant points). Points are colored according to the cell type clusters from (B) (arrows). Rare subpopulations of SST CHODL and Chandelier cells are circled. (D) Violin plots show expression of marker genes in MGE-derived interneurons.
2b. Single cells and single nuclei
The intricate network of dendrites, axons and glial processes in brain tissues present multiple challenges for scRNA-seq. Distal cellular compartments contain a substantial population of mRNAs, which enable dendritic protein synthesis (Cajigas et al., 2012; Tushev et al., 2018). Yet, these transcripts are largely lost following dissection and cell dissociation. Because all transcripts originate in the nucleus, scRNA-seq can still capture newly synthesized dendritic and axonal mRNAs in the nucleus or soma before transport to distal cell compartments.
Moreover, scRNA-seq cannot be applied to frozen human post-mortem brain tissue, since cell membranes are ruptured during freezing. An alternative is to isolate and sequence RNA from single nuclei (snRNA-seq) (Grindberg et al., 2013). Nuclear transcripts comprise ~20%−50% of all the RNA in the cell (Bakken et al., 2018), including immature and unspliced RNA molecules containing introns (Fig. 2a). Despite this, snRNA-seq provides robust markers of brain cell types (Ding et al., 2020; Lake et al., 2017) with resolution comparable to scRNA-seq (Bakken et al., 2018; Yao et al., 2020a). Dendritic transcripts may be separately detected in single cells by manual microdissection (Middleton et al., 2019).
snRNA-Seq data may be less affected by some technical artifacts than scRNA-Seq. Because nuclei are relatively uniform in size and morphology, snRNA-seq is more likely than scRNA-seq to capture an unbiased sample of all cell types. Some cells, such as cortical layer 5 pyramidal tract neurons, may be more likely to die during cell isolation for scRNA-seq (Tasic et al., 2018). Moreover, snRNA-seq is less susceptible to spurious activation of gene expression during tissue dissection and cell isolation (Lacar et al., 2016), although this can be mitigated with a transcription inhibitor (Wu et al., 2017).
The technical differences between sc and snRNA-seq call for care in data analysis and interpretation. Differential expression in sc vs. snRNA data may reflect the localization of transcripts, such as the highly abundant nuclear-localized non-coding RNA Malat1 that regulates RNA splicing among other functions (Bakken et al., 2018; Yao et al., 2020a). While scRNA-seq data are analyzed by mapping sequenced fragments to exons, snRNA-seq data analysis should also consider the abundance of intronic reads from pre-mRNA, which may account for >75% of fragments (Bakken et al., 2018; Gaidatzis et al., 2015). Indeed, the distinct information in exonic vs. intronic reads can be used to estimate changes in mRNA expression over time (Bergen et al., 2020; La Manno et al., 2018).
2c. Neuroscience applications of single cell transcriptomics
Cell type discovery and characterization
Single cell technologies have transformed our understanding of the diversity of brain cell types. Dozens of morphologically and functionally distinct brain cell types have been recognized, but traditional methods of microscopy and physiology have limited scope for comprehensively characterizing cell types in mammalian brain circuits with millions of cells. Recent scRNA-seq studies sampled >20,000–750,000 cells in individual mouse brain regions (Kozareva et al., 2020; Shekhar et al., 2016; Tasic et al., 2018; Yao et al., 2020a). Broader surveys have covered multiple regions in both the central and peripheral nervous systems of mouse (Marques et al., 2016; Saunders et al., 2018; Zeisel et al., 2018) with as many as 1.2 million cells comprising 379 cell types (Yao et al., 2020b). These are not yet comprehensive, and additional coverage is needed especially in subcortical regions. The largest individual sc/snRNA-seq datasets represent ~1% of the ~100 million neuronal and glial cells in the adult mouse brain.
The human brain, with ~1000 times more neuronal cells than the mouse brain (Azevedo et al., 2009), is more daunting to sample comprehensively. Single-nucleus transcriptomes from multiple regions of the human brain have established cell type taxonomies (Fig. 2B–D) (Darmanis et al., 2015; Habib et al., 2017; Lake et al., 2016). Comparing human with mouse and non-human primates reveals both conserved and distinct cell type signatures, including species-specific differences in the proportions of cell populations and in gene expression within homologous cell classes and types (Bakken et al., 2020; Hodge et al., 2019; Krienen et al., 2020). sc/snRNA-seq also provides insight into the diversity of glial cells including the oligodendrocyte lineage (Marques et al., 2016) and functional states of microglia (Masuda et al., 2019).
A recurring theme from single-cell studies of the brain is the greater diversity of glutamatergic vs. GABAergic neurons across brain regions (Tasic et al., 2018; Yao et al., 2020b; Zeisel et al., 2015) or species (Bakken et al., 2020; Lake et al., 2016). This is also supported by single cell DNA methylation data (see below) (Luo et al., 2017). Cortical excitatory neuron transcriptomes may be more heterogeneous due to their developmental origin spread across the dorsal telencephalon, compared with GABAergic populations that originate in the ganglionic eminences and migrate to cortex (Mayer et al., 2018).
scRNA-Seq has also been applied in non-mammalian brains, illuminating basic questions about development, cell regulation and aging. The transcriptomes of Drosophila olfactory projection neurons targeting different glomeruli are distinct during development but very similar in the adult (Li et al., 2017). Aging dramatically reduces the amount of RNA in Drosophila brain cells (Davie et al., 2018). Correlations in gene expression across 52 transcriptomic cell types in the Drosophila optic lobe support a model of phenotypic convergence, in which multiple transcription factors regulate the same set of effector genes (Konstantinides et al., 2018). In the zebrafish brain, distinct neural stem cell populations were differentially affected by amyloid toxicity in an Alzheimer’s disease model (Cosacak et al., 2019).
Development and plasticity
scRNA-seq reveals how neuronal and glial cell type identities emerge in developing mouse (Mayer et al., 2018; Telley et al., 2019; Tiklová et al., 2019) and human brain (Li et al., 2018; Nowakowski et al., 2017; Pollen et al., 2015), and even across whole organisms (Farrell et al., 2018). sc/snRNA-seq is particularly suited to studying brain development, because critical stem cell and neural progenitor populations may be transient and difficult to isolate without prior knowledge of specific molecular markers. scRNA-seq at multiple timepoints can reconstruct developmental trajectories, revealing the dynamics of transcription factors and downstream effectors regulating specialized neural populations (Di Bella et al., 2020; La Manno et al., 2020; Zhong et al., 2018, 2020). Differentiation trajectories of newborn neurons and oligodendrocytes in adults can also be reconstructed (Habib et al., 2016; Marques et al., 2016). An exciting frontier is the combination of sc/snRNA-seq with lineage tracing by artificial labeling (Raj et al., 2018) or using natural somatic mutations shared by cells within a lineage (Huang et al., 2020).
In addition to developmental dynamics, changes in gene expression due to neural activity and plasticity can be assessed by sn/scRNA-seq, as shown for visual cortical neurons following light exposure (Hrvatin et al., 2018). Moreover, analyzing activity-regulated genes can identify active cells (Hu et al., 2017). Given the key role of activity- and calcium signaling-dependent gene regulation in synaptic plasticity, single cell techniques will be essential for understanding the cell type-specific context of transcriptome dynamics.
The role of cell types in disease
Transcriptomic signatures of disease can be studied by snRNA-seq applied to post-mortem brain tissue from patients. By performing snRNA-seq in >80,000 single nuclei from 48 individuals with Alzheimer’s disease (AD) pathology (Mathys et al., 2019), many more differentially expressed (DE) genes were detected in individual cell types than bulk tissue. In particular, gene dysregulation in glial cells was detected in snRNA-seq, but not bulk RNA-seq, due to the relatively low contribution of glia to the total RNA in the tissue. snRNA-seq has been applied to brain tissue from patients with disorders including AD (Grubman et al., 2019; Zhou et al., 2020), major depression (Nagy et al., 2020), autism (Velmeshev et al., 2019), Rett syndrome (Renthal et al., 2018) and multiple sclerosis (Schirmer et al., 2019).
Notably, disease studies have focused on a relatively modest number of transcriptomic or epigenomic clusters corresponding to cell classes, not individual types. Dissecting the contributions of fine-grained cell types to disease is important but challenging, as biases in the computational assignment of single cells to clusters could significantly impact the findings.
3. Single cell epigenomes
Stable patterns of gene expression are maintained partly through epigenetic modifications of DNA, such as genomic cytosine methylation, and of histone proteins. These marks impact gene expression by directing the binding of transcription factor proteins (TF) to specific genomic regions, which can enhancer or reduce transcription of nearby or distal genes. Whereas individual mRNA molecules are relatively transient messengers with a half-life on the order of minutes to hours (Chen et al., 2008), covalent modifications of DNA and some histone proteins in post-mitotic neurons can persist for months to years (Maze et al., 2015). Yet, parts of the chromatin landscape can also be flexibly reconfigured following neuronal activity (Su et al., 2017). The dynamic regulation of the epigenome across brain cell types and through the lifespan establishes and maintains cell identity, and may support plasticity and behavior. Single cell epigenomes complement transcriptomes, providing insight into cell type-specific gene expression regulation.
Like snRNA-seq, epigenomic assays can be applied to dissociated nuclei obtained from frozen and archived post-mortem tissue. These methods assess the whole genome, including non-protein coding regions that comprise over 95% of the genome. Non-coding regions contain millions of candidate cis-regulatory elements (cCREs) that influence gene expression, including promoters and enhancers (Nord and West, 2019; Roadmap Epigenomics Consortium et al., 2015). cCREs are defined by open chromatin, low levels of DNA methylation, and physical interactions with gene promoters via the 3-dimensional conformation of DNA in the nucleus.
Identifying cell type-specific enhancers can guide development of viral vectors and transgenic lines targeting cell types for functional studies (Graybuck et al., 2019; Hrvatin et al., 2019). In the future, it will be interesting to investigate dynamic regulation of the epigenome, including developmental trajectories (Trevino et al., 2020) and neuronal activity dependent modifications of the genome during learning and memory (Day et al., 2013), at the single cell level.
3a. DNA methylation
In mammals, genomic cytosine can be covalently modified by a methyl group. Methylcytosine (mC) is frequently found at CG dinucleotides, where it often correlates with transcriptional repression. DNA methylation in brain cells has two unique features compared with other cells (Kinde et al., 2015). First, neurons have high levels of hydroxymethylcytosine (hmC), a derivative of mC that may have distinct functional roles (Kriaucionis and Heintz, 2009; Mellén et al., 2017). Second, neurons accumulate substantial mC at non-CG sites, primarily CA and CT dinucleotides, during postnatal development (Lister et al., 2013; Xie et al., 2012). The pattern of DNA mC and hmC at nearly 1 billion CG and non-CG sites throughout the genome is a rich signature of cell type-specific gene regulation in neurons and glia (Kozlenkov et al., 2018; Mo et al., 2015).
DNA methylation can be measured in single cells by plate-based sorting of individual nuclei, followed by bisulfite conversion of DNA and multiplexed sequencing (Luo et al., 2017; Mulqueen et al., 2018; Smallwood et al., 2014), capturing up to ~30% of the genome per cell (Luo et al., 2018a). Sodium bisulfite treatment converts cytosine to uracil, while methylcytosine is protected from conversion; sequencing the bisulfite-converted DNA fragments reveals the methylation status at each cytosine position. This technique produced over 110,000 single cell DNA methylomes from 45 mouse brain regions (Liu et al., 2020), identifying ~161 fine-grained neuronal cell types across the cortex, striatum, and olfactory areas. Each neuron population has unique DNA methylation signatures at gene bodies, which largely correlate with gene expression, as well as thousands of small (100–500 base-pair) differentially methylated regions (DMRs) which define cCREs (Fig. 3b). Droplet-based bisulfite chemistry could potentially increase the efficiency of single cell DNA methylome profiling, but the high cost of whole-genome compared with transcriptome sequencing would remain a factor limiting the application of this technique to substantially larger numbers of cells. In the future, single cell analysis of hydroxymethylation will elucidate the relative amount of mC and hmC in neuronal cell types (Mooijman et al., 2016).
Figure 3.
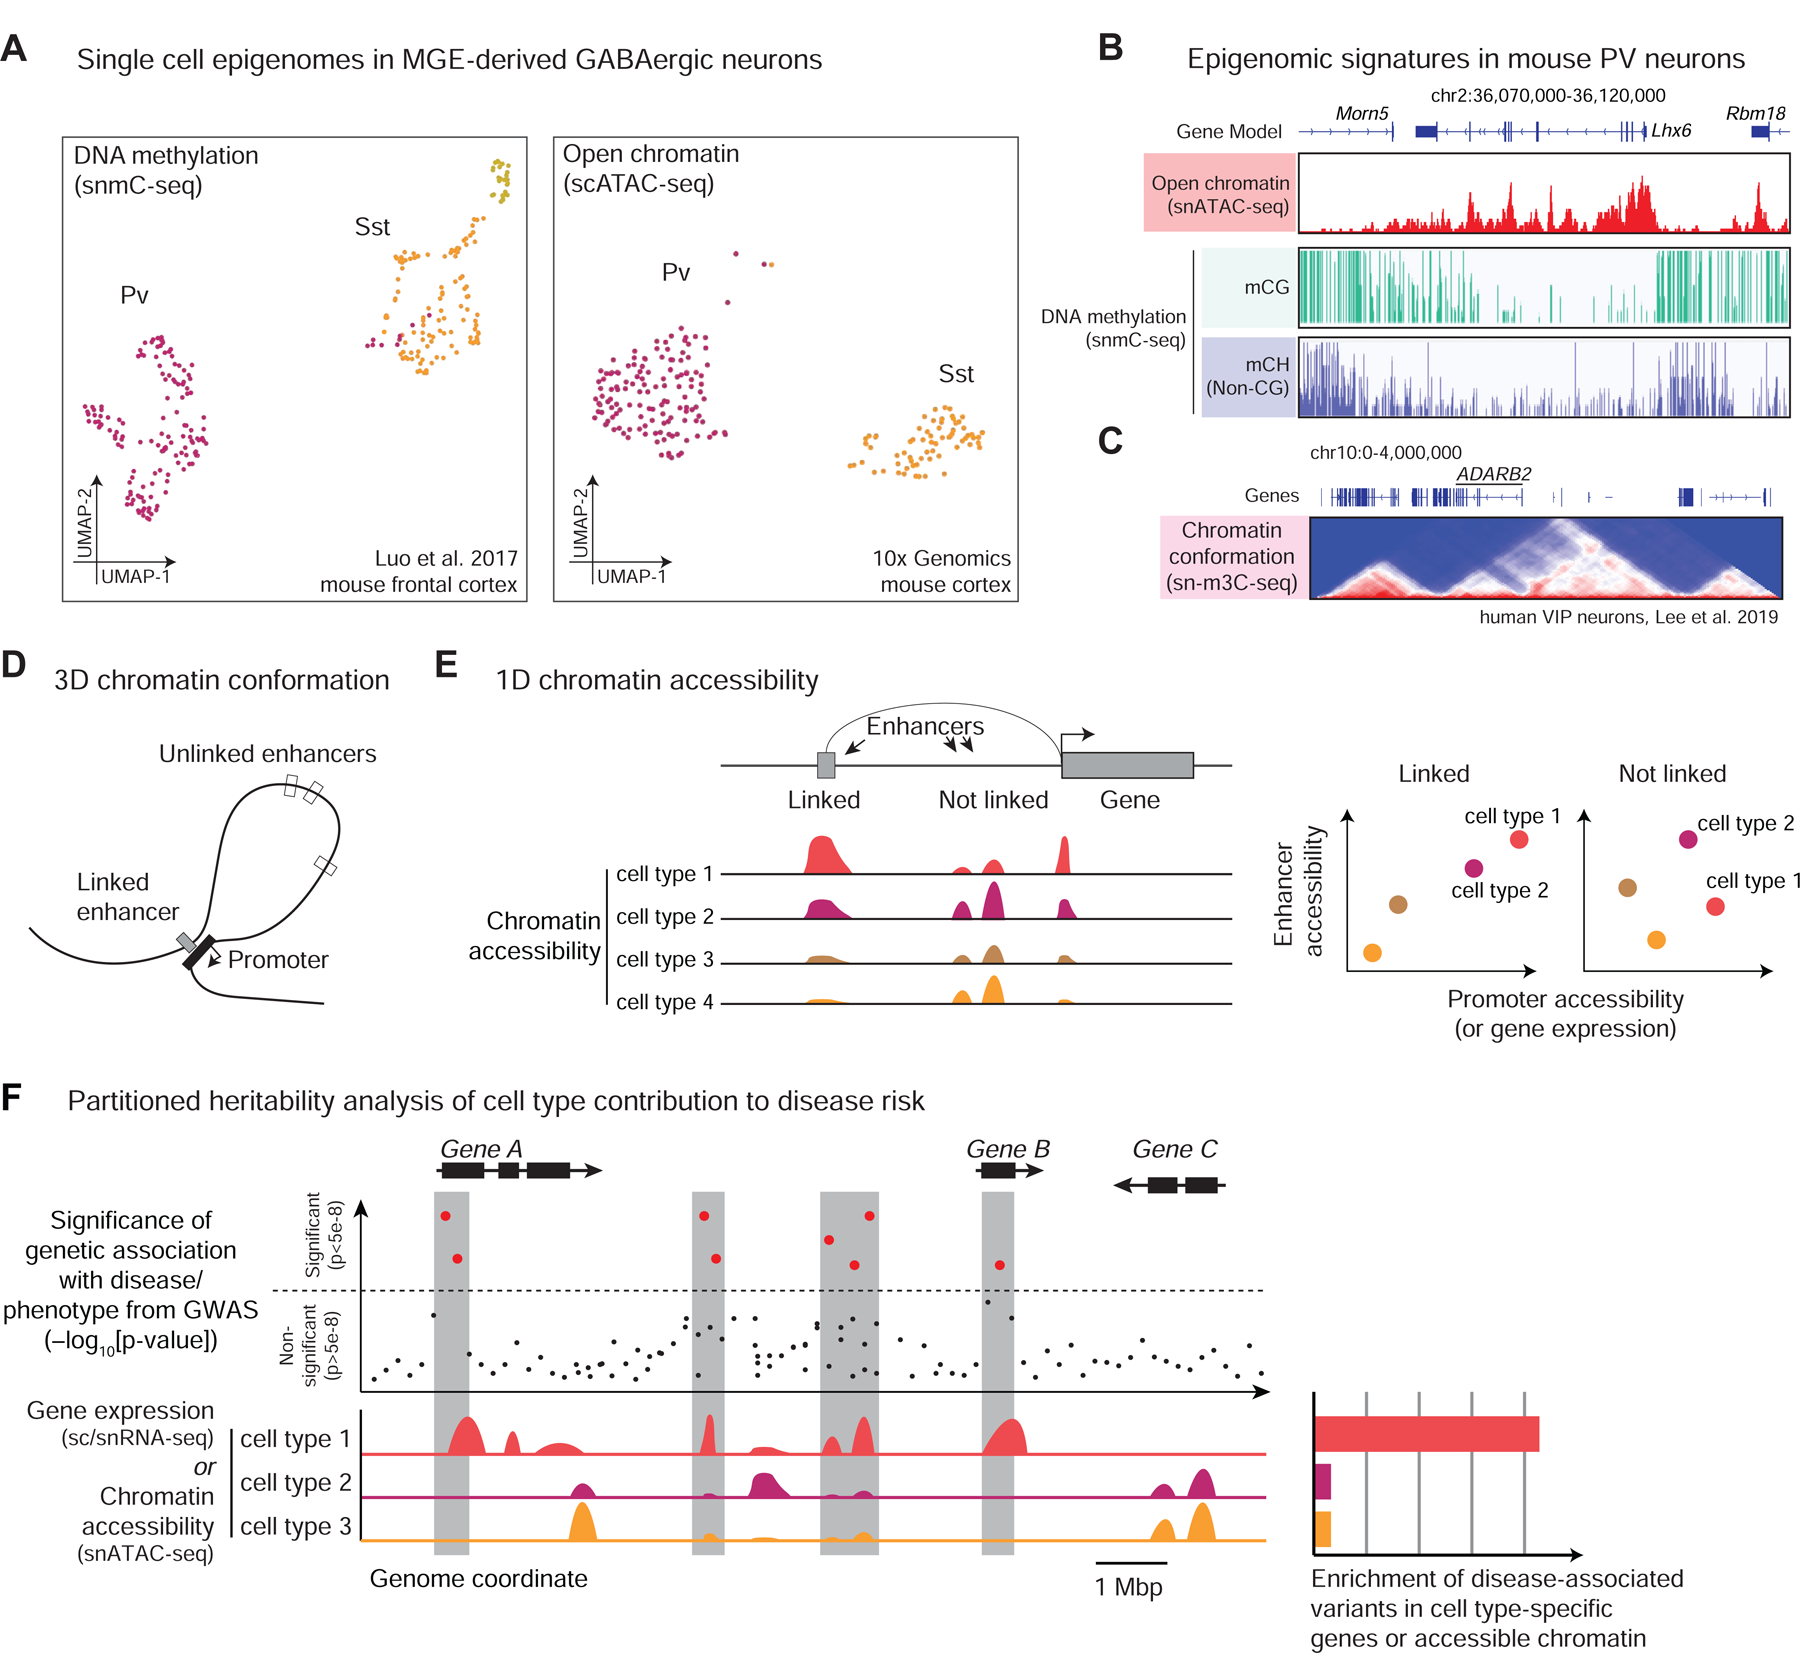
Single cell epigenomics. (A) 2-dimensional embedding of MGE-derived inhibitory neurons profiled by DNA methylation (snmC-seq, (Luo et al., 2017)) and open chromatin (snATAC-seq, 10x Genomics). (B) Genome browser tracks showing pseudo-bulk signals pooled from many single cells of the same cell type (PV-expressing inhibitory interneurons from mouse cortex) around the marker gene Lhx6, showing open chromatin (10x Genomics), CG and non-CG DNA methylation (Luo et al., 2017). (C) 3D chromatin conformation from sn-m3C-seq of human frontal cortex VIP cells (Lee et al., 2019). Heatmap shows the number of contacts detected between pairs of genomic bins; red triangular blocks correspond to domains of frequent chromatin interactions. (D) Illustration of enhancer-gene interaction, in which a 3D chromatin loop brings an enhancer in physical proximity with a gene promoter. (E) Enhancer-gene interaction inferred from the correlation of chromatin accessibility across cell types. (F) Schematic illustration of partitioned heritability analysis. Top: Genome-wide association studies (GWAS) provide a statistical measure of genetic association with a disease (y-axis; higher points are more significant) for individual genetic variants (x-axis: genomic coordinate). Red dots/shaded regions are loci passing a stringent threshold for genome-wide significance (p<5e-8). Bottom: Gene expression or accessible chromatin profiles in three cell types. Right: Enrichment of active gene expression or accessible chromatin near significant disease-associated variants indicates a potential vulnerability specifically in cell type 1.
3b. Mapping chromatin accessibility in 1D
Just as genes are basic units of transcriptome analysis, cCREs are a foundation for analysis of the epigenome. cCREs can be defined by the displacement of nucleosomes due to the binding of transcription factor proteins, forming regions of accessible chromatin. The single nucleus assay of transposase-accessible chromatin (snATAC-Seq) tags, captures and maps such regions using the Tn5 transposase enzyme (Buenrostro et al., 2015; Cusanovich et al., 2015).
Like sc/snRNA-seq, snATAC-seq can use droplets or combinatorial indexing (Cusanovich et al., 2015; Preissl et al., 2018). Combinatorial indexing snATAC-seq can be applied to frozen brain tissue (Preissl et al., 2018), and scales to >104 cells per experiment (Li et al., 2020). Notably, of all the distal cCREs that can be detected in a particular cell type, snATAC-seq captures around ~2–3% in each cell (Li et al., 2020; Preissl et al., 2018). This sparse coverage could reflect the sensitivity of the assay, and/or heterogeneous accessibility across individual cells of the same type.
Despite its sparseness, snATAC-seq data reliably distinguish fine-grained neuron and glia types. For example, 160 cell types were identified using snATAC with a median of ~5,000 unique sequenced fragments per cell in >800,000 mouse brain cells (Li et al., 2020). A total of ~500,000 accessible regions (cCREs) were found across all cell types. Alternatively, droplets can be used to physically separate nuclei for barcoding after tagging open chromatin with Tn5 transposase in bulk, yielding up to a median of ~34,000 unique sequenced fragments per cell (Lareau et al., 2019).
Whereas sc/snRNA-seq data are quantified using known genes and transcripts, regions of accessible chromatin are distributed throughout the genome and generally not known a priori. Many types of features have been used to quantify snATAC data, including gene promoters, putative enhancers, or combinations of regions sharing common DNA sequence motifs (Bravo González-Blas et al., 2019; Cusanovich et al., 2018; Fang et al., 2019; Schep et al., 2017). Each method is sensitive to different biological signals and is affected differently by the noise introduced by sampling a sparse set of fragments. Systematic benchmarking and comparison of computational analysis methods is important to achieve the maximum possible resolution (Chen et al., 2019a).
3c. Mapping chromatin conformation in 3D
CREs and gene promoters interact via the 3-dimensional organization of chromatin loops and domains (Fig. 3D). Single-cell assays of 3D chromatin conformation, closely related to Hi-C used in bulk tissue (Lieberman-Aiden et al., 2009), identify pairs of interacting regions by cross-linking, fragmenting, and re-ligating DNA fragments that are in physical proximity. Sequencing the resulting libraries detects chimeric DNA fragments that contain sequences separated by long distances in the linear (1D) genome, but which are closely associated in 3D, forming a contact matrix (Fig. 3C). A single-cell Hi-C study in neurons obtained ~1 million contacts per cell, illuminating the development of inverted chromatin in rod photoreceptor cells and the segregation of olfactory receptor genes in olfactory sensory neurons (Tan et al., 2019).
A challenge for 3D chromatin assays is the large space of possible pairwise contacts among chromosomal locations. Even if a substantial portion of the genome could be captured in a single cell Hi-C assay, the resulting pairwise contact matrix would contain only a small fraction of the 3D contacts between genomic locations because each DNA fragment can only participate in one ligation event. Cluster analysis of single cell Hi-C data can identify groups of cells with similar chromatin organization (Zhou et al., 2019), but on its own it does not reliably distinguish cortical neuron types (Lee et al., 2019; Li et al., 2019a).
An alternative strategy uses thin (~0.2 μm) tissue slices, followed by laser-capture microdissection of single nuclei and sequencing fragments contained in the same section (Beagrie et al., 2017). This confirms differences in chromatin organization between broad neuron classes without proximity ligation, but it does not provide single cell resolution contact estimates (Winick-Ng et al., 2020).
3d. Applications of single cell epigenomics
Dissecting neuronal gene regulatory networks
Single cell epigenomes can be used to characterize the networks of transcription factors (TFs) and cCREs that establish and maintain brain cell identity. DNA-binding TF proteins recognize specific sequences, or motifs, typically 6–10 base pairs long. The TFs that regulate specific brain cell types can be identified by detecting enriched sequences within cCREs, and comparing them with known TF binding motifs (Lake et al., 2018; Li et al., 2020; Liu et al., 2020; Luo et al., 2017; Preissl et al., 2018). This approach was applied to integrated multimodal (transcriptomic and epigenomic) data from mouse motor cortex, revealing a role for the TF Rfx3 in regulating Layer 2/3 excitatory neurons (Yao et al., 2020a). High precision analysis of the exact location of TF binding can be performed by detecting so-called footprints, i.e. characteristic chromatin accessibility patterns at the binding site (Li et al., 2019b; Mo et al., 2015). However, footprint analysis has so far been limited to bulk ATAC-seq.
Linking genetic elements with disease risk
Although genome-wide association studies (GWAS) have identified risk loci for some neurological and psychiatric disorders, the selective vulnerability of specific brain cell types in each disease remains largely unknown (Wang et al., 2018a). Partitioned heritability analysis using cell type-specific transcriptomes or epigenomes can identify cell types whose active genes are enriched near GWAS risk loci, suggesting a potential direct or indirect role in the disease (Fig. 3F) (Calderon et al., 2017). This does not require molecular data from patient tissue samples, instead using sc/snRNA-seq from healthy subjects together with GWAS information. Partitioned heritability analysis can also use epigenomic data to link genetic risk variants with cell type-specific cCREs (Lake et al., 2018; Luo et al., 2019).
4. Single-cell spatial transcriptomics
sc/snRNA-seq disrupts tissues to isolate cells, sacrificing the spatial context of neural circuits. Brain cells migrate to unique laminar and areal positions before birth, which constrain their connectivity. For neurons, spatial context and connectivity are essential to cell identity and function.
Two approaches have emerged to provide spatially resolved single-cell transcriptomes (Fig. 1B). Spatially resolved sequencing uses slides pre-patterned with beads carrying unique DNA barcodes to tag mRNA molecules based on their location in a brain slice, enabling whole-transcriptome sequencing with ~10 μm spatial resolution (Rodriques et al., 2019; Ståhl et al., 2016). Assigning transcripts to individual cells requires finer spatial resolution, below ~1 μm, which can be achieved by optical imaging-based methods. Single molecule fluorescence in situ hybridization (smFISH) detects individual mRNA transcripts with high sensitivity using fluorescent oligonucleotide probes (Raj et al., 2008). Probes can be localized with diffraction-limited resolution of ~250 nm or larger, sufficient to assign transcripts within cell somata (Moffitt et al., 2018; Zhang et al., 2020a). Finer spatial resolution can be achieved by super-resolution imaging (Lubeck and Cai, 2012) or isotropic physical expansion of tissue prior to imaging (Chen et al., 2015a; Xia et al., 2019).
smFISH uses pre-defined probes to detect specific transcripts rather than directly sequencing mRNA molecules. To achieve broad transcriptome coverage of hundreds to thousands of transcripts, smFISH may be combined with barcoding strategies and multiple rounds of optical decoding (Chen et al., 2015b; Wang et al., 2018b; Zhang et al., 2020a). Transcripts are identified by unique combinations of probes. Error-correction can be achieved with redundant probes. The number of detectable transcripts scales exponentially with the number of probes. While most studies in brain have used panels of several hundred genes (Kim et al., 2019a; Moffitt et al., 2018; Zhang et al., 2020a), up to 10,000 transcripts have been imaged in cell lines (Xia et al., 2019) and in mouse brain (Eng et al., 2019). These methods detect up to 3,300 genes per cell in mouse brain (Eng et al., 2019), ~3-fold less than the highest-resolution sc/snRNA-seq (Yao et al., 2020a).
Spatial transcriptomics can dissect neural circuits with complex anatomical organization, such as specific subdivisions of mouse hypothalamus that are critical for social and reproductive behaviors (Kim et al., 2019b; Moffitt et al., 2018). Spatial maps of ~1 million cells in the hypothalamic preoptic region revealed over 70 molecularly distinct cell types (Moffitt et al., 2018). Notably, fine-grained cell type resolution was achieved despite probing only 155 genes, suggesting that neuron types can often be defined by a modest set of judiciously chosen mRNA targets.
While these methods have clear advantages for interrogating brain cells in their spatial context, they currently have key limitations compared with dissociated single cell transcriptome sequencing. First, smFISH requires designing probes to query a predefined list of genes. Marker gene selection and probe design are critical, and the data cannot provide information about genes which are not pre-selected for study. Second, it remains challenging to unambiguously assign transcripts to single cells. For Slide-seq (Rodriques et al., 2019), this is limited by spatial resolution (~10 μm), while smFISH based methods use computational image processing to define cell boundaries in dense brain tissue. Because many neuronal mRNAs localize to distal dendrites and axons, they cannot be assigned to a cell. Third, smFISH methods may require complex experimental set up and time-consuming imaging, a challenge for large tissue volumes such as whole mammalian brains.
5. Multi-omics: Single cells, multiple data modalities
Fully characterizing cell identity requires jointly measuring gene expression and epigenetic regulation in the same cell. Although single cell epigenetic data can identify cCREs and link them with genes via chromatin looping in 3D, they cannot establish whether an active cCRE drives gene expression. For this, RNA measurements must be obtained from the same cell. Single cell transcriptome and epigenome datasets can be computationally integrated (see below) (Butler et al., 2018; Haghverdi et al., 2018; Hie et al., 2019; Stuart et al., 2019; Welch et al., 2019), but empirical confirmation requires multiomic sequencing in single cells. Moreover, functional validation of cell types identified by single cell sequencing requires techniques that combine sequencing with physiology, connectivity, and/or morphology.
5a. Multimodal sequencing in single cells
Multiomic sequencing combines DNA and RNA measurements in single cells. As many as 24 distinct multiomic techniques have been published since 2015, covering 11 combinations of 7 modalities (Zhu et al., 2020). Here we focus on the main techniques that have been applied in brain tissue to date.
An important class of multiomic methods combines transcriptome (sc/snRNA-seq) and chromatin accessibility (snATAC-seq) measurements in the same cell (Cao et al., 2018; Chen et al., 2019b; Zhu et al., 2019). Tagging open chromatin with transposase and reverse transcription of mRNA can be performed sequentially, in either order, without damaging nuclear structure. Combinatorial indexing or droplet-based techniques can be used to achieve high throughput. Paired snRNA-seq and snATAC-seq of over 15,000 cells in fetal and adult mouse cortex revealed cell type-specific dynamic regulation of promoter accessibility during brain development (Chen et al., 2019b; Zhu et al., 2019). These assays currently provide ~1000-fold less RNA coverage than state-of-the-art sc/snRNA-seq from fresh brain tissue, with 400–4,000 RNA-seq reads per cell and 1,000–6,000 ATAC-seq reads (Fig. 1b). As a result, high-throughput multi-omics studies in mouse cerebral cortex identified 9–22 cell types (Chen et al., 2019b; Zhu et al., 2019), compared with over 100 cell types found using scRNA-seq (Tasic et al., 2018; Yao et al., 2020a, 2020b).
Multiomic sequencing can also assay the transcriptome and DNA methylome from the same cell (Angermueller et al., 2016; Hou et al., 2016; Hu et al., 2016; Luo et al., 2018b). These methods have been applied to modest numbers of cells (up to several thousand) due to the large amount of sequencing required to sample DNA methylation genome-wide. Yet, the depth of RNA and DNA coverage are comparable to scRNA-seq or single cell DNA methylome sequencing, respectively. The methods can be extended to measure open chromatin using single cell nucleosome occupancy and methylation sequencing (NOME-seq) (Pott, 2017), as recently demonstrated in human brain samples (Luo et al., 2019).
Finally, DNA methylomes can be combined with 3D chromatin conformation by bisulfite conversion of chimeric DNA fragments from proximity ligation (Lee et al., 2019; Li et al., 2019a). Each sequenced read does double duty, providing contact information via the location of mapped read ends together with DNA methylation information about cytosines within the fragments. This was applied to over 4,000 neurons in human prefrontal cortex, generating deep coverage with 1.2 million reads per cell (Lee et al., 2019). The chromatin conformation data from single cells distinguish major cell classes such as neurons vs. astrocytes, but not neuron subtypes. Multiomic sequencing solves this problem by clustering cells using high resolution DNA methylation information, followed by separate analysis of the pooled (pseudo-bulk) chromatin conformation profiles from each cell type. The authors found chromatin loops connecting the excitatory-neuron specific transcription factor gene SATB2 with a nearby non-coding RNA in excitatory, but not inhibitory, neurons (Lee et al., 2019).
5b. Combining single cell transcriptomes with physiology and morphology
Single cell sequencing and neuronal physiology can be directly linked by performing whole-cell patch recordings in brain slices, followed by cytosol extraction through the patch pipette for transcriptome sequencing (patch-seq) (Cadwell et al., 2016; Fuzik et al., 2016). Cells can be filled with biocytin following patch recording, for subsequent imaging and morphological reconstruction. Compared with sc/snRNA-seq, patch-seq is laborious and requires individually characterizing cells by patch-clamp recording followed by labeling, imaging and scRNA sequencing. Despite this, it was applied to 1,300 cells in the mouse primary motor cortex, identifying >70 cell types with their transcriptomic and morpho-electrical properties (Scala et al., 2020). Another study profiled 3,700 GABAergic neurons in mouse visual cortex (Gouwens et al., 2020), showing that inhibitory interneurons in specific transcriptomic classes have distinct laminar distributions and electrophysiological properties. Conversely this study also highlights the difficulty in identifying a one-to-one correspondence between morpho-electric and transcriptomic cell types.
5c. Combining single cell sequencing with connectivity
By infecting axon terminals in a defined brain region with a retrograde virus, the cell bodies of source neurons projecting to that region can be labeled, sorted, and their transcriptomes measured by sc/snRNA-seq (Retro-seq) (Tasic et al., 2018). Retro-seq data can be jointly analyzed with other sc/snRNA-seq datasets to add axon projection information onto transcriptomic signatures. This approach helped identify sub-populations of layer 5 pyramidal-tract neurons in the mouse motor cortex with distinct projections in the thalamus and medulla, and different roles in motor control (Economo et al., 2018). Retro-seq can also be used with single cell DNA methylation to link projections with gene regulatory signatures (Zhang et al., 2020b). Retrograde labeling in combination with single-cell spatial transcriptomics provides the laminar and regional location of neurons with specific projections (Zhang et al., 2020a). This showed that mouse motor cortical intratalencephalic-projecting (IT) neurons form a many-to-many projection pattern: cells of the same transcriptomic type project to multiple cortical regions, while those regions receive input from multiple cell types (Zhang et al., 2020a). Although transcriptomic or epigenomic cell types often align with cell populations defined by axonal projections, this is not always the case. For example, Retro-seq analysis of mouse primary visual cortical pyramidal cells projecting to different higher-order visual areas form a continuous transcriptomic population, although some differentially expressed genes were detected (Kim et al., 2020). Likewise, uniform transcriptomic cell types in the ventromedial nucleus of the hypothalamus comprise mixed populations with distinct projection targets (Kim et al., 2019b).
Individual neurons can make multiple collateral projections that may not be captured by labeling individual targets, as in Retro-seq. An alternative strategy uses short oligonucleotide barcodes to detect projections from individual neurons to multiple regions (MAPseq) (Kebschull et al., 2016). Neurons in a starting region are labeled with a library of barcoded Sindbis viruses, followed by microdissection of small volumes from putative target regions and sequencing of the barcodes. MAPseq can be combined with in situ barcode sequencing in the source region to obtain spatial and laminar information about the projection cells, and with FISH to assess expression of marker genes (Chen et al., 2019c). Further development of these methods, e.g. by combining single cell transcriptome sequencing with multiplex projection labeling, will help distill the relationship between transcriptomic and anatomic signatures of neuron types.
6. Computational analysis of single cell sequencing data
Single cell sequencing datasets have thousands of features (e.g. genes, or genomic bins) measured across thousands to millions of single cells. Analysing these data requires sophisticated computational procedures, and analysis pipelines can significantly impact the findings. Open source software packages allow neurobiologists to apply sophisticated analytic strategies (Butler et al., 2018; Kharchenko et al., 2014; Stuart et al., 2019; Wolf et al., 2018). Here we outline analysis steps that are common to many analysis workflows, emphasizing the conceptual foundations. More technical details can be found in recent reviews (Efremova and Teichmann, 2020; Luecken and Theis, 2019).
-
Quality control, mapping and quantification. The first step in analyzing sc/snRNA-seq, snATAC-seq or single cell DNA methylation data is computational demultiplexing and alignment of sequenced reads from each cell with a reference genome or transcriptome. At this stage, it is also important to remove low-quality cells or reads. Each single cell sequencing technology has its own potential pitfalls, but common themes include low library complexity due to inefficient RNA/DNA capture; contamination by high levels of mitochondrial RNA; or incomplete bisulfite conversion for DNA methylation assays. In most cases, low-quality cells can be removed by appropriate choice of thresholds.
Following quality control and quantification, transcriptome data can be represented as a table containing a row for each cell, and a column for each gene or transcript. The entries of the table describe the estimated abundance of each gene. Single cell DNA methylation and ATAC-seq data have more diverse representations, which may include gene-oriented signatures (e.g. promoter chromatin accessibility or gene body DNA methylation) or non-gene signatures (e.g. accessibility or methylation in genomic bins).
Feature selection and dimensionality reduction. Gene expression and epigenomic measurements define high-dimensional feature spaces, where the data dimension is the number of quantified genes or features. However, correlations among the features reduce the intrinsic data dimensionality, i.e. the number of independent parameters needed to capture the meaningful biological variability. Dimensionality reduction removes noise and simplifies subsequent analysis (Sun et al., 2019). First, features with little detectable expression or low variance across cells are removed. Next, linear projection, e.g. using principal component analysis (PCA), reduces the dimension from several thousand to ~50–100 features. The exact number of PCs to be retained is an unconstrained parameter, but in practice results may not be highly sensitive to this choice.
Reducing data sparseness. Single cell data are often sparse: genes which are expressed in a cell may be missed due to random sampling in sc/snRNA-seq, while snATAC-seq captures only a fraction of all regions of accessible chromatin in each cell. Pre-processing by data diffusion can help to combat sparseness and may improve visualization and cluster analysis (van Dijk et al., 2018).
Doublets. A common pitfall for single cell transcriptome and epigenome assays is the potential for incorrectly combining information from two or more cells, called doublets. This can occur due to physical association of cells that are captured in the same droplet or well. Doublets can also occur due to barcode collisions in combinatorial indexing experiments, in which multiple cells acquire the same combination of index barcodes by chance. Some doublet events can be removed by computational methods that detect signatures of apparent hybrid gene expression (Wolock et al., 2019). Although computational doublet removal may reduce the extent of contamination, it should be treated with caution when the true number of cell types is not known. Ultimately, putative cell types described by single cell sequencing must be confirmed by alternative techniques, such as spatial transcriptomics, which may be less susceptible to doublets.
Visualization. Exploratory data visualization builds intuition about the structure of abstract, high-dimensional single cell sequencing data, and helps formulate hypotheses for subsequent formal statistical analysis. Useful visualizations embed cells in a 2- or 3-dimensional space, optimizing the layout of cells so that their mutual distances approximate the distances of the high-dimensional data. Nonlinear manifold learning and data embedding techniques, including tSNE, UMAP and force-directed layout embeddings (McInnes et al., 2018), make different compromises to force the complex relationships between single cell feature vectors into a 2- or 3-dimensional layout. More sophisticated approaches using variational autoencoders have also been applied to single cell data (Eraslan et al., 2019; Lopez et al., 2018). Low-dimensional embeddings are always imperfect; they are distorted and non-unique representations of the high-dimensional data. They should be used for exploration, but not hypothesis testing or drawing conclusions.
-
Discrete clusters and continuous latent factors. The simplest description of a single cell sequencing dataset is in terms of discrete clusters, or groups of cells with distinct molecular signatures. Clusters can often be arranged in a hierarchy, with groups of cells forming closely related sub-classes and classes (Zeng and Sanes, 2017). Clustering large-scale datasets with millions of cells can be accomplished with efficient community detection algorithms that optimize a modularity index (Traag et al., 2019). Yet, cluster analysis on its own does not provide evidence of the statistical reliability or biological reality of resulting cell types.
In addition to discrete clusters, cells may also differ along one or more continuous gradients. Continuous trajectories occur during brain development (Nowakowski et al., 2017) and in differentiating cell populations in the adult, such as oligodendrocyte lineage cells (Marques et al., 2016) or newborn granule cells in the dentate gyrus of the hippocampus (Habib et al., 2016). Trajectory or pseudotime estimation procedures seek to estimate the continuous relationships between single cells (Cao et al., 2019; Trapnell et al., 2014). Continuous gradients in post-mitotic neurons can reflect the spatial distribution of neurons across lamina or cortical regions, or graded functional properties (Liu et al., 2020). Methods to distinguish continuous and discrete variation in neural populations are a focus of current research (Harris et al., 2018; Stanley et al., 2020).
Computational integration of multiple datasets. Correlated transcriptomic and epigenomic signatures can allow computational methods to integrate independent datasets despite batch effects and systematic differences (Efremova and Teichmann, 2020). Parametric methods, such as approximate canonical correlation analysis (CCA) implemented by Seurat (Stuart et al., 2019) or non-negative matrix factorization (NMF) (Welch et al., 2019), project cells from multiple datasets into a common, low-dimensional space where they can be directly compared, clustered, and analyzed. Non-parametric methods such as mutual nearest neighbors (MNN) can also link cells across datasets, without learning a linear or nonlinear embedding in a common space (Haghverdi et al., 2018; Hie et al., 2019; Luo et al., 2019). These techniques link cells in one dataset with closely matching cells in another dataset, e.g. by selecting the cells with the most correlated gene-oriented signatures. A recent study integrated 9 multimodal datasets from the mouse primary motor cortex, including 7 sc/snRNA-seq datasets as well as single cell DNA methylation and ATAC-seq data (Yao et al., 2020a).
-
Cluster validation. Analysis of the statistical significance and reproducibility of clusters can help to define an appropriate cluster resolution, providing objective criteria to resolve the classic tension between lumpers (who tend to combine things in groups) and splitters (who emphasize fine distinctions and granular categories). A stringent test of cell type replicability uses transcriptomic signatures of a cell type learned from one or more datasets to try to predict the identity of cells in an independent dataset, providing a statistical score (area under the ROC curve) that quantifies the match between clusters (Crow et al., 2018). Using this approach, signatures of cardinal GABAergic neuron types defined by transgenic mouse lines were validated in independent scRNA-seq datasets (Paul et al., 2017). This approach also verified the replicability of over 70 transcriptomic cell types in mouse primary motor cortex across 7 scRNA and snRNA-seq datasets (Yao et al., 2020a).
Epigenomic signatures can further validate cell type distinctions and help to dissect their molecular regulation. By cross-validation using independent genes for clustering and data integration followed by testing cluster validity on held-out gene sets, a systematic comparison of scRNA, snRNA, DNA methylation and open chromatin data validated the cross-modal identity of mouse cortical cell types (Yao et al., 2020a).
-
Downstream analysis. After clustering, a wide variety of analyses can be used to further explore and characterize single cell sequencing data. Differentially expressed genes between cell types, or across samples or conditions, can be identified with statistical procedures (Finak et al., 2015; Kharchenko et al., 2014). Unfortunately, different computational methods diverge significantly in estimating differential expression (Soneson and Robinson, 2018), and techniques specifically designed for sc/snRNA-seq may not perform better than standard methods used for bulk RNA-seq (Wang et al., 2019).
Single cell epigenomic data can be used to identify cCREs by detecting snATAC-seq peaks (Preissl et al., 2018), and/or differentially methylated regions (Luo et al., 2017). Moreover, snATAC-seq data can link cCREs and the genes they directly regulate (Pliner et al., 2018) (Fig. 3e). These data can be used as a starting point for analysis of gene regulatory networks, and for predicting cell type specific enhancers for use in viral targeting tools (Hrvatin et al., 2019; Mich et al., 2020).
7. Limitations, opportunities and outlook
Single cell sequencing is transforming many areas of biology, and the impact may be especially profound in neuroscience. The diversity of brain cell types and the complex regulation of cell identity and experience-dependent plasticity throughout the life of a neuron make single cell analysis essential for understanding brain circuits.
Like any emerging technology, single cell sequencing has important limitations. Doublets, in which two or more cells are captured in a single well or droplet or tagged with the same barcode, can distort single cell datasets and create spurious hybrid cell types. Contamination of scRNA-seq libraries, e.g. by cytoplasmic RNA from other cells in the same tissue, can lead to false positive gene detection. False negatives, or dropouts, are an even greater concern, since the sampling strategy typically recovers only a fraction of the total RNA or DNA. Single cell techniques can also be affected by non-physiological transcription caused by tissue dissection and cell dissociation (Lacar et al., 2016; Wu et al., 2017).
A more fundamental limitation of single cell techniques is the need to destroy the cell in order to extract its molecular signatures for sequencing. Although multiomic and multimodal techniques can increase the information obtained per cell, these methods are inherently snapshots of the life of a cell and do not record the dynamic changes in neural regulation that are critical to brain function. Some dynamic information can be inferred by analyzing mature vs. immature RNA transcripts (La Manno et al., 2018), but bona fide measurements of transcriptome dynamics in single cells (Cao et al., 2020) would be valuable in the brain.
The complexity of single cell datasets is both an opportunity and a challenge. Sophisticated computational methods for clustering, visualization and analysis of single cell data provide rich insight into the function of cellular machines. However, different computational methods or parameter choices can lead to divergent results for the same dataset. Clustering procedures are notorious for their inconsistency and lack of robustness, leading to subjectivity in the description of single cell data in terms of cell types. Single cell studies must address this by transparently investigating and reporting how biological conclusions depend on analytic choices.
The greatest challenge is to unify information from single cell sequencing with functional and physiological measures of neuronal cell type identity. Although there is remarkable correspondence between cell types defined by transcriptomic, epigenomic, anatomical and morphological criteria, efforts to harmonize these data at the level of hundreds of fine-grained brain cell types are still at an early stage.
As innovations in single cell technologies overcome these challenges, they are opening new frontiers for neuroscience research. Single cell sequencing is providing comprehensive, whole-brain analyses of the cellular components of brains in multiple species and across the stages of development. Techniques that link single cell sequencing with electrophysiology, morphology, and connectivity will profoundly change our understanding of the dimensions of neuronal diversity. Cross-species and developmental comparisons of brain cell types will transform our understanding of brain ontogeny and phylogeny, potentially leading to a detailed mechanistic understanding of the evolutionary relationships among neural populations (Arendt et al., 2016). Evolutionary conservation and divergence provide insight into the gene regulatory programs that were selected for their impact on cognitive function (Bakken et al., 2020; Hodge et al., 2019; Krienen et al., 2020). By combining single cell sequencing with techniques for activity-dependent labeling, neuroscientists will be able to link transcriptomes and epigenomes with the roles of specific cell types in behavior (Kim et al., 2019b). Alongside the technical progress described here, we expect that new conceptual and theoretical frameworks will emerge to turn the enormous information from single cell sequencing into organized and systematic knowledge about brain cell ontogeny and function.
Highlights:
Single cell sequencing provides deep molecular information about neuronal and glial transcriptomes and epigenomes
Multiple experimental strategies balance efficient high-throughput data collection with deep coverage of mRNA transcripts, DNA methylation, or open chromatin regions
Multi-omic methods combine different data modalities in the same cell
Techniques such as spatial transcriptomics and patch-seq provide functional and anatomical information in combination with molecular signatures
Acknowledgments
We are grateful to Bosiljka Tasic, M. Margarita Behrens, and Sebastian Preissl for their thoughtful comments. This work was supported by the Chan Zuckerberg Initiative Seed Networks for the HCA (CZF2019–002457, EAM) and NIH RF1 MH120015 (EAM).
Footnotes
Publisher's Disclaimer: This is a PDF file of an unedited manuscript that has been accepted for publication. As a service to our customers we are providing this early version of the manuscript. The manuscript will undergo copyediting, typesetting, and review of the resulting proof before it is published in its final form. Please note that during the production process errors may be discovered which could affect the content, and all legal disclaimers that apply to the journal pertain.
Declaration of Interests: The authors declare no competing interests.
References
- Angermueller C, Clark SJ, Lee HJ, Macaulay IC, Teng MJ, Hu TX, Krueger F, Smallwood S, Ponting CP, Voet T, et al. (2016). Parallel single-cell sequencing links transcriptional and epigenetic heterogeneity. Nat. Methods 13, 229–232. [DOI] [PMC free article] [PubMed] [Google Scholar]
- Arendt D, Musser JM, Baker CVH, Bergman A, Cepko C, Erwin DH, Pavlicev M, Schlosser G, Widder S, Laubichler MD, et al. (2016). The origin and evolution of cell types. Nat. Rev. Genet 17, 744–757. [DOI] [PubMed] [Google Scholar]
- Azevedo FAC, Carvalho LRB, Grinberg LT, Farfel JM, Ferretti REL, Leite REP, Jacob Filho W, Lent R, and Herculano-Houzel S (2009). Equal numbers of neuronal and nonneuronal cells make the human brain an isometrically scaled-up primate brain. J. Comp. Neurol 513, 532–541. [DOI] [PubMed] [Google Scholar]
- Bakken TE, Hodge RD, Miller JA, Yao Z, Nguyen TN, Aevermann B, Barkan E, Bertagnolli D, Casper T, Dee N, et al. (2018). Single-nucleus and single-cell transcriptomes compared in matched cortical cell types. PLoS One 13, e0209648. [DOI] [PMC free article] [PubMed] [Google Scholar]
- Bakken TE, Jorstad NL, Hu Q, Lake BB, and Tian W (2020). Evolution of cellular diversity in primary motor cortex of human, marmoset monkey, and mouse. bioRxiv.
- Beagrie RA, Scialdone A, Schueler M, Kraemer DCA, Chotalia M, Xie SQ, Barbieri M, de Santiago I, Lavitas L-M, Branco MR, et al. (2017). Complex multi-enhancer contacts captured by genome architecture mapping. Nature 543, 519–524. [DOI] [PMC free article] [PubMed] [Google Scholar]
- Bergen V, Lange M, Peidli S, Wolf FA, and Theis FJ (2020). Generalizing RNA velocity to transient cell states through dynamical modeling. Nat. Biotechnol [DOI] [PubMed]
- Bravo González-Blas C, Minnoye L, Papasokrati D, Aibar S, Hulselmans G, Christiaens V, Davie K, Wouters J, and Aerts S (2019). cisTopic: cis-regulatory topic modeling on single-cell ATAC-seq data. Nat. Methods [DOI] [PMC free article] [PubMed]
- Buenrostro JD, Wu B, Litzenburger UM, Ruff D, Gonzales ML, Snyder MP, Chang HY, and Greenleaf WJ (2015). Single-cell chromatin accessibility reveals principles of regulatory variation. Nature 523, 486. [DOI] [PMC free article] [PubMed] [Google Scholar]
- Butler A, Hoffman P, Smibert P, Papalexi E, and Satija R (2018). Integrating single-cell transcriptomic data across different conditions, technologies, and species. Nat. Biotechnol 36, 411–420. [DOI] [PMC free article] [PubMed] [Google Scholar]
- Cadwell CR, Palasantza A, Jiang X, Berens P, Deng Q, Yilmaz M, Reimer J, Shen S, Bethge M, Tolias KF, et al. (2016). Electrophysiological, transcriptomic and morphologic profiling of single neurons using Patch-seq. Nat. Biotechnol 34, 199–203. [DOI] [PMC free article] [PubMed] [Google Scholar]
- Cajigas IJ, Tushev G, Will TJ, Tom Dieck S, Fuerst N, and Schuman EM (2012). The Local Transcriptome in the Synaptic Neuropil Revealed by Deep Sequencing and High-Resolution Imaging. Neuron 74, 453–466. [DOI] [PMC free article] [PubMed] [Google Scholar]
- Calderon D, Bhaskar A, Knowles DA, Golan D, Raj T, Fu AQ, and Pritchard JK (2017). Inferring Relevant Cell Types for Complex Traits by Using Single-Cell Gene Expression. Am. J. Hum. Genet 101, 686–699. [DOI] [PMC free article] [PubMed] [Google Scholar]
- Cao J, Cusanovich DA, Ramani V, Aghamirzaie D, Pliner HA, Hill AJ, Daza RM, McFaline-Figueroa JL, Packer JS, Christiansen L, et al. (2018). Joint profiling of chromatin accessibility and gene expression in thousands of single cells. Science [DOI] [PMC free article] [PubMed]
- Cao J, Spielmann M, Qiu X, Huang X, Ibrahim DM, Hill AJ, Zhang F, Mundlos S, Christiansen L, Steemers FJ, et al. (2019). The single-cell transcriptional landscape of mammalian organogenesis. Nature 566, 496–502. [DOI] [PMC free article] [PubMed] [Google Scholar]
- Cao J, Zhou W, Steemers F, Trapnell C, and Shendure J (2020). Sci-fate characterizes the dynamics of gene expression in single cells. Nat. Biotechnol [DOI] [PMC free article] [PubMed]
- Chen C-YA, Ezzeddine N, and Shyu A-B (2008). Messenger RNA half-life measurements in mammalian cells. Methods Enzymol 448, 335–357. [DOI] [PMC free article] [PubMed] [Google Scholar]
- Chen F, Tillberg PW, and Boyden ES (2015a). Optical imaging. Expansion microscopy. Science 347, 543–548. [DOI] [PMC free article] [PubMed] [Google Scholar]
- Chen H, Lareau C, Andreani T, Vinyard ME, Garcia SP, Clement K, Andrade-Navarro MA, Buenrostro JD, and Pinello L (2019a). Assessment of computational methods for the analysis of single-cell ATAC-seq data. Genome Biol 20, 241. [DOI] [PMC free article] [PubMed] [Google Scholar]
- Chen KH, Boettiger AN, Moffitt JR, Wang S, and Zhuang X (2015b). RNA imaging. Spatially resolved, highly multiplexed RNA profiling in single cells. Science 348, aaa6090. [DOI] [PMC free article] [PubMed] [Google Scholar]
- Chen S, Lake BB, and Zhang K (2019b). High-throughput sequencing of the transcriptome and chromatin accessibility in the same cell. Nat. Biotechnol [DOI] [PMC free article] [PubMed]
- Chen X, Sun Y-C, Zhan H, Kebschull JM, Fischer S, Matho K, Huang ZJ, Gillis J, and Zador AM (2019c). High-Throughput Mapping of Long-Range Neuronal Projection Using In Situ Sequencing. Cell 179, 772–786.e19. [DOI] [PMC free article] [PubMed] [Google Scholar]
- Cosacak MI, Bhattarai P, Reinhardt S, Petzold A, Dahl A, Zhang Y, and Kizil C (2019). Single-Cell Transcriptomics Analyses of Neural Stem Cell Heterogeneity and Contextual Plasticity in a Zebrafish Brain Model of Amyloid Toxicity. Cell Rep 27, 1307–1318.e3. [DOI] [PubMed] [Google Scholar]
- Crow M, Paul A, Ballouz S, Huang ZJ, and Gillis J (2018). Characterizing the replicability of cell types defined by single cell RNA-sequencing data using MetaNeighbor. Nat. Commun 9, 884. [DOI] [PMC free article] [PubMed] [Google Scholar]
- Cusanovich DA, Daza R, Adey A, Pliner HA, Christiansen L, Gunderson KL, Steemers FJ, Trapnell C, and Shendure J (2015). Multiplex single cell profiling of chromatin accessibility by combinatorial cellular indexing. Science 348, 910–914. [DOI] [PMC free article] [PubMed] [Google Scholar]
- Cusanovich DA, Hill AJ, Aghamirzaie D, Daza RM, Pliner HA, Berletch JB, Filippova GN, Huang X, Christiansen L, DeWitt WS, et al. (2018). A Single-Cell Atlas of In Vivo Mammalian Chromatin Accessibility. Cell 174, 1309–1324.e18. [DOI] [PMC free article] [PubMed] [Google Scholar]
- Darmanis S, Sloan SA, Zhang Y, Enge M, Caneda C, Shuer LM, Hayden Gephart MG, Barres BA, and Quake SR (2015). A survey of human brain transcriptome diversity at the single cell level. Proc. Natl. Acad. Sci. U. S. A 112, 7285–7290. [DOI] [PMC free article] [PubMed] [Google Scholar]
- Davie K, Janssens J, Koldere D, De Waegeneer M, Pech U, Kreft Ł, Aibar S, Makhzami S, Christiaens V, Bravo González-Blas C, et al. (2018). A Single-Cell Transcriptome Atlas of the Aging Drosophila Brain. Cell [DOI] [PMC free article] [PubMed]
- Day JJ, Childs D, Guzman-Karlsson MC, Kibe M, Moulden J, Song E, Tahir A, and Sweatt JD (2013). DNA methylation regulates associative reward learning. Nat. Neurosci 16, 1445–1452. [DOI] [PMC free article] [PubMed] [Google Scholar]
- De Schutter E (2008). Why are computational neuroscience and systems biology so separate? PLoS Comput. Biol 4, e1000078. [DOI] [PMC free article] [PubMed] [Google Scholar]
- Di Bella DJ, Habibi E, Yang S-M, Stickels RR, Brown J, Yadollahpour P, Chen F, Macosko EZ, Regev A, and Arlotta P (2020). Molecular Logic of Cellular Diversification in the Mammalian Cerebral Cortex.
- van Dijk D, Sharma R, Nainys J, Yim K, Kathail P, Carr AJ, Burdziak C, Moon KR, Chaffer CL, Pattabiraman D, et al. (2018). Recovering Gene Interactions from Single-Cell Data Using Data Diffusion. Cell 174, 716–729.e27. [DOI] [PMC free article] [PubMed] [Google Scholar]
- Ding J, Adiconis X, Simmons SK, Kowalczyk MS, Hession CC, Marjanovic ND, Hughes TK, Wadsworth MH, Burks T, Nguyen LT, et al. (2020). Systematic comparison of single-cell and single-nucleus RNA-sequencing methods. Nat. Biotechnol 38, 737–746. [DOI] [PMC free article] [PubMed] [Google Scholar]
- Economo MN, Viswanathan S, Tasic B, Bas E, Winnubst J, Menon V, Graybuck LT, Nguyen TN, Smith KA, Yao Z, et al. (2018). Distinct descending motor cortex pathways and their roles in movement. Nature 563, 79–84. [DOI] [PubMed] [Google Scholar]
- Efremova M, and Teichmann SA (2020). Computational methods for single-cell omics across modalities. Nat. Methods 17, 14–17. [DOI] [PubMed] [Google Scholar]
- Eng C-HL, Lawson M, Zhu Q, Dries R, Koulena N, Takei Y, Yun J, Cronin C, Karp C, Yuan G-C, et al. (2019). Transcriptome-scale super-resolved imaging in tissues by RNA seqFISH. Nature 568, 235–239. [DOI] [PMC free article] [PubMed] [Google Scholar]
- Eraslan G, Simon LM, Mircea M, Mueller NS, and Theis FJ (2019). Single-cell RNA-seq denoising using a deep count autoencoder. Nat. Commun 10, 390. [DOI] [PMC free article] [PubMed] [Google Scholar]
- Erö C, Gewaltig M-O, Keller D, and Markram H (2018). A Cell Atlas for the Mouse Brain. Front. Neuroinform 12, 84. [DOI] [PMC free article] [PubMed] [Google Scholar]
- Fang R, Preissl S, Hou X, Lucero J, Wang X, Motamedi A, Shiau AK, Mukamel EA, Zhang Y, Margarita Behrens M, et al. (2019). Fast and Accurate Clustering of Single Cell Epigenomes Reveals Cis-Regulatory Elements in Rare Cell Types.
- Farrell JA, Wang Y, Riesenfeld SJ, Shekhar K, Regev A, and Schier AF (2018). Single-cell reconstruction of developmental trajectories during zebrafish embryogenesis. Science 360. [DOI] [PMC free article] [PubMed] [Google Scholar]
- Finak G, McDavid A, Yajima M, Deng J, Gersuk V, Shalek AK, Slichter CK, Miller HW, McElrath MJ, Prlic M, et al. (2015). MAST: a flexible statistical framework for assessing transcriptional changes and characterizing heterogeneity in single-cell RNA sequencing data. Genome Biol 16, 278. [DOI] [PMC free article] [PubMed] [Google Scholar]
- Fishell G, and Kepecs A (2019). Interneuron Types as Attractors and Controllers. Annu. Rev. Neurosci [DOI] [PMC free article] [PubMed]
- Fuzik J, Zeisel A, Máté Z, Calvigioni D, Yanagawa Y, Szabó G, Linnarsson S, and Harkany T (2016). Integration of electrophysiological recordings with single-cell RNA-seq data identifies neuronal subtypes. Nat. Biotechnol 34, 175–183. [DOI] [PMC free article] [PubMed] [Google Scholar]
- Gaidatzis D, Burger L, Florescu M, and Stadler MB (2015). Analysis of intronic and exonic reads in RNA-seq data characterizes transcriptional and post-transcriptional regulation. Nat. Biotechnol 33, 722–729. [DOI] [PubMed] [Google Scholar]
- Gouwens NW, Sorensen SA, Baftizadeh F, Budzillo A, Lee BR, Jarsky T, Alfiler L, Arkhipov A, Baker K, Barkan E, et al. (2020). Toward an integrated classification of neuronal cell types: morphoelectric and transcriptomic characterization of individual GABAergic cortical neurons.
- Graybuck LT, Sedeño-Cortés A, Nguyen TN, Walker M, Szelenyi E, Lenz G, Sieverts L. ‘akea, Kim TK, Garren E, Kalmbach B, et al. (2019). Prospective, brain-wide labeling of neuronal subclasses with enhancer-driven AAVs.
- Grindberg RV, Yee-Greenbaum JL, McConnell MJ, Novotny M, O’Shaughnessy AL, Lambert GM, Araúzo-Bravo MJ, Lee J, Fishman M, Robbins GE, et al. (2013). RNA-sequencing from single nuclei. Proc. Natl. Acad. Sci. U. S. A 110, 19802–19807. [DOI] [PMC free article] [PubMed] [Google Scholar]
- Grubman A, Chew G, Ouyang JF, Sun G, Choo XY, McLean C, Simmons RK, Buckberry S, Vargas-Landin DB, Poppe D, et al. (2019). A single-cell atlas of entorhinal cortex from individuals with Alzheimer’s disease reveals cell-type-specific gene expression regulation. Nat. Neurosci [DOI] [PubMed]
- Gupta I, Collier PG, Haase B, Mahfouz A, Joglekar A, Floyd T, Koopmans F, Barres B, Smit AB, Sloan SA, et al. (2018). Single-cell isoform RNA sequencing characterizes isoforms in thousands of cerebellar cells. Nat. Biotechnol [DOI] [PubMed]
- Habib N, Li Y, Heidenreich M, Swiech L, Avraham-Davidi I, Trombetta JJ, Hession C, Zhang F, and Regev A (2016). Div-Seq: Single-nucleus RNA-Seq reveals dynamics of rare adult newborn neurons. Science 353, 925–928. [DOI] [PMC free article] [PubMed] [Google Scholar]
- Habib N, Avraham-Davidi I, Basu A, Burks T, Shekhar K, Hofree M, Choudhury SR, Aguet F, Gelfand E, Ardlie K, et al. (2017). Massively parallel single-nucleus RNA-seq with DroNc-seq. Nat. Methods 14, 955–958. [DOI] [PMC free article] [PubMed] [Google Scholar]
- Hagemann-Jensen M, Ziegenhain C, Chen P, Ramsköld D, Hendriks G-J, Larsson AJM, Faridani OR, and Sandberg R (2020). Single-cell RNA counting at allele and isoform resolution using Smart-seq3. Nat. Biotechnol 38, 708–714. [DOI] [PubMed] [Google Scholar]
- Haghverdi L, Lun ATL, Morgan MD, and Marioni JC (2018). Batch effects in single-cell RNA-sequencing data are corrected by matching mutual nearest neighbors. Nat. Biotechnol 36, 421–427. [DOI] [PMC free article] [PubMed] [Google Scholar]
- Harris KD, Hochgerner H, Skene NG, Magno L, Katona L, Gonzales CB, Somogyi P, Kessaris N, Linnarsson S, and Hjerling-Leffler J (2018). Classes and continua of hippocampal CA1 inhibitory neurons revealed by single-cell transcriptomics. PLoS Biol 16, e2006387. [DOI] [PMC free article] [PubMed] [Google Scholar]
- Hie B, Bryson B, and Berger B (2019). Efficient integration of heterogeneous single-cell transcriptomes using Scanorama. Nat. Biotechnol [DOI] [PMC free article] [PubMed]
- Hodge RD, Bakken TE, Miller JA, Smith KA, Barkan ER, Graybuck LT, Close JL, Long B, Johansen N, Penn O, et al. (2019). Conserved cell types with divergent features in human versus mouse cortex. Nature [DOI] [PMC free article] [PubMed]
- Hou Y, Guo H, Cao C, Li X, Hu B, Zhu P, Wu X, Wen L, Tang F, Huang Y, et al. (2016). Single-cell triple omics sequencing reveals genetic, epigenetic, and transcriptomic heterogeneity in hepatocellular carcinomas. Cell Res 26, 304–319. [DOI] [PMC free article] [PubMed] [Google Scholar]
- Hrvatin S, Hochbaum DR, Nagy MA, Cicconet M, Robertson K, Cheadle L, Zilionis R, Ratner A, Borges-Monroy R, Klein AM, et al. (2018). Single-cell analysis of experience-dependent transcriptomic states in the mouse visual cortex. Nat. Neurosci 21, 120–129. [DOI] [PMC free article] [PubMed] [Google Scholar]
- Hrvatin S, Tzeng CP, Nagy MA, Stroud H, Koutsioumpa C, Wilcox OF, Assad EG, Green J, Harvey CD, Griffith EC, et al. (2019). A scalable platform for the development of cell-type-specific viral drivers. Elife 8. [DOI] [PMC free article] [PubMed] [Google Scholar]
- Hu P, Fabyanic E, Kwon DY, Tang S, Zhou Z, and Wu H (2017). Dissecting Cell-Type Composition and Activity-Dependent Transcriptional State in Mammalian Brains by Massively Parallel Single-Nucleus RNA-Seq. Mol. Cell 68, 1006–1015.e7. [DOI] [PMC free article] [PubMed] [Google Scholar]
- Hu Y, Huang K, An Q, Du G, Hu G, Xue J, Zhu X, Wang C-Y, Xue Z, and Fan G (2016). Simultaneous profiling of transcriptome and DNA methylome from a single cell. Genome Biol 17, 88. [DOI] [PMC free article] [PubMed] [Google Scholar]
- Huang ZJ, and Paul A (2019). The diversity of GABAergic neurons and neural communication elements. Nat. Rev. Neurosci 20, 563–572. [DOI] [PMC free article] [PubMed] [Google Scholar]
- Huang AY, Li P, Rodin RE, Kim SN, Dou Y, Kenny CJ, Akula SK, Hodge RD, Bakken TE, Miller JA, et al. (2020). Parallel RNA and DNA analysis after deep sequencing (PRDD-seq) reveals cell type-specific lineage patterns in human brain. Proc. Natl. Acad. Sci. U. S. A 117, 13886–13895. [DOI] [PMC free article] [PubMed] [Google Scholar]
- Kebschull JM, Garcia da Silva P, Reid AP, Peikon ID, Albeanu DF, and Zador AM (2016). High-Throughput Mapping of Single-Neuron Projections by Sequencing of Barcoded RNA. Neuron 91, 975–987. [DOI] [PMC free article] [PubMed] [Google Scholar]
- Kharchenko PV, Silberstein L, and Scadden DT (2014). Bayesian approach to single-cell differential expression analysis. Nat. Methods 11, 740–742. [DOI] [PMC free article] [PubMed] [Google Scholar]
- Kim D-W, Yao Z, Graybuck LT, Kim TK, Nguyen TN, Smith KA, Fong O, Yi L, Koulena N, Pierson N, et al. (2019a). Multimodal Analysis of Cell Types in a Hypothalamic Node Controlling Social Behavior. Cell 179, 713–728.e17. [DOI] [PMC free article] [PubMed] [Google Scholar]
- Kim D-W, Yao Z, Graybuck LT, Kim TK, Nguyen TN, Smith KA, Fong O, Yi L, Koulena N, Pierson N, et al. (2019b). Multimodal Analysis of Cell Types in a Hypothalamic Node Controlling Social Behavior. Cell 179, 713–728.e17. [DOI] [PMC free article] [PubMed] [Google Scholar]
- Kim EJ, Zhang Z, Huang L, Ito-Cole T, Jacobs MW, Juavinett AL, Senturk G, Hu M, Ku M, Ecker JR, et al. (2020). Extraction of Distinct Neuronal Cell Types from within a Genetically Continuous Population. Neuron 107, 274–282.e6. [DOI] [PMC free article] [PubMed] [Google Scholar]
- Kinde B, Gabel HW, Gilbert CS, Griffith EC, and Greenberg ME (2015). Reading the unique DNA methylation landscape of the brain: Non-CpG methylation, hydroxymethylation, and MeCP2. Proc. Natl. Acad. Sci. U. S. A 112, 6800–6806. [DOI] [PMC free article] [PubMed] [Google Scholar]
- Konstantinides N, Kapuralin K, Fadil C, Barboza L, Satija R, and Desplan C (2018). Phenotypic Convergence: Distinct Transcription Factors Regulate Common Terminal Features. Cell 174, 622–635.e13. [DOI] [PMC free article] [PubMed] [Google Scholar]
- Kozareva V, Martin C, Osorno T, Rudolph S, Guo C, Vanderburg C, Nadaf N, Regev A, Regehr W, and Macosko E (2020). A transcriptomic atlas of the mouse cerebellum reveals regional specializations and novel cell types.
- Kozlenkov A, Li J, Apontes P, Hurd YL, Byne WM, Koonin EV, Wegner M, Mukamel EA, and Dracheva S (2018). A unique role for DNA (hydroxy)methylation in epigenetic regulation of human inhibitory neurons. Science Advances 4, eaau6190. [DOI] [PMC free article] [PubMed] [Google Scholar]
- Kriaucionis S, and Heintz N (2009). The nuclear DNA base 5-hydroxymethylcytosine is present in Purkinje neurons and the brain. Science 324, 929–930. [DOI] [PMC free article] [PubMed] [Google Scholar]
- Krienen FM, Goldman M, Zhang Q, C H Del Rosario R, Florio M, Machold R, Saunders A, Levandowski K, Zaniewski H, Schuman B, et al. (2020). Innovations present in the primate interneuron repertoire. Nature 586, 262–269. [DOI] [PMC free article] [PubMed] [Google Scholar]
- Lacar B, Linker SB, Jaeger BN, Krishnaswami S, Barron J, Kelder M, Parylak S, Paquola A, Venepally P, Novotny M, et al. (2016). Nuclear RNA-seq of single neurons reveals molecular signatures of activation. Nat. Commun 7, 11022. [DOI] [PMC free article] [PubMed] [Google Scholar]
- Lake BB, Ai R, Kaeser GE, Salathia NS, Yung YC, Liu R, Wildberg A, Gao D, Fung H-L, Chen S, et al. (2016). Neuronal subtypes and diversity revealed by single-nucleus RNA sequencing of the human brain. Science 352, 1586–1590. [DOI] [PMC free article] [PubMed] [Google Scholar]
- Lake BB, Codeluppi S, Yung YC, Gao D, Chun J, Kharchenko PV, Linnarsson S, and Zhang K (2017). A comparative strategy for single-nucleus and single-cell transcriptomes confirms accuracy in predicted cell-type expression from nuclear RNA. Sci. Rep 7, 6031. [DOI] [PMC free article] [PubMed] [Google Scholar]
- Lake BB, Chen S, Sos BC, Fan J, Kaeser GE, Yung YC, Duong TE, Gao D, Chun J, Kharchenko PV, et al. (2018). Integrative single-cell analysis of transcriptional and epigenetic states in the human adult brain. Nat. Biotechnol. 36, 70–80. [DOI] [PMC free article] [PubMed] [Google Scholar]
- La Manno G, Soldatov R, Zeisel A, Braun E, Hochgerner H, Petukhov V, Lidschreiber K, Kastriti ME, Lönnerberg P, Furlan A, et al. (2018). RNA velocity of single cells. Nature 560, 494–498. [DOI] [PMC free article] [PubMed] [Google Scholar]
- La Manno G, Siletti K, Furlan A, Gyllborg D, Vinsland E, Langseth CM, Khven I, Johnsson A, Nilsson M, Lönnerberg P, et al. (2020). Molecular architecture of the developing mouse brain. [DOI] [PubMed]
- Lareau CA, Duarte FM, Chew JG, Kartha VK, Burkett ZD, Kohlway AS, Pokholok D, Aryee MJ, Steemers FJ, Lebofsky R, et al. (2019). Droplet-based combinatorial indexing for massive-scale single-cell chromatin accessibility. Nat. Biotechnol 37, 916–924. [DOI] [PMC free article] [PubMed] [Google Scholar]
- Lee D-S, Luo C, Zhou J, Chandran S, Rivkin A, Bartlett A, Nery JR, Fitzpatrick C, O’Connor C, Dixon JR, et al. (2019). Simultaneous profiling of 3D genome structure and DNA methylation in single human cells. Nat. Methods 16, 999–1006. [DOI] [PMC free article] [PubMed] [Google Scholar]
- Li G, Liu Y, Zhang Y, Kubo N, Yu M, Fang R, Kellis M, and Ren B (2019a). Joint profiling of DNA methylation and chromatin architecture in single cells. Nat. Methods 16, 991–993. [DOI] [PMC free article] [PubMed] [Google Scholar]
- Li H, Horns F, Wu B, Xie Q, Li J, Li T, Luginbuhl DJ, Quake SR, and Luo L (2017). Classifying Drosophila Olfactory Projection Neuron Subtypes by Single-Cell RNA Sequencing. Cell 171, 1206–1220.e22. [DOI] [PMC free article] [PubMed] [Google Scholar]
- Li M, Santpere G, Imamura Kawasawa Y, Evgrafov OV, Gulden FO, Pochareddy S, Sunkin SM, Li Z, Shin Y, Zhu Y, et al. (2018). Integrative functional genomic analysis of human brain development and neuropsychiatric risks. Science 362. [DOI] [PMC free article] [PubMed] [Google Scholar]
- Li YE, Preissl S, Hou X, Zhang Z, Zhang K, Fang R, Qiu Y, Poirion O, Li B, Liu H, et al. (2020). An Atlas of Gene Regulatory Elements in Adult Mouse Cerebrum. [DOI] [PMC free article] [PubMed]
- Li Z, Schulz MH, Look T, Begemann M, Zenke M, and Costa IG (2019b). Identification of transcription factor binding sites using ATAC-seq. Genome Biol 20, 45. [DOI] [PMC free article] [PubMed] [Google Scholar]
- Lieberman-Aiden E, van Berkum NL, Williams L, Imakaev M, Ragoczy T, Telling A, Amit I, Lajoie BR, Sabo PJ, Dorschner MO, et al. (2009). Comprehensive mapping of long-range interactions reveals folding principles of the human genome. Science 326, 289–293. [DOI] [PMC free article] [PubMed] [Google Scholar]
- Lister R, Mukamel EA, Nery JR, Urich M, Puddifoot CA, Johnson ND, Lucero J, Huang Y, Dwork AJ, Schultz MD, et al. (2013). Global epigenomic reconfiguration during mammalian brain development. Science 341, 1237905. [DOI] [PMC free article] [PubMed] [Google Scholar]
- Liu H, Zhou J, Tian W, Luo C, Bartlett A, Aldridge A, Lucero J, Osteen JK, Nery JR, Chen H, et al. (2020). DNA Methylation Atlas of the Mouse Brain at Single-Cell Resolution. [DOI] [PMC free article] [PubMed]
- Liu Y, Beyer A, and Aebersold R (2016). On the Dependency of Cellular Protein Levels on mRNA Abundance. Cell 165, 535–550. [DOI] [PubMed] [Google Scholar]
- Lopez R, Regier J, Cole MB, Jordan MI, and Yosef N (2018). Deep generative modeling for single-cell transcriptomics. Nat. Methods 15, 1053–1058. [DOI] [PMC free article] [PubMed] [Google Scholar]
- Lubeck E, and Cai L (2012). Single-cell systems biology by super-resolution imaging and combinatorial labeling. Nat. Methods 9, 743–748. [DOI] [PMC free article] [PubMed] [Google Scholar]
- Luecken MD, and Theis FJ (2019). Current best practices in single-cell RNA-seq analysis: a tutorial. Mol. Syst. Biol 15, e8746. [DOI] [PMC free article] [PubMed] [Google Scholar]
- Luo C, Keown CL, Kurihara L, Zhou J, He Y, Li J, Castanon R, Lucero J, Nery JR, Sandoval JP, et al. (2017). Single-cell methylomes identify neuronal subtypes and regulatory elements in mammalian cortex. Science 357, 600–604. [DOI] [PMC free article] [PubMed] [Google Scholar]
- Luo C, Rivkin A, Zhou J, Sandoval JP, Kurihara L, Lucero J, Castanon R, Nery JR, Pinto-Duarte A, Bui B, et al. (2018a). Robust single-cell DNA methylome profiling with snmC-seq2. Nat. Commun 9, 3824. [DOI] [PMC free article] [PubMed] [Google Scholar]
- Luo C, Liu H, Wang B-A, Bartlett A, Rivkin A, Nery JR, and Ecker JR (2018b). Multi-omic profiling of transcriptome and DNA methylome in single nuclei with molecular partitioning.
- Luo C, Liu H, Xie F, Armand EJ, Siletti K, Bakken T, Fang R, Doyle WI, Hodge RD, Hu L, et al. (2019). Single nucleus multi-omics links human cortical cell regulatory genome diversity to disease risk variants. [DOI] [PMC free article] [PubMed]
- Macosko EZ, Basu A, Satija R, Nemesh J, Shekhar K, Goldman M, Tirosh I, Bialas AR, Kamitaki N, Martersteck EM, et al. (2015). Highly Parallel Genome-wide Expression Profiling of Individual Cells Using Nanoliter Droplets. Cell 161, 1202–1214. [DOI] [PMC free article] [PubMed] [Google Scholar]
- Marques S, Zeisel A, Codeluppi S, van Bruggen D, Mendanha Falcão A, Xiao L, Li H, Häring M, Hochgerner H, Romanov RA, et al. (2016). Oligodendrocyte heterogeneity in the mouse juvenile and adult central nervous system. Science 352, 1326–1329. [DOI] [PMC free article] [PubMed] [Google Scholar]
- Masuda T, Sankowski R, Staszewski O, Böttcher C, Amann L, Sagar, Scheiwe C, Nessler S, Kunz P, van Loo G, et al. (2019). Spatial and temporal heterogeneity of mouse and human microglia at single-cell resolution. Nature 566, 388–392. [DOI] [PubMed] [Google Scholar]
- Mathys H, Davila-Velderrain J, Peng Z, Gao F, Mohammadi S, Young JZ, Menon M, He L, Abdurrob F, Jiang X, et al. (2019). Single-cell transcriptomic analysis of Alzheimer’s disease. Nature [DOI] [PMC free article] [PubMed]
- Mayer C, Hafemeister C, Bandler RC, Machold R, Batista Brito R, Jaglin X, Allaway K, Butler A, Fishell G, and Satija R (2018). Developmental diversification of cortical inhibitory interneurons. Nature 555, 457–462. [DOI] [PMC free article] [PubMed] [Google Scholar]
- Maze I, Wenderski W, Noh K-M, Bagot RC, Tzavaras N, Purushothaman I, Elsässer SJ, Guo Y, Ionete C, Hurd YL, et al. (2015). Critical Role of Histone Turnover in Neuronal Transcription and Plasticity. Neuron 87, 77–94. [DOI] [PMC free article] [PubMed] [Google Scholar]
- McInnes L, Healy J, and Melville J (2018). UMAP: Uniform Manifold Approximation and Projection for Dimension Reduction.
- Mellén M, Ayata P, and Heintz N (2017). 5-hydroxymethylcytosine accumulation in postmitotic neurons results in functional demethylation of expressed genes. Proc. Natl. Acad. Sci. U. S. A 114, E7812–E7821. [DOI] [PMC free article] [PubMed] [Google Scholar]
- Mich JK, Graybuck LT, Hess EE, Mahoney JT, Kojima Y, Ding Y, Somasundaram S, Miller JA, Weed N, Omstead V, et al. (2020). Functional enhancer elements drive subclass-selective expression from mouse to primate neocortex. [DOI] [PMC free article] [PubMed]
- Middleton SA, Eberwine J, and Kim J (2019). Comprehensive catalog of dendritically localized mRNA isoforms from sub-cellular sequencing of single mouse neurons. BMC Biol 17, 5. [DOI] [PMC free article] [PubMed] [Google Scholar]
- Mo A, Mukamel EA, Davis FP, Luo C, Henry GL, Picard S, Urich MA, Nery JR, Sejnowski TJ, Lister R, et al. (2015). Epigenomic Signatures of Neuronal Diversity in the Mammalian Brain. Neuron 86, 1369–1384. [DOI] [PMC free article] [PubMed] [Google Scholar]
- Moffitt JR, Bambah-Mukku D, Eichhorn SW, Vaughn E, Shekhar K, Perez JD, Rubinstein ND, Hao J, Regev A, Dulac C, et al. (2018). Molecular, spatial, and functional single-cell profiling of the hypothalamic preoptic region. Science 362. [DOI] [PMC free article] [PubMed] [Google Scholar]
- Mooijman D, Dey SS, Boisset J-C, Crosetto N, and van Oudenaarden A (2016). Single-cell 5hmC sequencing reveals chromosome-wide cell-to-cell variability and enables lineage reconstruction. Nat. Biotechnol 34, 852–856. [DOI] [PubMed] [Google Scholar]
- Mulqueen RM, Pokholok D, Norberg SJ, Torkenczy KA, Fields AJ, Sun D, Sinnamon JR, Shendure J, Trapnell C, O’Roak BJ, et al. (2018). Highly scalable generation of DNA methylation profiles in single cells. Nat. Biotechnol 36, 428–431. [DOI] [PMC free article] [PubMed] [Google Scholar]
- Nagy C, Maitra M, Tanti A, Suderman M, Théroux J-F, Davoli MA, Perlman K, Yerko V, Wang YC, Tripathy SJ, et al. (2020). Single-nucleus transcriptomics of the prefrontal cortex in major depressive disorder implicates oligodendrocyte precursor cells and excitatory neurons. Nat. Neurosci 23, 771–781. [DOI] [PubMed] [Google Scholar]
- Nord AS, and West AE (2019). Neurobiological functions of transcriptional enhancers. Nat. Neurosci [DOI] [PMC free article] [PubMed]
- Nowakowski TJ, Bhaduri A, Pollen AA, Alvarado B, Mostajo-Radji MA, Di Lullo E, Haeussler M, Sandoval-Espinosa C, Liu SJ, Velmeshev D, et al. (2017). Spatiotemporal gene expression trajectories reveal developmental hierarchies of the human cortex. Science 358, 1318–1323. [DOI] [PMC free article] [PubMed] [Google Scholar]
- Paul A, Crow M, Raudales R, He M, Gillis J, and Huang ZJ (2017). Transcriptional Architecture of Synaptic Communication Delineates GABAergic Neuron Identity. Cell 171, 522–539.e20. [DOI] [PMC free article] [PubMed] [Google Scholar]
- Pliner HA, Packer JS, McFaline-Figueroa JL, Cusanovich DA, Daza RM, Aghamirzaie D, Srivatsan S, Qiu X, Jackson D, Minkina A, et al. (2018). Cicero Predicts cis-Regulatory DNA Interactions from Single-Cell Chromatin Accessibility Data. Mol. Cell 0. [DOI] [PMC free article] [PubMed] [Google Scholar]
- Pollen AA, Nowakowski TJ, Chen J, Retallack H, Sandoval-Espinosa C, Nicholas CR, Shuga J, Liu SJ, Oldham MC, Diaz A, et al. (2015). Molecular identity of human outer radial glia during cortical development. Cell 163, 55–67. [DOI] [PMC free article] [PubMed] [Google Scholar]
- Pott S (2017). Simultaneous measurement of chromatin accessibility, DNA methylation, and nucleosome phasing in single cells. Elife 6. [DOI] [PMC free article] [PubMed] [Google Scholar]
- Preissl S, Fang R, Huang H, Zhao Y, Raviram R, Gorkin DU, Zhang Y, Sos BC, Afzal V, Dickel DE, et al. (2018). Single-nucleus analysis of accessible chromatin in developing mouse forebrain reveals cell-type-specific transcriptional regulation. Nat. Neurosci 21, 432–439. [DOI] [PMC free article] [PubMed] [Google Scholar]
- Raj A, van den Bogaard P, Rifkin SA, van Oudenaarden A, and Tyagi S (2008). Imaging individual mRNA molecules using multiple singly labeled probes. Nat. Methods 5, 877–879. [DOI] [PMC free article] [PubMed] [Google Scholar]
- Raj B, Wagner DE, McKenna A, Pandey S, Klein AM, Shendure J, Gagnon JA, and Schier AF (2018). Simultaneous single-cell profiling of lineages and cell types in the vertebrate brain. Nat. Biotechnol 36, 442–450. [DOI] [PMC free article] [PubMed] [Google Scholar]
- Renthal W, Boxer LD, Hrvatin S, Li E, Silberfeld A, Nagy MA, Griffith EC, Vierbuchen T, and Greenberg ME (2018). Characterization of human mosaic Rett syndrome brain tissue by single-nucleus RNA sequencing. Nat. Neurosci 21, 1670–1679. [DOI] [PMC free article] [PubMed] [Google Scholar]
- Roadmap Epigenomics Consortium, Meuleman W, Yen A, Wang J, Ziller MJ, Amin V, Ward LD, Sarkar A, Quon G, Sandstrom RS, et al. (2015). Integrative analysis of 111 reference human epigenomes. Nature 518, 317–330. [DOI] [PMC free article] [PubMed] [Google Scholar]
- Rodriques SG, Stickels RR, Goeva A, Martin CA, Murray E, Vanderburg CR, Welch J, Chen LM, Chen F, and Macosko EZ (2019). Slide-seq: A scalable technology for measuring genome-wide expression at high spatial resolution. Science 363, 1463–1467. [DOI] [PMC free article] [PubMed] [Google Scholar]
- Rosenberg AB, Roco CM, Muscat RA, Kuchina A, Sample P, Yao Z, Graybuck LT, Peeler DJ, Mukherjee S, Chen W, et al. (2018). Single-cell profiling of the developing mouse brain and spinal cord with split-pool barcoding. Science 360, 176–182. [DOI] [PMC free article] [PubMed] [Google Scholar]
- Rostom R, Svensson V, Teichmann SA, and Kar G (2017). Computational approaches for interpreting scRNA-seq data. FEBS Lett 591, 2213–2225. [DOI] [PMC free article] [PubMed] [Google Scholar]
- Saunders A, Macosko EZ, Wysoker A, Goldman M, Krienen FM, de Rivera H, Bien E, Baum M, Bortolin L, Wang S, et al. (2018). Molecular Diversity and Specializations among the Cells of the Adult Mouse Brain. Cell 174, 1015–1030.e16. [DOI] [PMC free article] [PubMed] [Google Scholar]
- Scala F, Kobak D, Bernabucci M, Bernaerts Y, Cadwell CR, Castro JR, Hartmanis L, Jiang X, Laturnus SR, Miranda E, et al. (2020). Phenotypic variation within and across transcriptomic cell types in mouse motor cortex. [DOI] [PMC free article] [PubMed]
- Schep AN, Wu B, Buenrostro JD, and Greenleaf WJ (2017). chromVAR: inferring transcription-factor-associated accessibility from single-cell epigenomic data. Nat. Methods 14, 975–978. [DOI] [PMC free article] [PubMed] [Google Scholar]
- Schirmer L, Velmeshev D, Holmqvist S, Kaufmann M, Werneburg S, Jung D, Vistnes S, Stockley JH, Young A, Steindel M, et al. (2019). Neuronal vulnerability and multilineage diversity in multiple sclerosis. Nature 573, 75–82. [DOI] [PMC free article] [PubMed] [Google Scholar]
- Shapiro E, Biezuner T, and Linnarsson S (2013). Single-cell sequencing-based technologies will revolutionize whole-organism science. Nat. Rev. Genet 14, 618–630. [DOI] [PubMed] [Google Scholar]
- Shekhar K, Lapan SW, Whitney IE, Tran NM, Macosko EZ, Kowalczyk M, Adiconis X, Levin JZ, Nemesh J, Goldman M, et al. (2016). Comprehensive Classification of Retinal Bipolar Neurons by Single-Cell Transcriptomics. Cell 166, 1308–1323.e30. [DOI] [PMC free article] [PubMed] [Google Scholar]
- Smallwood SA, Lee HJ, Angermueller C, Krueger F, Saadeh H, Peat J, Andrews SR, Stegle O, Reik W, and Kelsey G (2014). Single-cell genome-wide bisulfite sequencing for assessing epigenetic heterogeneity. Nat. Methods 11, 817–820. [DOI] [PMC free article] [PubMed] [Google Scholar]
- Soneson C, and Robinson MD (2018). Bias, robustness and scalability in single-cell differential expression analysis. Nat. Methods [DOI] [PubMed]
- Ståhl PL, Salmén F, Vickovic S, Lundmark A, Navarro JF, Magnusson J, Giacomello S, Asp M, Westholm JO, Huss M, et al. (2016). Visualization and analysis of gene expression in tissue sections by spatial transcriptomics. Science 353, 78–82. [DOI] [PubMed] [Google Scholar]
- Stanley G, Gokce O, Malenka RC, Südhof TC, and Quake SR (2020). Continuous and Discrete Neuron Types of the Adult Murine Striatum. Neuron 105, 688–699.e8. [DOI] [PubMed] [Google Scholar]
- Stuart T, and Satija R (2019). Integrative single-cell analysis. Nat. Rev. Genet [DOI] [PubMed]
- Stuart T, Butler A, Hoffman P, Hafemeister C, Papalexi E, Mauck WM 3rd, Hao Y, Stoeckius M, Smibert P, and Satija R (2019). Comprehensive Integration of Single-Cell Data. Cell 177, 1888–1902.e21. [DOI] [PMC free article] [PubMed] [Google Scholar]
- Su Y, Shin J, Zhong C, Wang S, Roychowdhury P, Lim J, Kim D, Ming G-L, and Song H (2017). Neuronal activity modifies the chromatin accessibility landscape in the adult brain. Nat. Neurosci 20, 476–483. [DOI] [PMC free article] [PubMed] [Google Scholar]
- Sun S, Zhu J, Ma Y, and Zhou X (2019). Accuracy, robustness and scalability of dimensionality reduction methods for single-cell RNA-seq analysis. Genome Biol 20, 269. [DOI] [PMC free article] [PubMed] [Google Scholar]
- Tan L, Xing D, Daley N, and Xie XS (2019). Three-dimensional genome structures of single sensory neurons in mouse visual and olfactory systems. Nat. Struct. Mol. Biol 26, 297–307. [DOI] [PubMed] [Google Scholar]
- Tasic B, Menon V, Nguyen TN, Kim TK, Jarsky T, Yao Z, Levi B, Gray LT, Sorensen SA, Dolbeare T, et al. (2016). Adult mouse cortical cell taxonomy revealed by single cell transcriptomics. Nat. Neurosci 19, 335–346. [DOI] [PMC free article] [PubMed] [Google Scholar]
- Tasic B, Yao Z, Graybuck LT, Smith KA, Nguyen TN, Bertagnolli D, Goldy J, Garren E, Economo MN, Viswanathan S, et al. (2018). Shared and distinct transcriptomic cell types across neocortical areas. Nature 563, 72–78. [DOI] [PMC free article] [PubMed] [Google Scholar]
- Telley L, Agirman G, Prados J, Amberg N, Fièvre S, Oberst P, Bartolini G, Vitali I, Cadilhac C, Hippenmeyer S, et al. (2019). Temporal patterning of apical progenitors and their daughter neurons in the developing neocortex. Science 364. [DOI] [PubMed] [Google Scholar]
- Tiklová K, Björklund ÅK, Lahti L, Fiorenzano A, Nolbrant S, Gillberg L, Volakakis N, Yokota C, Hilscher MM, Hauling T, et al. (2019). Single-cell RNA sequencing reveals midbrain dopamine neuron diversity emerging during mouse brain development. Nat. Commun 10, 581. [DOI] [PMC free article] [PubMed] [Google Scholar]
- Tosches MA, and Laurent G (2019). Evolution of neuronal identity in the cerebral cortex. Curr. Opin. Neurobiol 56, 199–208. [DOI] [PubMed] [Google Scholar]
- Traag VA, Waltman L, and van Eck NJ (2019). From Louvain to Leiden: guaranteeing well-connected communities. Sci. Rep 9, 5233. [DOI] [PMC free article] [PubMed] [Google Scholar]
- Trapnell C, Cacchiarelli D, Grimsby J, Pokharel P, Li S, Morse M, Lennon NJ, Livak KJ, Mikkelsen TS, and Rinn JL (2014). The dynamics and regulators of cell fate decisions are revealed by pseudotemporal ordering of single cells. Nat. Biotechnol 32, 381–386. [DOI] [PMC free article] [PubMed] [Google Scholar]
- Trevino AE, Sinnott-Armstrong N, Andersen J, Yoon S-J, Huber N, Pritchard JK, Chang HY, Greenleaf WJ, and Pașca SP (2020). Chromatin accessibility dynamics in a model of human forebrain development. Science 367. [DOI] [PMC free article] [PubMed] [Google Scholar]
- Tushev G, Glock C, Heumüller M, Biever A, Jovanovic M, and Schuman EM (2018). Alternative 3’ UTRs Modify the Localization, Regulatory Potential, Stability, and Plasticity of mRNAs in Neuronal Compartments. Neuron 98, 495–511.e6. [DOI] [PubMed] [Google Scholar]
- Velmeshev D, Schirmer L, Jung D, Haeussler M, Perez Y, Mayer S, Bhaduri A, Goyal N, Rowitch DH, and Kriegstein AR (2019). Single-cell genomics identifies cell type–specific molecular changes in autism. Science 364, 685–689. [DOI] [PMC free article] [PubMed] [Google Scholar]
- Wang D, Liu S, Warrell J, Won H, Shi X, Navarro FCP, Clarke D, Gu M, Emani P, Yang YT, et al. (2018a). Comprehensive functional genomic resource and integrative model for the human brain. Science 362. [DOI] [PMC free article] [PubMed] [Google Scholar]
- Wang T, Li B, Nelson CE, and Nabavi S (2019). Comparative analysis of differential gene expression analysis tools for single-cell RNA sequencing data. BMC Bioinformatics 20, 40. [DOI] [PMC free article] [PubMed] [Google Scholar]
- Wang X, Allen WE, Wright MA, Sylwestrak EL, Samusik N, Vesuna S, Evans K, Liu C, Ramakrishnan C, Liu J, et al. (2018b). Three-dimensional intact-tissue sequencing of single-cell transcriptional states. Science 361. [DOI] [PMC free article] [PubMed] [Google Scholar]
- Welch JD, Kozareva V, Ferreira A, Vanderburg C, Martin C, and Macosko EZ (2019). Single-Cell Multi-omic Integration Compares and Contrasts Features of Brain Cell Identity. Cell 177, 1873–1887.e17. [DOI] [PMC free article] [PubMed] [Google Scholar]
- Winick-Ng W, Kukalev A, Harabula I, Redondo LZ, Meijer M, Serebreni L, Bianco S, Szabo D, Chiariello AM, Azcarate II, et al. (2020). Cell-type specialization in the brain is encoded by specific long-range chromatin topologies.
- Wolf FA, Angerer P, and Theis FJ (2018). SCANPY: large-scale single-cell gene expression data analysis. Genome Biol 19, 15. [DOI] [PMC free article] [PubMed] [Google Scholar]
- Wolock SL, Lopez R, and Klein AM (2019). Scrublet: Computational Identification of Cell Doublets in Single-Cell Transcriptomic Data. Cell Syst 8, 281–291.e9. [DOI] [PMC free article] [PubMed] [Google Scholar]
- Wu YE, Pan L, Zuo Y, Li X, and Hong W (2017). Detecting Activated Cell Populations Using Single-Cell RNA-Seq. Neuron 96, 313–329.e6. [DOI] [PubMed] [Google Scholar]
- Xia C, Fan J, Emanuel G, Hao J, and Zhuang X (2019). Spatial transcriptome profiling by MERFISH reveals subcellular RNA compartmentalization and cell cycle-dependent gene expression. Proc. Natl. Acad. Sci. U. S. A 116, 19490–19499. [DOI] [PMC free article] [PubMed] [Google Scholar]
- Xie W, Barr CL, Kim A, Yue F, Lee AY, Eubanks J, Dempster EL, and Ren B (2012). Base-Resolution Analyses of Sequence and Parent-of-Origin Dependent DNA Methylation in the Mouse Genome. Cell 148, 816–831. [DOI] [PMC free article] [PubMed] [Google Scholar]
- Yao Z, Liu H, Xie F, Fischer S, Adkins RS, Aldrige AI, Ament SA, Bartlett A, Margarita Behrens M, Van den Berge K, et al. (2020a). An integrated transcriptomic and epigenomic atlas of mouse primary motor cortex cell types. [DOI] [PMC free article] [PubMed]
- Yao Z, Nguyen TN, van Velthoven CTJ, Goldy J, Sedeno-Cortes AE, Baftizadeh F, Bertagnolli D, Casper T, Crichton K, Ding S-L, et al. (2020b). A taxonomy of transcriptomic cell types across the isocortex and hippocampal formation. [DOI] [PMC free article] [PubMed]
- Zeisel A, Muñoz-Manchado AB, Codeluppi S, Lönnerberg P, La Manno G, Juréus A, Marques S, Munguba H, He L, Betsholtz C, et al. (2015). Brain structure. Cell types in the mouse cortex and hippocampus revealed by single-cell RNA-seq. Science 347, 1138–1142. [DOI] [PubMed] [Google Scholar]
- Zeisel A, Hochgerner H, Lönnerberg P, Johnsson A, Memic F, van der Zwan J, Häring M, Braun E, Borm LE, La Manno G, et al. (2018). Molecular Architecture of the Mouse Nervous System. Cell 174, 999–1014.e22. [DOI] [PMC free article] [PubMed] [Google Scholar]
- Zeng H, and Sanes JR (2017). Neuronal cell-type classification: challenges, opportunities and the path forward. Nat. Rev. Neurosci 18, 530–546. [DOI] [PubMed] [Google Scholar]
- Zhang M, Eichhorn SW, Zingg B, Yao Z, Zeng H, Dong H, and Zhuang X (2020a). Molecular, spatial and projection diversity of neurons in primary motor cortex revealed by in situ single-cell transcriptomics.
- Zhang Z, Zhou J, Tan P, Pang Y, Rivkin A, Kirchgessner MA, Williams E, Lee C-T, Liu H, Franklin AD, et al. (2020b). Epigenomic Diversity of Cortical Projection Neurons in the Mouse Brain. [DOI] [PMC free article] [PubMed]
- Zhong S, Zhang S, Fan X, Wu Q, Yan L, Dong J, Zhang H, Li L, Sun L, Pan N, et al. (2018). A single-cell RNA-seq survey of the developmental landscape of the human prefrontal cortex. Nature 555, 524–528. [DOI] [PubMed] [Google Scholar]
- Zhong S, Ding W, Sun L, Lu Y, Dong H, Fan X, Liu Z, Chen R, Zhang S, Ma Q, et al. (2020). Decoding the development of the human hippocampus. Nature [DOI] [PubMed]
- Zhou J, Ma J, Chen Y, Cheng C, Bao B, Peng J, Sejnowski TJ, Dixon JR, and Ecker JR (2019). Robust single-cell Hi-C clustering by convolution- and random-walk-based imputation. Proc. Natl. Acad. Sci. U. S. A 116, 14011–14018. [DOI] [PMC free article] [PubMed] [Google Scholar]
- Zhou Y, Song WM, Andhey PS, Swain A, Levy T, Miller KR, Poliani PL, Cominelli M, Grover S, Gilfillan S, et al. (2020). Human and mouse single-nucleus transcriptomics reveal TREM2-dependent and TREM2-independent cellular responses in Alzheimer’s disease. Nat. Med 26, 131–142. [DOI] [PMC free article] [PubMed] [Google Scholar]
- Zhu C, Yu M, Huang H, Juric I, Abnousi A, Hu R, Lucero J, Behrens MM, Hu M, and Ren B (2019). An ultra high-throughput method for single-cell joint analysis of open chromatin and transcriptome. Nat. Struct. Mol. Biol [DOI] [PMC free article] [PubMed]
- Zhu C, Preissl S, and Ren B (2020). Single-cell multimodal omics: the power of many. Nat. Methods 17, 11–14. [DOI] [PubMed] [Google Scholar]
- Ziegenhain C, Vieth B, Parekh S, Reinius B, Guillaumet-Adkins A, Smets M, Leonhardt H, Heyn H, Hellmann I, and Enard W (2017). Comparative Analysis of Single-Cell RNA Sequencing Methods. Mol. Cell 65, 631–643.e4. [DOI] [PubMed] [Google Scholar]