

Abstract
This study presents a novel computational approach to study molecular recognition and binding kinetics for drug-like compounds dissociating from a flexible protein system. The intermediates and their free energy profile during ligand association and dissociation processes control ligand–protein binding kinetics and bring a more complete picture of ligand–protein binding. The method applied the milestoning theory to extract kinetics and thermodynamics information from running short classical molecular dynamics (MD) simulations for frames from a given dissociation path. High-dimensional ligand-protein motions (3N-6 degrees of freedom) during ligand dissociation were reduced by use of principal component modes for assigning more than 100 milestones, and classical MD runs were allowed to travel multiple milestones to efficiently obtain ensemble distribution of initial structures for MD simulations and estimate the transition time and rate during ligand traveling between milestones. We used five pyrazolourea ligands and cyclin-dependent kinase 8 with cyclin C (CDK8/CycC) as our model system as well as metadynamics and a pathway search method to sample dissociation pathways. With our strategy, we constructed the free energy profile for highly mobile biomolecular systems. The computed binding free energy and residence time correctly ranked the pyrazolourea ligand series, in agreement with experimental data. Guided by a barrier of a ligand passing an αC helix and activation loop, we introduced one hydroxyl group to parent compounds to design our ligands with increased residence time and validated our prediction by experiments. This work provides a novel and robust approach to investigate dissociation kinetics of large and flexible systems for understanding unbinding mechanisms and designing new small-molecule drugs with desired binding kinetics.
Graphical Abstract

INTRODUCTION
Binding kinetics has become an important topic in molecular recognition because of the importance of fully understanding binding/unbinding and the growing awareness of the correlation between kinetics and drug efficacy.1–5 Drug binding residence time, which can be estimated by a dissociation rate constant, 1/koff, is particularly important for determining the efficacy and selectivity of drug candidates. Experiments provide measured binding affinities (ΔG), rate constants (kon and koff), and molecular structures. However, details are not fully presented by the experimental values and static conformations. As well, why a compound can bind/unbind quickly or slowly is not fully understood. Molecular simulations, which are able to provide atomistic descriptions of temporal and spatial details of ligand–protein association and dissociation processes, become an important tool to characterize mechanistic features of binding kinetics and further assist drug development.6 Features that govern binding kinetics are system-dependent and include ligand properties, conformational fluctuations, intermolecular interactions, and solvent effects.7–12 However, the determinants to adjust when optimizing kinetic properties for a drug discovery project are not well understood.
All-atom molecular dynamics (MD) simulation in an explicit solvent has been widely used to investigate protein dynamics and function as well as ligand–protein binding affinity. However, ligand binding/unbinding processes can be excessively longer than microsecond simulation lengths, and modeling these very long processes with classical MD needs the computer hardware not available to most scientists.13–15 Various methods such as accelerated MD, metadynamics, weighted ensemble, scale-MD, and PaCS-MD have been used to accelerate sampling the ligand binding/unbinding processes.16–27 In terms of the binding paths found, various algorithms such as umbrella sampling28,29 and milestoning30–35 have been used to estimate kinetic rates and free energy profiles. Multiple states may be identified from the trajectories, and the Markov state model (MSM) can be applied to estimate the transition rates between these structurally different states.36,37 Using a reaction coordinate to accurately present ligandunbinding free energy barriers provides invaluable information to understand binding kinetics and the mechanism. However, the task becomes daunting when a ligand–protein system under study is large and flexible. All important degrees of freedom involved during the unbinding processes must be included, but the use of high dimensionality to construct the ligand-unbinding free energy plot is impractical with umbrella sampling or the milestoning theory. Therefore, this work developed strategies to obtain variables that cover important degrees of freedom for constructing a ligand-unbinding free energy profile with the milestoning theory.
Cyclin-dependent kinase 8 (CDK8) is a promising cancer drug target because of its vital role in regulation.38 CDK8 forms a complex with cyclin C (CycC), Med12, and Med13 for phosphorylation involved in positive and negative signaling of transcription and regulation of transcription activities.39,40 Abnormal activities of CDK8 and its partner CycC are implicated in various human cancers.41 CDK8 has an allosteric binding site adjacent to the ATP binding controlled by a DMG motif (Asp-Met-Gly) that characterizes the DFG-in/DFG-out conformations as in other protein kinases.42 A series of CDK8 drug candidates were discovered by structure-based drug design and virtual screening,43,44 and a series of pyrazolourea ligands (PLs) have been developed for CDK8.45 A few studies have used MD simulations to examine the structural stability and ligand binding of the CDK8/CycC complex46,47 A recent work used a metadynamics-based protocol to successfully rank the experimental residence time of CDK8 inhibitors.48 The screening method provides a tool to identify inhibitors with relatively short or long residence time; however, further investigation to understand determinants with atomistic details that govern the binding kinetics is needed.
In this work, we sampled dissociation pathways by using metadynamics and the newly developed pathway search guided by the internal motions (PSIM) method.49 The free energy profile and residence time for five PLs shown in Figure 1 were computed by using the milestoning theory with a novel algorithm to define the milestones. The work developed a new strategy involving principal component analysis (PCA), a mathematical method that can be used to extract the major motions from a collection of data, to define unbinding coordinates for constructing unbinding free energy barriers by using the milestoning theory. By projecting the ligand unbinding trajectories onto the first two principal components (PCs), we were able to provide an unbinding coordinate for our milestones that considered 3N-6 degrees of freedom to capture the most important degrees of freedom involved during ligand unbinding, where N was the number of atoms.50 Different from MSM, which usually considers a handful of discrete states, we used more than 100 milestones to reveal smooth and detailed molecular motions and interactions corresponding to the unbinding free energy barriers. We also directly used frames from a dissociation trajectory to initiate more than 10,000 classical MD simulations to study ligand transition kinetics between milestones. Existing applications initiate multiple MD runs exactly on a milestone with help from sampling methods such as umbrella sampling, which is time-consuming or even impractical for large and flexible ligand–protein systems. Therefore, we initiated classical MD runs using frames directly from our dissociating trajectory and used unbiased MD simulations to both sample adequate conformations in each milestone and compute their transition lifetime and rates.
Figure 1.

Protein structure and five PL compounds used in this study. Right: CDK8 (gray) and CycC (pink); left: a close-up view of ligand PL2 shown in licorice bound to CDK8. Residues engaged in important interactions with PLs in the bound complex are labeled with one-letter amino acid codes (orange). Conserved H-bonds between the urea linker of all five compounds with Glu66 and Asp173 are shown in red, and the circle indicates the R-group of PL compounds. Three stages of the dissociation process of the PL are represented as a red cylinder (leaving the front pocket, stage 1), a blue cylinder (passing a gate of the deep pocket, stage 2), and a gray amoeba (surface diffusion step, stage 3). Regions with significant motions during ligand unbinding are presented with different colors. Yellow: αC helix, β1, β2, and β8 sheets, and residues 146–148. Magenta: activation loop.
The computed free energy profile for ligand dissociation clearly indicates and explains where and why the energy barriers occur, such as important interaction formations/breakages between the ligand and CDK8 as well as motions of the ligand, CDK8 and CycC. Because the R-group of the PL compounds forms stable van der Waal contacts with CDK8, the R-group does not lead to ligand dissociation. Instead, the R-group serves as a hinge that allows the functional group to rotate and direct ligand unbinding. We found that the intermolecular hydrogen bonds (H-bonds) in crystal structures were critical in maintaining the ligand binding mode in a bound state and breaking a key H-bond cost ~1 kcal/mol, which was in the range of H-bond strength computed with existing calculations. However, the major barriers arise from the concurrent motions of ligands and opening the protein binding site, which resulted in less favorable intermolecular attractions. We suggest the use of a bulky or hydroxyl group right next to the R-group of PL1 and PL4 instead of a linear alkane to increase their binding residence time. The calculations also provided the lower limit of residence time, on a time scale of milliseconds and microseconds, and the trend agreed with experiment data. Our calculations estimated that adding a small hydroxyl group increases the binding residence time by ~2 to 3 times. The new PL4-OH compound was synthesized for experiments, and the kinetic assay validated our design and prediction. Guided by unbinding free energy barriers, the work introduces a new computer-aided design approach to modify compounds for preferred kinetic properties.
METHODS
Molecular Simulations.
We obtained the initial structures of CDK8/CycC–PL complexes from the PDB database (PDB ID: 4F6W, 4F7L, 4F6U, 4F7N45) and manually modified the PDB structures of 4F7N, 4F7L, and 4F6U to obtain the initial structures of CDK8/CycC-PL5, CDK8/CycC-PL1-OH, and CDK8/CycC-PL4-OH, respectively. VCharge51 was used to estimate partial charges of all ligand atoms. We added missing residues and built the missing activation loop of the structures by using Swiss Model52 based on the p38 DFG-out crystal structure (PDB ID: 1W8253) as a template. We determined the protonation states of histidine residues in the CDK8/CycC–ligand complexes by using the MCCE package.54 The AMBER FF14SB force field and GAFF55 were used for the CDK8/CycC complex and PLs. We solvated the five complexes with TIP3P and a water buffer size of 12 Å and added 6 Cl− ions to neutralize the formal charges of the system. After the standard setup detailed in the Supporting Information (SI), production runs of the five systems were performed at 298 K for 500 ns in NPT ensemble and saved every 2 ps with a 2 fs time step by using pmemd.cuda from the AMBER 14 package.
Metadynamics.
We obtained the equilibrated conformations at 298 K and conformations after 100-, 400-, and 500 ns MD simulations as initial structures and performed overall 12 metadynamics simulations starting from these initial structures for each of the CDK8/CycC-ligand complexes. The distance between centers of mass of the heavy atoms on the ligands and the heavy atoms of residues 26 to 38, 96 to 106, and 356 to 359 on CDK8 were chosen as the collective variables (CVs), and the forces from the Gaussian functions were applied on only the atoms in the ligands. A Gaussian of 0.02 kcal/mol was deposited onto the CV coordinate every 0.1 ps. A 1 fs time step was used in the simulations, and the metadynamics runs were performed until the ligand dissociation event occurred (roughly 25–30 ns). The metadynamics simulations were performed with NAMD.56 The metadynamics simulations were saved every 5 ps as initial conformations for milestoning calculations. All the trajectories and data files are available upon request. Input and other example files are available at http://chemcha-gpu0.ucr.edu/software/ under the eBGDD “Download Examples” folder.
Reaction Coordinates and Milestones in Principal Component (PC) Space.
We defined reaction coordinates by two-dimensional projections in the principal components space of high-dimensional protein–ligand configurations. To perform PCA for a metadynamics trajectory, we selected the α-carbon atoms of CDK8/CycC and heavy atoms of PLs and computed the covariance matrix of the Cartesian coordinates of these atoms by using the first frame in each trajectory as references. We saved the eigenvectors of the covariance matrix and used the equation PCi = RT(X(t)–⟨X⟩) to project frames from the metadynamics trajectory onto the PC1 and PC2 space, where RT is the eigenvector with the highest eigenvalue for PC1 and second highest for PC2, and X(t) and ⟨X⟩ are the Cartesian coordinates of the selected atoms at time t and the average over the trajectory, respectively. Frames from a metadynamics trajectory were projected onto the PC1 and PC2 space, as exemplified in Figure 2A. Among the total 12 metadynamics trajectories for each protein–ligand complex, we chose the trajectories whose PC1 and PC2 modes captured the highest percentage of the total variance to construct the milestones of dissociation. The obtained 2-D projections were further smoothed by averaging forward and backward 100 frames, as shown by the red curve in Figure 2A. The smoothed projections serve as preliminary reaction coordinates, which become the final reaction coordinates (green dots in Figure 2A) after the optimization process detailed in the SI. The final reaction coordinates could more clearly represent the dissociation path, and multiple short lines of 20.0 eigenvalue units long were placed perpendicular to the path. Each line was 2.0, 3.0, 4.0, or 6.0 eigenvalue units apart, and the lines were optimized to minimize the overlapping of the lines, as illustrated in Figure 2B. At this point, each line served as one milestone.
Figure 2.

Projection of frames from a metadynamics trajectory of PL2 onto PC1/PC2 coordinates and spatial definition of milestones. A: the metadynamics trajectory and the dissociation pathway projected on the PC1/PC2 space. Black and blue dots present conformations from the metadynamics trajectory when the ligand position was inside or outside the protein binding pocket, respectively. The smoothed projection is illustrated in the red line as preliminary reaction coordinates. Green dots present the manually defined path based on the smoothed projection. B: the smoothed path in A was optimized to remove the frames that do not lead to PL2 dissociation. The optimized path is in purple, and the milestones are shown as black lines.
Computing Free Energy and Unbinding Time by Using the Milestoning Theory.
To construct unbinding free energy and compute the kinetics properties with the milestoning theory, we needed to estimate the probability of a transition between two milestones by using many short classical MD simulations. We prepared initial configurations of short classical MD runs for each complex by resaving a frame every 50 ps from a metadynamics and PSIM trajectory. As a result, about 500 to 650 conformations were used as initial conformations (Table S2). For instance, blue dots in Figure 3 show the projections of total 651 initial conformations of the CDK8/CycC-PL2 complex. We ran 20 replicas of 100 ps classical MD simulations for each initial conformation with a 2 fs time step at 298 K. The overall milestoning computational cost was determined by the number of initial configurations and replicas as well as simulation length. For instance, the milestoning simulation time for each CDK8/CycC-PL2 system was 651 × 20 × 100 ps = 1.302 μs. Frames were saved every 100 fs for each 100 ps MD trajectory, and the settings were the same as the MD simulation mentioned previously. Frames saved from each 100 ps short MD run were then projected onto the PC1/PC2 space and fell into a space between neighboring milestones (Figure 3).
Figure 3.

Projections of 12020 100 ps MD trajectories of CDK8/CycC-PL2 in PC1/PC2 space. The centers of milestones are 4.0 eigenvalue units apart. Blue dots indicate structures taken from a metadynamics trajectory for starting each 100 ps MD run. Gray dots indicate frames moving beyond the milestone lines, and color dots indicate frames moving within milestones. Projections of two selected 100 ps MD trajectories are shown in black curves, whose start/end points are marked as blue/red stars. Inset: Arrows indicate the forward directions of the trajectory. The left trajectory shows a 100 ps MD initiated at a free energy barrier (milestone #50 of Figure 4), and the right trajectory was initiated near a local minimum (milestone #40 of Figure 4). For visualization, the right trajectory was smoothed, with hitting points contributing to the IPD represented as red circles and otherwise as white circles.
The average lifetime and transition time might be less meaningful if they were computed from the conformations that significantly deviated from the defined reaction coordinates as compared with those computed from conformations close to the defined pathway. For this same reason, we removed the data points that fell outside the milestone areas (Figure 3, gray points). The remaining data points were used to compute the duration for each milestone and the transition counts between adjacent milestones. Finally, the transition kernel (matrix) K, free energy profile, and residence time were computed following the milestoning theory.30,32,57 In brief, the probability of a transition between two milestones i and j is Kij, the average lifetime of a milestone i is ti, and the number of trajectories that pass through milestone i in unit time is qi, which is also termed the stationary flux. The steady state qi is given by a solution of the linear equations ΣiqiKij = qi. The stationary probability of milestone i can be approximated by qiti and then relates to the free energy Gi of trajectories that passed milestone i, Gi = −kBT ln(qiti). Error analysis for computed values and free energy profiles are detailed in the Supporting Information. The overall mean first passage time (or residence time) of a ligand passing milestone f from the milestone of a bound state is determined by τf = pt·(I – K)tt.
Postanalysis of Representative Conformations on Milestones.
We performed H-bond analysis and pairwise energy calculations on representative structures among batches of 100 ps classical MD trajectories that were used to construct transitions between neighboring milestones. The representative structure of each milestone is the simulation frame whose projection in the PC1/PC2 space is nearest to the average position of the frames sampled from the initial-point distribution (see Results and Discussion) of the milestone. For each representative structure, we computed the hydrogen bonds (H-bonds) between the PL compound and the CDK8/CycC protein complex by using CPPTRAJ 18.01.58 For an H-bond X–H…Y, the distance between H and Y was limited to 3.0 Å, and the complementary angle of X–H–Y was limited to 30 degrees. Further classifying the binding modes, ligand interactions with the entire CDK8 (359 residues) and residues 360–363 on CycC were computed for each of the seven PL compounds studied. For each residue, we computed the sum of short-ranged van der Waal (vdW) and Coulombic energies to ligand atoms (rcut = 0.8 nm) by using the energy tool within GROMACS 2018.2.59
Compound Synthesis and Kinetics Assay.
PL4-OH was synthesized by ChemConsulting LLC. Information from the synthesized compound is detailed in the SI. Kinetic-assay was conducted by Proteros biostructures GmbH,60 following the same protocol of Schneider et al.45 In brief, the company used the Proteros Reporter Displacement Assay, which was based on reporter probes designed to bind to the binding site of CDK8/CycC, and the proximity between a reporter probe and protein results in the emission of an optical signal. When a test ligand bound to the target protein, the reporter probe was displaced, which led to a signal. Monitoring the time-dependent signal yielded the binding kinetics of the ligand.
RESULTS AND DISCUSSION
The flow of optimizing unbinding kinetics of type-II inhibitors of CDK8 is summarized in Figure S1). Sampling ligand dissociation is the first critical step in investigating binding kinetics. We used metadynamics and the PSIM method to sample dissociation pathways of five type-II inhibitors (PL1, PL2, PL3, PL4, and PL5) whose affinities and residence times had been well studied. Then we applied our new strategy combining MD and the milestoning theory to further quantify the free energy barriers associated with the conformational rearrangements of both the ligand and protein. To demonstrate the use of kinetics information for compound design, we performed experiments to validate that our designed compound (PL4-OH) could increase residence time.
New Strategies for Computing Ligand–Protein Unbinding Free Energy Profile by Using Molecular Simulations and the Milestoning Theory.
Constructing an unbinding free energy profile needs a coordinate to present the unbinding pathway, which offers continuous molecular motions. Cholko et al.47 reported that both apo CDK8/CycC and CDK8/CycC–ligand complexes perform protein backbone motions in scales of hundreds of nanoseconds, much shorter than reported residence times of the ligands (minutes to hours). For such systems with flexible binding/unbinding channels, a simple distance coordinate between a ligand and protein may miss the free energy contribution from rearranging protein side chains and/or backbone. One may add a couple of dihedral rotations in the coordinate; however, key dihedrals also change during ligand unbinding. Therefore, we used molecular motions presented by the first two PC modes, PC1 and PC2, from our metadynamics trajectories to present the unbinding coordinate. As described in Methods, we explicitly incorporated protein backbone motions into milestones through the Cartesian coordinates of all the α-carbon atoms. Movies S1 and S2 demonstrate the motions of CDK8/CycC-PL2 along PC1 and PC2, respectively. By using a representative conformation at each milestone, we observed overall high correlations between center-of-mass distances and milestones. However, using PC modes outperforms the former in preserving other degrees of freedom important in protein motion.50 For example, milestones 41 and 58 in Figure S2 have nearly the same center-of-mass distances, even though the milestones capture the conformational change of the αC helix (Figure S2A), whose contribution to unbinding kinetics will be discussed in the sections of the structure-kinetics relationship. Figures 3 and S3 illustrate that by using eigenvectors of PC1 and PC2, one reduces the dimensionality for presenting the unbinding pathway. The first two PC modes could represent more than 73% of protein motions (Figure S3). Because not all protein motions could be presented by the first two PC modes, some small energy barriers might inevitably be missed in our dissociation free energy profile. However, because the PC modes captured major motions during ligand dissociation, all the important energy barriers should have been included in the free energy profile.
The study uses a statistical mechanics methodology, the milestoning theory, to utilize short MD trajectories to estimate the transitions between milestones along the unbinding pathways. To calculate the mean first passage time exactly, the first hitting point distribution (FHPD) must be used to reinitialize the trajectories on the milestones.61 In practice, these initial conformations can be obtained by running restrained MD simulations such as umbrella sampling to confine molecular motions within one or a few milestones,31,62 followed by a so-called reverse stage. Alternatively, Vanden-Eijnden et al. proposed a sampling method using Voronoi cells.63 Sampling FHPD in high-dimensional collective variables, however, becomes algorithmically complicated in both schemes. In addition, the preparation becomes unrealistically time-consuming for typical drug–protein systems with more than 100 milestones. In this study, we introduced a straightforward and efficient strategy that allowed for sampling approximate FHPDs on the fly (i.e., reinitialization was not required). This new procedure can be applied to systems in which milestones are defined in PCs or other high-level collective variables without additional algorithmic complexity.
Our new strategy used multiple 100 ps unbiased MD runs starting from saved frames of a dissociation trajectory to sample initial points on milestones, and the starting frames did not need to locate exactly on a milestone (blue dots in Figure 3). A classical MD algorithm could efficiently sample conformations locally with appropriate distribution in statistical mechanics, and once a conformation hit a neighboring milestone for the first time (ignore recrossings), we recorded positions on the initiating and terminating milestones of the transition event. The collection of the former from the entire pool of short MD simulations is termed initial-points distribution (IPD), and the collection of the later is the FHPD of the milestone. Different from commonly used approaches in which an MD run is terminated when the trajectory reaches a nearby milestone, we continued the simulation until the assigned simulation length was achieved. Under these conditions, the IPD and FHPD can be distinguished in two aspects. One is that the FHP on a milestone by definition must previously hit neighboring milestones, which is not required for initial points. For example, the right trajectory shown in the inset of Figure 3 started from a point slight left, near milestone α (blue star), and immediately hit the first initial point on milestone α (red circle). The trajectory then recrossed milestone α once (white circle) before hitting milestone β. The other difference is that all the initial points by construction are followed by one and only one transition to neighboring milestones. In contrast, the sampled FHPs might not always reach the neighboring milestones by the end of the simulation. As shown in Figure S4, the two distributions are reasonably close and become almost identical with an ensemble size larger than about 1000. By using this novel procedure, we efficiently sampled the IPD as an approximation of the FHPD, and the transition lifetimes of the initial points were collected on the fly, together allowing us to apply the milestoning theory to large and flexible ligand–protein systems. Notably, when a trajectory traveled outside the milestone length, which was 20 eigenvalue units in this study, those segments were ignored until the trajectory re-entered any of the colored cells. This exclusion rule avoided sampling trajectories that, for instance, drifted to the gray region in the proximity of milestone i+3 after hitting milestone i and finally hit milestone i+1. In other words, we guaranteed that during any transition, the trajectory did not approach any other milestones besides their neighbors.
Without loss of generality, we probed the effects of the length and the replica number of the short simulations on IPDs and potential of mean force (PMF) profiles. The minimum number of replicas of the 100 ps simulations was determined to be about 15, where PMF profiles of all seven systems studied converged (see Figure S5). Figure 4 shows that running 20 replicas of longer than 80 ps short MD runs resulted in asymptotic IPDs for milestones at local minima (milestones 13 and 57) and energy barriers with steep slopes (milestones 31 and 50). The above sampling procedure led to a relatively large variance of ensemble size of IPDs over milestones (e.g., 2854 and 293 on milestones 13 and 50, respectively; histograms of Figure 4). This situation was caused by the protein–ligand system at milestone 50 rapidly escaping from the initial milestone, as shown in the left trajectory of Figure 3. A better approximation to FHPD (using IPD) could be achieved by sampling metadynamics frames in an adaptive manner (e.g., increasing the number of initial configurations in the region where polar and/or nonpolar interactions break or protein backbones apparently move).
Figure 4.

PMF profile of unbinding CDK8/CycC-PL2 was computed by using 20 replica 100 ps simulations of each initial configuration, and major free energy barriers were labeled. The four histograms show the IPDs on selected milestones, obtained by binning the projections on the milestones whose centers were 4.0 eigenvalue units apart. IPDs sampled from 30, 60, 80, and 100 ps MD runs are overlaid for better visualizing convergence. Numbers in parentheses are the total number of the initial points on the milestones. For each IPD plot, the x-axis and y-axis present the eigenvalue units (0 to 20) and population, respectively.
The other criterion to follow in practical use of the milestoning theory is that the milestones should be constructed so that the probabilities of successive transitions are statistically independent.61 This criterion can be exactly satisfied by using optimal milestones (isocommiter surfaces) obtained with the string method or reasonably approximated by using well-separated milestones that are arbitrarily selected.61,63 We examined the robustness of the new sampling procedure to the spacing between milestones by using the PMF profiles shown in Figure S6. For all the protein–ligand systems studied, we did not observe obvious exaggeration of free energy barriers as the spacing decreased (from 6.0 to 2.0 eigenvalue units), which suggested that the milestoning approximation was held by using these sets of milestones. The relatively poor agreement between PMF profiles calculated at spacing = 6.0 and other smaller values was mainly attributed to insufficient transition sampled between milestones. As one should expect, when the milestones are further apart (fewer milestones), extra computation efforts are required to gain better statistics of transitions, such as by extending short MD runs or initiating MD runs with more initial configurations/replicas. We emphasized that by using the same MD data, the four different sets of milestones were independently constructed following the description in Methods, and the proposed procedure allowed us to sample transitions within these sets of milestones without rerunning multiple 100 ps MD. In the next section, we demonstrate that our method successfully ranks affinities and residence times of ligands in a flexible protein pocket.
Using PMF Profiles and Mean Free Passage Times (MFPTs) of Initial Unbinding Barriers To Predict Thermodynamic and Kinetic Properties of the CDK8/CycC-PL Complexes.
Understanding critical features that lead to a fast or slow ligand can assist the design of new drugs with desired unbinding kinetics. From the metadynamics trajectories, all the five known PLs escaped from the binding pocket through the same channel, with the residues 65 and 146–150 composing the first gate (a gate of the deep pocket), followed by a wider gate formed by residues 209–210 and residues 360–363 on the adjacent CycC protein. Figure S7A shows the conformational fluctuation of residues 360–363 over the 12 metadynamics trajectories. The flexible gate resulted in divergent dissociation pathways after passing the first gate, as illustrated in Figure S7B. This situation suggests that, after the first gate, one needs a statistical ensemble of dissociation paths to investigate the thermodynamic and kinetic properties. For large biomolecule systems, sampling of ligands away from the binding pocket can be accelerated by using Brownian dynamics.31 In contrast, the dissociation path before the first gate was highly conserved, and major molecular arrangements and interactions should appear in all pathways. In this study, we aimed to investigate thermodynamic and kinetic properties of before passing the first gate and provide suggestions for optimization based on the initial unbinding barriers.
Figure 5 illustrates multiple free energy barriers along milestones that present important protein motions and ligand unbinding. For all CDK8/CycC-PL complexes we studied, the first stage of dissociation processes was to break the conserved H-bonds between the ligand and the protein; as a result, the hydrophilic moiety can leave the front pocket (red cylinder in Figure 1, stage 1). At stage 2, the ligand kept moving outward until it passed the gate of the deep pocket (blue cylinder in Figure 1, stage 2). Finally, diverse diffusion routes appeared before the ligand completely escaped from the protein, which were only partly captured in our pathways (gray amoeba in Figure 1, stage 3). Therefore, the free energy difference between the milestones of bound states and the barriers to break the interactions with Arg65, Trp146, Leu148, and Arg150 were used to benchmark binding affinities (i.e., the difference between the minimum and maximum in the free energy profile, excluding the gray region).
Figure 5.

Free energy profiles along milestones during dissociation of CDK8/CycC-PL complexes, where the centers of milestones are 4.0 eigenvalue units apart. The transition times required to travel from the bound state to a barrier are in red. Initial barriers for breaking the conserved H-bonds between PL compounds and Glu66 or Asp173 and escaping from the front pocket are in red (stage 1). All the PL compounds pass the gate of the deep pocket formed by Arg65, Trp146, Leu148, and Arg150, which resulted in energy barriers in blue (stage 2). In stage 3 (gray regions), PL compounds take diverse diffusion pathways, as illustrated in Figure 1.
In Figure 6A, the five known PL ligands and one newly designed PL4-OH were used to measure the correlation between the experimental residence time and the MFPT from the bound state to the end of stage 2 (blue regime in Figure 5). We found that except for PL1, the rank of the computed MFPTs overall agreed with experiment data. A similar trend appeared in the unbinding energies, as shown in Figure 6B. A previous free energy calculation study also showed large errors in PL1;64 as a result, data for PL1 were treated as outliners when computing correlation coefficients. Figure S8 shows that the correlations fluctuated with the spacing between milestones, but the ranks were unchanged. Throughout the article, we report results from milestones whose centers were 4.0 eigenvalue units apart, which had the best correlation with experimental residence times and acceptable correlation with experimental unbinding free energies. The numerical values for both the experimental and calculated results are summarized in Table S1.
Figure 6.

Correlations between calculated (y-axes) and experimental values (x-axes) of (A) residence times and (B) unbinding free energies, with the experimental data for PL1 to PL5 from Schneider et al.45 Measurements of the newly designed PL4-OH are described in Methods. The red lines represent linear fits to the blue dots (data for PL1 are treated as outliners), with squared Pearson’s correlation coefficients annotated.
As expected, the calculated unbinding free energy from the bound states to the end of stage 2 was overall less negative as compared with experiment data. The discrepancy can be rationalized as follows. Although PC1/PC2 modes capture the major coupled motions of a ligand near the crystal structure bound state, not all side chain and backbone dihedral rotations important in ligand binding are included in the first two PC modes. For example, as shown in Figure S2, about 15% to 27% of molecular motions during dissociation are still missed in PC1/PC2. Previous studies with the free energy calculation method VM2 found >50 distinct energy minima by counting different dihedral rotations near the crystal structure bound conformations.64–66 In contrast, here we assigned lesser than 20 milestones near the crystal structure bound states. The oversimplified motions/milestones when a ligand is near the crystal structure is the major contribution to the faster dissociation kinetics and underestimated ΔG. After leaving the crystal structure bound conformation, the milestones can more accurately capture the less complicated coupled motions. One can include more PC modes or milestones in the bound state; however, it is critical to keep computation time realistic as well. In addition, after stage 2, ligands still need additional work to completely unbind from CDK8/CycC after passing the first gate, and the free energy contribution is not included here, thereby resulting in less negative computed binding free energy as compared with experiment data. We showed in Figures S9–S13 that residues 209–210 and 360–363 in various extents stabilized the PLs in stages 2 and 3. Note that from the dissociation pathway we selected for the PL1, it seems that an additional ~2.0 kcal/mol was required to overcome the barriers after stage 2 (see Figure 5). However, because of the diversity of dissociation pathways in stage 3, an accurate evaluation of binding free energy requires sampling multiple dissociation paths, including surface diffusion processes, which is beyond the scope of this study. The next section demonstrates that the free energy barriers within the initial states (stages 1 and 2) still provide useful guidance to optimize the residence time of potential leads. Finally, the milestones were determined from ~30 ns metadynamics runs, much shorter than the length needed for global protein motions (e.g., breathing, twisting, and loop motions) of the CDK8/CycC-PL complexes.47,67 As a result, the proteins could visit multiple states through conformational arrangements during ligand unbinding, but only a part of these motions was captured in the relative short metadynamics trajectories. This artifact would have more pronounced influence on the residence time than state functions such as unbinding free energies.
Identifying Important Dissociation Steps and the Structure–Kinetic Relationship.
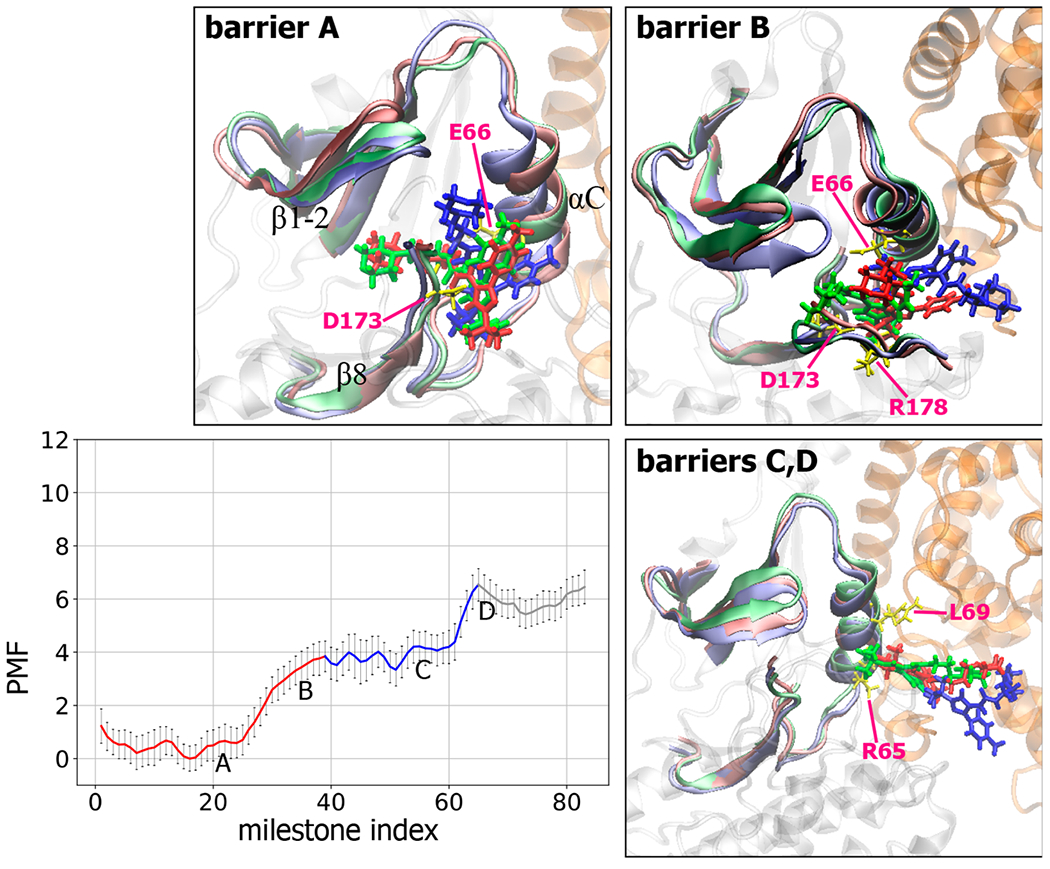
The energy barriers illustrated by our free energy profiles revealed various protein conformational rearrangements, loss of intermolecular attractions, and changes of the H-bond network during ligand unbinding. In stage 1, intermolecular H-bonds between the urea linker with Glu66 and Asp173 must be broken for unbinding this series of PLs (Figure 1); this step yielded about the same free energy cost for every ligand (~4.0 kcal/mol), except for the largest PL2 (~5.0 kcal/mol). PLs jiggle in the bound state, and local molecular fluctuations could temporarily break an H-bond, which costs 1–2 kcal/mol in our free energy plot (the first barriers of PL1, PL2, PL3, and PL4 in Figure 5). However, only permanently breaking H-bonds between the urea linker with Glu66 and Asp173 permits PL compound dissociation, which requires significant molecular rearrangements. For example, in the snapshot of barriers A and B in Figure 7, positions of αC, β1-2, and β8 are adjusted in order to pave a pathway for PL1 to exit.
Figure 7.

Free energy profiles along milestones and important conformational changes associated with each major energy barrier during PL1 dissociation. See the Figure 5 legend for details of the free energy profile. Snapshots for each labeled energy barrier illustrate conformational changes of CDK8/CycC-PL1 when PL1 passes. PL1 is shown in licorice. CDK8 and CycC are in gray and orange, respectively. For each figure, initial, halfway, and final conformations are shown in green, red, and blue, respectively, for both PL1 and the binding pocket, and key residues in the initial conformation are labeled and represented as yellow sticks. PMF unit: kcal/mol.
PL1 has a second set of polar linkers, which formed additional H-bonds with Lys52, Glu66, and Asp173 at the bound state and together contributed to the energy barrier to overcome the barriers A and B in Figure 7. Schneider et al.45 proposed that attractive interactions between the tertiary butyl group of PL1 and Arg356 in the front pocket resulted in the strong affinity and long residence time of PL1. However, we observed very small interactions with Arg356 in all milestones (see Figure S9), which yield a much weaker calculated affinity as compared with PL2. The result agrees with previous computational works in which only interactions in the crystal structure bound conformation were considered.47,68 Although the most important stage in molecular dissociation was stage 1, during which a compound mostly broke crucial intermolecular interactions in the bound state and started to leave the binding pocket, it was not the whole picture of binding kinetics. In fact, we found poor correlation between experiment data and the properties obtained from stage 1. In stage 2, the H-bond donor and acceptor of PL1 displayed multiple formation and breakage of complex H-bond networks with CDK8/CycC with or without the bridge water molecules, as illustrated in Figure S15. The interactions contributed to stable intermediate states (snapshots in Figure 7) and multiple energy barriers to leave these local energy minima. For example, barrier C in Figure 7 was to break a newly formed, water bridged H-bond between the amide next to the tertiary butyl group and Glu66. Before exiting the stage 2, multiple new H-bonds broke and resulted in barrier D in Figure 7.
PL2, the largest of the five ligands, showed similar behavior to PL1: stepwise H-bond formation and breakage, significant molecular rearrangements in stage 1, and multiple subsequent energy barriers in stage 2 (Figure 8). At energy barrier A, the hydrophilic moiety of PL2 began jiggling inside the front pocket, due to the weakening of several interactions between PL2 and the binding pocket, for example, water-bridged H-bonds with Val27 in β1-2, Ala155, and Asn156 in the front pocket and Arg356 in close proximity to the hinge. Together with the upward movement of β1 and β2 sheets, the 3-tert-butyl-1-(4-methylphenyl) group rotated, which allowed the ligand to leave the binding site (Figure 8: barriers A and B). During this step, the piperazine ring located in the center of PL2 passed the cleft formed by β1/β2 sheets, β8, and the activation loop, which required protein arrangement for opening the cleft. At energy barrier C in Figure 8, the β1/β2 sheets kept moving upward until the hydrophilic moiety of the PL2 completely left the cleft, together with breakage of the H-bonds between PL2 and the β1/β2 sheets. In stage 2, an intermediate was observed between the barriers C and D, stabilized by a new H-bond formed between Thr31 of the β1/β2 sheets and the pyrazol ring on the hydrophilic moiety of PL2. As shown in Figure S16, the network of the H-bond network between PL2 and Arg65 survived until passing barrier E in Figure 8. Notably, although unbinding free energy profiles computed from different dissociation pathways were not identical, the key events were the same. For example, the first major peaks in both Figures 7 and S17 denote the free energy cost for permanently breaking the H-bonds between Glu66 and Asp173, and the energy cost of escaping the front pocket (stage 1) from both pathways was ~5.0 kcal/mol. However, PL2 could have slightly different fluctuations before breaking this major interaction, which resulted in minor variation in the free energy plots obtained from different dissociation pathways. Of note, Figures 7 and S17 show an ~1.5 kcal/mol difference in the unbinding free energies (until the end of stage 2) because PL2 in the path of Figure S17 did not completely pass the first gate, and strong interaction with residues 146–150 still existed (see Figure S14). The same major motions mentioned above also appeared in a PSIM run shown in Figure S18.
Figure 8.

Free energy profiles along milestones and important conformational changes associated with each major energy barrier during PL2 dissociation. See the legends in Figures 5 and 7 for details. PMF unit: kcal/mol.
Once exiting from the gate of the deep pocket, the compound started to diffuse over the surface of the CDK/CycC complex, and several intermediates formed before complete dissociation. For example, at barriers E and F in Figure 7, PL1 interacted with CycC and the C-lobe region of CDK8, respectively, and at barrier E in Figure 8, PL2 formed a stable H-bond with the highly fluctuating activation loop of CDK8. Of note, a handful of pathways for the diffusion steps was not sufficient to fully describe ligand surface diffusion (i.e., stage 3).
PL3 and PL5 are the two smallest compounds, with a linear 5-hydroxypentyl and 4-hydroxybutyl group, respectively. Besides the conserved interactions, at the bound state, PL3 was stabilized by the H-bond between the 5-hydroxypentyl group and Asp98 in the hinge of CDK8 (Figure S19, barriers A and B). After passing stage 1, the pyrazol ring of the R-group formed a new H-bond with Glu66, and breaking the interaction involved backbone rearrangement of the αC. Note that the milestones captured this important protein motion that was not explicitly resolved in distance between the centers of mass (Figure S2 and Figure S19, barrier C). Finally, the 5-hydroxypentyl group was able to form a stable H-bond with Arg65, which required additional effort to break (Figure S19, barrier D). In contrast, the 4-hydroxylbutyl group of PL5 could not reach Asp98 at the bound state, but it formed an H-bond with Asp173 that led to the major barrier in stage 2 (Figure S20, barrier B). The minor barrier C in Figure S20 was to break a relatively weak H-bond between the pyrazol group and Arg65. For detailed H-bond networks, see Figure S21 and Figure S22.
As for all other inhibitors in this series, the bound state of PL4 was stabilized by the two H-bonds via the urea linker of type-II ligands with Glu66 on the αC helix and Asp173 on β8. However, the terminal [3-(morpholine-4-yl)propyl] group formed relatively weak intermolecular interactions with the hinge residues, Ala100 and Asp98. At stage 1, the interactions between PL4 and the hinge loosened, and the [3-(morpholine-4-yl)propyl] group escaped from the front pocket after breaking the H-bonds between the urea linker and residues Glu66 and Asp173. PL4 could not leave the pocket unless it pushed the β1/β2 sheets to move upward, thus creating room for further dissociation (Figure 10: barrier A, and Figure 9). This step featured a < 1 kcal/mol energy barrier, which suggested that the rearrangement of the binding site was easy. The barrierless flipping of the morpholine group was mainly attributed to the relatively small hydrophilic moiety of PL4, making a more flexible binding pocket. This finding is consistent with the classical MD simulations of CDK8/CycC-PLs at the bound states in Figure S24, in which the CDK8/CycC-PL4 complex, as compared with other PLs, showed greater breathing motion between the C-lobe and N-lobe of CDK8. The intermediate after barrier A was stabilized by water-bridged H-bonds with Glu66 on the αC helix, Asp173 on β8, and Arg178 on the activation loop (Figure S23). The major energy barrier functioned to permanently break this H-bond network (Figure 10: barrier B). Of note, the activation loop was not directly involved in the ligand binding affinity,47 but the loop could affect binding kinetics. After stage 1, the energy kept increasing before completely breaking the H-bond network between PL4 and both the activation loop and αC helix, which resulted in the last two major energy barriers C and D in Figure 10. Unlike the other PL compounds, PL4 had no good H-bond donors or acceptors besides the R group and thus could not form an H-bond network with Arg65, Trp146, Leu148, or Arg150, which resulted in a relatively short transition time for stage 2.
Figure 10.
Free energy profiles along milestones and important conformational changes associated with each major energy barrier during PL4 dissociation. See the legends in Figures 5 and 7 for details. PMF unit: kcal/mol.
Figure 9.

Conformations of PL2 (red) and PL4 (purple) during dissociation. Top: conformations when PL2 and PL4 are passing barrier B in Figure 8 and barrier B in Figure 10, respectively. Notably, PL2 is significantly larger than PL4, so unbinding PL2 requires more open β1 and β2 sheets and αC helix. Bottom: hinged by the R-group, the ligands rotate the functional groups during dissociation. PL2 moves from a stable bound state (black) to barrier B (orange), passing barrier B (red) and barrier C (green). PL4 moves from a stable bound state (black), to passing barrier A (orange), middle between barriers A/B (purple) and barrier B. PL4 is presented in the middle, and the square indicates an alkane chain that may be modified by a bulky and/or polar group to increase the residence time of PL4.
Modifying PL Ligands To Increase Binding Residence Time.
The energy barriers associated with particular movements and/or interactions during the dissociation inform rational drug design for desired kinetic properties. Large ligands such as PL2 may demand more unfavorable protein motions to unbind the ligand, and our calculations show that nonspecific vdW attractions can increase the cost of ligand unbinding (data not shown). However, a large ligand is not always desirable. Here we suggest introducing a bulky group such as naphthalene, benzopyran, or benzofuran next to the R group of PL4 (Figure 9) to strengthen the nonspecific attraction between the αC helix and activation loop when the ligand is passing the cleft. Another promising drug design is inspired by the results of PL3 and PL5, in which the hydroxyl groups stabilized the bound state by forming additional H-bonds or holding a bridge water molecule with front pocket residues (e.g., Lys52, Asp98, and Ala100). More importantly, we found favorable interactions between the hydroxyl groups and residues 65 and 146–150 while the compounds passed the first gate in Figure S7A, thus increasing the height or number of the free energy barriers in stage 2. Therefore, adding a hydroxy in the alkane chain of PL4 or a carbonyl and/or hydroxyl group in the naphthalene ring next to the R group may further slow the unbinding process.
Following the second strategy, we designed ligand PL4-OH by introducing an additional hydroxyl group to the [3-(morpholine-4-yl)propyl] group of PL4 (Figure 11) and performed proof-of-concept calculations and experiments. The hydroxyl group of PL4-OH formed an H-bond with a front pocket residue, Lys52, at the bound state (Figures 10 and S25). However, this additional interaction had a negligible contribution to the free energy barriers and transition time for stage 1 (Figure 11). After passing barrier A, the complex was stabilized by the newly formed H-bond between the hydroxyl group of PL4-OH and Asp173, which required additional energy to break (Figure 11: barrier B). Upon passing the gate of the deep pocket, the two major barriers (Figure 11: barriers C and D) were attributed to stepwise breakage of the H-bond network between the hydroxyl group PL4-OH and Trp146, Leu148, and Arg150. As compared with other compounds, PL3 and PL5, the hydroxy-induced interactions between PL4-OH and CDK8 had a more pronounced contribution to the increase of unbinding residence time. This enhanced contribution could benefit from the relatively rigid [3-(morpholine-4-yl)propyl] of PL4-OH as compared with the linear hydrophilic moiety of PL3 and PL5. The computed residence time was 3.4 times longer than that for PL4. PL4-OH was synthesized, and the experimental assays validated that the minor modification by adding a hydroxyl group successfully increased the residence time (Figure 6 and Table S1).
Figure 11.

Free energy profiles along milestones and important conformational changes associated with each major energy barrier during PL4-OH dissociation. See the legends in Figures 5 and 7 for details. The PL4-OH compound is shown as sticks, with the additional hydroxyl group colored in red. PMF unit: kcal/mol.
We further investigated this structure–kinetics relationship by performing calculations for the second designed compound, PL1-OH, with the same hydroxyl group added to PL1 (Figure S26). As expected, the hydroxyl group of PL1-OH formed an additional H-bond with Lys52 at the bound state, which broke together with the conserved H-bond with Asp 173 (Figure S26: barrier A). Before leaving the front pocket, the hydroxyl group formed a new H-bond with Asp173 and helped keep the compound inside the pocket. After breaking the conserved H-bond between the urea linker and Glu66 (Figure S26: barrier B), PL1-OH was stabilized by the H-bond network between the hydroxyl group and Leu148, which resulted in barrier C. In between the barriers C and D, an intermediate was stabilized by the H-bond between the pyrazol group and Arg65. Although the additional hydroxyl group participated in the H-bond network at the bound state, the longer residence of both PL4-OH and PL1-OH was mainly due to the increased number or stability of intermediates in stage 2.
By systematically investigating the existing and newly designed type-II inhibitors of CDK8, we demonstrated that using solely bound states was not sufficient to understand ligand binding residence time and guided ligand design with preferred kinetic properties. A free energy profile along the dissociation pathway provided information on transient conformations for a design not seen in experiments.
Remaining Challenges and Future Perspectives in Modeling Binding Kinetics and Free Energy Barrier-Guided Ligand Design.
Because proteins have complicated molecular rearrangements, not all natural motions can be included in the compartments. Therefore, some fluctuations that contributed to unbinding free energy barriers are ignored, which results in faster kinetics. Introducing nonlinear dimensionality reduction algorithms in machine learning such as autoencoders69 may further capture ignored small free-energy barriers that also contribute to the unbinding free energy profile. The transition matrix constructed by multiple, short, unbiased MD trajectories provided the transition probability between nearby milestones; however, the frequency of a ligand moving back and forth between numerous major or tiny energy barriers may not be highly accurately captured.
For tight binders with only one dissociation direction such as the system studied here, our calculations demonstrate that the initial movement during the unbinding process is highly similar from multiple pathways, and these initial steps (stages 1 and 2 in the CDK8/CycC-PL systems) determine the binding residence time and relative binding free energy. However, for protein systems with a wide-open binding site, such as HIV-1 protease, instead of one well-defined binding/unbinding channel, molecular modeling may sample significantly different dissociation pathways; thus, different unbinding directions need to be considered when constructing the unbinding free energy profiles. However, estimating the population of each pathway remains challenging. The milestones obtained from each pathway can differ, which increases the difficulty in combining multiple free energy profiles and selecting critical free energy barrier(s) for drug design. Additional theoretical work will provide more rigorous methods to assemble binding/unbinding free energy profiles from multiple pathways or determine important barriers for drug development.
CONCLUSIONS
In this work, we performed a detailed investigation of pathways, binding kinetics, and thermodynamics for type II ligands unbinding from CDK8/CycC by efficiently adapting the milestoning theory to a principal component space and used the free energy barrier to guide ligand design. We introduced a modified milestoning procedure whereby approximate FHPDs could be sampled on the fly, and short MD simulations could be initiated near the milestones. We also performed experiments to validate our new design, PL4-OH, with increased binding residence time. This was achieved by first sampling dissociation pathways of a series of pyrazolourea ligands with diverse structures of the hydrophilic moiety; mapping high-dimensional protein–ligand dissociation pathways onto the reduced coordinates, using the first two PC modes to define milestones; and applying the milestoning theory to construct an unbinding free energy profile and estimate residence time. Ligand design was then guided by revealed rate-determining events, for example, substantial molecular rearrangements and breaking a conserved H-bond network for escaping the hydrophilic moiety of the front pocket of CDK8 (red line in Figures 2, 6, 7, 9, and 10) as well as multiple formation and breakage of new H-bond networks between a ligand and the first gate of the CDK8 protein (blue line in Figures 2, 6, 7, 9, and 10). The study showed that stage 3 of dissociation is not an essential factor in determining the trend of residence times and ΔG, and focusing on stages 1 and 2 when a ligand is leaving the front and deep pocket can yield good correlation with experiment data.
Our computed free energy barriers suggested that modifying the hydrophilic moieties of PL1 and PL4 would increase residence time. The calculations predicted 2- to 3-fold increased residence time when adding one hydroxyl group to the parent compounds, PL1-OH and PL4-OH, which was validated by experiments. The longer residence time originated from the formation and breakage of H-bonds between the hydroxyl groups and residues at the gate of the deep pocket (Trp146, Leu148, and Arg150), which increased the number of intermediates and free energy barriers of the dissociation pathway. Successfully combining PCA, short MD runs using frames from a given unbinding pathway, and the milestoning theory revealed detailed protein–ligand interactions/motions and unbinding mechanisms during the dissociation process and provided valuable structure–kinetics relationships for designing drugs with preferred binding kinetics.
Supplementary Material
ACKNOWLEDGMENTS
This study was supported by the US National Institutes of Health (GM-109045), the US National Science Foundation (MCB-1350401), and NSF national supercomputer centers (TG-CHE130009). We thank Ron Elber for discussions relating to the milestoning theory, Benjamin Jagger and Christopher Lee for kinetics calculations, and Ming Lee Tang and Tony Dorado for compound synthesis.
ABBREVIATIONS
- SRK
structure-kinetic relation
- PCA
principal component analysis
- H-bond
hydrogen bond
- MD
molecular dynamics
- PL
pyrazolourea ligand
- CDK8
cyclin-dependent kinase 8
- CycC
cyclin C
- PSIM
pathway search guided by the internal motions
Footnotes
Supporting Information
The Supporting Information is available free of charge at https://pubs.acs.org/doi/10.1021/acs.jctc.9b01153.
Details of molecular dynamics simulation setup, error analysis, standard deviation calculations, H-bond analysis, other calculations, and compound synthesis (PDF)
Complete contact information is available at: https://pubs.acs.org/10.1021/acs.jctc.9b01153
The authors declare no competing financial interest.
Contributor Information
Zhiye Tang, Department of Chemistry, University of California Riverside, Riverside, California 92521, United States.
Si-Han Chen, Department of Chemistry, University of California Riverside, Riverside, California 92521, United States.
Chia-en A. Chang, Department of Chemistry, University of California Riverside, Riverside, California 92521, United States.
REFERENCES
- (1).Schuetz DA; de Witte WEA; Wong YC; Knasmueller B; Richter L; Kokh DB; Sadiq SK; Bosma R; Nederpelt I; Heitman LH; Segala E; Amaral M; Guo D; Andres D; Georgi V; Stoddart LA; Hill S; Cooke RM; De Graaf C; Leurs R; Frech M; Wade RC; de Lange ECM; Ijzerman AP; Muller-Fahrnow A; Ecker GF Kinetics for Drug Discovery: an industry-driven effort to target drug residence time. Drug Discovery Today 2017, 22 (6), 896–911. [DOI] [PubMed] [Google Scholar]
- (2).Copeland RA The drug-target residence time model: a 10-year retrospective. Nat. Rev. Drug Discovery 2016, 15 (2), 87–95. [DOI] [PubMed] [Google Scholar]
- (3).Ferruz N; De Fabritiis G Binding Kinetics in Drug Discovery. Mol. Inf 2016, 35 (6–7), 216–226. [DOI] [PubMed] [Google Scholar]
- (4).Tonge PJ Drug-Target Kinetics in Drug Discovery. ACS Chem. Neurosci 2018, 9 (1), 29–39. [DOI] [PMC free article] [PubMed] [Google Scholar]
- (5).Bernetti M; Masetti M; Rocchia W; Cavalli A Kinetics of Drug Binding and Residence Time. Annu. Rev. Phys. Chem 2019, 70, 143–171. [DOI] [PubMed] [Google Scholar]
- (6).Bruce NJ; Ganotra GK; Kokh DB; Sadiq SK; Wade RC New approaches for computing ligand–receptor binding kinetics. Curr. Opin. Struct. Biol 2018, 49, 1–10. [DOI] [PubMed] [Google Scholar]
- (7).You WL; Chang CEA Role of Molecular Interactions and Protein Rearrangement in the Dissociation Kinetics of p38 alpha MAP Kinase Type-I/II/III Inhibitors. J. Chem. Inf. Model 2018,58 (5), 968–981. [DOI] [PMC free article] [PubMed] [Google Scholar]
- (8).Tiwary P; Mondal J; Berne BJ How and when does an anticancer drug leave its binding site? Sci. Adv 2017, 3 (5), e1700014. [DOI] [PMC free article] [PubMed] [Google Scholar]
- (9).Weiss RG; Setny P; Dzubiella J Principles for Tuning Hydrophobic Ligand-Receptor Binding Kinetics. J. Chem. Theory Comput 2017, 13 (6), 3012–3019. [DOI] [PubMed] [Google Scholar]
- (10).Huang YMM; Raymundo MAV; Chen W; Chang CEA Mechanism of the Association Pathways for a Pair of Fast and Slow Binding Ligands of HIV-1 Protease. Biochemistry 2017, 56 (9), 1311–1323. [DOI] [PMC free article] [PubMed] [Google Scholar]
- (11).Wang Y; Martins JM; Lindorff-Larsen K Biomolecular conformational changes and ligand binding: from kinetics to thermodynamics. Chemical Science 2017, 8 (9), 6466–6473. [DOI] [PMC free article] [PubMed] [Google Scholar]
- (12).Yan Z; Wang J Quantifying the Kinetic Residence Time as a Potential Complement to Affinity for the Aptamer Selection. J. Phys. Chem. B 2018, 122, 8380–8385. [DOI] [PubMed] [Google Scholar]
- (13).Pan AC; Xu HF; Palpant T; Shaw DE Quantitative Characterization of the Binding and Unbinding of Millimolar Drug Fragments with Molecular Dynamics Simulations. J. Chem. Theory Comput 2017, 13 (7), 3372–3377. [DOI] [PubMed] [Google Scholar]
- (14).Tang ZY; Roberts CC; Chang CEA Understanding ligand-receptor non-covalent binding kinetics using molecular modeling. Front. Biosci., Landmark Ed 2017, 22, 960–981. [DOI] [PMC free article] [PubMed] [Google Scholar]
- (15).Ganesan A; Coote ML; Barakat K Molecular ’time-machines’ to unravel key biological events for drug design. Wiley Interdiscip. Rev.: Comput. Mol. Sci 2017, 7 (4), e1306. [Google Scholar]
- (16).Teo I; Mayne CG; Schulten K; Lelievre T Adaptive Multilevel Splitting Method for Molecular Dynamics Calculation of Benzamidine-Trypsin Dissociation Time. J. Chem. Theory Comput 2016, 12 (6), 2983–2989. [DOI] [PMC free article] [PubMed] [Google Scholar]
- (17).Tiwary P; Limongelli V; Salvalaglio M; Parrinello M Kinetics of protein-ligand unbinding: Predicting pathways, rates, and rate-limiting steps. Proc. Natl. Acad. Sci. U. S. A 2015,112 (5), E386–E391. [DOI] [PMC free article] [PubMed] [Google Scholar]
- (18).Mollica L; Decherchi S; Zia SR; Gaspari R; Cavalli A; Rocchia W Kinetics of protein-ligand unbinding via smoothed potential molecular dynamics simulations. Sci. Rep 2015, 5, 11539. [DOI] [PMC free article] [PubMed] [Google Scholar]
- (19).Rydzewski J; Jakubowski R; Nowak W; Grubmuller H Kinetics of Huperzine A Dissociation from Acetylcholinesterase via Multiple Unbinding Pathways. J. Chem. Theory Comput 2018, 14 (6), 2843–2851. [DOI] [PubMed] [Google Scholar]
- (20).Tran DP; Takemura K; Kuwata K; Kitao A Protein-Ligand Dissociation Simulated by Parallel Cascade Selection Molecular Dynamics. J. Chem. Theory Comput 2018, 14 (1), 404–417. [DOI] [PubMed] [Google Scholar]
- (21).Casasnovas R; Limongelli V; Tiwary P; Carloni P; Parrinello M Unbinding Kinetics of a p38 MAP Kinase Type II Inhibitor from Metadynamics Simulations. J. Am. Chem. Soc 2017, 139 (13), 4780–4788. [DOI] [PubMed] [Google Scholar]
- (22).Miao YL; Huang YMM; Walker RC; McCammon JA; Chang CEA Ligand Binding Pathways and Conformational Transitions of the HIV Protease. Biochemistry 2018, 57 (9), 1533–1541. [DOI] [PMC free article] [PubMed] [Google Scholar]
- (23).Hamelberg D; Mongan J; McCammon JA Accelerated molecular dynamics: A promising and efficient simulation method for biomolecules. J. Chem. Phys 2004, 120 (24), 11919–11929. [DOI] [PubMed] [Google Scholar]
- (24).Kokh DB; Amaral M; Bomke J; Gradler U; Musil D; Buchstaller HP; Dreyer MK; Frech M; Lowinski M; Vallee F; Bianciotto M; Rak A; Wade RC Estimation of Drug-Target Residence Times by tau-Random Acceleration Molecular Dynamics Simulations. J. Chem. Theory Comput 2018, 14 (7), 3859–3869. [DOI] [PubMed] [Google Scholar]
- (25).Wong CF Steered molecular dynamics simulations for uncovering the molecular mechanisms of drug dissociation and for drug screening: A test on the focal adhesion kinase. J. Comput. Chem 2018, 39 (19), 1307–1318. [DOI] [PubMed] [Google Scholar]
- (26).Schuetz DA; Bernetti M; Bertazzo M; Musil D; Eggenweiler HM; Recanatini M; Masetti M; Ecker GF; Cavalli A Predicting Residence Time and Drug Unbinding Pathway through Scaled Molecular Dynamics. J. Chem. Inf. Model 2019, 59 (1), 535–549. [DOI] [PubMed] [Google Scholar]
- (27).Zuckerman DM; Chong LT Weighted Ensemble Simulation: Review of Methodology, Applications, and Software. Annu. Rev. Biophys 2017, 46, 43–57. [DOI] [PMC free article] [PubMed] [Google Scholar]
- (28).Kastner J Umbrella sampling. Wiley Interdisciplinary Reviews-Computational Molecular Science 2011, 1 (6), 932–942. [Google Scholar]
- (29).Awasthi S; Kapil V; Nair NN Sampling Free Energy Surfaces as Slices by Combining Umbrella Sampling and Metadynamics. J. Comput. Chem 2016, 37 (16), 1413–1424. [DOI] [PubMed] [Google Scholar]
- (30).Bello-Rivas JM; Elber R Exact milestoning. J. Chem. Phys 2015, 142 (9), 094102. [DOI] [PMC free article] [PubMed] [Google Scholar]
- (31).Votapka LW; Jagger BR; Heyneman AL; Amaro RE SEEKR: Simulation Enabled Estimation of Kinetic Rates, A Computational Tool to Estimate Molecular Kinetics and Its Application to Trypsin-Benzamidine Binding. J. Phys. Chem. B 2017, 121 (15), 3597–3606. [DOI] [PMC free article] [PubMed] [Google Scholar]
- (32).Elber R A new paradigm for atomically detailed simulations of kinetics in biophysical systems. Q. Rev. Biophys 2017, 50, e8. [DOI] [PubMed] [Google Scholar]
- (33).Grazioli G; Andricioaei I Advances in milestoning. I. Enhanced sampling via wind-assisted reweighted milestoning (WARM). J. Chem. Phys 2018, 149 (8), 084103. [DOI] [PMC free article] [PubMed] [Google Scholar]
- (34).Bucci A; Yu TQ; Vanden-Eijnden E; Abrams CF Kinetics of O-2 Entry and Exit in Monomeric Sarcosine Oxidase via Markovian Milestoning Molecular Dynamics. J. Chem. Theory Comput 2016, 12 (6), 2964–2972. [DOI] [PMC free article] [PubMed] [Google Scholar]
- (35).Maragliano L; Vanden-Eijnden E; Roux B Free Energy and Kinetics of Conformational Transitions from Voronoi Tessellated Milestoning with Restraining Potentials. J. Chem. Theory Comput 2009, 5 (10), 2589–2594. [DOI] [PMC free article] [PubMed] [Google Scholar]
- (36).Husic BE; Pande VS Markov State Models: From an Art to a Science. J. Am. Chem. Soc 2018, 140 (7), 2386–2396. [DOI] [PubMed] [Google Scholar]
- (37).Chodera JD; Noe F Markov state models of biomolecular conformational dynamics. Curr. Opin. Struct. Biol 2014, 25, 135–144. [DOI] [PMC free article] [PubMed] [Google Scholar]
- (38).Philip S; Kumarasiri M; Teo T; Yu M; Wang S Cyclin-Dependent Kinase 8: A New Hope in Targeted Cancer Therapy? J. Med. Chem 2018, 61, 5073–5092. [DOI] [PubMed] [Google Scholar]
- (39).Nemet J; Jelicic B; Rubelj I; Sopta M The two faces of CDK8, a positive/negative regulator of transcription. Biochimie 2014, 97, 22–27. [DOI] [PubMed] [Google Scholar]
- (40).Knuesel MT; Meyer KD; Bernecky C; Taatjes DJ The human CDK8 subcomplex is a molecular switch that controls Mediator coactivator function. Genes Dev. 2009, 23 (4), 439–451. [DOI] [PMC free article] [PubMed] [Google Scholar]
- (41).Xu W; Ji JY Dysregulation of CDK8 and Cyclin C in tumorigenesis. J. Genet. Genomics 2011, 38 (10), 439–452. [DOI] [PMC free article] [PubMed] [Google Scholar]
- (42).Schneider EV; Bottcher J; Blaesse M; Neumann L; Huber R; Maskos K The Structure of CDK8/CycC Implicates Specificity in the CDK/Cyclin Family and Reveals Interaction with a Deep Pocket Binder. J. Mol. Biol 2011, 412 (2), 251–266. [DOI] [PubMed] [Google Scholar]
- (43).Wang TJ; Yang Z; Zhang YG; Yan W; Wang F; He LH; Zhou YY; Chen LJ Discovery of novel CDK8 inhibitors using multiple crystal structures in docking-based virtual screening. Eur. J. Med. Chem 2017, 129, 275–286. [DOI] [PubMed] [Google Scholar]
- (44).Mallinger A; Schiemann K; Rink C; Stieber F; Calderini M; Crumpler S; Stubbs M; Adeniji-Popoola O; Poeschke O; Busch M; Czodrowski P; Musil D; Schwarz D; Ortiz-Ruiz M-J; Schneider R; Thai C; Valenti M; Brandon A. d. H.; Burke R; Workman P; Dale T; Wienke D; Clarke PA; Esdar C; Raynaud FI; Eccles SA; Rohdich F; Blagg J Discovery of Potent, Selective, and Orally Bioavailable Small-Molecule Modulators of the Mediator Complex-Associated Kinases CDK8 and CDK19. J. Med. Chem 2016, 59 (3), 1078–1101. [DOI] [PMC free article] [PubMed] [Google Scholar]
- (45).Schneider EV; Boettcher J; Huber R; Maskos K; Neumann L Structure-kinetic relationship study of CDK8/CycC specific compounds. Proc. Natl. Acad. Sci U. S. A 2013, 110 (20), 8081–8086. [DOI] [PMC free article] [PubMed] [Google Scholar]
- (46).Xu W; Amire-Brahimi B; Xie X-J; Huang L; Ji J-Y All-atomic molecular dynamic studies of human CDK8: Insight into the A-loop, point mutations and binding with its partner CycC. Comput. Biol. Chem 2014, 51, 1–11. [DOI] [PMC free article] [PubMed] [Google Scholar]
- (47).Cholko T; Chen W; Tang ZY; Chang CEA A molecular dynamics investigation of CDK8/CycC and ligand binding: conformational flexibility and implication in drug discovery. J. Comput.-Aided Mol. Des 2018, 32 (6), 671–685. [DOI] [PMC free article] [PubMed] [Google Scholar]
- (48).Callegari D; Lodola A; Pala D; Rivara S; Mor M; Rizzi A; Capelli AM Metadynamics Simulations Distinguish Short- and Long-Residence-Time Inhibitors of Cyclin-Dependent Kinase 8. J. Chem. Inf. Model 2017, 57 (2), 159–169. [DOI] [PubMed] [Google Scholar]
- (49).Tang ZY; Chang CEA Systematic Dissociation Pathway Searches Guided by Principal Component Modes. J. Chem. Theory Comput 2017, 13 (5), 2230–2244. [DOI] [PMC free article] [PubMed] [Google Scholar]
- (50).David CC; Jacobs DJ Principal Component Analysis: A Method for Determining the Essential Dynamics of Proteins. Methods Mol. Biol 2014, 1084, 193–226. [DOI] [PMC free article] [PubMed] [Google Scholar]
- (51).Gilson MK; Gilson HSR; Potter MJ Fast Assignment of Accurate Partial Atomic Charges: An Electronegativity Equalization Method that Accounts for Alternate Resonance Forms. J. Chem. Inf. Comput. Sci 2003, 43 (6), 1982–1997. [DOI] [PubMed] [Google Scholar]
- (52).Biasini M; Bienert S; Waterhouse A; Arnold K; Studer G; Schmidt T; Kiefer F; Cassarino TG; Bertoni M; Bordoli L; Schwede T SWISS-MODEL: modelling protein tertiary and quaternary structure using evolutionary information. Nucleic Acids Res. 2014, 42 (W1), W252–W258. [DOI] [PMC free article] [PubMed] [Google Scholar]
- (53).Gill AL; Frederickson M; Cleasby A; Woodhead SJ; Carr MG; Woodhead AJ; Walker MT; Congreve MS; Devine LA; Tisi D; O’Reilly M; Seavers LCA; Davis DJ; Curry J; Anthony R; Padova A; Murray CW; Carr RAE; Jhoti H Identification of novel p38 alpha MAP kinase inhibitors using fragment-based lead generation. J. Med. Chem 2005, 48 (2), 414–426. [DOI] [PubMed] [Google Scholar]
- (54).Georgescu RE; Alexov EG; Gunner MR Combining conformational flexibility and continuum electrostatics for calculating pK(a)s in proteins. Biophys. J 2002, 83 (4), 1731–1748. [DOI] [PMC free article] [PubMed] [Google Scholar]
- (55).Wang JM; Wolf RM; Caldwell JW; Kollman PA; Case DA Development and testing of a general amber force field. J. Comput. Chem 2004, 25 (9), 1157–1174. [DOI] [PubMed] [Google Scholar]
- (56).Phillips JC; Braun R; Wang W; Gumbart J; Tajkhorshid E; Villa E; Chipot C; Skeel RD; Kale L; Schulten K Scalable molecular dynamics with NAMD. J. Comput. Chem 2005, 26 (16), 1781–1802. [DOI] [PMC free article] [PubMed] [Google Scholar]
- (57).Faradjian AK; Elber R Computing time scales from reaction coordinates by milestoning. J. Chem. Phys 2004, 120 (23), 10880–10889. [DOI] [PubMed] [Google Scholar]
- (58).Roe DR; Cheatham TE PTRAJ and CPPTRAJ: Software for Processing and Analysis of Molecular Dynamics Trajectory Data. J. Chem. Theory Comput 2013, 9 (7), 3084–3095. [DOI] [PubMed] [Google Scholar]
- (59).Van Der Spoel D; Lindahl E; Hess B; Groenhof G; Mark AE; Berendsen HJC GROMACS: Fast, flexible, and free. J. Comput. Chem 2005, 26 (16), 1701–1718. [DOI] [PubMed] [Google Scholar]
- (60).http://www.proteros.com/ (accessed Feb 12, 2020).
- (61).Vanden-Eijnden E; Venturoli M; Ciccotti G; Elber R On the assumptions underlying milestoning. J. Chem. Phys 2008, 129 (17), 174102. [DOI] [PMC free article] [PubMed] [Google Scholar]
- (62).Jagger BR; Lee CT; Amaro RE Quantitative Ranking of Ligand Binding Kinetics with a Multiscale Milestoning Simulation Approach. J. Phys. Chem. Lett 2018, 9 (17), 4941–4948. [DOI] [PMC free article] [PubMed] [Google Scholar]
- (63).Vanden-Eijnden E; Venturoli M Markovian milestoning with Voronoi tessellations. J. Chem. Phys 2009, 130 (19), 194101. [DOI] [PubMed] [Google Scholar]
- (64).Chen W; Ren XD; Chang CEA Discovery of CDK8/CycC Ligands with a New Virtual Screening Tool. ChemMedChem 2018, 14 (1), 107–118. [DOI] [PMC free article] [PubMed] [Google Scholar]
- (65).Huang Y.-m. M.; Chen W; Potter MJ; Chang C.-e. A. Insights from Free-Energy Calculations: Protein Conformational Equilibrium, Driving Forces, and Ligand-Binding Modes. Biophys. J 2012, 103 (2), 342–351. [DOI] [PMC free article] [PubMed] [Google Scholar]
- (66).Chen W; Gilson MK; Webb SP; Potter MJ Modeling Protein-Ligand Binding by Mining Minima. J. Chem. Theory Comput 2010, 6 (11), 3540–3557. [DOI] [PMC free article] [PubMed] [Google Scholar]
- (67).Balsera MA; Wriggers W; Oono Y; Schulten K Principal component analysis and long time protein dynamics. J. Phys. Chem 1996, 100 (7), 2567–2572. [Google Scholar]
- (68).Chen W; Ren X; Chia-en AC Discovery of CDK8/CycC Ligands with a New Virtual Screening Tool. ChemMedChem 2018, 14 (1), 107. [DOI] [PMC free article] [PubMed] [Google Scholar]
- (69).Kramer MA Nonlinear principal component analysis using autoassociative neural networks. AIChE J. 1991, 37 (2), 233–243. [Google Scholar]
Associated Data
This section collects any data citations, data availability statements, or supplementary materials included in this article.