Abstract
Purpose:
This study aimed to evaluate the effect of chemical exchange saturation transfer (CEST) on the ischemic regions in hypoxic-ischemic encephalopathy (HIE) in comparison with diffusion-weighted imaging (DWI) and magnetic resonance spectroscopy (MRS) using a 7T-MRI.
Methods:
We used neonatal rats (n = 8), aged 8 days, to clarify the progression of HIE. The rat model of HIE was developed by ligating and severing the left common carotid artery, followed by 45 minutes of recovery, and 60 minutes of hypoxia (8% O2/92% N2; 34°C). At 0–2 and 24 hours after the onset of HIE, CEST imaging, DWI, and MRS were performed with a 7T-MRI. The magnetization transfer ratio (MTR) asymmetry curves and four MTR asymmetry maps at 0.5, 1.0, 2.0, and 3.5 ppm were calculated using the CEST images. Fractional anisotropy (FA) and apparent diffusion coefficient (ADC) maps were calculated by DWI, and brain metabolites were assessed by MRS.
Results:
In the ischemic regions of neonatal rats, FA was significantly increased at 0–2 hours and decreased at 24 hours after the onset of HIE. ADC in the ipsilateral side was significantly lower than that of contralateral side. All rats with HIE showed hypointense areas on MTR asymmetry maps (2.0 and 3.5 ppm), that did not correspond with the hyperintense areas on DWI. In addition, a significant increase in lactate levels was observed at 0–2 and 24 hours after the onset of HIE.
Conclusion:
CEST MTR maps did not correspond with the hyperintense areas on DWI at 0–2 and 24 hours after the onset of HIE. The change of multi offset CEST signal may be primarily related to the brain metabolites and pH alterations, such as that caused by lactate, after the onset of HIE.
Keywords: chemical exchange saturation transfer, hypoxic-ischemic encephalopathy, magnetic resonance spectroscopy
Introduction
Hypoxic-ischemic encephalopathy (HIE) is caused by perinatal asphyxia1 and can result in serious impairments, including mental retardation, epilepsy, and cerebral palsy.2 In the early phase of HIE, hypoxia-ischemia decreases the cerebral blood flow (CBF), which subsequently reduces the supply of oxygen and glucose to the brain.3 This obstructs adenosine triphosphate production and initiates lactate accumulation.3 Excitotoxicity, inflammation, and oxidative stress after reperfusion are related to neuronal cell death.4 To assess the state of HIE, animal models including rats,5 mice,6,7 and piglets,8 have been studied.
Magnetic resonance spectroscopy (MRS) is suitable to understand the metabolic aspects of HIE. Decreased N-acetylaspartate (NAA) and increased lactate, which respectively represent neuronal integrity and anaerobic metabolism, are detected in neonatal rat brain using MRS.9 Yan et al.10 reported that spectroscopy showed diminished NAA and elevated lactate 1 h after permanent middle cerebral artery occlusion, whereas T2-weighted imaging (T2WI) did not change until 6 h after hypoxia-ischemia. Thus, an altered metabolic profile is useful to understand the initial pathophysiology of HIE.
Chemical exchange saturation transfer (CEST) is a new imaging technology introduced in 2000.11 To evaluate animal models, compounds containing exchangeable endogenous protons, such as glutamate,12 creatine,13–16 lactate,17,18 and other metabolites,15 have been imaged by CEST. Zheng and Wang8 applied amide proton transfer (APT) imaging to neonatal piglets. APT values decreased sharply 2 h after the onset of hypoxia-ischemia and they correlated negatively with the lactate content.8 However, they did not evaluate HIE with other conventional methods, such as diffusion-weighted imaging (DWI) and MRS.
This study aimed to evaluate the effect of CEST on ischemic regions in a rat model of HIE and compared it with other imaging techniques, such as DWI and MRS using 7 Tesla-magnetic resonance imaging (7T-MRI).
Materials and Methods
Animal preparation
All animal experiments were approved by the Institutional Animal Care and Use Committee of our institution. We used 8-day-old neonatal rats to examine the progression of HIE (n = 8; four males and four females; JAPAN SLC, Osaka, Japan). General anesthesia was induced by isoflurane (4.0% for induction, 2.0% for maintenance). Under a stereo microscope (OLYMPUS SZX16, Tokyo, Japan), the left common carotid artery was ligated with a 7/0 silk suture and subsequently severed, followed by 45 min of recovery, and 60 min of hypoxia (8% O2/92% N2; 34°C).
Magnetic Resonance Imaging
MRI was performed using a 7T-MRI (BioSpec 70/30 USR, Bruker Biospin, Ettlingen, Germany) with a 4-channel phased-array mice brain coil. All brain MR experiments on rats were performed under general anesthesia, induced with isoflurane (3.0% for induction and 2.0% for maintenance). The rats were positioned in a specially designed stereotaxic frame with mouth and ear bars to prevent any movements during acquisition. The body temperature of the rats was maintained at 36.5°C with regulated water flow and continuously monitored using a physiological monitoring system (SA Instruments, Inc., Stony Brook, USA).
DWI was performed using spin-echo, multi-shot, echo-planar imaging (TR/TE = 3000/33 ms; slice thickness, 1 mm; field of view (FOV), 19.2 × 19.2 mm2; matrix, 128 × 128; number of shots, 4; fat suppression, on; slice orientation, transaxial; number of averages, 1; in-plane resolution, 150 × 150 μm2; and number of slices, 10). Apparent diffusion coefficient (ADC) maps were generated from DWI acquired at five b-values (b = 0, 250, 500, 750, 1000 s/mm2, δ = 3 ms, Δ = 23 ms) and three directions. Anatomical T2WI acquired with rapid acquisition with relaxation enhancement (RARE) sequence (TR/TE = 4000/33 ms; rare factor, 8; FOV, 19.2 × 19.2 mm2; matrix, 256 × 256; in-plane resolution, 75 × 75 μm2; slices thickness, 1 mm; slice number, 10; and number of averages, 4) in the transaxial orientation were used for accurate delineation of structures which were in the same slice position on diffusion-weighted images.
The CEST imaging pulse sequence consisted of a magnetization transfer RARE sequence, which was modified to saturate a range of frequency offsets. The sequence parameters were as follows: FOV, 19.2 × 19.2 mm2; slice thickness, 1 mm; TR/TE = 4000/43 ms; matrix size, 128 × 128; number of averages, 1; in-plane resolution, 150 × 150 μm2; slice thickness, 1 mm; and number of slice, 1. The Z-spectra were collected using 1300-ms saturation pulse at a B1 amplitude of 3.0 μT with frequencies varying from −5.0 to +5.0 ppm (step, 0.5 ppm, 20 images) with one S0 image. A point-by-point B0 correction was performed from −1.0 to +1.0 ppm (step, 0.1 ppm, 20 images) with a B0 map called water saturation shift referencing.19 A total of 41 images, including that of B0 mapping, were acquired in approximately 40 min. The magnetization transfer ratio (MTR) curve (or Z-spectrum) was obtained from the CEST image series. Four MTR asymmetry maps were reconstructed at 0.5, 1.0, 2.0, and 3.5 ppm using the 41 CEST images using MATLAB (Mathworks (R2017b), MA, USA).
For MRS, images of same resolution were used to accurately position a voxel of 2 × 2 × 2 mm3 in both cortices. Magnetic field homogeneity was performed using fast, automatic shimming by mapping along projections sequence, and good shimming was achieved in the voxels (between 6.8 and 10.8 Hz). MRS was performed using a point-resolved spectroscopy sequence (TR/TE = 2500/20; combined with variable power and optimized relaxation delays water suppression). Metabolite concentrations were quantified using the basic setting of the LCModel.20 Metabolite concentrations, including those of lactate (Lac), glycerophosphocholine + phosphocholine (GPC + PCh), N-acetylaspartate + N-acetylaspartylglutamate (NAA + NAAG), creatine + phosphocreatine (Cr + PCr), and glutamate + glutamine (Glu + Gln), were quantified.
Statistical analyses
The regions of interest were drawn manually on the cortex of each hemisphere on DWI. The estimated parameter values are expressed as mean ± standard deviation. Differences between groups were analyzed by Bonferroni multiple comparisons test using Prism 8 (Version 8, GraphPad Software, CA, USA). A P-value of <0.05 was considered statistically significant.
Results
DWI, FA, ADC, and T2W images at 0–2 and 24 h after HIE
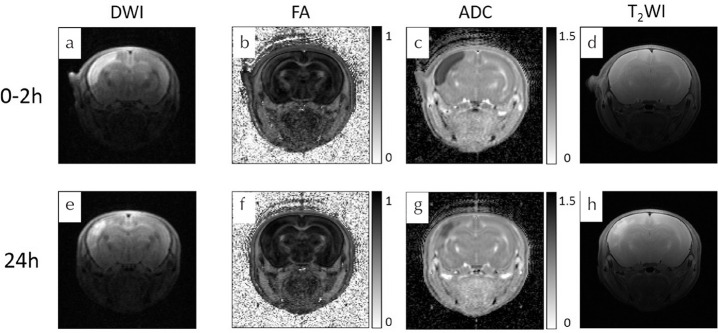
DWI, FA, ADC maps, and T2W images were acquired at 0–2 (Fig. 1a–1d) and 24 h (Fig. 1e–1h) after the onset of HIE. In this study, all the rats with HIE showed areas of hyper intensity on brain DWI and T2WI, which were lesions typically located at the cortex.
Fig. 1.
Serial magnetic resonance images of a rat model of HIE on DWI, FA maps, ADC maps, and T2-weighted imaging. (c and g) Scale × 10−3 mm2/s. HIE, hypoxic-ischemic encephalopathy; DWI, diffusion-weighted imaging; FA, fractional anisotropy; ADC, apparent diffusion coefficient.
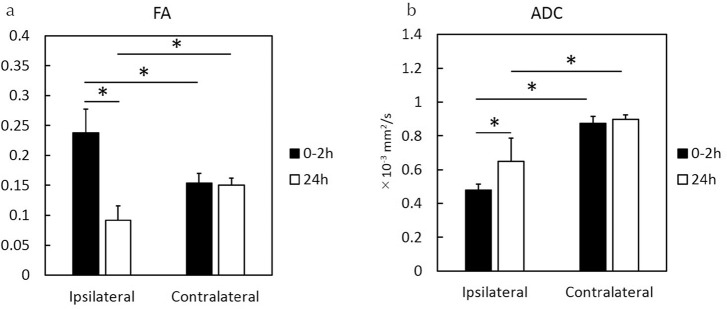
At 0–2 h after the onset of HIE, the mean fractional anisotropy (FA) values for the ipsilateral HIE cortex (0.24 ± 0.04) were higher than those for the contralateral cortex regions (0.15 ± 0.02; P < 0.0001; Fig. 2a). Moreover, the mean FA values for the ipsilateral HIE cortex regions (0.09 ± 0.02; Fig. 2a) at 24 h after the onset of HIE were lower than those for the contralateral regions (0.15 ± 0.01; P = 0.0001; Fig. 2a). In comparison with the ipsilateral FA values at 0–2 and 24 h after onset of HIE, the mean FA values at 0–2 h were higher than those at 24 h (P < 0.0001; Fig. 2a).
Fig. 2.
FA and ADC values at 0–2 and 24 h after the onset of HIE. FA, fractional anisotropy; ADC, apparent diffusion coefficient; HIE, hypoxic-ischemic encephalopathy; *P < 0.0001.
At 0–2 h after the onset of HIE, the mean ADC values for the ipsilateral HIE cortex regions (0.48 ± 0.04 × 10⁻³ mm2/s; Fig. 2b) were lower than those of the contralateral cortex regions (0.87 ± 0.04 × 10⁻³ mm2/s; P < 0.0001; Fig. 2b). Similarly, the mean ADC values for the ipsilateral regions at 24 h after HIE (0.65 ± 0.14 × 10⁻³ mm2/s; Fig. 2b) were lower than those of the contralateral regions (0.90 ± 0.02 × 10⁻³ mm2/s; P < 0.0001; Fig. 2b). Compared with the mean ADC values at 0–2 and 24 h, the mean ADC values of the ipsilateral hemispheres at 0–2 h were lower than those at 24 h (P = 0.0003; Fig. 2b).
MTR asymmetry maps and MTR curve at 0–2 and 24 h after the onset of HIE
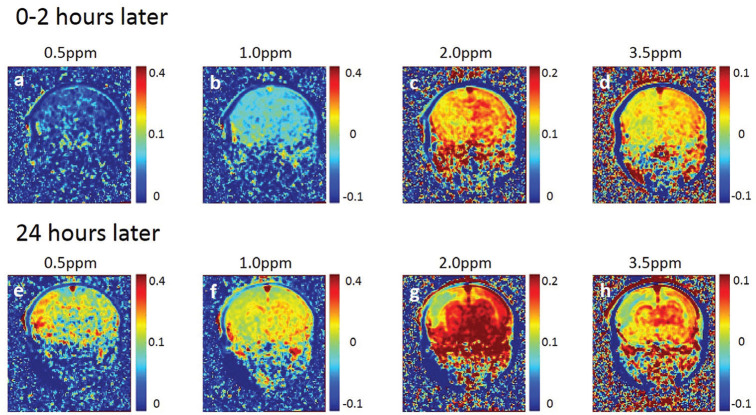
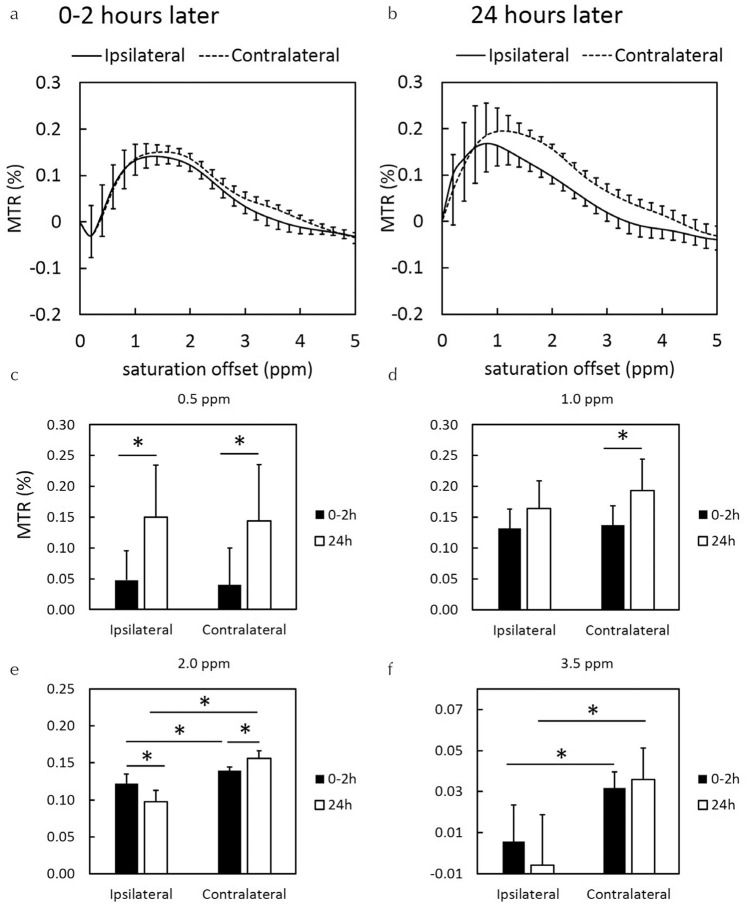
The 0.5 and 1.0 ppm MTR asymmetry maps at 0–2 h after the onset of HIE were lower than those at 24 h after the onset of HIE. After 0–2 h, the 2.0 and 3.5 ppm MTR asymmetry maps of the ipsilateral hemisphere decreased as compared with those of the contralateral brain hemisphere (Fig. 3c and 3d). The animals showed noticeable hypo intensity regions on 2.0 and 3.5 ppm MTR asymmetry maps after 24 h (Fig. 3g and 3h), which did not correspond with the hyperintense area on DWI (Fig. 1e). MTR asymmetry curves of the ipsilateral HIE brain regions were lower than those of the contralateral brain regions. This tendency was especially remarkable at 24 h after the onset of HIE (Fig. 4b). The MTR values were gradually increased at the ipsilateral and contralateral brain regions (Fig. 4a and 4b).
Fig. 3.
Serial MTR maps of rats at 0–2 and 24 h after the onset of HIE. MTR asymmetry maps at 0.5, 1.0, 2.0, and 3.5 parts per million. Same slice position as Fig. 1. MTR, magnetization transfer ratio; HIE, hypoxic-ischemic encephalopathy.
Fig. 4.
MTR curves at (a) 0–2 and (b) 24 h after the onset of HIE. MTR values of (c) 0.5, (d) 1.0, (e) 2.0, and (f) 3.5 ppm at 0–2 and 24 h after the onset of HIE. MTR, magnetization transfer ratio; HIE, hypoxic-ischemic encephalopathy; *P < 0.05.
At the ipsilateral HIE brain regions, the quantitative values of MTR asymmetry for 0–2 h were lower than those for 24 h at 0.5 ppm (Fig. 4c; P = 0.0036). Contrarily, the quantitative values of MTR asymmetry for 0–2 h were higher as compared with those for 24 h at 2.0 ppm (Fig. 4e; P = 0.0023). At the contralateral brain regions, the quantitative values of MTR asymmetry for 0–2 h were lower as compared with those for 24 h at 0.5 (Fig. 4c; P = 0.0033), 1.0 (Fig. 4d; P = 0.0015), and 2.0 ppm (Fig. 4e; P = 0.037). In comparison to the values of MTR asymmetry on both sides, those at ipsilateral regions were lower than those at contralateral regions at 2.0 (Fig. 4e) and 3.5 ppm (Fig. 4f).
1H-MRS at 0–2 and 24 h after the onset of HIE
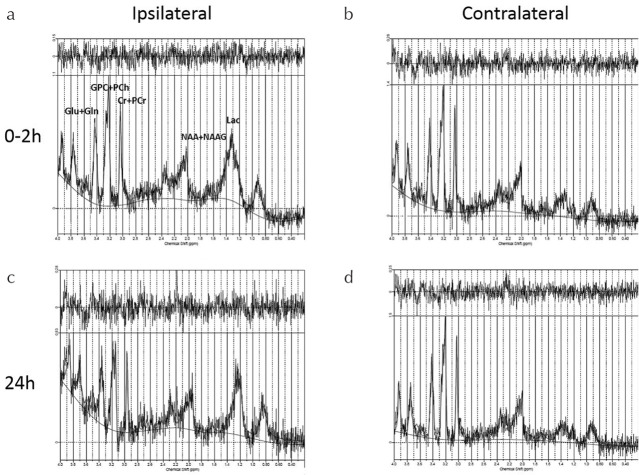
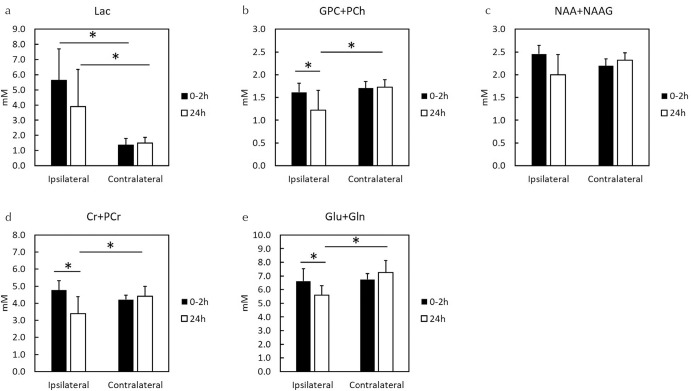
In the early phase (0–2 h), HIE caused major changes in Lac levels in the ipsilateral hemisphere as compared with contralateral hemisphere (Fig. 5a and 5b). Similarly, 24 h after the onset of HIE, high Lac levels were observed in the ipsilateral brain region as compared with the contralateral hemisphere (Fig. 5c and 5d). Quantitative comparison of metabolites after the onset of HIE at the ipsilateral brain hemisphere (Fig. 6a–6e) identified three metabolites except Lac and NAA + NAAG, i.e., GPC + PCh (Fig. 6b), Cr + PCr (Fig. 6d), and Glu + Gln (Fig. 6e), whose concentrations decreased. The concentrations of Lac at the ipsilateral brain were higher than those at the contralateral brain (Fig. 6a), whereas those of NAA + NAAG showed no significant change (Fig. 6c).
Fig. 5.
Conventional MRS at 0–2 and 24 h after the onset of hypoxic-ischemic encephalopathy. (a) Ipsilateral MRS spectrum at 0–2 h, (b) Contralateral MRS spectrum at 0–2 h, (c) Ipsilateral MRS spectrum at 24 h, and (d) Contralateral MRS spectrum at 24 h. MRS, magnetic resonance spectroscopy.
Fig. 6.
Concentrations of five metabolites by MRS at 0–2 and 24 h after the onset of HIE. MRS, magnetic resonance spectroscopy; HIE, hypoxic-ischemic encephalopathy; GPC, glycerophosphocholine; PCh, phosphocholine; NAA, N-acetylaspartate; NAAG, N-acetylaspartylglutamate; Cr, creatine; PCr, phosphocreatine; Glu, glutamate; Gln, glutamine; *P < 0.05.
Discussion
This is the first report to assess the effect of CEST on a rat model of HIE and to compare it with DWI and MRS. Herein, we clarify that CEST MTR maps did not correspond with the hyperintense areas on DWI at 0–2 and 24 h after the onset of HIE; the change of multi offset CEST signal may be related primarily to the concentrations of brain metabolites and pH changes caused by varying Lac levels after the onset of HIE. In this study, we propose that the progression of HIE may occur simultaneously with manifestations of cytotoxic edema and metabolomic variations.
In comparison to diffusion tensor imaging and CEST imaging, the brain regions with low ADC and low FA values in the ipsilateral side did not correspond with the areas with low MTR asymmetry values at 0–2 h after the inset of HIE. The hypointense areas of the CEST maps in the hemisphere with HIE were larger than the hyperintense areas on DWI in the cortex. At 24 h after the onset of HIE, the hypo intensity of CEST was confined only to the cortex; however, it was larger in area than the areas with hyper intensity on DWI. This disagreement shows that the effect of CEST is different from the mechanism generating the signals on DWI. DWI detects water movement inside and outside the cell, but CEST can detect metabolites, including APT,15 Cr,16 and Lac.17 Therefore, CEST can observe the changes in in vivo metabolites caused by hypoxia-ischemia that cannot be detected with DWI.
In a study of HIE, a rat model with permanent occlusion of the left common carotid artery is used to induce a brain injury.21 The animals showed increased Lac levels at 0–2 and 24 h after the onset of HIE, which is an important sign indicative of brain hypoxia-ischemia in our study. This finding is congruent with the results of a previous report.22 Moreover, MTR asymmetry curves at 2.0 and 3.5 ppm in the ipsilateral HIE brain regions were lower as compared with the contralateral normal brain regions. This tendency was especially remarkable at 24 h. Previous studies reported a marked change in pH of ischemic lesions before and after ischemia, but no obvious variation in amide content was found during a short period.23,24 However, Zheng and Wang8 reported that APT values initially tended to decrease sharply after hypoxic-ischemic injury. They assumed that the protein content and temperature in the brain remain unchanged for a short period after the insult; however, the change in APT signal may be related primarily to the changes in pH. Such signal alternation is indicative of intracellular changes in pH in brain tissues within a short time after hypoxic-ischemic insult and primarily caused by acidosis secondary to aerobic dysmetabolism. Intracellular acidosis is not only caused by lactate accumulation but can also be attributed to aerobic dysmetabolism of glucose that occurs in the acute stage of HIE. The intracellular pH of brain tissue can impact cell survival and brain tissue outcomes. Studies have shown that following hypoxic-ischemic injury of brain tissue, pH decreases transiently, with subsequent increase, which induces rebound alkalosis. The change of multi offset CEST signal may be primarily related to pH changes cause by dysregulated lactate concentrations after the onset of HIE.
It is important to assess reperfusion model for applying to actual disease and recovery conditions for treatment, and observe long time duration. In our model, the left common carotid artery of neonatal rat was ligated permanently. It was impossible to assess the reperfusion, then we need to use other ischemic model for assessment of reperfusion in the future study. In addition, we did not measure the CBF, though the severity of HIE has an important effect on brain perfusion in the first days of life, as demonstrated in animal data.25 Moreover, a drop in cerebral perfusion and hypoxia can cause a critical shortage of energy. Therefore, a better understanding of the degree to which the severity of the HIE influences brain perfusion and of the relation between brain perfusion would be useful.
Conclusion
We clarify that CEST MTR maps did not correspond with the areas of hyper intensity on DWI, 0–2 and 24 h after the onset of HIE. This change in multi offset CEST signal may be related primarily to the varied concentrations of brain metabolites and pH changes mediated by lactate after the onset of HIE.
Acknowledgments
This work was supported by the Japan Society for the Promotion of Science (JSPS) KAKENHI [grant number 19K08172] and the Agency for Medical Research and Development (AMED) [grant number JP19dm0307026]. This study was supported for calculation of CEST by Rikita Araki Ph.D (BioSpin Division, Bruker Japan K.K.).
Footnotes
Conflicts of Interest
The authors declare no financial or commercial conflicts of interest.
References
- 1.van Handel M, Swaab H, de Vries LS, Jongmans MJ. Long-term cognitive and behavioral consequences of neonatal encephalopathy following perinatal asphyxia: a review. Eur J Pediatr 2007; 166:645–654. [DOI] [PMC free article] [PubMed] [Google Scholar]
- 2.Lai MC, Yang SN. Perinatal hypoxic-ischemic encephalopathy. J Biomed Biotechnol 2011; 2011:609813. [DOI] [PMC free article] [PubMed] [Google Scholar]
- 3.Douglas-Escobar M, Weiss MD. Hypoxic-ischemic encephalopathy: a review for the clinician. JAMA Pediatr 2015; 169:397–403. [DOI] [PubMed] [Google Scholar]
- 4.Ferriero DM. Neonatal brain injury. N Engl J Med 2004; 351:1985–1995. [DOI] [PubMed] [Google Scholar]
- 5.Kumral A, Ozer E, Yilmaz O, et al. Neuroprotective effect of erythropoietin on hypoxic-ischemic brain injury in neonatal rats. Biol Neonate 2003; 83:224–228. [DOI] [PubMed] [Google Scholar]
- 6.Ten VS, Bradley-Moore M, Gingrich JA, Stark RI, Pinsky DJ. Brain injury and neurofunctional deficit in neonatal mice with hypoxic-ischemic encephalopathy. Behav Brain Res 2003; 145:209–219. [DOI] [PubMed] [Google Scholar]
- 7.Doman SE, Girish A, Nemeth CL, et al. Early detection of hypothermic neuroprotection using T2-weighted magnetic resonance imaging in a mouse model of hypoxic ischemic encephalopathy. Front Neurol 2018; 9:304. [DOI] [PMC free article] [PubMed] [Google Scholar]
- 8.Zheng Y, Wang XM. Measurement of lactate content and amide proton transfer values in the basal ganglia of a neonatal piglet hypoxic-ischemic brain injury model using MRI. AJNR Am J Neuroradiol 2017; 38:827–834. [DOI] [PMC free article] [PubMed] [Google Scholar]
- 9.Malisza KL, Kozlowski P, Ning G, Bascaramurty S, Tuor UI. Metabolite changes in neonatal rat brain during and after cerebral hypoxia-ischemia: a magnetic resonance spectroscopic imaging study. NMR Biomed 1999; 12:31–38. [DOI] [PubMed] [Google Scholar]
- 10.Yan G, Dai Z, Xuan Y, Wu R. Early metabolic changes following ischemia onset in rats: an in vivo diffusion-weighted imaging and 1H-magnetic resonance spectroscopy study at 7.0T. Mol Med Rep 2015; 11:4109–4114. [DOI] [PMC free article] [PubMed] [Google Scholar]
- 11.Ward KM, Aletras AH, Balaban RS. A new class of contrast agents for MRI based on proton chemical exchange dependent saturation transfer (CEST). J Magn Reson 2000; 143:79–87. [DOI] [PubMed] [Google Scholar]
- 12.Cai K, Haris M, Singh A, et al. Magnetic resonance imaging of glutamate. Nat Med 2012; 18:302–306. [DOI] [PMC free article] [PubMed] [Google Scholar]
- 13.Saito S, Mori Y, Tanki N, Yoshioka Y, Murase K. Factors affecting the chemical exchange saturation transfer of creatine as assessed by 11.7T MRI. Radiol Phys Technol 2015; 8:146–152. [DOI] [PubMed] [Google Scholar]
- 14.Cai K, Singh A, Poptani H, et al. CEST signal at 2ppm (CEST@2ppm) from Z-spectral fitting correlates with creatine distribution in brain tumor. NMR Biomed 2015; 28:1–8. [DOI] [PMC free article] [PubMed] [Google Scholar]
- 15.Tanoue M, Saito S, Takahashi Y, et al. Amide proton transfer imaging of glioblastoma, neuroblastoma, and breast cancer cells on a 11.7T magnetic resonance imaging system. Magn Reson Imaging 2019; 62:181–190. [DOI] [PubMed] [Google Scholar]
- 16.Takahashi Y, Saito S, Kioka H, et al. Mouse skeletal muscle creatine chemical exchange saturation transfer (CrCEST) imaging at 11.7T MRI. J Magn Reson Imaging 2019. Jun 22. doi: 10.1002/jmri.26844. [Epub ahead for print] [DOI] [PubMed]
- 17.DeBrosse C, Nanga RP, Bagga P, et al. Lactate chemical exchange saturation transfer (LATEST) imaging in vivo a biomarker for LDH activity. Sci Rep 2016; 6:19517. [DOI] [PMC free article] [PubMed] [Google Scholar]
- 18.Saito S, Takahashi Y, Ohki A, Shintani Y, Higuchi T. Early detection of elevated lactate levels in a mitochondrial disease model using chemical exchange saturation transfer (CEST) and magnetic resonance spectroscopy (MRS) at 7T-MRI. Radiol Phys Technol 2019; 12:46–54. [DOI] [PubMed] [Google Scholar]
- 19.Kim M, Gillen J, Landman BA, Zhou J, van Zijl PC. Water saturation shift referencing (WASSR) for chemical exchange saturation transfer (CEST) experiments. Magn Reson Med 2009; 61:1441–1450. [DOI] [PMC free article] [PubMed] [Google Scholar]
- 20.Provencher SW. Estimation of metabolite concentrations from localized in vivo proton NMR spectra. Magn Reson Med 1993; 30:672–679. [DOI] [PubMed] [Google Scholar]
- 21.Rice JE, Vannucci RC, Brierley JB. The influence of immaturity on hypoxic-ischemic brain damage in the rat. Ann Neurol 1981; 9:131–141. [DOI] [PubMed] [Google Scholar]
- 22.Mabe H, Blomqvist P, Siesjö BK. Intracellular pH in the brain following transient ischemia. J Cereb Blood Flow Metab 1983; 3:109–114. [DOI] [PubMed] [Google Scholar]
- 23.Zhou J, Payen JF, Wilson DA, Traystman RJ, van Zijl PC. Using the amide proton signals of intracellular proteins and peptides to detect pH effects in MRI. Nat Med 2003; 9:1085–1090. [DOI] [PubMed] [Google Scholar]
- 24.Sun PZ, Zhou J, Sun W, Huang J, van Zijl PC. Detection of the ischemic penumbra using pH-weighted MRI. J Cereb Blood Flow Metab 2007; 27:1129–1136. [DOI] [PubMed] [Google Scholar]
- 25.Lee SJ, Hatran DP, Tomimatsu T, Peña JP, McAuley G, Longo LD. Fetal cerebral blood flow, electrocorticographic activity, and oxygenation: responses to acute hypoxia. J Physiol (Lond) 2009; 587:2033–2047. [DOI] [PMC free article] [PubMed] [Google Scholar]


