

Abstract
Prostate cancer (PCa) is the most prevalent cancer among males and the survival period of PCa has been significantly extended. However, the probability of suffering from second primary malignancies (SPMs) has also increased. Therefore, we downloaded SPM samples from the SEER database and then retrospectively analyzed the general characteristics of 34,891 PCa patients diagnosed between 2000 and 2016. After excluding cases with unknown clinical information, 2203 patients were used to construct and validate the overall survival (OS) nomogram of SPM patients after PCa. We found that approximately 3.69% of PCa patients were subsequently diagnosed with SPMs. In addition, the three most prevalent sites of SPM were respiratory and intrathoracic organs, skin, and hematopoietic system. The top three histological types of SPMs were squamous cell carcinoma, adenoma and adenocarcinoma, nevi and melanoma. Through univariate and multivariate Cox regression analysis, we found that the site of SPM, age, TNM stage, SPM surgery history, and PCa stage were associated with the OS of SPM. By virtue of these factors, we constructed a nomogram to predict the OS of SPM. The C-index in the training set and validation set were 0.824 (95CI, 0.806–0.842) and 0.862 (95CI, 0.840–0.884), respectively. Furthermore, we plotted the receiver operating characteristic curve (ROC) and the area under curve (AUC) which showed that our model performed well in assessing the 3-year (0.861 and 0.887) and 5-year (0.837 and 0.842) OS of SPMs in the training and validation set. In summary, we investigated the general characteristics of SPMs and constructed a nomogram to predict the prognosis of SPM following PCa.
Subject terms: Risk factors, Urology, Cancer, Urological cancer, Prostate cancer
Introduction
Prostate cancer (PCa) is the most prevalent cancer among men, and it is estimated that 3.6 million men in the United States have a history of PCa in 20191. In addition, in 2020, approximately 191,930 new PCa cases have been registered and 33,330 people have died of PCa in the United States in 20202. Owing to prostate‐specific antigen (PSA) screening, digital rectal examination (DRE), and transrectal ultrasound (TRUS) followed by ultrasound-guided biopsy, PCa can be diagnosed at its early stage. Treatment options for PCa, such as, prostatectomy, androgen deprivation therapy (ADT), chemotherapy, and radiotherapy (RT) have also greatly improved the survival rate of PCa3–5. Due to early diagnosis and treatment, the 5‐year relative survival rate of PCa has increased to 98%. Moreover, the death rate of PCa has dropped by 52% from its peak2.
Despite the extended survival period of cancer, some people may suffer from the second primary malignancies (SPMs)6,7. Previous research demonstrated that about 11.3% of PCa patients were diagnosed with SPMs8. According to two large-scale studies in Sweden and Germany, the most frequently detected SPMs originated from PCa patients, accounting for 22.5% and 16.9% of all SPMs, respectively9. However, mechanisms of triggering conversion to SPMs are unclear, resulting in diagnostic uncertainty and delays in the diagnosis and treatment of SPMs. The underlying causes of SPMs may include environmental and lifestyle-related factors (e.g., smoking)10, genetic factors11 and treatment-related exposures (e.g., radiotherapy (RT))12,13. Although the mechanism of SPMs is vague, the survival period of patients will be shortened once they are diagnosed with SPMs, and a former study has proved that adolescents and young adults with SPMs have worse survival than those with only primary cancer14.
Nomogram created by regression analysis has been widely employed to predict the prognosis of diverse cancers15 because of its simplicity, intuitiveness, and practicality. It has been used for bladder cancer16, cervical cancer17, primary gliosarcoma18, and many other diseases. The efficiency of nomogram has been proved and has even become a new standard.
We have realized that it is of great significance for treatment providers and PCa survivors to understand the incidence and prognosis of SPMs after PCa. Therefore, in this study, we aimed to investigate the general characteristics of SPMs and construct a nomogram to predict the 3-year and 5-year survival of SPMs following PCa.
Materials and methods
Data source and study design
We extracted SPM cases from 18 population-based registries (2000–2016) in the Surveillance, Epidemiology, and End Results (SEER) database using SEER* Stat version 8.3.6. Clinicopathological data of interest were extracted, including age, race, TNM stage, site of SPM, histological type of SPM and PCa, surgery history of SPM and PCa, marital status, follow-up time, and latency time between PCa and SPM. To make our results more accurate, we adopted the Warren criterion to identify SPM. SPMs were identified as cancers histologically different from the initial primary cancer (IPC), with a latency period of not less than 6 months to exclude errors caused by metastasis and recurrence19.
First, we downloaded a total of 68,954 PCa cases from the SEER database. The inclusion criteria were as follows: 1. diagnosed age greater than 18 years; 2. A record of malignant behavior; 3. patients with complete survival data and follow-up information. The exclusion criteria were as below: 1. latency period between IPC and SPM shorter than 6 months; 2. patients with only autopsy or death certificate records. Then, after excluding 33,702 patients with the same histology as PCa, there remained 34,891 patients diagnosed with SPM. Patients with unknown information were also excluded, including no TNM stage: n = 24,452, unknown history of surgery: n = 184, unknown marital status: n = 121, unknown lymph node removed (LNR): n = 10, and no stage of PCa: n = 7921. Ultimately, we identified 2203 qualified cases, which were then divided into the training set (n = 1543) and the validation set (n = 660). The training set was used to identify prognostic factors and built a nomogram based on these factors. The training set and validation set were used for internal and external validation, respectively.
The study cohort comprised patients with the following International Classification of Diseases for Oncology, Third Edition (ICD-O-3), morphology codes: 8000/3, 8010/3, 8140/3, 8255/3, 8480/3, 8481/3 and 8490/3, and the site codes: C61.9. The detailed flow chart for patient screening was presented in Fig. 1.
Figure 1.

Study flowchart showing the process of constructing nomogram to predict the overall survival (OS) of second primary malignancies (SPMs) after prostate cancer (PCa).
Statistical analysis
To explore the association between clinicopathological variables and OS of SPM, we performed univariate and multivariate Cox proportional hazards regression analysis in the training set to identify the significant factors. Using these screened factors, we calculated the risk score of each patient according to the following formula: risk score = β1 × 1 + β2 × 2 + ⋯ + βnXn (β, regression coefficient; X, prognostic factor)18. According to the median score of the risk score, patients were divided into the high-risk group and low-risk group. Next, we chose factors with p value < 0.001 to develop a nomogram to predict the 3- and 5-year survival rates of SPM patients. To evaluate the prognostic ability of our model, we calculated the concordance index (C-index). Meanwhile, the receiver operating characteristic curve (ROC) was plotted and the area under the curve (AUC) was assessed. The calibration curves were drawn to estimate whether the actual result was consistent with the predicted probability. Each cohort was divided into three groups according to sample size. Bootstrapping with 1,000 resamples was used to evaluate discrimination and calibration. Kaplan–Meier curves were plotted and Log-rank analysis was applied to compare the OS on account of different prognostic factors.
All statistical analyses were performed in SPSS 24.0 (SPSS Inc., Chicago, IL, USA) or the R software (version 3.6.1; http://www.r-project.org/) using the following packages: ‘rms’, ‘survival’, and ‘survivalROC’. All tests were two-sided and p < 0.05 was considered statistically significant.
Ethical statement
The authors are accountable for all aspects of the work in ensuring that questions related to the accuracy or integrity of any part of the work are appropriately investigated and resolved. Institutional review board approval was waived for this study because SEER database is a public anonymized database. The author Y Liu has gotten the access to the SEER database (accession number: 16704-Nov2018). The authors are accountable for all aspects of the work.
Results
Characteristics of SPM
We downloaded 68,954 PCa patients diagnosed during 2000–2016 from the SEER database. In order to exclude the bias caused by PCa recurrence and metastasis, we ruled out cases with the same histological type as PCa. Cases with a latency period of less than 6 months between PCa and SPMs were also excluded. Finally, a total of 34,891 patients diagnosed with SPMs were identified. Using the SEER database, we found that 945,196 men were diagnosed during 2000–2016 and approximately 3.69% of PCa patients were subsequently diagnosed with SPMs in this period. We concluded that the median interval between diagnosis of PCa and SPM was 57.0 months and the median diagnosed age of SPM was 74.0 years. We listed the sites and histological types of SPM that exceeded 1% in Fig. 2A,B. The three most prevalent sites of SPM were respiratory and intrathoracic organs, skin, and hematopoietic system (Table 1). In addition, bronchial and lung cancers accounted for the majority of cancers in respiratory and intrathoracic organs (Table S1). As shown in Table 2, the top three histological types of SPMs were squamous cell carcinoma, adenoma and adenocarcinoma, nevi and melanoma.
Figure 2.
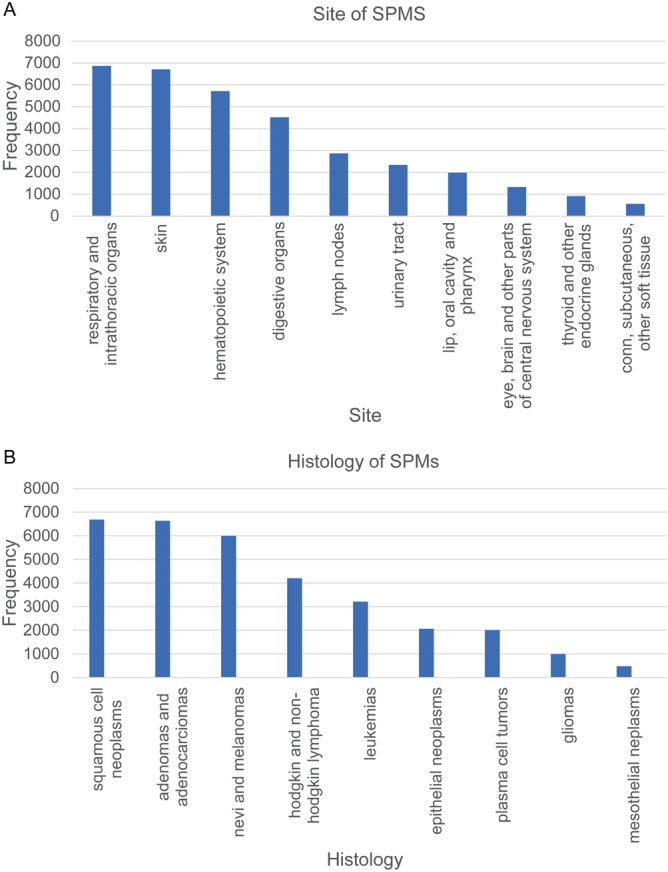
Features of second primary malignancies (SPMs) after prostate cancer (PCa). (A) Sites of SPMs that over than 1%, (B) Histology types of SPMs that more than 1%.
Table 1.
Site of SPMs after PCa.
| Site of SPMs | N | N% (%) |
|---|---|---|
| All | 34,891 | 100 |
| Respiratory and intrathoracic organs | 6866 | 19.68 |
| Skin | 6711 | 19.23 |
| Hematopoietic system | 5717 | 16.39 |
| Digestive organs | 4523 | 12.96 |
| Lymph nodes | 2872 | 8.23 |
| Urinary tract | 2343 | 6.72 |
| Lip, oral cavity and pharynx | 1985 | 5.69 |
| Eye, brain and other parts of central nervous system | 1331 | 3.81 |
| Thyroid and other endocrine glands | 917 | 2.63 |
| Conn, subcutaneous, other soft tissue | 563 | 1.61 |
| Unknown primary site | 348 | 1.00 |
| Male genital organs | 283 | 0.81 |
| Bone, joints and articular cartilage | 210 | 0.60 |
| Retroperitoneum and peritoneum | 125 | 0.36 |
| Other and ill-defined sites | 55 | 0.16 |
| Breast | 33 | 0.09 |
| Peripheral nerves and autonomic nervous system | 9 | 0.03 |
Abbreviations: SPMs: second primary malignancies; PCa: prostate cancer.
Table 2.
Histology types of SPMs after PCa.
| Histology type of SPMs | N | N% (%) |
|---|---|---|
| All | 34,891 | 100 |
| Squamous cell neoplasms | 6686 | 19.16 |
| Adenomas and adenocarcinomas | 6634 | 19.01 |
| Nevi and melanomas | 5996 | 17.18 |
| Hodgkin and non-Hodgkin lymphoma | 4203 | 12.05 |
| Leukemias | 3214 | 9.21 |
| Epithelial neoplasms | 2064 | 5.92 |
| Plasma cell tumors | 2011 | 5.76 |
| Gliomas | 994 | 2.85 |
| Mesothelial neoplasms | 479 | 1.37 |
| Myelodysplastic syndromes | 278 | 0.80 |
| Fibromatous neoplasms | 259 | 0.74 |
| Complex epithelial neoplasms | 234 | 0.67 |
| Complex mixed and stromal neoplasms | 227 | 0.65 |
| Lipomatous neoplasms | 214 | 0.61 |
| Soft tissue tumors and sarcomas | 174 | 0.50 |
| Transitional cell papillomas and carcinomas | 145 | 0.42 |
| Immunoproliferative diseases | 136 | 0.39 |
| Blood vessel tumors | 132 | 0.38 |
| Adnexal and skin appendage neoplasms | 130 | 0.37 |
| Ductal, lobular and medullary neoplasms | 102 | 0.29 |
| Chronic myeloproliferative disorders | 96 | 0.28 |
| Osseous and chondromatous neoplasms | 95 | 0.27 |
| Mucoepidermoid neoplasms | 71 | 0.20 |
| Thymic epithelial neoplasms | 46 | 0.13 |
| Germ cell neoplasms | 46 | 0.13 |
| Cystic, mucinous and serous neoplasms | 29 | 0.08 |
| Neoplasms | 25 | 0.07 |
| Meningiomas | 25 | 0.07 |
| Myomatous neoplasms | 23 | 0.07 |
| Nerve sheath tumors | 20 | 0.06 |
| Miscellaneous tumors | 17 | 0.05 |
| Other hematologic disorders | 14 | 0.04 |
| Paragangliomas and glomus tumors | 12 | 0.03 |
| Neuroepitheliomatous neoplasms | 11 | 0.03 |
| Myxomatous neoplasms | 10 | 0.03 |
| Neoplasms of histiocytes and accessory lymphoid cells | 8 | 0.02 |
| Synovial-like neoplasms | 6 | 0.02 |
| Odontogenic tumors | 6 | 0.02 |
| Basal cell neoplasms | 5 | 0.01 |
| Miscellaneous bone tumors | 4 | 0.01 |
| Mast cell tumors | 4 | 0.01 |
| Choriocarcinoma | 2 | 0.01 |
| Lymphatic vessel tumors | 2 | 0.01 |
| Giant cell tumors | 2 | 0.01 |
Abbreviations: SPMs: second primary malignancies; PCa: prostate cancer.
Baseline characteristics of patients
A total of 34,891 cases diagnosed with SPMs were identified from the original data downloaded from the SEER database. After excluding patients with unknown clinical information, 2203 cases were ultimately enrolled for further analysis. These cases were randomly divided into the training set (n = 1543) and the validation set (n = 660). There were no significant differences (p > 0.05) in the site of SPM, SPM histology, age, race, T stage, M stage, LNR, PCa surgery, PCa stage, and marital status (Table 3). The training set was used to construct nomogram and validate the model internally, while the validation set was used for external validation. In the entire cohort, we found that approximately 32.73% (n = 721) of SPM patients died after a median follow-up of 56 months.
Table 3.
Characteristics of SPMs patients after PCa.
| Characteristics | Training set (n = 1543) |
Validation set (n = 660) |
X2 | p | ||
|---|---|---|---|---|---|---|
| N | % | N | % | |||
| Site of SPMs | 4.91 | 0.423 | ||||
| Skin | 439 | 28.5 | 188 | 28.5 | ||
| Bronchus and lung | 298 | 19.3 | 111 | 16.8 | ||
| Renal | 145 | 9.4 | 71 | 10.8 | ||
| Liver | 85 | 5.5 | 48 | 7.3 | ||
| Thyroid gland | 87 | 5.6 | 38 | 5.8 | ||
| Others | 489 | 31.7 | 204 | 30.9 | ||
| Histology of SPMs | 7.47 | 0.188 | ||||
| Squamous cell cancer | 426 | 27.6 | 159 | 24.1 | ||
| Melanomas | 413 | 26.8 | 173 | 26.2 | ||
| Papillary adenocarcinoma | 118 | 7.6 | 62 | 9.4 | ||
| Hepatocellular carcinoma | 75 | 4.9 | 44 | 6.7 | ||
| Renal cell carcinoma | 79 | 5.1 | 29 | 4.4 | ||
| Others | 432 | 28.0 | 193 | 29.2 | ||
| Age | 3.40 | 0.334 | ||||
| <= 60 | 205 | 13.3 | 98 | 14.8 | ||
| 61–70 | 589 | 38.2 | 268 | 40.6 | ||
| 71–80 | 588 | 38.1 | 226 | 34.2 | ||
| > 80 | 161 | 10.4 | 68 | 10.3 | ||
| Race | 0.71 | 0.703 | ||||
| White | 1261 | 81.7 | 532 | 80.6 | ||
| Black | 220 | 14.3 | 103 | 15.6 | ||
| Others | 62 | 4.0 | 25 | 3.8 | ||
| Stage_T | 1.22 | 0.875 | ||||
| Ta | 71 | 4.6 | 27 | 4.1 | ||
| T1 | 673 | 43.6 | 301 | 45.6 | ||
| T2 | 344 | 22.3 | 149 | 22.6 | ||
| T3 | 279 | 18.1 | 111 | 16.8 | ||
| T4 | 176 | 11.4 | 72 | 10.9 | ||
| Stage_N | 9.37 | 0.035 | ||||
| N0 | 1131 | 73.3 | 511 | 77.4 | ||
| N1 | 164 | 10.6 | 67 | 10.2 | ||
| N2 | 203 | 13.2 | 58 | 8.8 | ||
| N3 | 45 | 2.9 | 24 | 3.6 | ||
| Stage_M | 1.52 | 0.218 | ||||
| M0 | 1359 | 88.1 | 594 | 90.0 | ||
| M1 | 184 | 11.9 | 66 | 10.0 | ||
| LNR | 0.41 | 0.521 | ||||
| No | 1214 | 78.7 | 528 | 80.0 | ||
| Yes | 329 | 21.3 | 132 | 20.0 | ||
| SPM surgical history | 0.79 | 0.374 | ||||
| Yes | 521 | 33.8 | 210 | 31.8 | ||
| No | 1022 | 66.2 | 450 | 68.2 | ||
| Histology of PCa | 1.27 | 0.260 | ||||
| Other | 13 | 0.8 | 9 | 1.4 | ||
| Ade | 1530 | 99.2 | 651 | 98.6 | ||
| PCa surgical history | 0.07 | 0.792 | ||||
| Yes | 977 | 63.3 | 414 | 62.7 | ||
| No | 566 | 36.7 | 246 | 37.3 | ||
| PCa stage | 2.73 | 0.440 | ||||
| I | 431 | 27.9 | 194 | 29.4 | ||
| II | 905 | 58.7 | 373 | 56.5 | ||
| III | 139 | 9.0 | 55 | 8.3 | ||
| IV | 68 | 4.4 | 38 | 5.8 | ||
| Marital status | ||||||
| Married | 1030 | 66.8 | 426 | 64.5 | 0.13 | 0.936 |
| Previously married | 360 | 23.3 | 166 | 25.2 | ||
| Never married | 153 | 9.9 | 68 | 10.3 | ||
Abbreviations: SPMs: second primary malignancies; PCa: prostate cancer, LNR: lymph node removed.
Prognostic factors for the overall survival of SPM
Intending to reveal the associated factors with the OS of SPM, we applied univariate and multivariate Cox regression analysis. The results were listed in Table 4. Univariate Cox regression analysis demonstrated that age (p < 0.001), race (p < 0.001), TNM stage (p < 0.001), LNR (p < 0.001), histology of SPM (p < 0.001), site of SPM (p < 0.001), marital status (p < 0.001), SPM surgical history (p < 0.001), PCa surgical history (p < 0.001), and PCa stage (p < 0.001) were associated with the OS of SPM. Next, using the factors identified by univariate Cox regression analysis, multivariate Cox regression analysis revealed that age (p < 0.001), TNM stage (p < 0.001), histology of SPM (p = 0.002), site of SPM (p < 0.001), marital status (p = 0.038), PCa surgical history (p < 0.001), and PCa stage (p < 0.001) were independent prognostic factors for the OS of SPM.
Table 4.
Univariate and multivariate Cox analysis of SPMs patients after PCa in the training and validation set.
| Characteristics | Univariate analysis | Multivariate analysis | ||||
|---|---|---|---|---|---|---|
| HR | CI95 | p | HR | CI95 | p | |
| Site of SPM | < 0.001 | < 0.001 | ||||
| Skin | Reference | Reference | ||||
| Bronchus and lung | 8.385 | 6.294–11.171 | 0.000 | 1.952 | 0.995–3.831 | 0.052 |
| Renal | 1.973 | 1.313–2.964 | 0.001 | 1.240 | 0.401–3.828 | 0.709 |
| Liver | 9.024 | 6.308–12.909 | 0.000 | 7.265 | 2.834–18.623 | 0.000 |
| Thyroid gland | 1.008 | 0.543–1.871 | 0.979 | 0.595 | 0.242–1.463 | 0.258 |
| Others | 2.671 | 1.990–3.585 | 0.000 | 0.978 | 0.513–1.866 | 0.947 |
| Histology of SPM | < 0.001 | 0.002 | ||||
| Squamous cell neoplasms | Reference | Reference | ||||
| Melanomas | 0.199 | 0.147–0.269 | 0.000 | 0.549 | 0.278–1.085 | 0.085 |
| Papillomas | 0.292 | 0.186–0.458 | 0.000 | 0.921 | 0.412–2.058 | 0.841 |
| Hepatocellular carcinoma | 1.742 | 1.277–2.375 | 0.000 | 0.576 | 0.268–1.242 | 0.159 |
| Adenocarcinomas | 0.553 | 0.362–0.845 | 0.006 | 1.072 | 0.382–3.011 | 0.895 |
| Others | 0.815 | 0.666–0.997 | 0.047 | 1.364 | 1.084–1.717 | 0.008 |
| Age | < 0.001 | < 0.001 | ||||
| <= 60 | Reference | Reference | ||||
| 61–70 | 1.211 | 0.885–1.657 | 0.231 | 1.130 | 0.818–1.561 | 0.458 |
| 71–80 | 1.861 | 1.373–2.521 | 0.000 | 1.692 | 1.224–2.340 | 0.001 |
| > 80 | 2.465 | 1.734–3.504 | 0.000 | 2.354 | 1.619–3.424 | 0.000 |
| Race | < 0.001 | 0.638 | ||||
| White | Reference | Reference | ||||
| Black | 1.605 | 1.287–2.001 | 0.000 | 1.040 | 0.821–1.317 | 0.747 |
| Other | 1.003 | 0.640–1.571 | 0.991 | 0.817 | 0.515–1.297 | 0.392 |
| Stage_T | < 0.001 | < 0.001 | ||||
| T1 | Reference | Reference | ||||
| Ta | 1.381 | 0.873–2.186 | 0.167 | 1.443 | 0.878–2.372 | 0.148 |
| T2 | 2.108 | 1.665–2.669 | 0.000 | 1.334 | 1.034–1.721 | 0.026 |
| T3 | 2.930 | 2.309–3.719 | 0.000 | 1.626 | 1.242–2.127 | 0.000 |
| T4 | 3.825 | 2.952–4.956 | 0.000 | 1.871 | 1.386–2.526 | 0.000 |
| Stage_N | < 0.001 | < 0.001 | ||||
| N0 | Reference | Reference | ||||
| N1 | 2.710 | 2.128–3.450 | 0.000 | 2.028 | 1.552–2.65 | 0.000 |
| N2 | 3.516 | 2.838–4.357 | 0.000 | 1.493 | 1.152–1.934 | 0.002 |
| N3 | 4.299 | 2.913–6.346 | 0.000 | 1.739 | 1.128–2.679 | 0.012 |
| Stage_M | < 0.001 | < 0.001 | ||||
| M0 | Reference | Reference | ||||
| M1 | 7.664 | 6.305–9.315 | 0.000 | 2.893 | 2.292–3.651 | 0.000 |
| LNR | < 0.001 | 0.088 | ||||
| No | Reference | Reference | ||||
| Yes | 0.600 | 0.474–0.760 | 0.000 | 0.757 | 0.555–1.033 | 0.079 |
| SPM surgical history | < 0.001 | < 0.001 | ||||
| Yes | Reference | Reference | ||||
| No | 0.198 | 0.165–0.236 | 0.000 | 0.597 | 0.452–0.790 | 0.000 |
| Histology of PCa | 0.134 | |||||
| Other | Reference | Reference | ||||
| Adenocarcinomas | 0.538 | 0.240–1.203 | 0.131 | |||
| PCa surgical history | < 0.001 | 0.450 | ||||
| Yes | Reference | Reference | ||||
| No | 0.600 | 0.495–0.726 | 0.000 | 0.930 | 0.751–1.151 | 0.503 |
| PCa Stage | < 0.001 | < 0.001 | ||||
| I | Reference | Reference | ||||
| II | 1.143 | 0.934–1.399 | 0.193 | 1.046 | 0.85–1.288 | 0.668 |
| III | 0.745 | 0.512–1.086 | 0.126 | 0.856 | 0.571–1.281 | 0.449 |
| IV | 2.411 | 1.704–3.410 | 0.000 | 2.419 | 1.684–3.476 | 0.000 |
| Marital status | < 0.001 | 0.038 | ||||
| Married | Reference | Reference | ||||
| Previously married | 1.391 | 1.141–1.696 | 0.001 | 1.120 | 0.914–1.372 | 0.275 |
| Never married | 1.477 | 1.126–1.939 | 0.005 | 1.469 | 1.104–1.955 | 0.008 |
Abbreviations: SPM: second primary malignancy; PCa: prostate cancer, LNR: lymph node removed.
Kaplan–Meier analysis for prognostic factors
We first calculated the risk score of each case according to the following formula: risk score = β1 × 1 + β2 × 2 + ⋯ + βnXn (β, regression coefficient; X, prognostic factor). Then, we divided samples into the high-risk group and low-risk group based on the media risk score. Kaplan–Meier (K–M) analysis showed significant differences in the prognosis between these two groups in the training set and validation set (Fig. 3A,B) and patients with high risks tended to have worse survival than those with low risk (p < 0.001). Significant differences were also observed in site of SPM (p < 0.001), age, TNM stage (p < 0.001), SPM surgery history (p < 0.001), and PCa stage (p < 0.001). Patients with higher age, TNM stage, PCa stage had better survival (Fig. 3C,G). Also, patients who received surgery for SPM tended to have increased survival (Fig. 3H). SPM of skin had significantly better survival than other kinds of SPM (Fig. 3I).
Figure 3.

Kaplan–Meier analysis for overall survival (OS) of second primary malignancy (SPM) after prostate cancer (PCa) based on risk score in the training set (p < 0.001) (A) and the validation set (p < 0.001) (B), age (p < 0.001) (C), stage T (p < 0.001) (D), stage N (p < 0.001) (E), stage M (p < 0.001) (F), PCa stage (p < 0.001) (G), SPM surgery history (p < 0.001) (H), and site of SPMs (p < 0.001) (I).
Construction and validation of OS nomogram
According to the results of univariate and multivariate Cox analysis, we chose the factors with p value < 0.001 to establish a nomogram to predict the 3-year and 5-year survival rate (Fig. 4). Seven clinical indicators, including site of SPM, age, TNM stage, SPM surgical history, and PCa stage were enrolled in our nomogram. In order to evaluate the discriminative ability of the nomogram constructed by us, we calculated the C-index in the training set (0.824, 95% CI: 0.806–0.842) and validation set (0.862, 95% CI: 0.840–0.884). The ROC was plotted and AUC was analyzed for both the training set and validation set (Fig. 5A–D). The AUCs in the training set used for 3-year and 5-year OS predication were 0.861 and 0.837, respectively. In the validation set, values of AUCs for 3-year and 5-year OS predication were 0.887 and 0.842. Both the C-index and the ROC indicated that the nomogram we constructed performed well in predicting the OS of SPM.
Figure 4.

Nomogram to predict 3- and 5-year survival for second primary malignancy (SPM) patients.
Figure 5.

Receiver operating characteristic (ROC) analysis to assess 3-year (A) and 5-year (B) survival for second primary malignancy (SPM) patients in the training set; The ROC curve to assess 3-year (C) and 5-year (D) survival in the validation set.
In order to evaluate the accuracy of our model, we also used the calibration plots to judge the consistency of our predictions with actual outcomes (Fig. 6A–D). Figures presented an acceptable agreement in the training cohort and an excellent agreement in SEER validation cohort between the nomogram predictions and actual observations for 3-year and 5-year OS.
Figure 6.

The calibration curve to evaluate the 3-year (A) and 5-year (B) survival for second primary malignancy (SPM) patients in training set; The calibration curve to evaluate the 3-year (C) and 5-year (D) survival for SPMs patients in the validation set. Nomogram-predicted overall survival (OS) is plotted on the x-axis; actual OS is plotted on the y-axis. The imaginary line indicates a perfect calibration model in which the predicted probabilities are identical to the actual survival outcomes.
Discussions
As the most common cancer among males, the survival time of PCa patients has been significantly extended due to early detection and effective therapeutic strategies. PSA screening is helpful for early diagnosis, and can significantly reduce the mortality rate of PCa20. For decades, ADT through surgical or medical castration has been part of the standard treatment for PCa. Newly launched second-generation androgen receptor (AR) inhibitors for castration-resistant prostate cancer (CRPC), such as enzalutamide, also show significant capacities of improving the prognosis of PCa21. Recently, the use of ADT in combination with second-generation AR targeting agents or chemotherapy has significantly prolonged the longevity of metastatic hormone sensitive prostate cancer (mCRPC) patients. The addition of abiraterone acetate to ADT has shown a survival advantage compared to using ADT alone22,23. Two clinical trials have shown that, compared with alone, ADT plus docetaxel can improve the survival rate for adequately fit men24,25. All these advanced treatments have together contributed to the prolonged survival of PCa patients. Previous studies have shown that patients with in situ melanoma have an increased risk of developing PCa26 and young men among colorectal cancer survivors have an excessively high risk of developing SPMs27. These evidences indicate that cancer patients had chances of developing SPMs. Studies in South Korea and Taiwan show that compared to the general population, PCa patients have a lower risk of SPMs, but once they got SPMs, the survival time of PCa patients will be greatly shortened28,29. For the reason of better insight into SPMs after PCa, we investigated the characteristics of SPM following PCa, and constructed a model based on clinicopathologic characteristics to predict the prognosis of SPM following PCa.
As a result of the extended survival period of PCa patients, recurrence, metastasis, and SPMs are expected to increase. In clinical practice, SPMs or multiple primary malignancies are very frequently indistinct from the metastasis of initial malignancy, leading to misdiagnosis and improper treatment of patients. In contrast to multiple primary malignancies, SPMs can affect the same organ but are anatomically distinct from the primary tumor, and represent neither a metastatic nor recurrent tumor from the initial malignancy. Via a strict screening process, we distinguished between SPMs from multiple primary malignancies, metastasis, and recurrence. After accurate identification, 3.69% of PCa patients were diagnosed with SPMs, which was much lower than previous 11.3%8. Compared with previous studies, our investigation enrolled a much larger population, containing 945,196 SPM samples. Our study showed that the three most prevalent sites of SPM were skin, hematopoietic system, bronchus and lung. Similar to our results, previous studies in Sweden reported that the most common SPMs were colorectal cancer, skin cancer, bladder cancer, lung cancer, melanoma, and non-Hodgkin lymphoma8. Another study also showed that the most common cancers of SPMs after PCa were lung and colon cancer30. In addition to these three most prevalent sites, a significant increase of SPM in the urinary tract was also observed in our study. It has been reported that there is an increased risk of developing SPMs in the bladder13,29. Shared etiology of the urinary system, such as common carcinogenic pathways, chronic inflammatory stimulation, and genetic mutations31, may be the reasons for this trend. The top three histological types of SPM were squamous cell carcinoma, adenoma and adenocarcinoma, nevi and melanoma, consistent with the histology of epidemic sites. These results indicated that these prone sites should be cautiously monitored.
Former researches have established nomograms to predict the probability of getting SPMs, including lung cancer survivors32,33, esophageal adenocarcinoma and squamous cell carcinoma patients34. However, as far as we know, there is no literature on the prognosis across the spectrum of PCa patients subsequently diagnosed with SPMs. In order to explore the outcome of SPM following PCa, we identified 7 parameters, including the site of SPM, age, TNM stage, SPM surgical history, and PCa stage, to predict the 3-year and 5-year OS of SPM patients. According to our assessment, our model performed well in predicting the outcomes of SPM patients. Of all these factors, surgical history of PCa and histological type of PCa presented a weak correlation with the outcome of SPM, which might suggest that SPM mainly accounted for the death of SPM following PCa. Besides, researchers also found that most causes of death were caused by SPM not PCa11,35. PCa stage was enrolled in our nomogram, and was used to construct a predicting model for metastatic PCa together with TNM stage36,37. We could conclude that PCa still had its impact on the OS of SPM.
However, we did not investigate the relationship between RT and SPM. According to earlier reports, PCa patients receiving RT have a higher risk of getting SPMs38–40. A meta-analysis also reveals that PCa patients receiving RT had an increasing risk of developing SPM of the bladder, colon, and rectum41. Some studies have shown that there is no difference in the incidence of SPM among patients receiving RT or other therapies13,42. The role of RT in the initiation of SPM still needs more exploration and the effect of RT on the survival of PCa patients remains unclear. Gene is another important internal factor of tumorigenesis of SPM, but the genotype–phenotype correlation of SPMs is still unclear. A significantly increased risk of SPM has been observed in survivors of hereditary retinoblastoma with high RB1 mutations43. P53 gene whose polymorphisms are associated with an increased risk of SPM is another gene extensively researched44–46. On the contrary, Anette. E et.al believed the correlation between P53 mutation and the incidence of SPM was doubtful47. Only limited evidence about the SPM genotype were explored and more studies are needed to explain the relationship between SPMs and gene mutations. Some other factors, such as smoking and obesity, were not investigated due to the nature of the SEER database. We are trying to explore the association between cancer-specific survival and clinicopathologic characteristics, but the causes of tumor death in many patients are still vague. Despite these limitations, our study still has its implications for PCa survivors.
In conclusion, we described the general characteristics of SPM following PCa and identified 7 clinical indicators to build a nomogram to predict the survival of SPM. The model we constructed performed well in assessing the prognosis of SPM but its actual efficiency should be evaluated with more large-scale researches. In addition, more studies should focus on the initiation, development, and prognosis of SPM.
Supplementary Information
Acknowledgements
The authors gratefully acknowledge the efforts of the Surveillance, Epidemiology, and End Results (SEER) Program tumor registries in providing high quality open resources for researchers. The authors would like to thank the editors and the anonymous reviewer for their valuable comments and suggestions to improve the quality of the paper.
Author contributions
(I) Conception and design: Y.L., P.Z.; (II) Administrative support: Y.Z., W.X.; (III) Provision of study materials or patients: D.H., L.Z.; (IV) Collection and assembly of data: Y.L., Y.Z., Z.K.; (V) Data analysis and interpretation: Y.L., P.Z., Z.K.; (VI) Manuscript writing: All authors; All authors reviewed the manuscript.
Funding
None.
Competing interests
The authors declare no competing interests.
Footnotes
Publisher's note
Springer Nature remains neutral with regard to jurisdictional claims in published maps and institutional affiliations.
Supplementary Information
The online version contains supplementary material available at 10.1038/s41598-020-80534-4.
References
- 1.Miller KD, et al. Cancer treatment and survivorship statistics, 2019. CA Cancer J. Clin. 2019 doi: 10.3322/caac.21565. [DOI] [PubMed] [Google Scholar]
- 2.Siegel RL, Miller KD, Jemal A. Cancer statistics, 2020. 2020;2020(70):7–30. doi: 10.3322/caac.21590. [DOI] [PubMed] [Google Scholar]
- 3.Teo MY, Rathkopf DE, Kantoff P. Treatment of advanced prostate cancer. Annu. Rev. Med. 2019;70:479–499. doi: 10.1146/annurev-med-051517-011947. [DOI] [PMC free article] [PubMed] [Google Scholar]
- 4.Litwin MS, Tan HJ. The diagnosis and treatment of prostate cancer: a review. JAMA. 2017;317:2532–2542. doi: 10.1001/jama.2017.7248. [DOI] [PubMed] [Google Scholar]
- 5.Mohiuddin JJ, Baker BR, Chen RC. Radiotherapy for high-risk prostate cancer. Nat. Rev. Urol. 2015;12:145–154. doi: 10.1038/nrurol.2015.25. [DOI] [PubMed] [Google Scholar]
- 6.Vogt A, et al. Multiple primary tumours: challenges and approaches, a review. ESMO Open. 2017;2:e000172. doi: 10.1136/esmoopen-2017-000172. [DOI] [PMC free article] [PubMed] [Google Scholar]
- 7.Travis LB, Demark Wahnefried W, Allan JM, Wood ME, Ng AK. Aetiology, genetics and prevention of secondary neoplasms in adult cancer survivors. Nat. Rev. Clin. Oncol. 2013;10:289–301. doi: 10.1038/nrclinonc.2013.41. [DOI] [PubMed] [Google Scholar]
- 8.Chattopadhyay S, et al. Prostate cancer survivors: risk and mortality in second primary cancers. Cancer Med. 2018;7:5752–5759. doi: 10.1002/cam4.1764. [DOI] [PMC free article] [PubMed] [Google Scholar]
- 9.Chen T, et al. Distribution and risk of the second discordant primary cancers combined after a specific first primary cancer in German and Swedish cancer registries. Cancer Lett. 2015;369:152–166. doi: 10.1016/j.canlet.2015.08.014. [DOI] [PubMed] [Google Scholar]
- 10.Barclay ME, et al. Incidence of second and higher order smoking-related primary cancers following lung cancer: a population-based cohort study. Thorax. 2019;74:466–472. doi: 10.1136/thoraxjnl-2018-212456. [DOI] [PMC free article] [PubMed] [Google Scholar]
- 11.Chattopadhyay S, et al. Impact of family history of cancer on risk and mortality of second cancers in patients with prostate cancer. Prostate Cancer Prostatic Dis. 2019;22:143–149. doi: 10.1038/s41391-018-0089-y. [DOI] [PubMed] [Google Scholar]
- 12.Martling A, et al. Risk of second primary cancer in patients treated with radiotherapy for rectal cancer. Br. J. Surg. 2017;104:278–287. doi: 10.1002/bjs.10327. [DOI] [PubMed] [Google Scholar]
- 13.Hegemann NS, et al. Risk of second cancer following radiotherapy for prostate cancer: a population-based analysis. Radiat. Oncol. 2017;12:2. doi: 10.1186/s13014-016-0738-z. [DOI] [PMC free article] [PubMed] [Google Scholar]
- 14.Keegan THM, Bleyer A, Rosenberg AS, Li Q, Goldfarb M. Second primary malignant neoplasms and survival in adolescent and young adult cancer survivors. JAMA Oncol. 2017;3:1554–1557. doi: 10.1001/jamaoncol.2017.0465. [DOI] [PMC free article] [PubMed] [Google Scholar]
- 15.Iasonos A, Schrag D, Raj GV, Panageas KS. How to build and interpret a nomogram for cancer prognosis. J. Clin. Oncol. 2008;26:1364–1370. doi: 10.1200/JCO.2007.12.9791. [DOI] [PubMed] [Google Scholar]
- 16.Zhang Y, Hong YK, Zhuang DW, He XJ, Lin ME. Bladder cancer survival nomogram: development and validation of a prediction tool, using the SEER and TCGA databases. Medicine (Baltimore) 2019;98:e17725. doi: 10.1097/MD.0000000000017725. [DOI] [PMC free article] [PubMed] [Google Scholar]
- 17.Wang C, et al. A prognostic nomogram for cervical cancer after surgery from SEER database. J. Cancer. 2018;9:3923–3928. doi: 10.7150/jca.26220. [DOI] [PMC free article] [PubMed] [Google Scholar]
- 18.Feng SS, et al. Clinical characteristics and disease-specific prognostic nomogram for primary gliosarcoma: a SEER population-based analysis. Sci. Rep. 2019;9:10744. doi: 10.1038/s41598-019-47211-7. [DOI] [PMC free article] [PubMed] [Google Scholar]
- 19.19Warren, S. - Multiple primary malignant tumors. A survey of the literature and a statistical study. - 16 (1932).
- 20.Schroder FH, et al. Prostate-cancer mortality at 11 years of follow-up. N. Engl. J. Med. 2012;366:981–990. doi: 10.1056/NEJMoa1113135. [DOI] [PMC free article] [PubMed] [Google Scholar]
- 21.Scott LJ. Enzalutamide: a review in castration-resistant prostate cancer. Drugs. 2018;78:1913–1924. doi: 10.1007/s40265-018-1029-9. [DOI] [PubMed] [Google Scholar]
- 22.James ND, et al. Abiraterone for prostate cancer not previously treated with hormone therapy. N. Engl. J. Med. 2017;377:338–351. doi: 10.1056/NEJMoa1702900. [DOI] [PMC free article] [PubMed] [Google Scholar]
- 23.Fizazi K, et al. Abiraterone plus prednisone in metastatic, castration-sensitive prostate cancer. N. Engl. J. Med. 2017;377:352–360. doi: 10.1056/NEJMoa1704174. [DOI] [PubMed] [Google Scholar]
- 24.James ND, et al. Addition of docetaxel, zoledronic acid, or both to first-line long-term hormone therapy in prostate cancer (STAMPEDE): survival results from an adaptive, multiarm, multistage, platform randomised controlled trial. Lancet. 2016;387:1163–1177. doi: 10.1016/S0140-6736(15)01037-5. [DOI] [PMC free article] [PubMed] [Google Scholar]
- 25.25Scott, E. Chemohormonal therapy in metastatic hormone-sensitive prostate cancer. Sweeney CJ, Chen YH, Carducci M, Liu G, Jarrard DF, Eisenberger M, Wong YN, Hahn N, Kohli M, Cooney MM, Dreicer R, Vogelzang NJ, Picus J, Shevrin D, Hussain M, Garcia JA, DiPaola RS. Department of Medicine; Department of Biostatistics and Computational Biology; Dana-Farber Cancer Institute, Boston; Harvard Medical School, Boston; Johns Hopkins University, Baltimore; University of Wisconsin Carbone Cancer Center; School of Medicine and Public Health; Madison; Fox Chase Cancer Center, Temple University Health System, Philadelphia; Indiana University Melvin and Bren Simon Cancer Center, Indianapolis; Mayo Clinic, Rochester, MN; University Hospitals Case Medical Center, Seidman Cancer Center; Cleveland Clinic Taussig Cancer Institute; Both in Cleveland; University of Virginia Cancer Center, Charlottesville; Comprehensive Cancer Centers of Nevada, Las Vegas; Siteman Cancer Center, Washington University School of Medicine, St. Louis; NorthShore University Health System, Evanston, IL; University of Michigan Comprehensive Cancer Center, Ann Arbor; Rutgers Cancer Institute of New Jersey, New Brunswick. N Engl J Med. 2015 Aug 20;373(8):737–46. [Epub 2015 Aug 5]. doi: 10.1056/NEJMoa1503747. Urol Oncol35, 123, doi:10.1016/j.urolonc.2016.12.021 (2017).
- 26.Kimlin MG, et al. Risk of second primary cancer in survivors of in situ melanoma. J. Invest. Dermatol. 2019;139:842–847. doi: 10.1016/j.jid.2018.11.001. [DOI] [PubMed] [Google Scholar]
- 27.He X, et al. Excessive risk of second primary cancers in young-onset colorectal cancer survivors. Cancer Med. 2018;7:1201–1210. doi: 10.1002/cam4.1437. [DOI] [PMC free article] [PubMed] [Google Scholar]
- 28.Fan CY, et al. Risk of second primary malignancies among patients with prostate cancer: a population-based cohort study. PLoS ONE. 2017;12:e0175217. doi: 10.1371/journal.pone.0175217. [DOI] [PMC free article] [PubMed] [Google Scholar]
- 29.Joung JY, et al. Risk of second primary cancer among prostate cancer patients in Korea: a population-based cohort study. PLoS ONE. 2015;10:e0140693. doi: 10.1371/journal.pone.0140693. [DOI] [PMC free article] [PubMed] [Google Scholar]
- 30.Van Hemelrijck M, et al. Incidence of second malignancies for prostate cancer. PLoS ONE. 2014;9:e102596. doi: 10.1371/journal.pone.0102596. [DOI] [PMC free article] [PubMed] [Google Scholar]
- 31.Singh A, et al. Higher than expected association of clinical prostate and bladder cancers. J. Urol. 2005;173:1526–1529. doi: 10.1097/01.ju.0000154700.80042.c6. [DOI] [PubMed] [Google Scholar]
- 32.Zhou H, et al. Risk of second primary malignancy after non-small cell lung cancer: a competing risk nomogram based on the SEER database. Ann. Transl. Med. 2019;7:439. doi: 10.21037/atm.2019.09.01. [DOI] [PMC free article] [PubMed] [Google Scholar]
- 33.Hu ZG, Li WX, Ruan YS, Zeng FJ. Incidence trends and risk prediction nomogram of metachronous second primary lung cancer in lung cancer survivors. PLoS ONE. 2018;13:e0209002. doi: 10.1371/journal.pone.0209002. [DOI] [PMC free article] [PubMed] [Google Scholar]
- 34.Zhang G, Wu B, Wang X, Li J. Second primary malignancy in patients with esophageal adenocarcinoma and squamous cell carcinoma. Medicine (Baltimore) 2019;98:e17083. doi: 10.1097/MD.0000000000017083. [DOI] [PMC free article] [PubMed] [Google Scholar]
- 35.Donin N, et al. Risk of second primary malignancies among cancer survivors in the United States, 1992 through 2008. Cancer. 2016;122:3075–3086. doi: 10.1002/cncr.30164. [DOI] [PMC free article] [PubMed] [Google Scholar]
- 36.Jiang WD, Yuan PC. Development and validation of prognostic nomograms for patients with metastatic prostate cancer. Int. Urol. Nephrol. 2019;51:1743–1753. doi: 10.1007/s11255-019-02224-z. [DOI] [PubMed] [Google Scholar]
- 37.Hou G, et al. Development and validation of a SEER-based prognostic nomogram for patients with bone metastatic prostate cancer. Medicine (Baltimore) 2019;98:e17197. doi: 10.1097/MD.0000000000017197. [DOI] [PMC free article] [PubMed] [Google Scholar]
- 38.Huang J, et al. Analysis of second malignancies after modern radiotherapy versus prostatectomy for localized prostate cancer. Radiother. Oncol. 2011;98:81–86. doi: 10.1016/j.radonc.2010.09.012. [DOI] [PubMed] [Google Scholar]
- 39.Kendal WS, Eapen L, Macrae R, Malone S, Nicholas G. Prostatic irradiation is not associated with any measurable increase in the risk of subsequent rectal cancer. Int. J. Radiat. Oncol. Biol. Phys. 2006;65:661–668. doi: 10.1016/j.ijrobp.2005.11.013. [DOI] [PubMed] [Google Scholar]
- 40.Pickles T, Phillips N. The risk of second malignancy in men with prostate cancer treated with or without radiation in British Columbia, 1984–2000. Radiother. Oncol. 2002;65:145–151. doi: 10.1016/s0167-8140(02)00307-9. [DOI] [PubMed] [Google Scholar]
- 41.Wallis CJ, et al. Second malignancies after radiotherapy for prostate cancer: systematic review and meta-analysis. BMJ. 2016;352:i851. doi: 10.1136/bmj.i851. [DOI] [PMC free article] [PubMed] [Google Scholar]
- 42.Hinnen KA, et al. Prostate brachytherapy and second primary cancer risk: a competitive risk analysis. J. Clin. Oncol. 2011;29:4510–4515. doi: 10.1200/JCO.2011.35.0991. [DOI] [PubMed] [Google Scholar]
- 43.Dommering CJ, et al. RB1 mutations and second primary malignancies after hereditary retinoblastoma. Fam. Cancer. 2012;11:225–233. doi: 10.1007/s10689-011-9505-3. [DOI] [PMC free article] [PubMed] [Google Scholar]
- 44.Zhang Y, et al. Genetic variants of the p53 and p73 genes jointly increase risk of second primary malignancies in patients after index squamous cell carcinoma of the head and neck. Cancer. 2012;118:485–492. doi: 10.1002/cncr.26222. [DOI] [PMC free article] [PubMed] [Google Scholar]
- 45.Gasparotto D, et al. Recurrences and second primary tumours in the head and neck region: differentiation by p53 mutation analysis. Ann. Oncol. 1995;6:933–939. doi: 10.1093/oxfordjournals.annonc.a059362. [DOI] [PubMed] [Google Scholar]
- 46.Chung KY, et al. Discordant p53 gene mutations in primary head and neck cancers and corresponding second primary cancers of the upper aerodigestive tract. Cancer Res. 1993;53:1676–1683. [PubMed] [Google Scholar]
- 47.Escher A, Piotet E, Waridel F, Iggo R, Monnier P. p53 Mutation in histologically normal mucosa of the aero-digestive tract is not a marker of increased risk for second primary carcinoma in head and neck cancer patients. Eur. Arch. Otorhinolaryngol. 2009;266:547–551. doi: 10.1007/s00405-008-0780-z. [DOI] [PubMed] [Google Scholar]
Associated Data
This section collects any data citations, data availability statements, or supplementary materials included in this article.