Abstract
Understanding the pathophysiology of SARS-CoV-2 infection is critical for therapeutic and public health strategies. Viral–host interactions can guide discovery of disease regulators, and protein structure function analysis points to several immune pathways, including complement and coagulation, as targets of coronaviruses. To determine whether conditions associated with dysregulated complement or coagulation systems impact disease, we performed a retrospective observational study and found that history of macular degeneration (a proxy for complement-activation disorders) and history of coagulation disorders (thrombocytopenia, thrombosis and hemorrhage) are risk factors for SARS-CoV-2-associated morbidity and mortality—effects that are independent of age, sex or history of smoking. Transcriptional profiling of nasopharyngeal swabs demonstrated that in addition to type-I interferon and interleukin-6-dependent inflammatory responses, infection results in robust engagement of the complement and coagulation pathways. Finally, in a candidate-driven genetic association study of severe SARS-CoV-2 disease, we identified putative complement and coagulation-associated loci including missense, eQTL and sQTL variants of critical complement and coagulation regulators. In addition to providing evidence that complement function modulates SARS-CoV-2 infection outcome, the data point to putative transcriptional genetic markers of susceptibility. The results highlight the value of using a multimodal analytical approach to reveal determinants and predictors of immunity, susceptibility and clinical outcome associated with infection.
The SARS-CoV-2 pandemic has had profound economic, social and public health impact with over 11 million confirmed cases and over 530,000 deaths globally. Widely reported age-dependent mortality rates associated with infection appear to be driven by viral replication and comorbidities that influence immune-mediated pathology1,2. Understanding how molecular virus–host interactions manifest as risk factors can delineate regulatory programs that mediate immune pathology3, provide valuable clues about disease determinants, facilitate clinical management and help guide choice of therapeutic interventions and setting of appropriate social and public health measures. As part of a separate study, we mapped over 140 cellular proteins that are structurally mimicked by coronaviruses (CoVs) and identified complement and coagulation pathways as targets of this strategy across all CoV strains4. The complement system is a critical defense against pathogens, including viruses5 and when dysregulated (by germline variants or acquired through age-related effects or excessive tissue damage) can contribute to pathologies mediated by inflammation5–7. Similarly, inflammation-induced coagulatory programs, which can themselves be regulated by the complement system, are pivotal in controlling pathogenesis associated with infections. So, virally encoded structural mimics of complement and coagulation factors may contribute to CoV-associated immune-mediated pathology and indicate sensitivities in antiviral defenses. For example, dysfunctions associated with complement (for example, early-onset and age-related macular degeneration (AMD)6–10) and/or coagulation (for example, thrombocytopenia, thrombosis and hemorrhage) may impact clinical outcome of SARS-CoV-2 infection. Guided by protein structure–function analysis and observations that CoV infections result in hypercoagulative phenotypes11,12, we set out to explore the role of complement or coagulatory function in SARS-CoV-2 infection and clinical outcome. In a retrospective observational study of 11,116 patients who presented with suspected SARS-CoV-2 infection, we found that history of macular degeneration (a proxy for complement activation disorders) and history of coagulation disorders (thrombocytopenia, thrombosis and hemorrhage) are risk factors for morbidity and mortality in SARS-CoV-2-infected patients, effects that could not be explained by age, sex or history of smoking. Transcriptional profiling of nasopharyngeal swabs (NPs) from 650 control and SARS-CoV-2-infected patients demonstrated that infection results in robust engagement and activation of complement and coagulation pathways. Finally, a candidate-driven genetic association study of severe SARS-CoV-2 disease identified missense, expression quantitative trait loci (eQTL) and splicing quantitative trait loci (sQTL) variants in critical regulators of complement and coagulation. In addition to providing evidence that these cascades modulate SARS-CoV-2 infection outcome, the data point to putative transcriptional and genetic markers of susceptibility. The results highlight the value of a multimodal analytical approach, combining molecular information from virus protein structure–function analysis with clinical informatics, transcriptomics and genomics to reveal determinants and predictors of immunity, susceptibility and clinical outcome associated with infection.
Between 1 February 2020 and 25 April 2020, 11,116 patients presented to New York-Presbyterian/Columbia University Irving Medical Center with suspected SARS-CoV-2 infection, of which 6,398 tested positive (Table 1). Electronic health records (EHRs) were used to define sex, age and smoking history status as well as histories of macular degeneration, coagulatory disorders (thrombocytopenia, thrombosis and hemorrhage), hypertension, type 2 diabetes (T2D), coronary artery disease (CAD) and obesity (see Methods). We identified 88 patients with history of macular degeneration, 4 with complement deficiency disorders and 1,179 with coagulatory disorders (other comorbidity frequencies are shown in Table 1 and covariances between them are shown in Extended Data Fig. 1). We observed a 35% mortality rate among patients that were put on mechanical ventilation and that 31% of deceased patients had been on mechanical respiration.
Table 1|.
Patient cohort demographic details, broken down by SARS-CoV-2 infection and disease status
| All patients | SARS-Cov-2 positive (C19+) | Intubated and C19+ | Mortality and C19+ | Macula and C19+ | Complement def. and C19+ | Coagulation and C19+ | Hypertension and C19+ | T2D and C19+ | Obesity and C19+ | CAD and C19+ | Over 65 years and C19+ | Cough (reference) and C19+ | Smokers and C19+ | |
|---|---|---|---|---|---|---|---|---|---|---|---|---|---|---|
| n | 11,116 | 6,393 | 484 | 618 | 88 | 4 | 1,239 | 1,988 | 911 | 831 | 1,698 | 2,400 | 725 | 723 |
| Age (IQR) | 52.0 (34.7–69.5) | 57.1 (41.5–72.0) | 62.3 (53.0–73.3) | 76.3 (69.5–86.3) | 74.1 (67.2–84.6) | 57.9 (49.1–70.9) | 61.8 (48.2–77.0) | 66.6 (56.4–78.5) | 67.2 (57.9–78.2) | 57.9 (43.5–71.8) | 66.2 (55.9–79.6) | 77.4 (70.4–83.5) | 59.2 (46.6–72.0) | 63.8 (54.8–74.7) |
| Sex (% male) | 44.8 | 49.7 | 63.4 | 59.2 | 42 | 50 | 42.1 | 48.5 | 52.5 | 32.9 | 49.8 | 52 | 53.4 | 61.4 |
| Past/current smoker (%) | 26.8 | 25.7 | 27.7 | 33.7 | 29.5 | 50 | 26.7 | 30.3 | 32.4 | 23.9 | 31 | 33.8 | 25.5 | 100 |
| Data source historical (%) | 61.7 | 62.9 | 71.3 | 79.6 | 100 | 100 | 97.9 | 98.4 | 97.4 | 98.6 | 96.2 | 65.6 | 81.9 | 79.9 |
| Asian (%) | 2.7 | 2.4 | 0.8 | 0.8 | 0 | 0 | 1.9 | 1.5 | 1.4 | 1 | 1.8 | 1.4 | 1.7 | 0.8 |
| Black/African American (%) | 21.2 | 22.2 | 21.5 | 17.5 | 17 | 25 | 20.2 | 20.9 | 23.8 | 21.4 | 21.1 | 22.9 | 18.2 | 24.5 |
| White (%) | 31.3 | 28.4 | 23.6 | 27.3 | 36.4 | 0 | 34.1 | 30.8 | 27.8 | 29.8 | 33.7 | 31.3 | 28.4 | 31.4 |
| Other (%) | 26.6 | 27.9 | 31 | 32.4 | 28.4 | 50 | 24.4 | 27.5 | 27 | 29.1 | 24.7 | 28.6 | 31 | 24.8 |
| Declined (%) | 18.1 | 19.1 | 23.1 | 22 | 18.2 | 25 | 19.5 | 19.3 | 20 | 18.7 | 18.7 | 15.8 | 20.7 | 18.5 |
| Hispanic (%) | 31.8 | 34.2 | 48.8 | 48.7 | 59.1 | 50 | 49 | 48.5 | 49.6 | 54.3 | 44.3 | 37 | 51 | 35.1 |
| Not Hispanic (%) | 39.5 | 37 | 27.9 | 28.8 | 25 | 25 | 30.9 | 30.6 | 29.2 | 26.5 | 34 | 38 | 25.2 | 40.5 |
| Declined/other (%) | 28.7 | 28.8 | 23.3 | 22.5 | 15.9 | 25 | 20.1 | 20.9 | 21.2 | 19.3 | 21.6 | 25 | 23.7 | 24.3 |
| Hypertension (%) | 28.2 | 31.1 | 43.4 | 60.2 | 89.8 | 100 | 72.2 | 100 | 85.3 | 75.6 | 77.3 | 46.2 | 49.1 | 53.3 |
| T2D (%) | 12.6 | 14.2 | 22.9 | 30.9 | 54.5 | 25 | 34.5 | 39.1 | 100 | 40.2 | 38.2 | 22.3 | 23.3 | 27.2 |
| Obesity (%) | 12 | 13 | 15.9 | 18.6 | 38.6 | 0 | 34.4 | 31.6 | 36.7 | 100 | 31.1 | 13.5 | 20.4 | 18.8 |
| CAD (%) | 26.8 | 26.6 | 41.1 | 55 | 79.5 | 100 | 65.4 | 66 | 71.2 | 63.5 | 100 | 40.6 | 40.3 | 46.9 |
| Mechanical ventilation | 9.2 (8.7–9.8) | 7.6 (6.9–8.2) | 100 (100–100) | 33.0 (29.3–36.7) | 15.9 (8.3–23.6) | 0 (0–0) | 10.2 (8.5–11.9) | 10.6 (9.2–11.9) | 12.2 (10.1–14.3) | 9.3 (7.3–11.2) | 11.7 (10.2–13.2) | 10.1 (8.9–11.3) | 10.5 (8.3–12.7) | 11.1 (8.8–13.4) |
| Mortality | 10.2 (9.7–10.8) | 9.7 (8.9–10.4) | 42.1 (37.7–46.5) | 100 (100–100) | 25.0 (16.0–34.0) | 0 (0–0) | 17.1 (15.0–19.2) | 18.7 (17.0–20.4) | 21.0 (18.3–23.6) | 13.8 (11.5–16.2) | 20.0 (18.1–21.9) | 21.4 (19.7–23.0) | 12.7 (10.3–15.1) | 15.2 (12.6–17.8) |
| Intubation HR (95% CI) / univar. | -- | -- | -- | -- | 2.2 (1.3–3.7)** | -- | 1.5 (1.2–1.8)** | 1.7 (1.5–2.1)** | 1.9 (1.5–2.3)** | 1.3 (1.0–1.7)* | 2.0 (1.7–2.4)** | 1.7 (1.4–2.0)** | 1.5 (1.1–1.9)** | 1.1 (0.9–1.5) |
| Intubation HR (95% CI) / age and sex corr. | -- | -- | -- | -- | 1.8 (1.1–3.1)* | -- | 1.5 (1.2–1.8)** | 1.6 (1.3–1.9)** | 1.6 (1.3–2.0)** | 1.5 (1.1–1.9)** | 1.8 (1.5–2.2)** | 1.3 (1.0–1.8) | 1.4 (1.1–1.8)** | 1.0 (0.7–1.3) |
| Death HR (95% CI) / univar. | -- | -- | -- | -- | 3.0 (2.0–4.6)** | -- | 2.3 (2.0–2.8)** | 3.8 (3.2–4.4)** | 2.9 (2.5–3.5)** | 1.6 (1.3–2.0)** | 3.7 (3.2–4.3)** | 8.8 (7.1–10.9)** | 1.3 (1.1–1.7)* | 1.5 (1.2–1.9)** |
| Death HR (95% CI) / age and sex corr. | -- | -- | -- | -- | 1.5 (1.0–2.3)* | -- | 1.8 (1.5–2.1)** | 2.3 (2.0–2.7)** | 2.0 (1.7–2.4)** | 1.9 (1.6–2.4)** | 2.2 (1.9–2.6)** | 1.7 (1.2–2.3)** | 1.3 (1.1–1.6)* | 1.1 (0.9–1.4) |
C19+, COVID-19 positive; HR, hazard ratio; IQR, interquartile range;
P < 0.05,
P < 0.001.
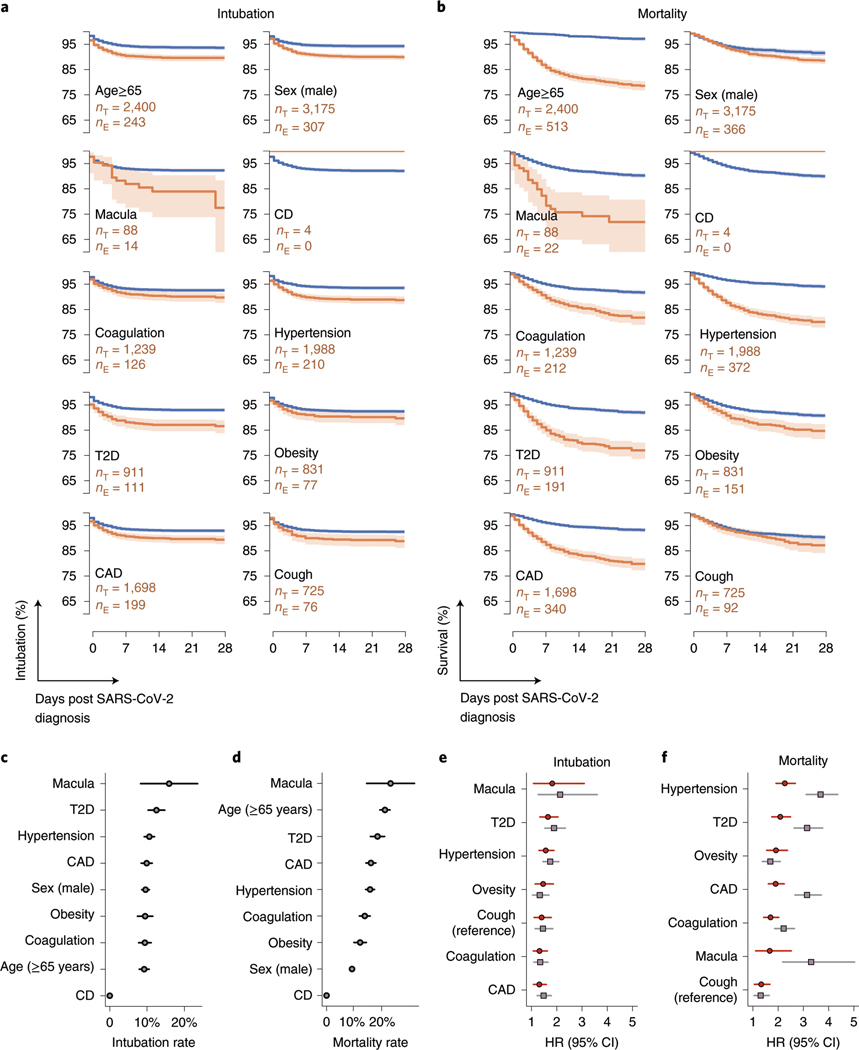
We used survival analysis and Cox proportional hazards regression modeling to estimate univariate and age- and sex-corrected risk associated with clinical history of previously reported SARS-CoV-2 risk factors as well as coagulation and complement disorders. We identified significant risk of mechanical respiration and mortality associated with age and sex, as well as history of hypertension, obesity, T2D and CAD (Fig. 1 and Table 1). Notably, we did not find evidence that smoking status (past or present) is a significant risk factor for either mechanical respiration or mortality. However, patients with AMD (a proxy for complement activation disorders) and coagulation disorders (thrombocytopenia, thrombosis and hemorrhage) were at significantly increased risk of adverse clinical outcomes (including mechanical respiration and death) following SARS-CoV-2 infection (Fig. 1 and Table 1). Moreover, as shown in Fig. 1b, patients with AMD succumb to disease more rapidly than others. Critically, the contribution of age and sex was not sufficient to explain the increased risks associated with history of macular degeneration or coagulation disorders (Fig. 1 and Table 1). Conversely, albeit in a small number of individuals, we observed that among patients with complement deficiency disorders, who are normally at increased risk of complications associated with infections, none required mechanical respiration or succumbed to their illness (Table 1 and Fig. 1a,b). Notably, while the correlation between AMD or coagulopathies and established covariates included in this study is low (Extended Data Fig. 1 and Extended Data 1), further study will be necessary to rule out comorbidities that may be associated with AMD and coagulopathies. Together, these data suggest that hyperactive complement and coagulative states predispose individuals to adverse outcomes associated with SARS-CoV-2 infection and that deficiencies in complement components may be protective. However, given the low incidence rate of deficiencies in either complement or coagulation pathways, further analysis with larger clinical cohorts is warranted.
Fig. 1 |. History of macular degeneration and coagulation disorders are associated with adverse outcomes after confirmed SARS-CoV-2 infection.
a, Kaplan–Meier curves (line, proportion of subjects that did not require intubation; error band, 95% CI (Greenwood’s)) for ten binary conditions: age > 65 years, male sex, macular degeneration (macula), complement deficiency disorders (CD), coagulation, hypertension, T2D, obesity, CAD and cough. The survival rates for the patients with the named condition are shown in orange (sample size is given as nE). The shaded region indicates the 95% CI. The blue survival line is for patients without the named condition (sample size is given as nT). Note that none of the four patients with CD required mechanical ventilation. b, Kaplan–Meier curves (line, proportion of subjects that survived; error band, 95% CI (Greenwood’s)) for the same ten conditions as in a. All four patients with CD survived (not statistically significant). c, Intubation rates across the binary conditions. Intubation was highest in patients with a history of macular degeneration (n = 14), followed by T2D (n = 111) and hypertension (n = 210). Error bars indicate binomial 95% CIs. d, Mortality rates across the binary conditions. Patients with a history of macular degeneration saw the highest mortality rates (n = 22), followed by age ≥ 65 (n = 513) and T2D (n = 191). Error bars indicate binomial 95% CI. e, HRs, estimated using a Cox proportional hazards model, for risk of intubation (as a validated proxy for requiring mechanical respiration). Sample sizes are the same as in a, and error bars represent 95% CI derived from the s.e.m. f, Similarly, HRs for mortality, estimated using a Cox proportional hazards model. HRs and statistical significances are shown in Table 1. Sample sizes are the same as in b, and error bars represent 95% CI derived from the s.e.m.
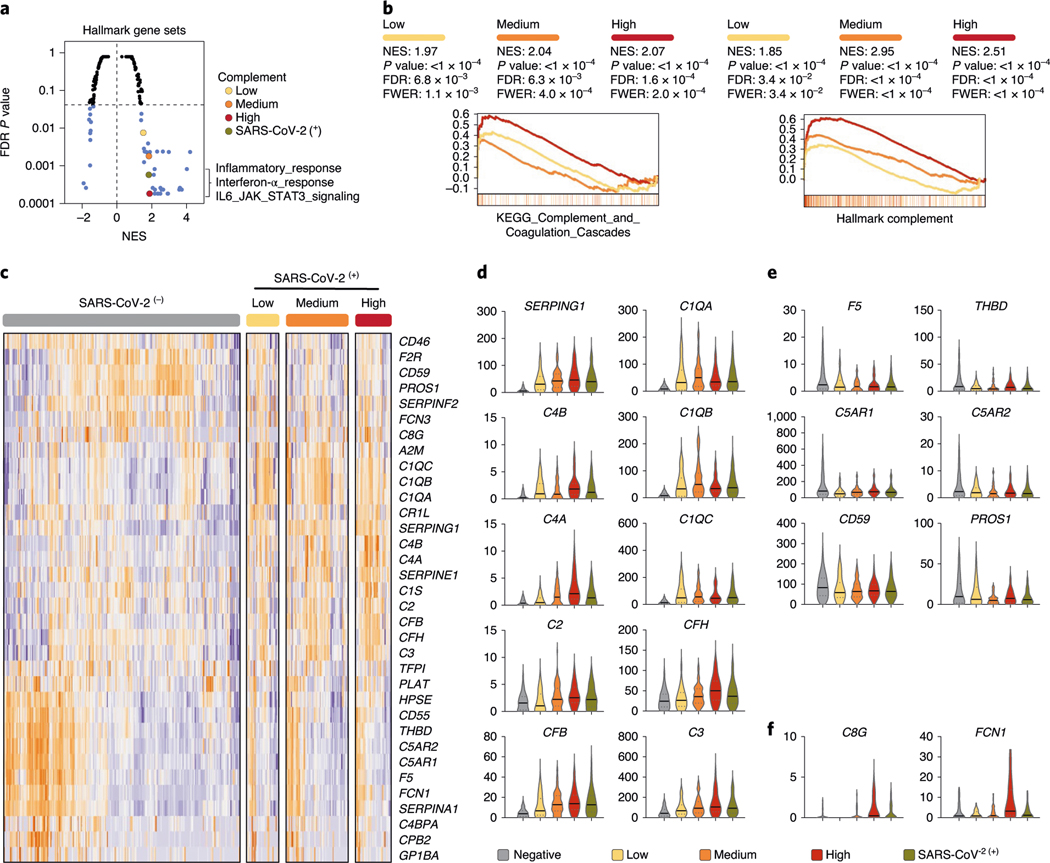
We leveraged whole-genome RNA sequencing (RNA-seq) profiles to identify differentially regulated genes and pathways in 650 NP swabs from control and SARS-CoV-2-infected patients who presented to Weill-Cornell Medical Center. Gene set enrichment analysis (GSEA) of Hallmark gene sets found that SARS-CoV-2 infection (as defined by presence of SARS-CoV-2 RNA and stratified into ‘positive’, ‘low’, ‘medium’ or ‘high’ based on viral load; see Methods) induces genes related to pathways with known immune modulatory functions (Fig. 2a). Moreover, among the most enriched gene sets, SARS-CoV-2 infection induces robust activation of the complement cascade (false discovery rate (FDR) P < 0.001), with increasing enrichment and significance with viral load (FDR P < 0.0001). We extended the analysis to include all complement- and coagulation-associated gene sets in MsigDB and identified ‘KEGG_Complement_and_Coagulation_Cascades’, ‘GO_Coagulation’ and ‘Reactome_initial_triggering_of_complement’ to be enriched in expression profiles of SARS-CoV-2-infected samples (Q < 0.05; representative GSEA profiles are shown in Fig. 2b and a full list of enriched pathways and gene sets can be found at https://covidgenes.weill.cornell.edu/). The pathway-level transcriptional regulation induced by SARS-CoV-2 identified by GSEA is also observed at the individual gene level for upregulated and downregulated transcripts as well as those that are particularly upregulated in the context of high viral load (Fig. 2c–f). Taken together, the data demonstrate that in addition to immune factors such as type I interferons and dysregulation of interleukin (IL)-6-dependent inflammatory responses, which have been linked to poor clinical outcome11, transcriptional control of complement and coagulation cascades is a feature of SARS-CoV-2 infection.
Fig. 2 |. SARS-CoV-2 infection engages robust transcriptional regulation of complement and coagulation cascades.
a, GSEA of Hallmark gene sets was applied to RNA-seq profiles of NP swabs from 650 control and SARS-CoV-2-infected patients stratified by SARS-CoV-2 positive (green) or low (yellow), medium (orange), high (red) viral load (significantly enriched gene sets highlighted in blue). b, Leading edge enrichment plots from GSEA analysis of MsigDB-wide gene sets are shown for Hallmark_Complement and KEGG_Complement_and_Coagulation_Cascade gene sets with SARS-CoV-2 stratification indicated by color. c, Hierarchical clustering of z score normalized mRNA profiles of complement and coagulation components that undergo significant (FDR corrected P < 0.01) transcriptional regulation in response to SARS-CoV-2 infection (cold and hot color scale reflects downregulated or upregulated expression, respectively). d–f, Violin plots indicating median and quartiles as well as minima and maxima bounds (TPM, transcripts per million, shown on y axis) of highlighted differentially regulated genes are shown for upregulated (d), downregulated (e) or particularly upregulated expression in the context of high viral load (f). Normalized enrichment scores (NES) and FDR-corrected P values are shown. Two-tailed Mann–Whitney U-test P values are reported.
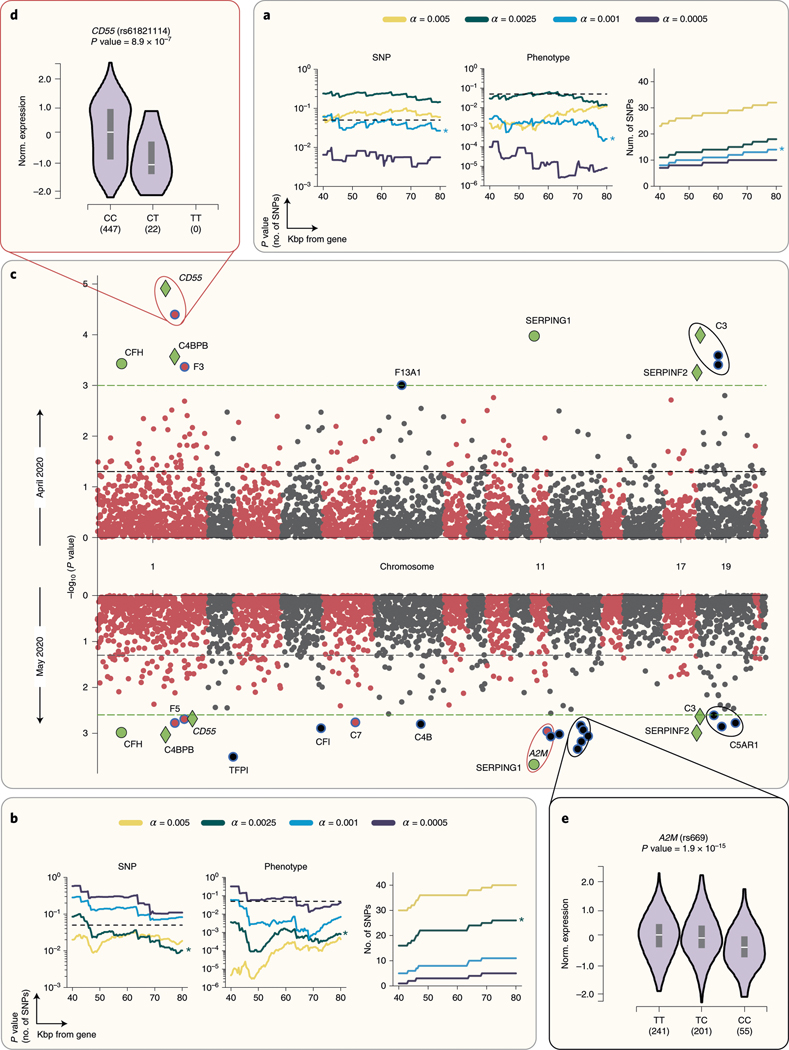
Dysfunction of complement or coagulation cascades can result from acquired dysregulation, genetically encoded variants or both. We conducted a candidate-driven study to evaluate whether genetic variation within a 60-Kb window around 102 genes with known roles in regulating complement or coagulation cascades (2,888 genetic variants fulfill this criteria of the 805,426 profiled in the UK Biobank) is associated with poor SARS-CoV-2 clinical outcome (results that follow are robust to varying window size between 40–80Kb, Extended Data Fig. 2 and Fig. 3a,b; Methods). Single-nucleotide polymorphisms (SNPs) with minor allele frequency (MAF) below 1% were excluded and an empirical permutation analysis to set the study-wide significance alpha (α) thresholds for each analysis described below was used (Fig. 3 and Extended Data Figs. 2–7; Methods). The initial analysis, applied to the April 2020 UK Biobank data release10,13 (excluding third-degree and above relatedness and without aneuploidy, resulted in 388 positive and 332 positive and hospitalized patients) identified 11 loci representing seven genes with study-wide significance (α = 0.001; Fig. 3c and Extended Data Fig. 2). Among these, and proximal to coagulation factor III (F3), is variant rs72729504, which we find to be associated with increased risk of adverse clinical outcome associated with SARS-CoV-2 infection (odds ratio (OR) 1.93). Mutations in F3 have the strongest association with fibrin fragment D-dimer levels, the most widely used clinical marker of activated blood coagulation14. Importantly, increased D-dimer levels were recently reported to correlate with poor clinical outcome in SARS-CoV-2-infected patients11. Though lacking in power to determine statistical significance, we find that rs12029080, the lead common variant identified to be associated with increased D-dimer levels, is also associated with increased COVID-19 severity (Extended Data Fig. 2). So, while effect sizes are modest and a functional role of rs72729504 remains to be elucidated, our observations suggest that this locus may represent a genetic marker of SARS-CoV-2 disease outcomes.
Fig. 3 |. Targeted genetic association study identifies SNPs in complement and coagulation pathway components associated with clinical outcome of SARS-CoV-2 infection.
a,b, P values from a negative binomial distribution fit to permutation of SNPs sampled (left) and case–control phenotypes (center) generated under the null hypothesis are shown for the April 2020 (a) or May 2020 (b) cohort (α and distance pairs as indicated; for more information see Methods). Also shown are the number of hits that pass the corresponding α study-wide significance threshold by distance (right) for April 2020 (a) or May 2020 (b) cohorts. c, Manhattan plots of 2,888 variants within 60 kb of complement and coagulation pathway genes for analyses using the April 2020 cohort (top) and May 2020 cohort (bottom). Study-wide significance threshold shown as dashed green lines, nominal significance threshold is shown as black dashed line, and SNP colors alternate by chromosome. Significant SNPs are shown as colored markers and annotated with the nearest gene by base-pair distance. SNPs shown in green are study-wide significant in both April 2020 and May 2020. SNPs shown as diamonds are also study-wide significant in haplotype-based analysis (see Methods). Logistic regression was used to assess statistical significance; multiple hypothesis testing was controlled using an empirical permutation analysis to set a study-wide α. eQTLs are further highlighted in d and e. d, eQTL relationship for rs61821114 and CD55 in thyroid19. The T allele of rs61821114 is associated with significantly lower expression of CD55. e, eQTL relationship for rs669 and A2M19. The C allele of rs669 is associated with significantly lower expression of A2M in 17 tissues, including the esophageal mucosa (shown) and lung. Box plot inlays show median, 25th and 75th percentiles in each group. eQTL-associated P values were calculated as described previously and show minima and maxima bounds16.
The analysis also identified that four variants previously reported to be associated with AMD (rs45574833, rs61821114, rs61821041 and rs12064775)15 predispose carriers to hospitalization following SARS-CoV-2 infection (OR, 2.13–2.65; Extended Data Fig. 2). A fifth variant, rs2230199, which maps to complement C3 (a gene shown to be linked to AMD in an independent genome-wide association study (GWAS)) has not been associated with increased AMD risk in the UK population. The three SNPs that map to C3 (rs1047286, rs2230203 and rs2230199) each seem to confer some protection associated with SARS-CoV-2 infection (OR, 0.66–0.68). Two of the identified variants (rs61821114 and rs61821041) map to eQTLs associated with complement decay-accelerating factor (CD55)16. CD55 accelerates the decay of complement proteins, thereby disrupting the cascade and preventing immune-mediated damage5. These eQTLs result in decreased expression of CD55 (Fig. 3d), thereby relieving the restraining function of this protein. In agreement, we observed that these variants are associated with increased risk of adverse clinical outcome following SARS-CoV-2 infection (OR, 2.34–2.4).
Genetic association studies performed on relatively small cohorts can be prone to false positives. While we implemented permutation analyses to empirically determine statistical significance thresholds (see Methods), we also repeated the analysis using updated UK Biobank data released in May 2020 (651 SARS-CoV-2-positive and 500 positive and hospitalized patients). The analysis recapitulated 6 of the 11 findings from April 2020 and identified 16 additional loci with study-wide significance (α = 0.0025, Extended Data Fig. 2 and Fig. 3c). The scan revealed five variants proximal to α-2-macroglobulin (A2M), a regulator of fibrin clot formation and inflammatory cascades17. rs10842898, rs669 and rs4883215 are eQTLs associated with significant downregulation of A2M (and concomitant upregulation of A2M-AS1, the antisense RNA of A2M; data available on https://gtextportal.org) in multiple tissues, including mucosa of the esophagus (P value = 1.9 × 10⁻¹⁵; Fig. 3e). In addition, rs10842898 and rs669 are sQTLs for mannose-6-phosphate receptor (M6PR) a P-type lectin that regulates lysosomal cargo loading and participates in cellular responses to wound healing, cell growth and viral infection18, suggesting that these SNPs may contribute to complex regulation of transcripts with immunological and antiviral roles.
Analysis of 936 SNPs in haplotype blocks (Extended Data Fig. 2; see Methods) resulted in 16 study-wide significant SNPs (α = 0.01, Extended Data Fig. 8) using the April 2020 cohort, of which 8 repeated at study-wide significance (α = 0.0075) using the May 2020 dataset. These include rs45574833, a missense variant in C4BPA, which negatively regulates the classical complement pathway19. We also identified a link between rs731034 (an eQTL in collectin sub-family member 11; COLEC11) and poor clinical outcome in both April 2020 (OR, 1.27) and May 2020 (OR, 1.33) cohorts. COLEC11 binds carbohydrate antigens on microorganisms, including viruses, facilitating their recognition and removal. This eQTL results in significant upregulation of COLEC11 across multiple tissues including lung (P value = 1 × 10⁻¹¹) and suggests that sugar moieties on viral proteins may serve as antigenic targets of immunological responses to SARS-CoV-2 infection. Though experimental validation and functional interrogation is required to elucidate the precise pathophysiology, taken together, the observations point to genetic variation in complement and coagulation components as contributing factors in SARS-CoV-2-mediated disease.
In summary, we present evidence that complement and coagulatory functions may play a role in SARS-CoV-2 infection outcome. We found that AMD and coagulatory dysfunctions predispose patients to poor clinical outcomes following SARS-CoV-2 infection and, though their low incidence rates invite further investigation, complement deficiencies appear to be protective. Nevertheless, in an orthogonal analysis of transcriptional responses to infection, we demonstrate that SARS-CoV-2 engages robust activation of complement and coagulation cascades. Moreover, our candidate-driven analysis of genetic variation and severe SARS-CoV-2 disease yielded putative loci including missense, eQTL and sQTL variants of critical regulators of the complement and coagulation cascades. While the results appear to be, at least functionally, consistent with a recent GWAS that identified A/B blood types as risk factors for COVID-19 (ref. 20) (A and B blood groups have been associated with increased risk of coagulopathies21–23), their interpretation must be performed with caution. However, pathology associated with dysregulation and genetic variation in complement and coagulation pathways is not without precedent and has been associated with dengue virus infection, where it is correlated with disease severity and mirrors that of acute SARS-CoV-2 disease24,25, suggesting that complement and coagulatory disfunctions may represent risk factors for a broad range of pathogens.
Site-specific clinical care decisions, ancestral homogeneity, population stratification and socioeconomic status of affected populations can all impact the findings, particularly when limited by sample size. Similarly, retrospective studies have notable limitations in data completeness, selection biases and methods of data capture. So, claims on causality cannot be made, nor can we definitively rule out other clinical factors as possible drivers of disease. Still, our findings highlight the value of combining molecular information from virus protein structure–function analysis with orthogonal clinical data analysis to reveal determinants and predictors of immunity, susceptibility and clinical outcome associated with infection. Such frameworks can help refine and power large-scale genomics efforts based on informed biological and clinical conjectures. While identification of CoV-encoded structural mimics guided the clinical studies, a molecular link between those observations and the findings presented herein remains to be elucidated. Nevertheless, the observations advance our understanding of how SARS-CoV-2 infection leads to disease and can help explain variability in clinical outcomes. Among the implications, the data warrant heightened public health awareness for the most vulnerable individuals and further investigation into an existing menu of complement and coagulation targeting therapies that were recently shown to be beneficial in a small cohort of patients with SARS-CoV-2 infection26,27.
Methods
Ethics and data governance approval.
The study is approved by the Columbia University Irving Medical Center Institutional Review Board (IRB) no. AAAL0601 and the requirement for informed consent was waived. A data request associated with this protocol was submitted to the Tri-Institutional Request Assessment Committee of New York-Presbyterian/Columbia and Cornell and approved. The research on the UK Biobank data was conducted using the UK Biobank Resource under application no. 41039. The transcriptomics analysis samples were collected and processed through the Weill Cornell Medicine IRB protocol 19-11021069.
Retrospective clinical study.
Cohort and study description.
In this observational cohort study, we used a data warehouse derived from EHRs from 11,116 patients treated at New York-Presbyterian/Columbia University Irving Medical Center for suspected cases of SARS-CoV-2 infection. For these patients we collected contemporary data from their current encounter (the encounter associated with their suspected SARS-CoV-2 infection) as well as historical data, if available, from their previous encounters. Contemporary data (collected between 1 February 2020 and 12 April 2020) included insurance billing information, laboratory measurements, procedures and SARS-CoV-2 diagnostic test results. These data were derived from the data warehouse tables in Epic. Overall, 6,927 patients have historical data (data collected before 24 September 2019) available from an Observational Medical Outcomes Partnership (OMOP) v.5 instance stored using MySQL, which included all of the standard tables for recording condition, procedure, medication and measurement data (among others). Of these, we used insurance billing information from the condition occurrence table and demographics from the person table. See Preparation of data for modeling for further details on data preparation.
We used contemporary data to define inclusion criteria and outcomes (requiring mechanical respiration and mortality) and used historical data to define patient comorbidities. We defined three hypothesized comorbidity covariates: macular degeneration, CD disorders and disorders of coagulation. We used historical data to define comorbidities, age and sex. We did not include race and ethnicity data in the modeling as we have previously found issues with data quality28. The race/ethnicity data that we had is included in the tables for reference. We also modeled other comorbidities previously associated with morbidity and mortality (Zhou et al.11 and others), including history of cardiovascular disease, hypertension, obesity, and diabetes (Table 1 and Extended Data Fig. 1), all derived from the historical data. Coded covariate definitions, as well as lists of which diagnosis codes are most common in each group, are available in the Extended Data and methods. We used established institutional procedures and an institutional clinical data warehouse to extract all data from the EHRs.
Defining patient outcomes.
Outcome definitions were defined by data derived from the EHRs between 1 February 2020 and 12 April 2020. Mortality is derived from a death note filed by a resident or primary provider that records the date and time of death. Intubation was used as an intermediary end point and is a proxy for a patient requiring mechanical respiration. We used note types that were developed for patients with SARS-CoV-2 infection to record that this procedure was completed. We validated outcome data derived from notes against the patient’s medical record using manual review.
Preparation of data for modeling.
We used MySQL and Python libraries (pymysql, pandas) to extract and prepare data for modeling. The code for data preparation is available in GitHub (https://github.com/tatonetti-lab/complementcovid) as a Jupyter Notebook entitled Data Setup. We began by creating a master list of patients with suspected CoV. These were patients that were either diagnosed with the disease, as indicated by an ICD10 code for SARS-CoV-2 infection, in their billing data or a patient that was tested for the presence of the virus using RT–PCR as indicated by a laboratory order for the test. We found 2,821 using the former method and 11,116 patients using the latter. We then extracted birth dates, death dates (if the patient had died or a null value otherwise) and sex codes (1 for female, 2 for male). Patients who had sex codes for nonbinary genders were excluded from our analysis. We then defined a ‘first diagnosis date’ for each patient as either their first diagnosis date (by billing code) or the first date that they tested positive for SARS-CoV-2, whichever came first. Next, we calculated each patient’s age at the time of the ‘first diagnosis date.’ Each of the outcomes and covariates were extracted from their respective tables as detailed in GitHub. Whenever possible, we used the highest-level ancestor code (from the structured vocabulary in OMOP) that represented the concept we wanted to model. We then used the concept ancestor tables to grab all the descendant codes. Note that diabetic kidney disease was considered for inclusion and so is represented in the data preparation script; however, it was never modeled. Cough is included as a covariate as a reference symptom for comparison. The last step in the preparation process was to compute the censor dates. To do so, we iterated through each patient in our master list and computed their time (in days) to intubation (if they required mechanical respiration) or death (if they died). If not, then the study end date (25 April 2020) was used as the patient’s censored time (in days). Finally, for any patients that were not positive for SARS-CoV-2, their time-to-event values were set to a null indicator to be dropped from the dataset later. Finally, the data were all combined in a pandas (v.1.0.3) dataframe and saved to disk as a pickle file for efficient loading.
Statistical model.
Our patient timelines may be censored as our study cohort included patients that were being treated at the time of analysis. We performed survival analysis on the intubation orders and death using a Cox proportional-hazards model and visualized the risk using Kaplan–Meier curves using the lifelines Python package (v.0.24.4). Error estimates on the Kaplan–Meier curves were estimated using Greenwood’s exponential formula29. We fitted both univariate models and model fit on the covariate, age and sex and used log-likelihood to assess significance. We reported Cox proportional hazards coefficients and their 95% confidence intervals (Table 1). We modeled whether or not a patient had macular degeneration, a complement deficiency disorder or a coagulation disorder as binary variables (1 = yes, 0 = no). Code definitions are provided in Extended Data Fig. 1. We also included other significant comorbidities suggested by previous studies, CAD, hypertension, T2D, obesity or smoking status as binary variables (1 = yes, 0 = no), sex as a binary variable (0 = female, 1 = male), age as a quantitative variable, older age over 65 years (note that age over 65 was used only for illustrative purposes and was not used in multivariate modeling; in the multivariate model, age as a quantitative variable was used) and outcome as a binary variable (1 = yes, 0 = no). The outcome of interest was coded as 0 until the day it occurred (the date of the first intubation order following admission or the death date) or the date of analysis, whichever occurred first. Survival curves were generated for the indicated variables by setting all other variables to their respected averages within the training data. Note that we dropped patients who experienced the outcome before their initial diagnosis. This was either due to patients being hospitalized before infection (in the case of intubation) or errors in the coded data. We dropped 121 patients for intubation before infection and 12 patients for death. We also restricted the study to 90 d from the start date. One patient was removed for having an event outside of this range.
Covariate correlations.
Using the data prepared as discussed above, we computed pairwise statistical correlations between age and sex as well as history of macular degeneration, CD disorders, coagulation disorders, hypertension, T2D, obesity and CAD. We computed them using data from all suspected patients (tested both positive and negative) as well as only those patients who tested positive. We used Spearman’s rho and the Tanimoto coefficients (1 − Jaccard distance) as our measures of correlation. For the comparison using the Tanimoto coefficient we binarized age as greater than or equal to 65 years.
Statistical software.
We used Jupyter Notebooks (jupyter-client v.5.3.4 and jupyter-core v.4.6.1) running Python 3.7 and all fitted models using the Python lifelines package (v.0.24.4).
Transcriptomic analysis of NP swabs.
Sample collection and processing.
Patient specimens were collected with patients’ consent at New York Presbyterian Hospital and then processed for RT–PCR as described previously30. NP swab specimens were collected using the BD Universal Viral Transport Media system (Becton, Dickinson and Company) from symptomatic patients.
Extraction of viral RNA and RT–PCR detection.
Total viral RNA was extracted from deactivated samples using automated nucleic acid extraction on the QIAsymphony and the DSP Virus/Pathogen Mini kit (Qiagen). One-step reverse transcription to complementary DNA and real-time PCR amplification of viral targets, E (envelope) and S (spike) genes and internal control, was performed using the Rotor-Gene Q thermocycler (Qiagen).
Human transcriptome analysis.
RNA-seq reads that mapped unambiguously to the human reference genome via Kraken2 were used to detect transcriptional responses to SARS-CoV-2 infection as described previously30. Briefly, reads were trimmed with TrimGalore, aligned with STAR (v.2.6.1d) to the human reference build GRCh38 and the GENCODE v.33 transcriptome reference and gene expression was quantified using featureCounts, stringTie and salmon using the nf-core RNA-seq pipeline. Sample quality control was reported using fastqc, RSeQC, qualimap, dupradar, Preseq and MultiQC. Reads, as reported by featureCounts, were normalized using variance-stabilizing transform (vst) in DESeq2 package in R and DESeq2 was used to call differential expression with either positive cases versus negative, or viral load (high/medium/low/none) as reported by RT–PCR cycle threshold (Ct) values. TPMs were used to rank genes and perform GSEA as described previously31,32.
Reverse transcriptase, quantitative real-time PCR.
The presence of SARS-CoV-2 in clinical samples was determined by RT–PCR. Briefly, primers for the E (envelope) gene (which detects all members of the lineage B of β-CoVs) and the S (spike) gene (which specifically detect SARS-CoV-2). Samples were annotated using RT–PCR Ct value for SARS-CoV-2 primers as follows: Ct ≤ 18 were assigned as ‘high viral load’; Ct of 18–24 were assigned as ‘medium viral load’; and Ct of 24–40 were assigned as ‘low viral load’ stratifications; Ct > 40 was classified as negative (−).
Genetic analysis of UK Biobank.
Data source.
UK Biobank subjects that were of White British descent, in the UK Biobank principal component analysis calculations and therefore without third degree and above relatedness and without aneuploidy, were used in this study, totaling 337,147 subjects (181,032 females and 156,115 males)10. Of the nearly 500,000 participants, approximately 50,000 subjects were genotyped on the UK BiLEVE Array by Affymetrix, whereas the rest were genotyped using the Applied Biosystems UK Biobank Axiom Array, with over 800,000 markers using build GRCh37 (hg19). The arrays share 95% marker coverage. We extracted markers with a MAF > 0.005, INFO score > 0.3 and Hardy–Weinberg equilibrium test mid-P value >10–10 using PLINK2 (ref. 33). UK Biobank v.3 imputation combined the Haplotype Research Consortium with the UK10K haplotype resource using the software IMPUTE4 (UK Biobank white paper). Association analyses were performed using a logistic regression model with additive gene dosage and covariates including age at 2018, sex, first ten principal components (provided by the UK Biobank) and the genotyping array that the sample was carried out on. We determined the α threshold for study-wide significance using an empirical permutation analysis (see previously). We performed a study-wide association analysis comparing variants for subjects that were SARS-CoV-2 positive and required hospitalization against the entire population of 337,147 subjects
Targeted gene set definition.
The union of coagulation- and complement-related gene sets (with immunoglobulin genes removed) that are part of MsigDB was used to define the set of 102 genes used in this study. For each gene, we used the transcriptional start and stop site from the hg19 build of the human genome to define a catchment window of 80 kbp. From the 805,426 variants profiled in the UK Biobank genotyping data after quality control and quality control filters using PLINK2 (see above), 3,540 variants within the transcribed region of the genes of interest or within 80 kbp flanking the transcribed region, 2,888 are within 60 kbp, 2,292 are within 40 kbp and 936 are located in haplotype blocks with study genes.
Empirical permutation evaluation to set study-wide α thresholds.
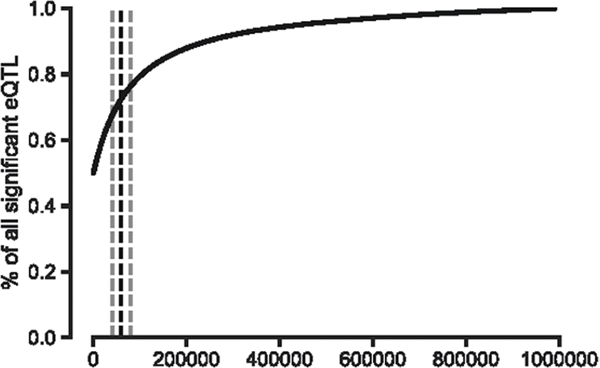
We used permutation to estimate null distributions of the number of hits expected at nine α thresholds varying from (5 × 10⁻⁵ to 0.05) and by varying the distance threshold from 40 kb to 80 kb. As shown previously, 80% of GWAS hits are within 60 kb of the nearest gene34. Further, as shown in Extended Data Fig. 9, we empirically determined that the majority of eQTLs (>70%) are within 60 kb of gene bodies. We performed two sets of permutation analyses: (1) permuted the initial set of genes on which the included variant loci were chosen and (2) permuted the case–control labels. We repeated each 100 times and used the resulting data to fit a negative binomial distribution as our estimate of the null hypothesis. Additionally, we evaluated each of the sampled SNP variant sets from (1) and compared their MAF distribution with the MAF distribution of the complement and coagulation set. We removed any sets that were significantly different (nominal p < 0.05) according to a Mann–Whitney U-test (52 of 100 sets were removed due to this criterion; see Extended Data Fig. 10). We found that the negative binomial fitted the data the best according to a goodness of fit test (Extended Data Figs. 2–7). We used this distribution to assess statistical significance for each combination of α and distance values. The result is two estimates of the significance for each α, distance (d) pair, and , from permutation analyses (1) and (2) above, respectively. For example:
where is the number of permutation loci with a P value under the threshold, α. The parameters r and p of the negative binomial represent the number of successes/failures and the probability of success, respectively. Both r and p are fitted using nonlinear least squares (the curve_fit function in scipy.optimize) on the count data from the permutation analyses for the given α and d. The P value is then calculated using the cumulative distribution function(CDF) of the fitted negative binomial distribution.
For the gene set permutation analysis (indicated by (2) above) we evaluated each of the 100 replicates to confirm that the MAF distribution was statistically indistinguishable from that of the complement and coagulation gene set variants. We did so by performing a Mann–Whitney U-test between the two distributions and excluded any replicates that showed a significant difference (nominal P < 0.05). Overall, 52 replicates were excluded because of this requirement. This MAF distribution analysis is not necessary for the case–control permutation analysis (shown in (2) above) as the loci are the same in each replicate and it is the case–control labels that are permuted.
Finally, to set the study-wide α for each study we chose the greatest threshold value that gave a P value of 0.05 or less for both permutation analysis methods:
Finally, this entire process was repeated for two cohorts of patients, (a) the initial COVID cohort released by the UK Biobank in April 2020 and (b) the updated COVID cohort released in May 2020. The chosen α for April was 0.001 and the chosen α for May was 0.0025. A data file of all of the distribution fit results and their resulting chi-squared goodness-of-fit statistics is available in the Extended Data materials.
We also performed the permutation significance estimation for the haplotype-derived SNP sets, although the distances for all loci chosen using that method are below the minimum in this analysis of 40 kb so those results are constant with regard to distance (Supplementary Fig. 3a,b). The chosen α for the linkage disequilibrium (LD)-derived SNP sets is 0.01 and 0.0075 for April and May, respectively.
Haplotype block-based selection of SNPs.
We identified haplotype blocks based on linkage disequilibrium within the UK Biobank data genotype data of the 337,147 subjects using PLINK1.9, where the lower 90% confidence interval is greater than 0.70 and the upper 90% confidence interval is at least 0.98. We identified blocks of interests and subsequently the variants within those blocks, as those that contain any part of the genes of interest as denoted by the transcriptional start and end sites from the hg19 build of the human genome. From the 805,426 variant profiles in the UK Biobank genotype data, we identified 7,281 variants within the genes of interest. After applying additional quality control filters using PLINK2, 936 variants remained for analysis.
Software.
We used PLINK v.2.00a2LM 64-bit Intel (26 August 2019) to run the genetic association analysis. We used PLINK v.1.90b6.10 64-bit (17 June 2019) to identify haplotype blocks based on linkage disequilibrium. We used Jupyter Notebooks (jupyter-client v.5.3.4 and jupyter-core v.4.6.1) running Python 3.7, numpy 1.18.1 and scipy 1.4.1 for the permutation analyses.
Reporting Summary.
Further information on research design is available in the Nature Research Reporting Summary linked to this article.
Data availability
Processed count matrices with de-identified RNA-seq data and a full panel of GSEA results are available at https://covidgenes.weill.cornell.edu/. Viewing and exploration is publicly accessible. Requests for additional materials can be made via email to the corresponding authors.
Code availability
All scripts used for data preparation and analysis are available from GitHub as a Jupyter Notebook entitled Data Setup (https://github.com/tatonetti-lab/complementcovid). Details on code execution is also provided.
Extended Data
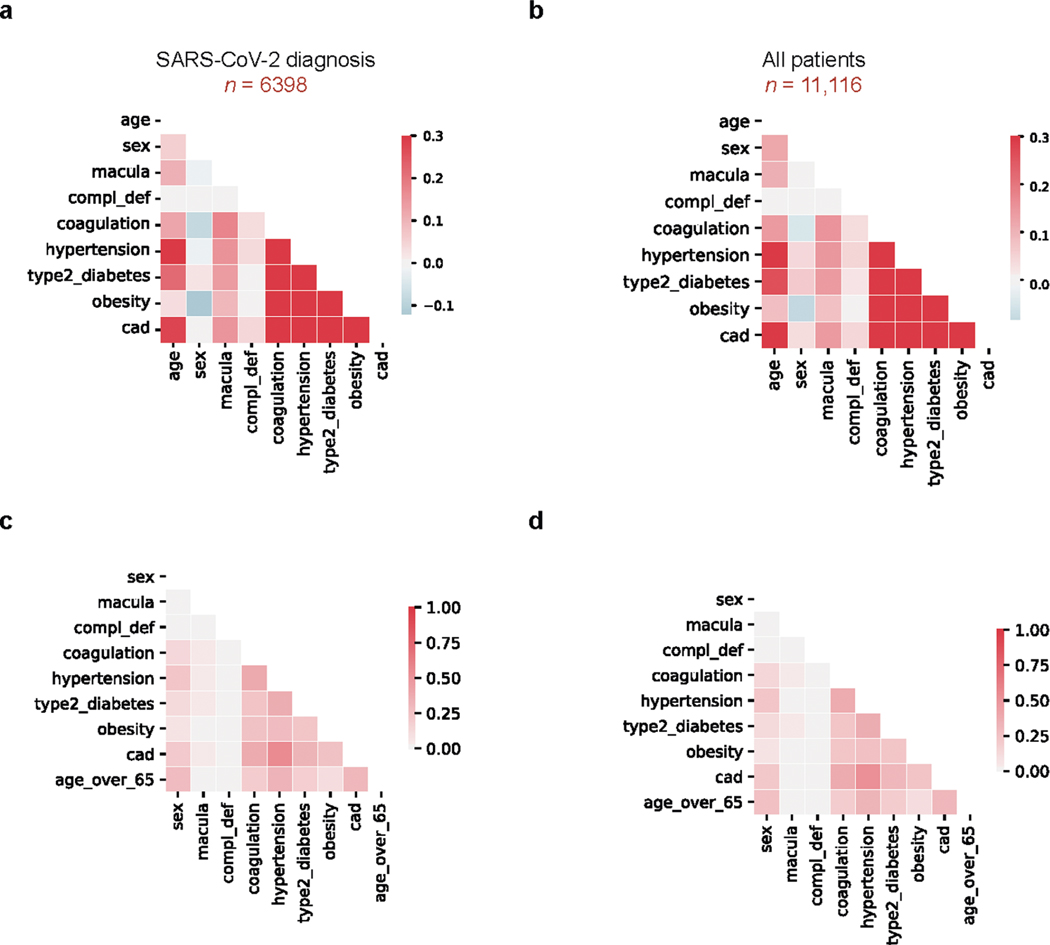
Extended Data Fig. 1 |. Covariate correlations in EHR clinical data.
a, Spearman correlation between modeled covariates in patients were diagnosed or tested positive for SARS-CoV-2: age, sex, macular degeneration (macula), complement deficiency disorders (CD), coagulation disorders (coagulation), hypertension, Type 2 Diabetes, obesity, and coronary artery disease (CAD). b, Spearman correlations, as in (a), for all patients (includes patients who tested negative for SARS-CoV-2). c, Tanimoto coefficients as in (a), for patients who tested positive for SARS-CoV-2 infection. Age was binarized as ‘Age over 65’ to compute the score. d, Tanimoto coefficients as in (c) for all patients.
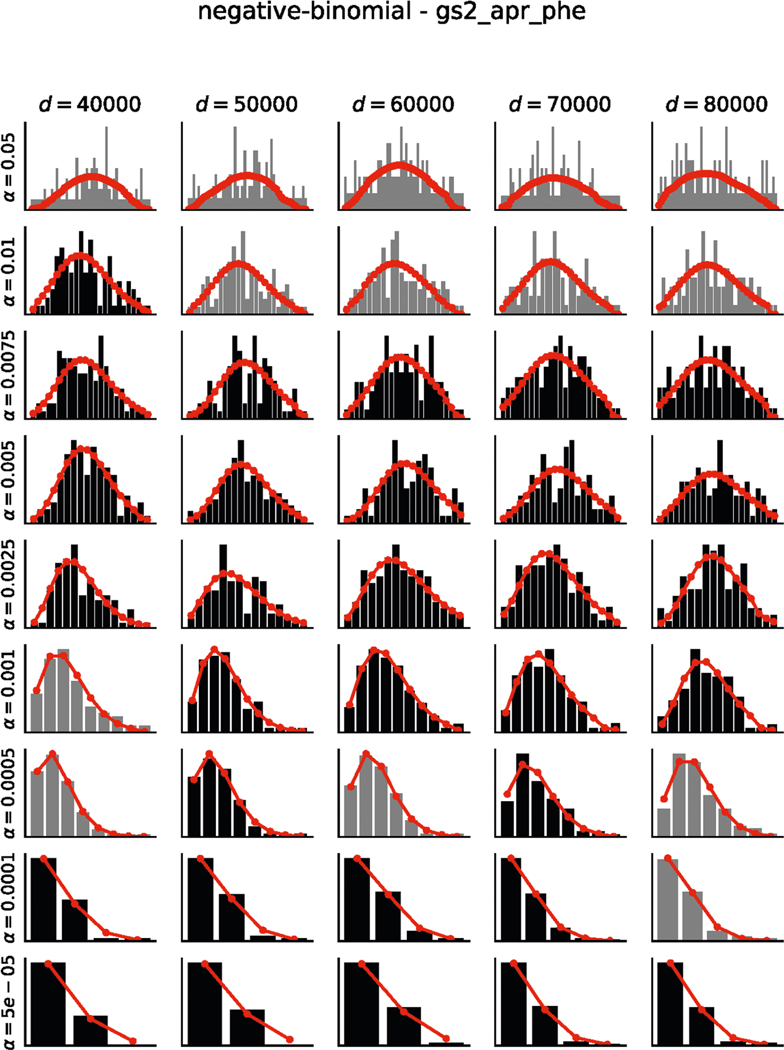
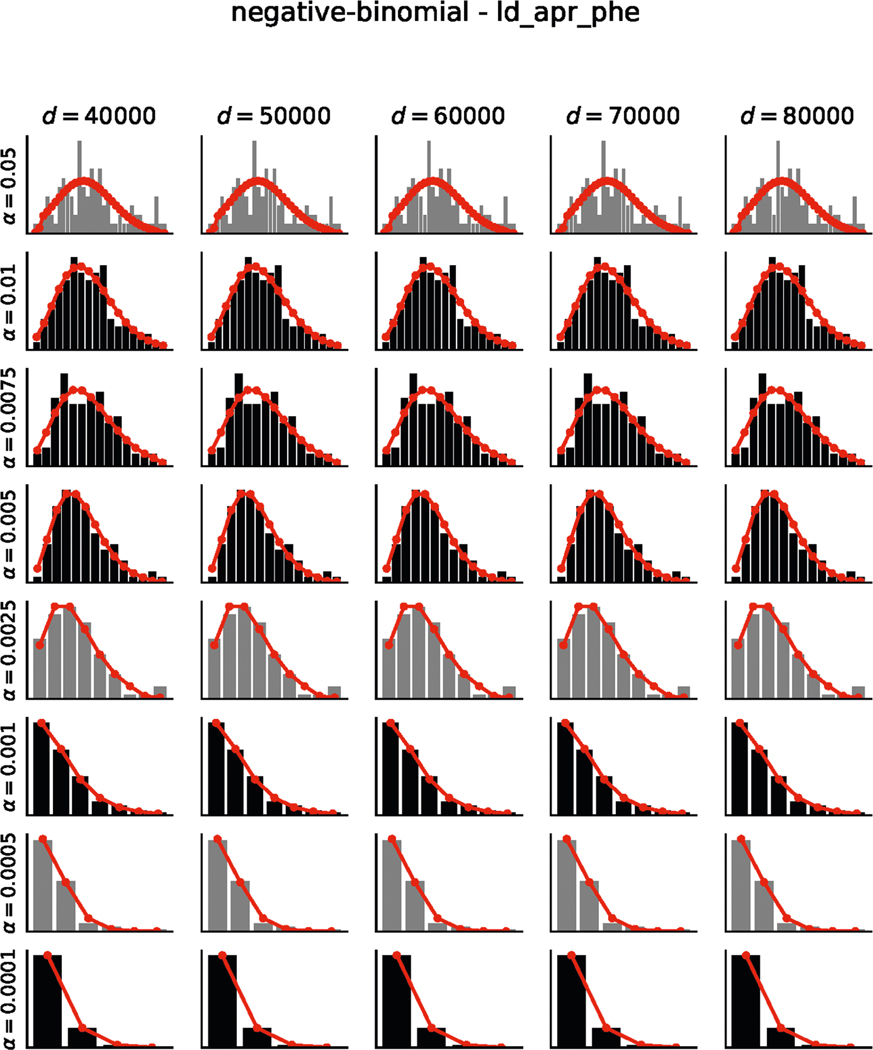
Extended Data Fig. 2 |. Results of permutation testing and fits to negative binomial distributions for April-2020 phenotype permutations.
Histograms indicate the number of permutations with X significant hits (black/grey bars). Negative binomial fits are shown in red (see Methods). Chi-squared goodness-of-fit tests were performed for each distribution. Distributions which passed the goodness-of-fit test (p > 0.05) are shown in black and those that failed (p ≤ 0.05) are shown in grey. Results are visualized for 5 distances (columns) and 9 alpha thresholds (rows). All fits are available as supplement data.
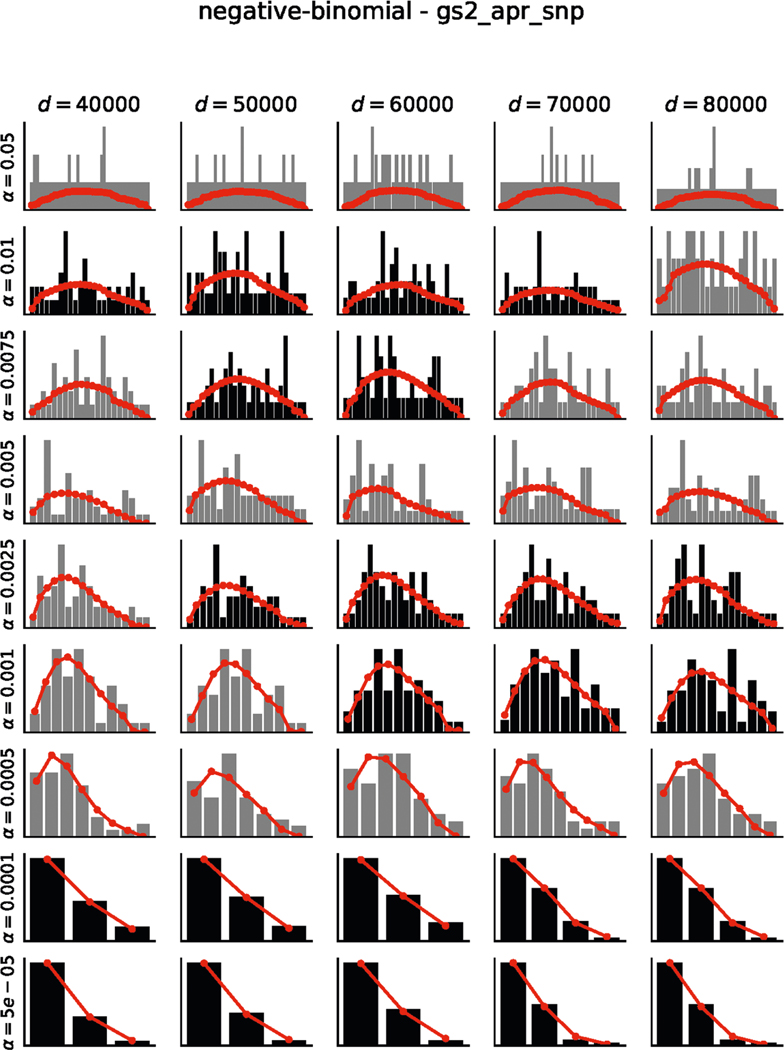
Extended Data Fig. 3 |. Results of permutation testing and fits to negative binomial distributions for April-2020 SNP permutations.
Histograms indicate the number of permutations with X significant hits (black/grey bars). Negative binomial fits are shown in red (see Methods). Chi-squared goodness-of-fit tests were performed for each distribution. Distributions which passed the goodness-of-fit test (p > 0.05) are shown in black and those that failed (p ≤ 0.05) are shown in grey. Results are visualized for 5 distances (columns) and 9 alpha thresholds (rows). All fits are available as supplement data.
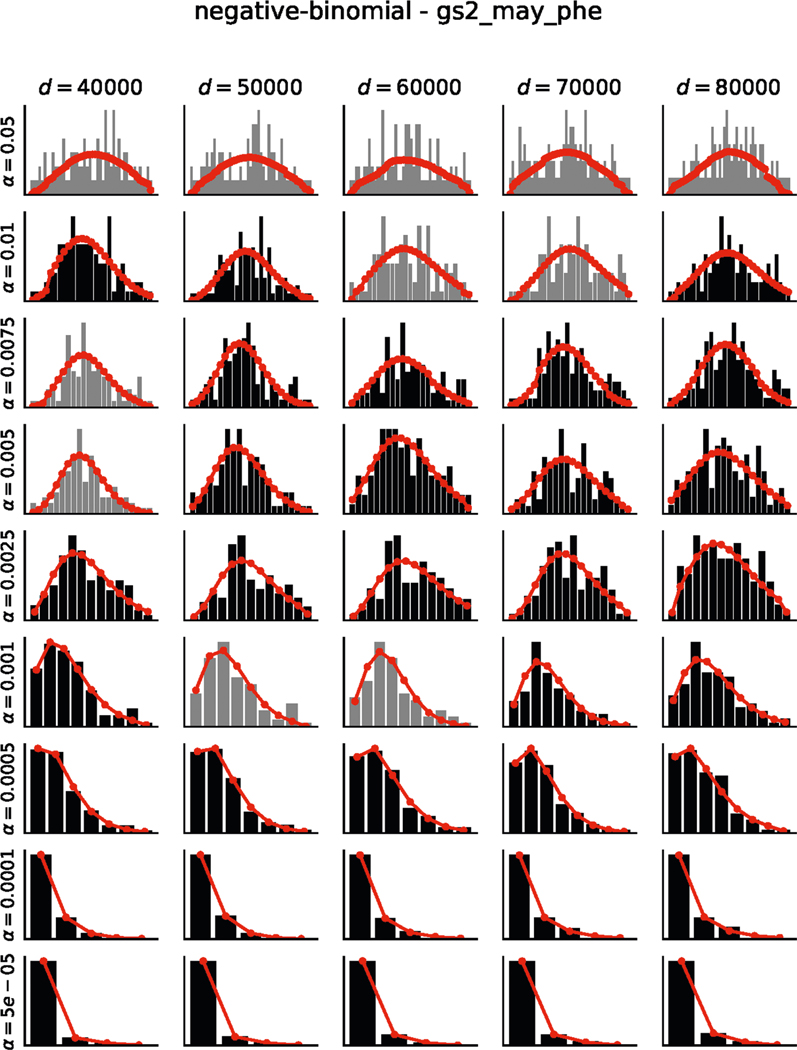
Extended Data Fig. 4 |. Results of permutation testing and fits to negative binomial distributions for May-2020 phenotype permutations.
Histograms indicate the number of permutations with X significant hits (black/grey bars). Negative binomial fits are shown in red (see Methods). Chi-squared goodness-of-fit tests were performed for each distribution. Distributions which passed the goodness-of-fit test (p > 0.05) are shown in black and those that failed (p ≤ 0.05) are shown in grey. Results are visualized for 5 distances (columns) and 9 alpha thresholds (rows). All fits are available as supplement data.
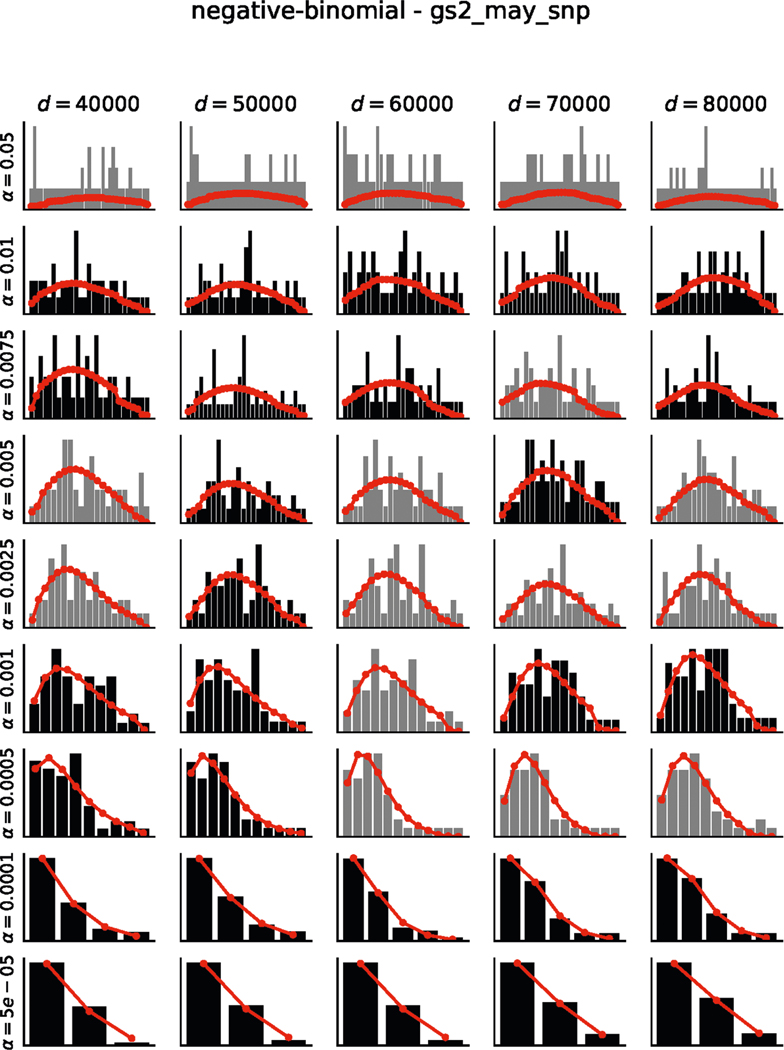
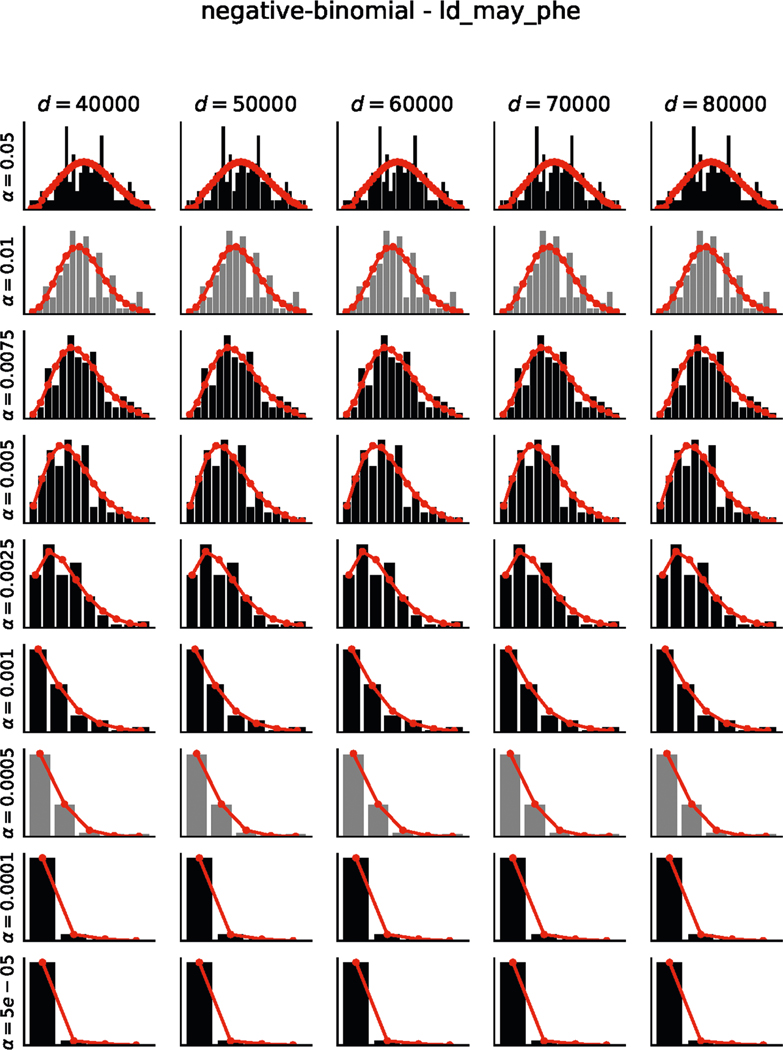
Extended Data Fig. 5 |. Results of permutation testing and fits to negative binomial distributions for May-2020 SNP permutations.
Histograms indicate the number of permutations with X significant hits (black/grey bars). Negative binomial fits are shown in red (see Methods). Chi-squared goodness-of-fit tests were performed for each distribution. Distributions which passed the goodness-of-fit test (p > 0.05) are shown in black and those that failed (p ≤ 0.05) are shown in grey. Results are visualized for 5 distances (columns) and 9 alpha thresholds (rows). All fits are available as supplement data.
Extended Data Fig. 6 |. Results of permutation testing and fits to negative binomial distributions for Haplotype SNPs-only April-2020 phenotype permutations.
Histograms indicate the number of permutations with X significant hits (black/grey bars). Negative binomial fits are shown in red (see Methods). Chi-squared goodness-of-fit tests were performed for each distribution. Distributions which passed the goodness-of-fit test (p > 0.05) are shown in black and those that failed (p ≤ 0.05) are shown in grey. Results are visualized for 5 distances (columns) and 9 alpha thresholds (rows). All fits are available as supplement data.
Extended Data Fig. 7 |. Results of permutation testing and fits to negative binomial distributions for Haplotype SNPs-only May-2020 phenotype permutations.
Histograms indicate the number of permutations with X significant hits (black/grey bars). Negative binomial fits are shown in red (see Methods). Chi-squared goodness-of-fit tests were performed for each distribution. Distributions which passed the goodness-of-fit test (p > 0.05) are shown in black and those that failed (p ≤ 0.05) are shown in grey. Results are visualized for 5 distances (columns) and 9 alpha thresholds (rows). All fits are available as supplement data.
Extended Data Fig. 8 |. P values from a Negative Binomial distribution fit to permutation of case:control phenotypes.
Generated under the null hypothesis are shown for the Haplotype SNPs-only analyses using the April-2020 (a) or May-2020 (b) cohort. α and distance pairs as indicated; for more information see Methods.
Extended Data Fig. 9 |. Percent of significant eQTLs within a given distance of the gene body.
Significant eQTLs were downloaded from the GTEx Portal website for Esophagus, Lung, and Heart tissues (9 tissues total) and used the provided significance thresholds to determine significance. Shown is the percent of significant eQTLs that are within X base pairs of their target gene aggregated over 9 tissues. Over 70% of significant eQTLs are within 60 Kb of their target gene. Black dashed line represents 60 Kb, grey lines represent 40 and 80 Kb.
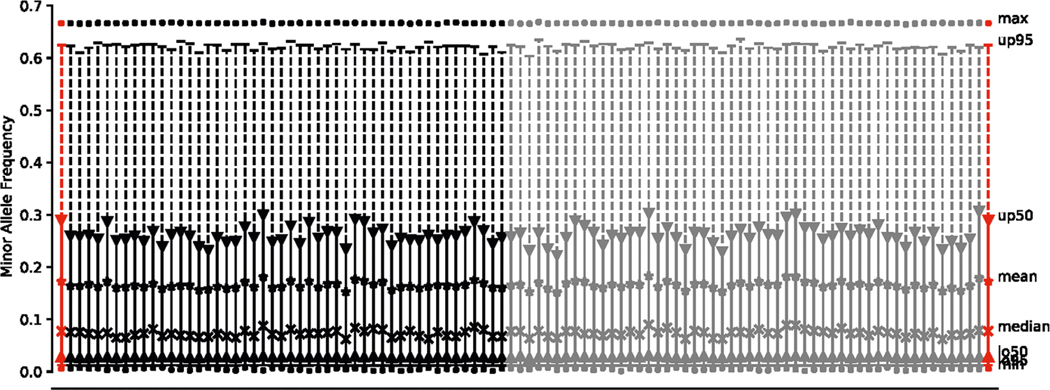
Extended Data Fig. 10 |. Comparison of MAF distributions across sampled SNP sets.
The medians, means, interquartile range, 95% confidence interval, minimum, and maximum are shown for each of the 100 samples of SNP sets (see Empirical Permutation Evaluation to set Study-wide Alpha Thresholds for details). Also shown are the same distribution statistics for the SNP set within 60Kb of complement and coagulation gene bodies (red). Each of the 100 sampled SNP sets MAF distributions were compared to the study SNP set and tested for differences using a two-sample Mann-Whitney U test. Those that were not significantly different (p > 0.05) are shown in black. Those that are significantly different (p ≤ 0.05) are shown in grey and were dropped from the analysis.
Supplementary Material
Acknowledgements
This work was funded by US National Institutes of Health grants 5R01GM109018, R21AI147201 and 5U54CA209997 to S.S., R35GM131905 to N.P.T., F30HL140946 to P.T. and equipment grants S10OD012351 and S10OD021764 to the Columbia University Department of Systems Biology. C.E.M. thanks the Scientific Computing Unit, XSEDE Supercomputing Resources, the Starr Cancer Consortium (I13-0052) and funding from the WorldQuant Foundation, the Pershing Square Sohn Cancer Research Alliance, NASA (NNX14AH50G, NNX17AB26G) and the National Institutes of Health (R21AI129851, R01MH117406, R01AI151059).
Footnotes
Online content
Any methods, additional references, Nature Research reporting summaries, source data, extended data, supplementary information, acknowledgements, peer review information; details of author contributions and competing interests; and statements of data and code availability are available at https://doi.org/10.1038/s41591-020-1021-2.
Competing interests
The authors declare no competing interests.
Additional information
Extended data is available for this paper at https://doi.org/10.1038/s41591-020-1021-2.
Supplementary information is available for this paper at https://doi.org/10.1038/s41591-020-1021-2.
Peer review information Joao, Monteiro was the primary editor on this article and managed its editorial process and peer review in collaboration with the rest of the editorial team.
References
- 1.Chen G. et al. Clinical and immunological features of severe and moderate coronavirus disease 2019. J. Clin. Invest 130, 2620–2629 (2020). [DOI] [PMC free article] [PubMed] [Google Scholar]
- 2.Moore BJB & June CH Cytokine release syndrome in severe COVID-19. Science 368, 473–474 (2020). [DOI] [PubMed] [Google Scholar]
- 3.Lasso G. et al. A structure-informed atlas of human-virus interactions. Cell 178, 1526–1541 (2019). [DOI] [PMC free article] [PubMed] [Google Scholar]
- 4.Lasso G, Honig B. & Shapira SD A sweep of earth’s virome reveals host-guided viral protein structural mimicry; with implications for human disease. Preprint at bioRxiv 10.1101/2020.06.18.159467 (2020). [DOI] [PMC free article] [PubMed] [Google Scholar]
- 5.Merle NS, Church SE, Fremeaux-Bacchi V. & Roumenina LT Complement system part I - molecular mechanisms of activation and regulation. Front. Immunol 6, 262 (2015). [DOI] [PMC free article] [PubMed] [Google Scholar]
- 6.Holers VM Complement and its receptors: new insights into human disease. Annu. Rev. Immunol 32, 433–459 (2014). [DOI] [PubMed] [Google Scholar]
- 7.Liszewski MK, Java A, Schramm EC & Atkinson JP Complement dysregulation and disease: Insights from contemporary genetics. Annu. Rev. Pathol 12, 25–52 (2017). [DOI] [PMC free article] [PubMed] [Google Scholar]
- 8.Wu J. & Sun X. Complement system and age-related macular degeneration: drugs and challenges. Drug Des. Devel. Ther 13, 2413–2425 (2019). [DOI] [PMC free article] [PubMed] [Google Scholar]
- 9.Ambati J, Atkinson JP & Gelfand BD Immunology of age-related macular degeneration. Nat. Rev. Immunol 13, 438–451 (2013). [DOI] [PMC free article] [PubMed] [Google Scholar]
- 10.Bycroft C. et al. The UK Biobank resource with deep phenotyping and genomic data. Nature 562, 203–209 (2018). [DOI] [PMC free article] [PubMed] [Google Scholar]
- 11.Zhou F. et al. Clinical course and risk factors for mortality of adult inpatients with COVID-19 in Wuhan, China: a retrospective cohort study. Lancet 395, 1054–1062 (2020). [DOI] [PMC free article] [PubMed] [Google Scholar]
- 12.Goeijenbier M. et al. Review: viral infections and mechanisms of thrombosis and bleeding. J. Med. Virol 84, 1680–1696 (2012). [DOI] [PMC free article] [PubMed] [Google Scholar]
- 13.Sudlow C. et al. UK biobank: an open access resource for identifying the causes of a wide range of complex diseases of middle and old age. PLoS Med. 12, e1001779 (2015). [DOI] [PMC free article] [PubMed] [Google Scholar]
- 14.Smith NL et al. Genetic predictors of fibrin D-dimer levels in healthy adults. Circulation 123, 1864–1872 (2011). [DOI] [PMC free article] [PubMed] [Google Scholar]
- 15.Han X. et al. Genome-wide meta-analysis identifies novel loci associated with age-related macular degeneration. J. Hum. Genet 65, 657–665 (2020). [DOI] [PubMed] [Google Scholar]
- 16.GTEx Consortium et al. Genetic effects on gene expression across human tissues. Nature 550, 204–213 (2017). [DOI] [PMC free article] [PubMed] [Google Scholar]
- 17.Rehman AA, Ahsan H. & Khan FH α-2-Macroglobulin: a physiological guardian. J. Cell. Physiol 228, 1665–1675 (2013). [DOI] [PubMed] [Google Scholar]
- 18.Gary-Bobo M, Nirde P, Jeanjean A, Morere A. & Garcia M. Mannose 6-phosphate receptor targeting and its applications in human diseases. Curr. Med. Chem 14, 2945–2953 (2007). [DOI] [PMC free article] [PubMed] [Google Scholar]
- 19.Ermert D. & Blom AM C4b-binding protein: the good, the bad and the deadly. Novel functions of an old friend. Immunol. Lett 169, 82–92 (2016). [DOI] [PubMed] [Google Scholar]
- 20.Ellinghaus D. et al. Genomewide association study of severe Covid-19 with respiratory failure. N. Engl. J. Med 10.1056/NEJMoa2020283 (2020). [DOI] [PMC free article] [PubMed] [Google Scholar]
- 21.Weisel JW & Litvinov RI Red blood cells: the forgotten player in hemostasis and thrombosis. J. Thromb. Haemost 17, 271–282 (2019). [DOI] [PMC free article] [PubMed] [Google Scholar]
- 22.Morange PE, Suchon P. & Tregouet DA Genetics of venous thrombosis: update in 2015. Thromb. Haemost 114, 910–919 (2015). [DOI] [PubMed] [Google Scholar]
- 23.Zoller B. Genetics of venous thromboembolism revised. Blood 134, 1568–1570 (2019). [DOI] [PMC free article] [PubMed] [Google Scholar]
- 24.Nascimento EJ et al. Alternative complement pathway deregulation is correlated with dengue severity. PLoS ONE 4, e6782 (2009). [DOI] [PMC free article] [PubMed] [Google Scholar]
- 25.Pastor AF et al. Complement factor H gene (CFH) polymorphisms C-257T, G257A and haplotypes are associated with protection against severe dengue phenotype, possible related with high CFH expression. Hum. Immunol 74, 1225–1230 (2013). [DOI] [PMC free article] [PubMed] [Google Scholar]
- 26.Risitano AM Complement as a target in COVID-19?. Nat. Rev. Immunol 20, 343–344 (2020). [DOI] [PMC free article] [PubMed] [Google Scholar]
- 27.Mastaglio S. et al. The first case of COVID-19 treated with the complement C3 inhibitor AMY-101. Clin. Immunol 215, 108450 (2020). [DOI] [PMC free article] [PubMed] [Google Scholar]
References
- 28.Polubriaginof FCG et al. Challenges with quality of race and ethnicity data in observational databases. J. Am. Med. Inf. Assoc 26, 730–736 (2019). [DOI] [PMC free article] [PubMed] [Google Scholar]
- 29.Hosmer DW, Lemeshow S. & May S. Applied Survival Analysis: Regression Modeling of Time-to-Event Data. 2nd edn, (Wiley-Interscience, 2008). [Google Scholar]
- 30.Butler DJ et al. Shotgun transcriptome and isothermal profiling of SARS-CoV-2 infection reveals unique host responses, viral diversification and drug interactions. Preprint at bioRxiv 10.1101/2020.04.20.048066 (2020). [DOI] [PMC free article] [PubMed] [Google Scholar]
- 31.Subramanian A. et al. Gene set enrichment analysis: a knowledge-based approach for interpreting genome-wide expression profiles. Proc. Natl Acad. Sci. USA 102, 15545–15550 (2005). [DOI] [PMC free article] [PubMed] [Google Scholar]
- 32.Mootha VK et al. PGC-1α-responsive genes involved in oxidative phosphorylation are coordinately downregulated in human diabetes. Nat. Genet 34, 267–273 (2003). [DOI] [PubMed] [Google Scholar]
- 33.Chang CC et al. Second-generation PLINK: rising to the challenge of larger and richer datasets. Gigascience 4, 7 (2015). [DOI] [PMC free article] [PubMed] [Google Scholar]
- 34.Brodie A, Azaria JR & Ofran Y. How far from the SNP may the causative genes be? Nucleic Acids Res. 44, 6046–6054 (2016). [DOI] [PMC free article] [PubMed] [Google Scholar]
Associated Data
This section collects any data citations, data availability statements, or supplementary materials included in this article.
Supplementary Materials
Data Availability Statement
Processed count matrices with de-identified RNA-seq data and a full panel of GSEA results are available at https://covidgenes.weill.cornell.edu/. Viewing and exploration is publicly accessible. Requests for additional materials can be made via email to the corresponding authors.


