Abstract
Metabolic fitness of T cells is crucial for immune responses against infections and tumorigenesis. Both the T cell receptor (TCR) signal and environmental cues contribute to the induction of T cell metabolic reprogramming, but the underlying mechanism is incompletely understood. Here, we identified the E3 ubiquitin ligase Peli1 as an important regulator of T cell metabolism and antitumor immunity. Peli1 ablation profoundly promotes tumor rejection, associated with increased tumor‐infiltrating CD4 and CD8 T cells. The Peli1‐deficient T cells display markedly stronger metabolic activities, particularly glycolysis, than wild‐type T cells. Peli1 controls the activation of a metabolic kinase, mTORC1, stimulated by both the TCR signal and growth factors, and this function of Peli1 is mediated through regulation of the mTORC1‐inhibitory proteins, TSC1 and TSC2. Peli1 mediates non‐degradative ubiquitination of TSC1, thereby promoting TSC1‐TSC2 dimerization and TSC2 stabilization. These results establish Peli1 as a novel regulator of mTORC1 and downstream mTORC1‐mediated actions on T cell metabolism and antitumor immunity.
Keywords: mTORC1, Peli1, T cell metabolism; antitumor immunity, ubiquitination
Subject Categories: Immunology; Metabolism; Post-translational Modifications, Proteolysis & Proteomics
K63‐linked ubiquitination of TSC1 by the Peli E3 inhibits mTORC1 signaling and metabolic reprogramming of T cells.

Introduction
T cells form a central component of the immune system and are required for host defense against infections and tumorigenesis (Durgeau, Virk et al, 2018). Naïve T cells become activated upon detection of an antigen by the T cell receptor (TCR) and ligation of the costimulatory molecule CD28 (Smith‐Garvin, Koretzky et al, 2009; Pollizzi & Powell, 2014). The activated T cells undergo proliferation and subsequently differentiate into effector T cells that participate in the destruction of pathogens or tumor cells. T cell activation involves cascades of signaling events that lead to activation of transcription factors, including NF‐κB, NFAT, and AP1 families, and induction of genes involved in T cell proliferation and differentiation (Smith‐Garvin et al, 2009; Pollizzi & Powell, 2014). In addition, T cell activation is associated with metabolic reprogramming, which is vital for the proliferation, differentiation, and effector functions of T cells (Aagaard, Lukas et al, 1995; Maciver, Michalek et al, 2013). Resting T cells rely on oxidative phosphorylation (OXPHOS) for energy generation, but activated T cells shift the cellular metabolism toward aerobic glycolysis and also increase the level of OXPHOS (Almeida, Lochner et al, 2016).
In tumor microenvironment, T cell metabolism is typically compromised due to nutrient limitation and inhibition by tumor‐derived waste products, which is associated with T cell hypofunction (Chang, Curtis et al, 2013; Buck, Sowell et al, 2017; Rivadeneira & Delgoffe, 2018; Li, Wenes et al, 2019). The molecular mechanism that regulates metabolic fitness of T cells is incompletely understood, although the PI3 kinase (PI3K) signaling pathway is known to play an important role (Pollizzi & Powell, 2014). Upon activation by TCR/CD28 costimulation, PI3K activates the downstream kinase AKT, which in turn promotes glucose uptake by inducing translocation of glucose transporter 1 (Glut1) to the plasma membrane (Maciver et al, 2013). In addition, AKT activates the metabolic kinase mammalian target of rapamycin complex 1 (mTORC1) through phosphorylation of the mTORC1 inhibitor TSC2(Chi, 2012). Upon activation, mTORC1 activates two major glycolysis‐regulatory transcription factors, c‐Myc and HIF1α, thereby inducing the expression of genes encoding various glycolytic enzymes (Lunt & Vander Heiden, 2011; Zeng & Chi, 2014). The mechanism that negatively regulates TCR/CD28‐stimulated metabolic pathway is less well understood.
Peli1 (also called Pellino 1) is a member of the Pellino family of E3 ubiquitin ligases known to interact with different E2 ubiquitin‐conjugating enzymes and conjugate both K63‐ and K48‐linked polyubiquitin chains (Jin, Chang et al, 2012; Moynagh, 2014). While Pellino family members were initially discovered as signaling mediators of IL‐1 receptor (IL‐1R) and Toll‐like receptors (TLRs) in innate immune cells, recent work has demonstrated a crucial role for Peli1 in regulating the activation and tolerance of T cells (Chang, Jin et al, 2011). Peli1‐deficient mice display aberrant T cell activation and autoimmune symptoms at the age of 6 months or older, although younger mice do not display obvious autoimmune diseases (Chang et al, 2011). In the present study, we demonstrate that Peli1 has a T cell‐intrinsic role in regulating antitumor CD8 T cell responses. Peli1 deletion greatly promotes antitumor immunity in different mouse tumor models. Peli1 negatively regulates the metabolic reprogramming of CD8 T cells by controlling the activation of mTORC1. Our data suggest that Peli1 mediates K63 ubiquitination of the mTORC1 inhibitor TSC1, which in turn facilitates the binding of TSC1 to its partner protein TSC2. Peli1 deficiency impairs TSC1 K63 ubiquitination and attenuates TSC1/TSC2 dimerization, thereby sensitizing these mTORC1 inhibitors for degradation.
Results
Peli1 deficiency promotes antitumor immunity
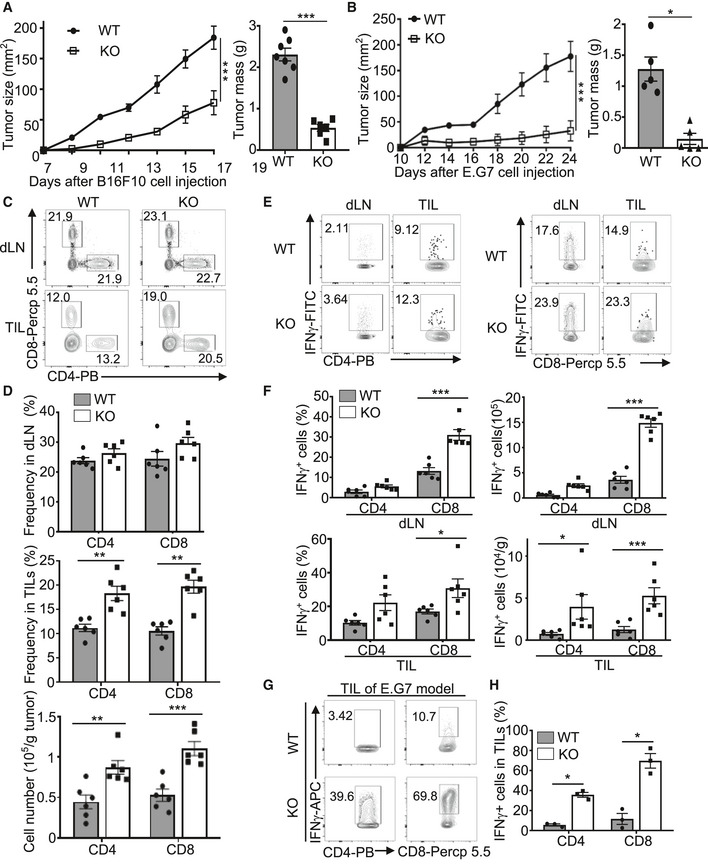
For studying the in vivo function of Peli1, we employed both germline Peli1 knockout (KO) mice and conditional KO mice (Appendix Fig S1). The Peli1 conditional KO mice were generated by crossing Peli1‐flox mice with different types of Cre mice (Appendix Fig S1). To determine the role of Peli1 in regulating antitumor immunity, we challenged the Peli1‐KO and wild‐type control mice with B16F10 melanoma cells, a poorly immunogenic tumor model extensively used in cancer immunotherapy studies (Wang, Saffold et al, 1998). Remarkably, tumor growth was profoundly reduced in the Peli1‐deficient mice as compared with the wild‐type control mice (Fig 1A). Similar results were obtained when the mice were challenged with B16 melanoma cells expressing the surrogate antigen chicken ovalbumin (B16‐OVA) or the EG7 thymoma tumor cells (Fig 1B and Appendix Fig S2).
Figure 1. Peli1 deficiency promotes antitumor immunity.
-
A, BTumor growth curve (left) and summary of end‐point tumor masses (right) of 6‐8 week‐old wild‐type (WT) and Peli1‐KO (KO) mice inoculated s.c. with B16F10 (A; WT, n = 7; KO, n = 6) or E.G7 (B; WT, n = 5; KO, n = 5) tumor cells.
-
C, DFlow cytometry analysis of CD4+ and CD8+ T cells in CD45.2+ TILs and dLN cells from B16F10 tumor‐bearing wild‐type and Peli1‐KO mice, presented as a representative plot (C) and summary graph based on multiple mice (D; WT, n = 6; KO, n = 6).
-
E, FFlow cytometry analysis of IFNγ‐producing CD4+ and CD8+ T cells in TILs, and dLN cells of B16F10 tumor‐bearing (day 19) wild‐type and Peli1‐KO mice, presented as a representative plot (E) and summary graph (F). (WT, n = 6; KO, n = 6).
-
G, HFlow cytometry analysis of IFNγ+CD8+ T cells in TILs of E.G7 tumor‐bearing (day 24) wild‐type and Peli1‐KO mice, presented as a representative plot (G) and summary graph (H). (WT, n = 3; KO, n = 3)
Data information: Data are representative of 3 independent experiments, and bar graphs are presented as mean ± SEM with P values being determined by a two‐way ANOVA with Bonferroni correction (left panel of A and B) and two‐tailed unpaired Student’s t‐test (right panel of A and B; D, F, H). *P < 0.05; **P < 0.01; ***P < 0.001.
Analysis of immune cells in the B16F10 melanoma model revealed significantly increased frequency and absolute numbers of tumor‐infiltrating CD4 and CD8 T cells in the Peli1‐KO mice, although the frequency of T cells in draining lymph node was comparable between the Peli1‐KO and wild‐type mice (Fig 1C and D). Moreover, both the draining lymph node and tumor of Peli1‐KO mice contained increased frequencies and absolute numbers of CD8 T cells producing the effector cytokine IFNγ (Fig 1E and F). The tumor of Peli1‐KO mice also had an increased number, although not frequency, of IFNγ‐producing CD4 T cells (Fig 1E and F). Similar results were obtained with the EG7 tumor model (Fig 1G and H).
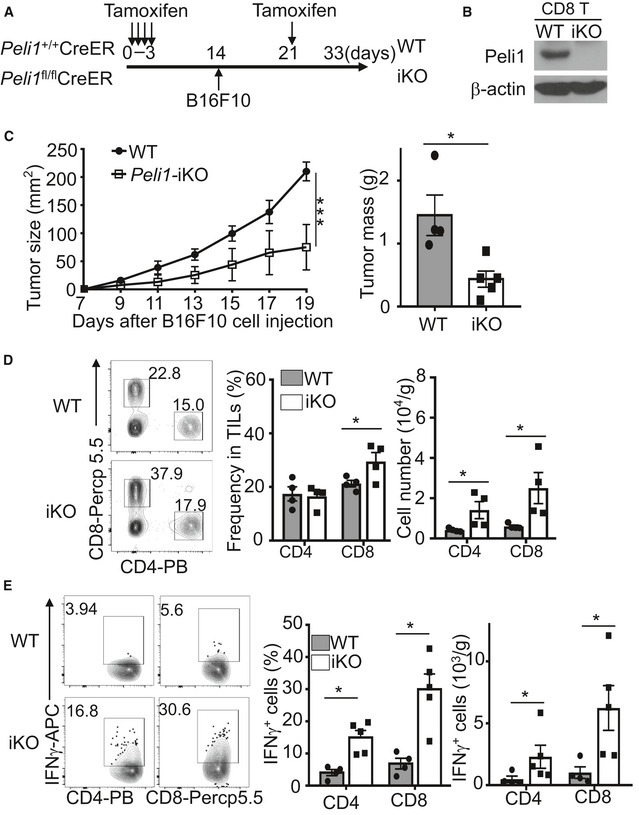
To assure that the phenotype of the Peli1‐KO mice was not due to developmental effect, we repeated the experiments using an inducible KO (iKO) model, in which Peli1 was inducibly deleted in adult mice. To this end, we crossed Peli1‐flox mice with CreER mice to generate Peli1 fl/flCreER and control Peli1 +/+CreER mice, which were then injected with tamoxifen for creating Peli1‐iKO and wild‐type control mice (Fig EV1A). Compared to the wild‐type control mice, the iKO mice displayed a much stronger tumor‐suppressing function (Fig EV1B and C). This phenotype was associated with increased numbers of tumor‐infiltrating CD4 and CD8 T cells (Fig EV1D). Both the frequency and absolute numbers of IFNγ‐producing CD4 and CD8 T cells were also drastically increased in the tumor of Peli1‐iKO mice (Fig EV1E). Together, these results suggest an important role for Peli1 in regulating antitumor responses of T cells.
Figure EV1. Inducible deletion of Peli1 in adult mice promotes antitumor immunity.
-
A, BSchematic of experimental design for generating B16F10‐bearing Peli1‐iKO (iKO) and wild‐type (WT) control mice (A) and immunoblot analysis of Peli1 in CD8 T cells of Peli1‐iKO and wild‐type mice (B).
-
CTumor growth curve (left) and summary graph of end‐point tumor masses (right) of wild‐type (n = 4) and Peli1‐iKO (n = 5) mice inoculated s.c. with B16F10 melanoma cells.
-
D, EFlow cytometry analysis of total (D, WT: n = 4; iKO: n = 4) or IFNγ‐producing (E, WT: n = 4; iKO: n = 5) CD4+ and CD8+ T cells in TILs of B16F10 tumor‐bearing (day 19) wild‐type and iKO mice, presented as a representative plot (left) and summary graph (right).
Data information:: Data are representative of 3 independent experiments, and summary data are presented as mean ± SEM with P values being determined by a two‐way ANOVA analysis with Bonferroni correction (left panel of C) and two‐tailed unpaired Student’s t‐test (right panel of C; D,E). *P < 0.05; ***P < 0.001.
Peli1 functions in T cells to regulate antitumor immunity
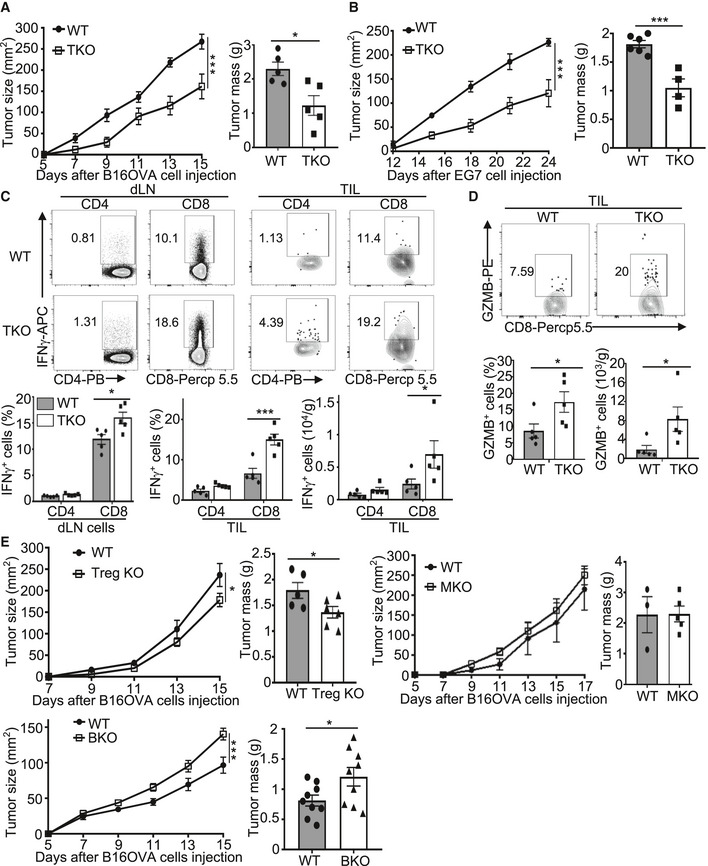
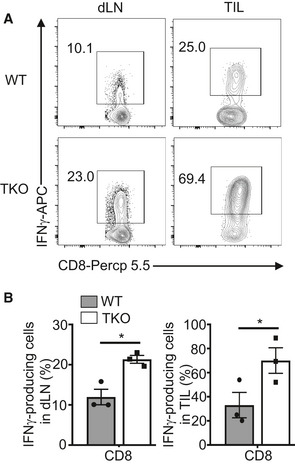
To determine the T cell‐intrinsic function of Peli1, we generated T cell‐conditional Peli1 KO (TKO) mice and challenged these mice with B16‐OVA melanoma and EG7 thymoma cells. Compared with wild‐type control mice, the Peli1‐TKO mice displayed a much stronger ability to suppress the growth of B16 tumor (Fig 2A), and similar results were obtained with the EG7 tumor model (Fig 2B). Consistently, the draining lymph node and tumor of the B16‐bearing Peli1‐TKO mice had a markedly increased frequency and absolute number of CD8 T cells producing IFNγ and granzyme B (Fig 2C and D). Similar results were obtained with the EG7 tumor model (Fig EV2). Furthermore, the Peli1 deficiency also promoted the generation of IFNγ‐producing CD4 T cells, although this result was less prominent than that of CD8 T cells (Fig 2C). These results demonstrated a T cell‐intrinsic function of Peli1 in the regulation of antitumor immunity and suggested a predominant role for Peli1 in regulating CD8 T cell function.
Figure 2. T cell‐specific Peli1 deficiency promotes antitumor immunity.
-
A, BTumor growth curve (left) and summary graph of end‐point tumor masses (right) of wild‐type (WT) and Peli1‐TKO (TKO) mice inoculated s.c. with B16‐OVA (A; WT, n = 5; KO, n = 5) or E.G7 (B; WT, n = 6; KO, n = 4) tumor cells.
-
CFlow cytometry analysis of IFNγ‐producing CD4+ and CD8+ T cells in TILs and dLN cells from B16OVA tumor‐bearing wild‐type and Peli1‐TKO mice, presented as a representative plot (upper) and summary graph (lower). (WT, n = 5; KO, n = 5)
-
DFlow cytometry analysis of GZMB+CD8+ T cells in TILs from B16‐OVA tumor‐bearing wild‐type and Peli1‐TKO mice, presented as a representative plot (upper) and summary graph (lower). (WT, n = 5; KO, n= 5)
-
ETumor growth curve (left) and summary graph of end‐point tumor masses (right) of B16‐OVA tumor‐bearing wild‐type and the indicated Peli1 conditional KO mice. (Treg KO model: WT, n= 5; Treg KO, n = 6; MKO model: WT, n= 3; MKO, n = 5; BKO model: WT, n = 9; BKO, n = 9)
Data information: Data are representative of 2 (E) or 3 (A‐D) independent experiments, and bar graphs are presented as mean ± SEM. P values are determined by a two‐way ANOVA analysis with Bonferroni correction (left panel of A, B, E) and two‐tailed unpaired Student’s t‐test (C, D and right panel of A, B, E). *P < 0.05; ***P < 0.001.
Figure EV2. T cell‐specific Peli1 deficiency promotes antitumor immunity in E.G7 tumor model.
-
A, BFlow cytometry analysis of the frequency of IFNγ‐producing CD8 effector T cells in tumor‐infiltrating lymphocytes of E.G7 tumor‐bearing (day 24) wild‐type (WT; n = 3) and Peli1‐KO (TKO; n = 3) mice, presented as a representative plot (A) and summary graph (B). Data are representative of 3 independent experiments, and summary data are presented as mean ± SEM with P values being determined by two‐tailed unpaired Student’s t‐test. *P < 0.05.
To examine whether Peli1 also functions in other cell types, we generated Treg cell‐conditional Peli1 KO (Treg KO), myeloid cell‐conditional Peli1 KO (MKO), and B cell‐conditional Peli1 KO (BKO) mice by crossing the Peli1‐flox mice with Foxp3‐Cre, Lyz2‐Cre, and Cd19‐Cre mice, respectively (Appendix Fig S1). In contrast to the T cell‐specific Peli1 deficiency, deletion of Peli1 specifically in Treg cells only had a moderate effect on tumor growth (Fig 2E). Furthermore, deletion of Peli1 in myeloid cells had no significant effect on tumor growth and deletion of Peli1 in B cells even moderately promoted tumor growth (Fig 2E). These results suggest that T cells likely represent the major cell type, in which Peli1 functions to mediate antitumor immunity.
Peli1 regulates T cell metabolism
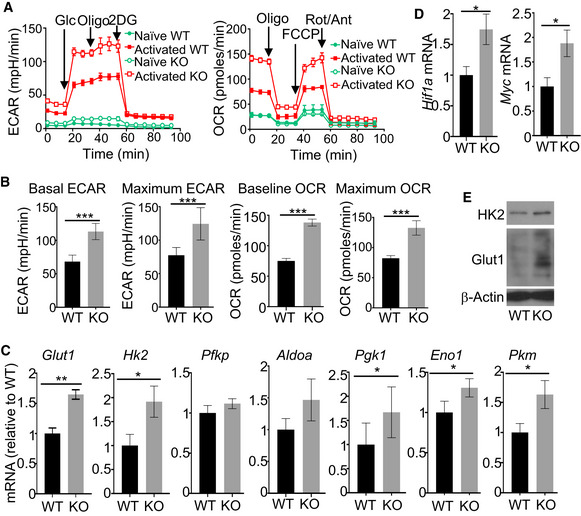
We have previously shown that Peli1 negatively regulates TCR/CD28‐stimulated T cell proliferation and cytokine production (Chang et al, 2011). Peli1 deficiency did not significantly influence the apoptosis of CD8 T cells (Appendix Fig S3). Our previous work suggests that Peli1 plays a role in regulating the stability of an NF‐κB family member, c‐Rel; however, it has remained unclear whether additional mechanisms are involved in Peli1 function in T cells. In this regard, metabolic reprogramming occurs along with T cell activation and serves as a pivotal mechanism that mediates effector T cell generation and function (Almeida et al, 2016). Naïve T cells mainly use oxidative phosphorylation (OXPHOS) for energy generation; upon activation, they rapidly shift the cellular metabolism toward aerobic glycolysis and also increases OXPHOS (Almeida et al, 2016). Notably, glycolysis promotes the production of T cell cytokines, including IL‐2 and IFNγ (Chang et al, 2013; Menk, Scharping et al, 2018). To examine the role of Peli1 in regulating aerobic glycolysis, we performed Seahorse extracellular flux analyses to measure extracellular acidification rate (ECAR) and oxygen consumption rate (OCR), indicators of aerobic glycolysis and oxidative phosphorylation (OXPHOS), respectively (Pearce, Poffenberger et al, 2013). Activation of wild‐type OT‐I CD8 T cells led to the induction of both ECAR and OCR (Fig 3A and B). Remarkably, under the activation conditions, the Peli1‐deficient OT‐I CD8 T cells displayed a drastic increase in both the baseline ECAR and the stressed ECAR (maximum glycolytic capacity), suggesting heightened glycolysis (Fig 3A and B). Peli1 deficiency also increased baseline OCR and stressed OCR (maximum respiratory capacity) (Fig 3A and B). These results demonstrate a crucial role for Peli1 in regulating T cell metabolism.
Figure 3. Peli1 regulates metabolic reprograming of CD8 T cells.
-
A, BSeahorse analysis of basal (glucose injection) and maximal (oligomycin injection) ECAR or basal (no treatment) and maximal (FCCP injection) OCR in WT and Peli1‐KO OT‐I CD8 T cells that were either untreated (naïve) or activated with plate‐bound anti‐CD3 (1 μg/ml) plus anti‐CD28 (1 μg/ml) for 16 h. Data are presented as a representative plot (A) or summary graph based on 6 wild‐type and 6 KO mice (B).
-
C, DqRT–PCR analysis of the indicated genes using RNAs isolated from wild‐type or Peli1‐KO OT‐I CD8 T cells stimulated with anti‐CD3 and anti‐CD28 for 6 h.
-
EImmunoblot analysis of HK2 and Glut1 in wild‐type or Peli1‐KO OT‐I CD8 T cells that were stimulated with plate‐bound anti‐CD3 and anti‐CD28 for 24 h.
Data information: Data are representative of 3 independent experiments, and bar graphs are presented as mean ± SEM with P values being determined by two‐tailed unpaired Student’s t‐test. *P < 0.05; **P < 0.01; ***P < 0.001.
Source data are available online for this figure.
To examine the mechanism by which Peli1 regulates T cell metabolism, we analyzed the expression of glycolysis‐related genes. qRT–PCR analysis revealed that the Peli1‐deficient CD8 T cells had a significant increase in the expression level of several glycolysis genes, including glucose transporter 1 (Glut1), hexokinase 2 (Hk2), Pgk1, Eno1, Pkm, Hif1a, and Myc under in vitro activation conditions (Fig 3C and D). Immunoblot analyses also detected upregulated Glut1 and HK2 proteins in the activated Peli1‐deficient CD8 T cells (Fig 3E). These results suggest an important role for Peli1 in regulating T cell metabolism.
Peli1 negatively regulates mTORC1 activation by TCR/CD28 stimuli
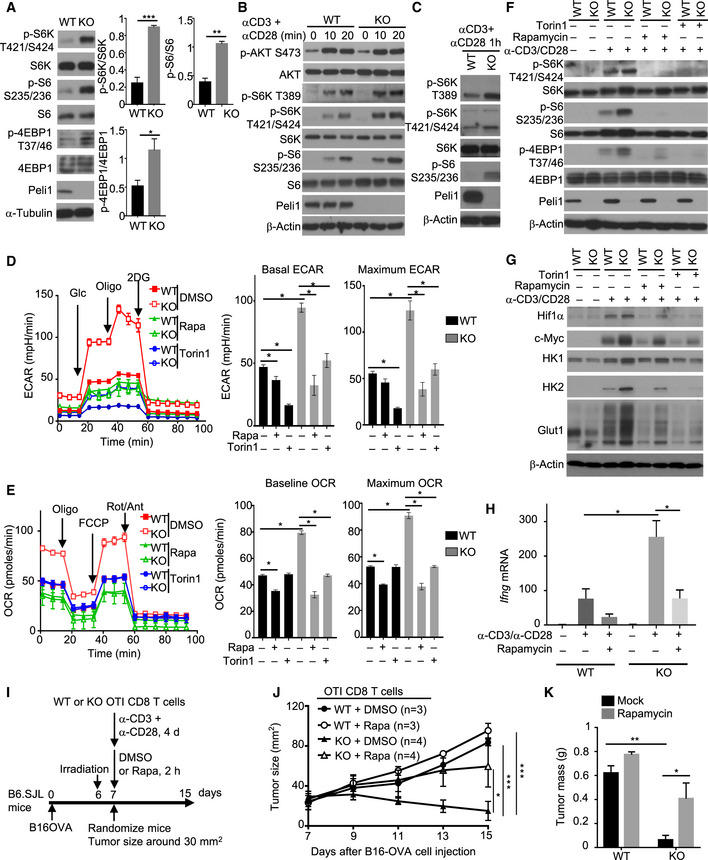
The mTORC1 signaling axis is crucial for mediating TCR/CD28‐stimulated glycolytic gene expression (Lunt & Vander Heiden, 2011; Yang & Chi, 2012). Interestingly, we found that under homeostatic conditions, the Peli1‐deficient CD8 T cells displayed increased mTORC1 activity, as revealed by stronger phosphorylation of mTORC1 target proteins, S6 kinase (S6K), S6, and 4EBP1, in freshly isolated Peli1 KO CD8 T cells compared to the wild‐type CD8 T cells (Fig 4A). We next examined the effect of Peli1 deficiency on mTORC1 activation by TCR/CD28 agonistic antibodies. For these studies, we first rested the cells on ice to reduce the steady‐state mTORC1 activation (Fig 4B). The Peli1 deficiency promoted mTORC1 activation stimulated by anti‐CD3 plus anti‐CD28 (Fig 4B and C). Notably, although TCR/CD28‐stimulated mTORC1 activation requires AKT, the Peli1 deficiency did not affect AKT activation, as indicated by the comparable AKT phosphorylation at both S473 and T308 in Peli1 KO and WT control T cells (Fig 4B and Appendix Fig S4). These results suggest that Peli1 may regulate mTORC1 activation via an AKT‐independent mechanism. Since S473 of AKT is a major target of mTORC2, these findings also suggest that Peli1 is dispensable for regulation of mTORC2.
Figure 4. Peli1 deficiency promotes mTORC1 signaling in CD8 T cells.
-
AImmunoblot analysis of the indicated phosphorylated (p‐) and total proteins in whole‐cell lysates of freshly isolated CD8 T cells from wild‐type (WT) or Peli1 KO (KO) mice (6 weeks old). Data are presented as a representative blot (left) and summary graphs of densitometric quantifications of the indicated proteins (presented as phosphorylated/total protein ratio) based on three independent experiments.
-
B, CImmunoblot analysis of the indicated phosphorylated (p‐) and total proteins in whole‐cell lysates of wild‐type or Peli1‐KO OT‐I CD8 T cells that were first rested on ice for 15 min and then stimulated in low‐serum (1% FBS) medium with anti‐CD3 and anti‐CD28 for the indicated time periods.
-
D, ESeahorse analysis of basal and maximal ECAR (D) or OCR (E), as described in Fig 3, using wild‐type or Peli1‐KO OT‐I CD8 T cells that were activated for 16 h with plate‐bound anti‐CD3 (1 μg/ml) plus anti‐CD28 (1 μg/ml) in the presence of solvent control (DMSO), rapamycin (Rapa, 10 nM), or Torin 1 (100 nM). Data are presented as a representative plot (left) and summary graphs (right).
-
F, GImmunoblot analysis of the indicated phosphorylated (p‐) and total proteins in whole‐cell lysates of wild‐type or Peli1‐KO OT‐I CD8 T cells that were either not treated (–) or stimulated (+) for 1 h (F) or 24 h (G) with anti‐CD3 (1 μg/ml) and anti‐CD28 (1 μg/ml) in the presence (+) or absence (–) of rapamycin (10 nM) and Torin 1 (100 nM).
-
HqRT–PCR analysis of Ifng gene expression in naïve wild‐type or Peli1‐KO OT‐I CD8 T cells that were either not treated (–) or stimulated for 6 h (+) with anti‐CD3 plus anti‐CD28 in the presence (+) or absence (–) or rapamycin.
-
I–KSchematic of experimental design (I), tumor growth curve (J), and summary of day 15 tumor weight (K) of B6.SJL mice inoculated with B16‐OVA melanoma cells (2 x 10⁵) and adoptively transferred on day 7 with in vitro activated and rapamycin‐ or DMSO‐treated wild‐type or Peli1‐KO OT‐I CD8 T cells (4 × 10⁵).
Data information: Data are representative of 2 (J, K) or 3 (A‐H) independent experiments and bar graphs are presented as mean ± SEM with P values being determined by two‐tailed unpaired Student’s t‐test (A, D, E, H, K) or two‐way ANOVA with Bonferroni correction (J). *P < 0.05; **P < 0.01; ***P < 0.001.
Source data are available online for this figure.
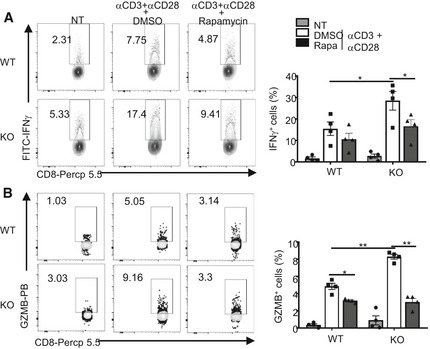
To determine the functional significance of Peli1‐mediated mTORC1 regulation, we tested the involvement of mTORC1 in the hyper‐induction of glycolysis in Peli1‐deficient CD8 T cells. While the Peli1 KO T cells displayed drastically higher level of ECAR than wild‐type control T cells, treatment of T cells with two different mTORC1 inhibitors, rapamycin and Torin, largely blocked the ECAR induction in Peli1 KO T cells and erased the differences between the Peli1 KO T cells and wild‐type control T cells (Fig 4D). The mTORC1 inhibitors also attenuated TCR/CD28‐stimulated OCR in Peli1‐deficient CD8 T cells (Fig 4E). Consistent with the role of metabolism in regulating T cell effector function, inhibition of mTORC1 attenuated the induction of IFNγ and gran‐zyme B in activated CD8 T cells (Fig EV3). Parallel immunoblot analyses revealed that the mTOR inhibitor treatment efficiently inhibited TCR/CD28‐stimulated phosphorylation of mTORC1 target proteins (Fig 4F). Consistently, the mTOR inhibitors also largely prevented the hyper‐induction of metabolism‐related proteins, including Glut1, HK1, HK2, Hif1α, and c‐Myc, by the TCR/CD28 signals (Fig 4G). Moreover, the TCR/CD28‐stimulated hyper‐induction of IFNγ in Peli1‐deficient T cells was also diminished in the presence of the mTORC1 inhibitor (Fig 4H). We next examined the potential involvement of mTORC1 in regulating the antitumor function of Peli1‐deficient CD8 T cells. Since rapamycin regulates mTORC1 signaling and metabolism in both immune cells and tumor cells, we employed an adoptive T cell transfer model using wild‐type or Peli1‐KO OT1 CD8 T cells treated with rapamycin or solvent control DMSO (Fig 4I). As expected, the Peli1‐KO OT1 CD8 T cells were much more potent than wild‐type OT1 CD8 T cells in suppressing tumor growth (Fig 4J and K). Moreover, while rapamycin inhibited the antitumor function of both wild‐type and Peli1‐KO CD8 T cells, this effect was much more profound for the Peli1‐KO CD8 T cells (Fig 4J). These results suggest that Peli1 negatively regulates T cell metabolism through controlling mTORC1 activation, thereby modulating the antitumor function of CD8 T cells.
Figure EV3. Hyper‐induction of IFNγ and granzyme B in Peli1‐deficient CD8 T cells is dependent on mTORC1.
-
A, BFlow cytometry analysis of intracellular IFNγ (A) and granzyme B (B) in OT‐I naïve T cells that were either not treated (NT) or stimulated for 16 h with plate‐coated anti‐CD3 (1 μg/ml) and anti‐CD28 (1 μg/ml) in the presence of DMSO or rapamycin (10 nM). Data are repeated with 4 independent experiments, and the results were presented as a representative plot (left) and summary graph of mean ± SEM values based on multiple mice (right). P values were determined by two‐tailed unpaired Student’s t‐test. *P < 0.05; **P < 0.01.
Recent studies suggest that autophagy inhibition causes tumor regression by both attenuating tumor growth and promoting antitumor immunity (Cunha, Yang et al, 2018; Poillet‐Perez, Xie et al, 2018; Yang, Herter‐Sprie et al, 2018; DeVorkin, Pavey et al, 2019). Since mTORC1 is known as a regulator of autophagy (Kim & Guan, 2015), we examined the effect of Peli1 deficiency on autophagy induction along with TCR/CD28 stimulation. We measured autophagy based on conversion of microtubule‐associated protein 1 light chain (LC3) from a cytosolic form (LC3‐I) to a lipidated form (LC3‐II), a central step of autophagic flux (Mizushima, 2007). As expected, LC3‐II was readily detected upon inhibition of lysosomal protease activity with cathepsin inhibitors, E64D plus pepstatin A (Appendix Fig S5A). Peli1‐deficient T cells had a moderately reduced level of LC3‐II generation (Appendix Fig S5A). To assess the functional significance, we incubated the T cells with a cell‐permeable Beclin 1‐activating peptide (Tat‐Beclin 1) known to stimulate autophagy (Shoji‐Kawata, Sumpter et al, 2013). Tat‐Beclin 1 treatment increased the level of LC3‐II and erased the differences between wild‐type and Peli1‐KO T cells (Appendix Fig S5B). Furthermore, Tat‐Beclin 1 treatment reduced the level of IFNγ induction in both WT and Peli1‐KO T cells (Appendix Fig S5C). However, even under Tat‐Beclin 1‐treated conditions, Peli1 deficiency still significantly promoted IFNγ induction (Appendix Fig S5C). These data suggest that autophagy regulation is not a major mechanism by which Peli1 suppresses T cell activation.
Peli1 negatively regulates mTORC1 activation by growth factors
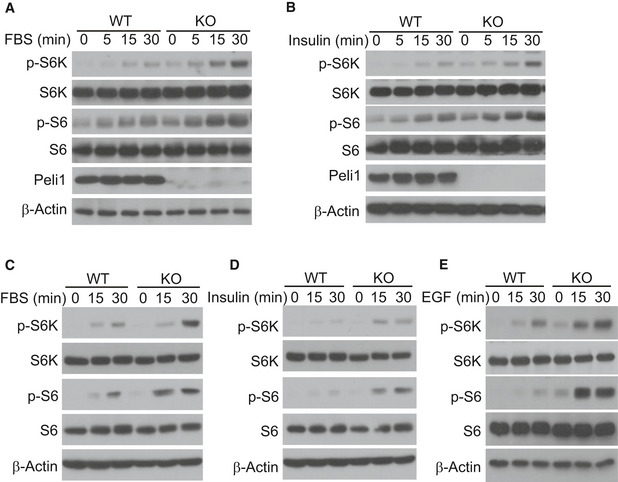
Growth factors are well‐known stimuli of mTORC1 signaling. To examine whether Peli1‐mediated mTORC1 regulation was specific for the TCR pathway or also for other pathways, we examined the effect of Peli1 deficiency on growth factor‐stimulated mTORC1 activation. We found that Peli1‐deficient CD8 T cells were hyper‐responsive to both fetal bovine serum (FBS)‐ and insulin‐stimulated mTORC1 activation, as shown by the phosphorylation of S6K and S6 (Fig 5A and B). CD8 T cells did not appreciably respond to another growth factor, EGF, probably due to insufficient expression of EGF receptor. We next examined the role of Peli1 in regulating mTORC1 in non‐T cells using primary mouse embryonic fibroblasts (MEFs). Compared to wild‐type MEFs, the Peli1‐KO MEFs displayed much stronger phosphorylation of the mTORC1 target proteins, S6K and S6, in response to stimulation by FBS, insulin, and EGF (Fig 5C–E). These results suggest that Peli1 controls mTORC1 activation by growth factors in both T cells and MEFs. Since Peli1 deficiency had no effect on activation of AKT, these results also suggested that Peli1 might target a downstream step in mTORC1 signaling.
Figure 5. Peli1 regulates mTORC1 activation by growth factors in T cells and MEF cells.
-
A, BImmunoblot analysis of the indicated phosphorylated (p‐) and total proteins in whole‐cell lysates of wild‐type (WT) or Peli1‐KO (KO) OT‐I CD8 T cells that were activated for 16 h with plate‐coated anti‐CD3 (1 μg/ml) plus anti‐CD28, starved for 6 h in serum‐free RPMI medium, and then treated for indicated time periods with FBS (10%) (A) or insulin (B).
-
C–EImmunoblot analysis of the indicated phosphorylated (p‐) and total proteins in whole‐cell lysates of wild‐type (WT) or Peli1‐KO (KO) MEFs that were starved for 16 h in serum‐free DMEM medium and then treated for the indicated time periods with FBS (C), insulin (D), and EGF (E).
Source data are available online for this figure.
Peli1 mediates TSC1 ubiquitination and regulates TSC1/2 stability
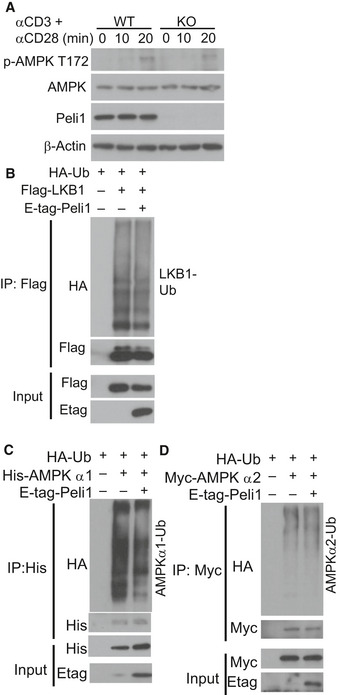
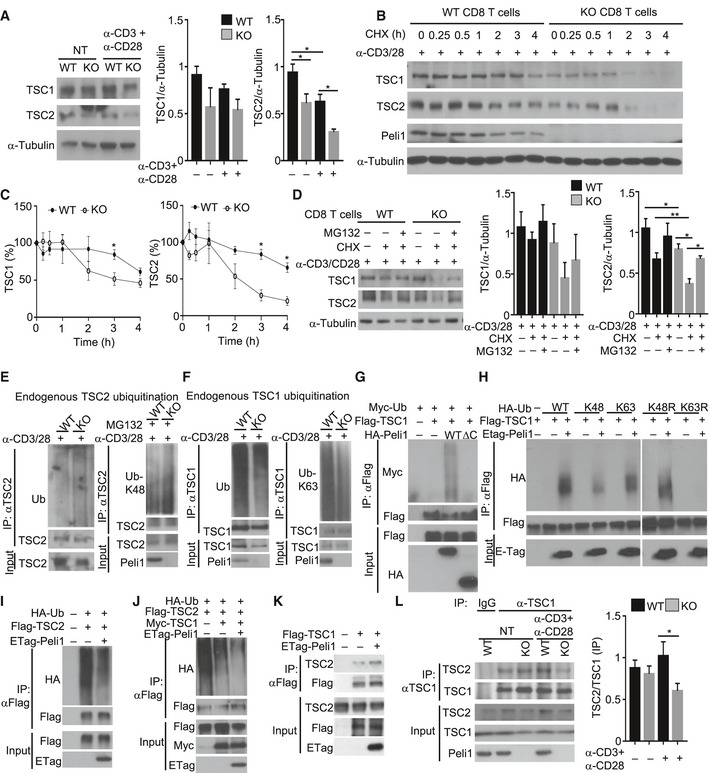
To understand the mechanism by which Peli1 regulates mTORC1 signaling, we examined the role of Peli1 in regulating upstream signaling factors known to regulate mTORC1 activation. In this regard, the LKB1‐AMPK signaling axis plays an important role in metabolic regulation, including negative regulation of the mTORC1 pathway (Chi, 2012). A central step in this signaling axis is AMPK phosphorylation at T172, which triggers catalytic activation of AMPK. We found that Peli1 deficiency did not influence TCR/CD28‐stimulated AMPK activation, as measured based on its T172 phosphorylation (Fig EV4A). Peli1 also did not induce the ubiquitination of AMPK or LKB1, despite the strong constitutive ubiquitination of these proteins under transfection conditions (Fig EV4B–D). A more direct mechanism of mTORC1 regulation is mediated by TSC1 and TSC2, which form a complex that inhibits mTORC1 activation through inactivating Rheb, a mTORC1‐stimulating small GTPase (Chi, 2012). AKT‐mediated mTORC1 activation involves TSC2 phosphorylation and inactivation (Inoki, Li et al, 2002; Chi, 2012). TSC2 is the effector subunit of the TSC1–TSC2 complex, while TSC1 is required for preventing ubiquitination and degradation of TSC2(Benvenuto, Li et al, 2000; Chong‐Kopera, Inoki et al, 2006; Huang & Manning, 2008; O'Brien, Gorentla et al, 2011). How this function of TSC1 is regulated is unclear. Interestingly, we found that Peli1‐deficient T cells had a significant decrease in the level of TSC2 under both untreated and anti‐CD3/anti‐CD28‐stimulated conditions (Fig 6A). The level of TSC1 was also moderately reduced in the Peli1‐deficient T cells (Fig 6A). Cycloheximide chase assays (to block protein synthesis) revealed that both TSC1 and TSC2 were more rapidly lost in the Peli1‐deficient T cells than in wild‐type control T cells, although this phenotype was more prominent for TSC2 (Fig 6B and C). Incubation of T cells with a proteasome inhibitor, MG132, blocked the degradation of TSC2 and partially blocked the degradation of TSC1 in Peli1‐KO T cells (Fig 6D), suggesting that the TSC proteins were targeted for proteasomal degradation in the absence of Peli1.
Figure EV4. Peli1 does not regulate AMPK activation or mediate ubiquitination of LKB1 and AMPK.
-
AImmunoblot analysis of the phosphorylated (P‐) and total proteins in whole‐cell lysates of CD8 T cells stimulated for the indicated time points.
-
B–DUbiquitination of LKB1 (B), AMPKα1 (C), and AMPKα2 (D) in 293 cells transfected with the indicated expression vectors. Ubiquitinated proteins were isolated by immunoprecipitation and detected by immunoblot (upper), and the protein expression levels in input cell lysates was analyzed by immunoblot (lower).
Figure 6. Peli1 regulates the ubiquitination and stability of TSC1‐TSC2 complex.
-
AA Immunoblot analysis of the indicated proteins in whole‐cell lysates of wild‐type (WT) and Peli1‐KO (KO) CD8 T cells that were either not treated (NT) or activated for 16 h with plate‐bound anti‐CD3 and anti‐CD28. Data are presented as a representative blot (left panel) and a summary graph of quantified TSC1 (middle panel) and TSC2 (right panel) protein bands relative to the level of α‐Tubulin.
-
B, CImmunoblot analysis of the indicated proteins in whole‐cell lysates of wild‐type and Peli1‐KO CD8 T cells that were activated for 1 h with anti‐CD3 and anti‐CD28 and then treated with cycloheximide (CHX) for the indicated time periods. Data are presented as a representative blot (B) and a summary graph of quantified TSC1 and TSC2 protein bands presented as percentage of the level in untreated (0 min) cells (C).
-
DImmunoblot analysis of TSC1 and TSC2 in wild‐type or Peli1‐KO CD8 T cells stimulated with anti‐CD3 plus anti‐CD28 for 1 h and then incubated with (+) or without (–) cycloheximide (CHX) and/or MG132 for 2 h. Data are presented as a representative blot (left panel) and a summary graph of quantified TSC1 (middle panel) and TSC2 (right panel) protein bands relative to the level of α‐Tubulin.
-
E, FUbiquitination analysis of immunoprecipitated TSC2 (E) and TSC1 (F) from activated (anti‐CD3 plus anti‐CD28 for 2 h) wild‐type or Peli1‐KO CD8 T cells by immunobloting using anti‐ubiquitin Abs detecting total (Ub), K48 (Ub‐K48), or K63 (Ub‐K63) polyubiquitin chains.
-
G–JAnalysis of ubiquitin conjugation to TSC1 (G, H) or TSC2 (I, J) in 293T cells transiently transfected (for 48 h) with the indicated expression vectors.
-
KCo‐immunoprecipitaton analysis of TSC1‐TSC2 interaction in 293T cells transiently transfected (for 48 h) with the indicated expression vectors.
-
LCo‐immunoprecipitation analysis of endogenous TSC1‐TSC2 interaction in wild‐type and Peli1‐KO CD8 T cells that were either not treated (NT) or stimulated for 2 h with anti‐CD3 plus anti‐CD28. The right panel is a summary graph of TSC2/TSC1 ratio based on quantification of the blot from anti‐TSC1 IP (the right four lanes of the top two panels).
Data information: Summary graphs in A, C, D, and L are densitometric quantification of the indicated protein bands based on three independent experiments, and bar graphs are presented as mean ± SEM. P values are determined by two‐tailed unpaired Student’s t‐test. *P < 0.05, **P < 0.01.
Source data are available online for this figure.
To examine the mechanism underlying the degradation of TSC2 in Peli1‐deficient T cells, we analyzed its ubiquitination. Consistent with the increased TSC2 proteolysis, Peli1‐KO CD8 T cells displayed increased TSC2 ubiquitination under activated conditions (Fig 6E). The Peli1 deficiency also increased TSC2 ubiquitination in unstimulated CD8 T cells, albeit less strongly than in activated CD8 T cells (Appendix Fig S6A). Parallel analyses using a chain‐specific ubiquitin antibody revealed K48‐linked ubiquitin chains conjugated to TSC2 (Fig 6E). Interestingly, the level of TSC1 ubiquitination was profoundly decreased in Peli1‐deficient CD8 T cells (Fig 6F and Appendix Fig S6B). This finding suggested the possibility that Peli1 might mediate conjugation of non‐degradative ubiquitin chains to TSC1. Indeed, TSC1 was predominantly conjugated with K63‐linked polyubiquitin chains in wild‐type T cells, which was profoundly inhibited in Peli1‐deficient T cells (Fig 6F). Since Peli1 is an E3 capable of catalyzing K63 ubiquitination (Moynagh, 2009; Jin et al, 2012), we surmised that Peli1 might function as an E3 ligase of TSC1. Indeed, in a transfection model, Peli1 expression strongly induced TSC1 ubiquitination, and this function required the C‐terminal RING domain of Peli1, since a catalytically inactive Peli1 mutant harboring C‐terminal RING deletion (Peli1∆C) failed to ubiquitinate TSC1 (Fig 6G). In line with the K63 ubiquitination of endogenous TSC1 (Fig 6F), the Peli1‐induced TSC1 ubiquitination in transfection model was predominantly K63‐linked (Fig 6H).
In contrast to TSC1, TSC2 was constitutively ubiquitinated when expressed in 293 cells (Fig 6I). Furthermore, Peli1 expression did not induce, but rather reduced, the ubiquitination of TSC2 (Fig 6I), which was in line with the finding that Peli1 deficiency in T cells promoted TSC2 ubiquitination (Fig 6E). The constitutive ubiquitination of TSC2 was likely due to the presence of insufficient TSC1 known to inhibit TSC2 ubiquitination and degradation (Chong‐Kopera et al, 2006). Indeed, TSC1 expression strongly inhibited the ubiquitination of TSC2 (Fig 6J). Importantly, the function of TSC1 in suppressing TSC2 ubiquitination was enhanced by coexpression with Peli1 (Fig 6J). To delineate the mechanism by which Peli1 promotes TSC1‐mediated inhibition of TSC2 ubiquitination, we tested whether Peli1 might regulate the physical interaction between TSC1 and TSC2. As expected from previous studies, coIP assays revealed the interaction of transfected TSC1 with endogenous TSC2 (Fig 6K). Importantly, this molecular interaction was strongly enhanced upon expression of Peli1 (Fig 6K). Under endogenous conditions, TSC1/TSC2 interaction was also readily detected in T cells. Interestingly, Peli1 deficiency profoundly reduced the binding of TSC1 to TSC2 in TCR/CD28‐stimulated T cells, although it did not appreciably affect the basal level TSC1/TSC2 interaction (Fig 6L). These findings suggest that Peli1 facilitates K63 ubiquitination of TSC1, which may promote its binding to TSC2.
TSC1 ubiquitination is important for its function
To better understand the mechanism of Peli1‐mediated TSC1 ubiquitination, we mapped the sites of TSC1 ubiquitination induced by Peli1 (Fig EV5A). Mass spectrometry analysis led to the identification of two lysine residues, K30 and K632 (Fig EV5B). Both of these lysine residues of TSC1 are conserved across species (Fig EV5C). Mutation of K632 only moderately reduced Peli1‐induced TSC1 ubiquitination, whereas mutation of K30 severely attenuated the TSC1 ubiquitination (Fig 7A). These results thus identified K30 of TSC1 as a critical residue for its ubiquitination. To assess the functional significance of TSC1 ubiquitination, we reconstituted TSC1‐KO MEFs with either wild‐type TSC1 or TSC1 K30A mutant and examined FBS‐induced mTORC1 activation. Expression of wild‐type TSC1 inhibited FBS‐stimulated mTOCR1 activation, as shown by the reduced phosphorylation of the mTORC1 target proteins S6K and S6 (Fig 7B). Furthermore, expression of wild‐type TSC1 also attenuated FBS‐induced TSC2 loss (Fig 7B). Interestingly, the TSC1 K30A mutant failed to inhibit mTORC1 activation or protect TSC2 degradation in FBS‐stimulated cells (Fig 7B). Consistent with these results, we found that while wild‐type TSC1 suppressed TSC2 ubiquitination in the presence of Peli1, the TSC1 K30A mutant failed to inhibit TSC2 ubiquitination (Fig 7C). Parallel coIP assays revealed that wild‐type TSC1, but not K30A mutant, responded to Peli1 for interaction with TSC2 (Fig 7D). Furthermore, expression of wild‐type TSC1, but not TSC1 K30A, in TSC1‐KO MEFs suppressed TSC2 ubiquitination (Fig 7E) and attenuated TSC2 degradation (Fig 7F). These findings suggest that Peli1‐mediated TSC1 ubiquitination may facilitate the binding of TSC1 to TSC2, thereby stabilizing TSC2 and supporting mTORC1 regulation under inducible conditions.
Figure EV5. Sites of Peli1‐mediated TSC1 ubiquitination.
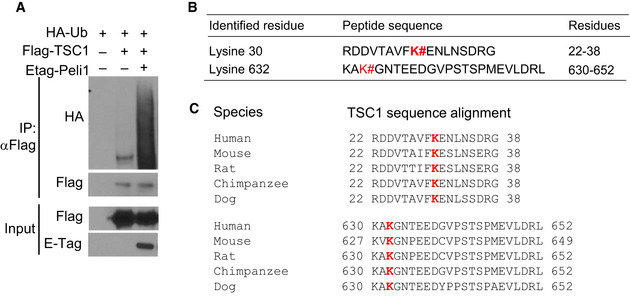
- Immunoprecipitation and immunoblot analysis of TSC1 ubiquitination in 293 cells transfected with (+) or without (–) the indicated expression vectors.
- Summary of ubiquitination sites of TSC1 detected by mass spectrometry in cells coexpressing TSC1 and Peli1. TSC1 was isolated by anti‐Flag immunoprecipitation from 293T cells transiently transfected as indicated in a. Samples from lanes 2 and 3 were analyzed by mass spectrometry.
- Sequence alignment of TSC1 ubiquitination sites.
Figure 7. Peli1 regulates the stability of TSC complex through ubiquitination of TSC1.
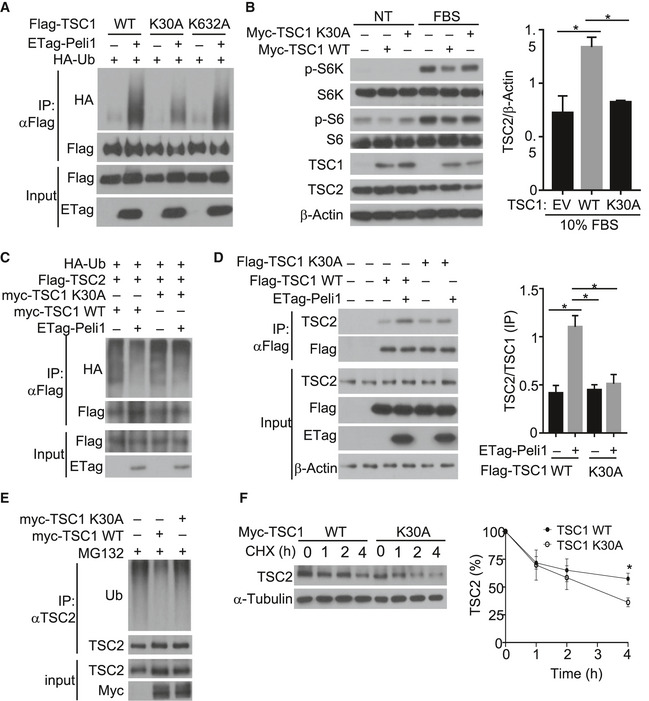
- Analysis of ubiquitin conjugation to wild‐type (WT) TSC1 and the indicated TSC1 mutants in 293T cells transiently transfected Flag‐tagged TSC1 and its mutants along with (+) or without (–) the indicated expression vectors.
- Immunoblot analysis of the indicated phosphorylated (p‐) and total proteins in lysates of TSC1‐KO MEFs transfected with (+) or without (–) TSC1 wild‐type or K30A expression vectors. The cells were serum starved and then left either untreated (NT) or stimulated with 10% FBS for 30 mins. Data are presented as a representative blot (left panel) and a summary graph of quantified TSC2 (right panel) protein bands relative to the level of β‐Actin.
- Analysis of TSC2 ubiquitination in 293 cells transfected (for 48 h) with (+) or without (–) the indicated expression vectors.
- Co‐immunoprecipitation analysis of the interaction between endogenous TSC2 and exogenous TSC1 wild‐type and K30A in TSC1‐KO MEFs transfected (for 48 h) with (+) or without (–) the indicated expression vectors. KO MEF cells were transfected with indicated expression plasmids. The right panel is a summary graph of TSC2/TSC1 ratio based on quantification of the last four lanes of the anti‐Flag IP blot in left panel.
- Analysis of ubiquitin conjugation to endogenous TSC2 in TSC1‐KO MEFs transfected (for 48 h) with (+) or without (−) TSC1 WT or K30A and treated with MG132 for 2 h before lysis.
- Immunoblot analysis of endogenous TSC2 in TSC1‐KO MEFs transfected (for 48 h) with Myc‐TSC1 wild‐type or K30A and subsequently treated with cycloheximide (10 μg/ml) for the indicated time periods before lysis. The right panel is a summary graph of quantified TSC2 WT and K30A protein bands presented as percentages of the level in the untreated (0 min) lane.
Data information: Summary graphs in B, D, and F are densitometric quantification of the indicated protein bands based on three independent experiments, and bar graphs are presented as mean ± SEM. P values are determined by a two‐tailed unpaired Student’s t‐test. *P < 0.05.
Source data are available online for this figure.
Discussion
In this study, we identified a novel function of the E3 ubiquitin ligase Peli1 in the regulation of T cell activation and antitumor CD8 T cell responses. Peli1 deficiency greatly enhanced antitumor T cell responses in several mouse syngeneic tumor models. Our data suggest that Peli1 negatively regulates metabolic reprogramming of CD8 T cells, a critical mechanism for the generation and function of effector T cells (Almeida et al, 2016). Peli1 exerts this novel function through controlling activation of the metabolic kinase mTORC1.
Peli1 is an E3 that functions in both innate immune cells and lymphocytes (Jin et al, 2012). In contrast to its negative role in regulating T cell activation, Peli1 positively regulates signaling in B cells and innate immune cells in response to stimulation via the TRIF‐dependent Toll‐like receptors (TLRs) (Chang, Jin et al, 2009). Since antitumor immune response involves both T cells and other cell types, it became an important question regarding how Peli1 regulates antitumor immunity. We found in the present study that the enhanced antitumor immunity of Peli1‐KO mice was associated with increased tumor infiltration with T cells but not macrophages, cDC1, MDSCs, or B cells. By generating myeloid cell‐conditional Peli1 KO mice, we demonstrated that Peli1 deletion in myeloid cells had no significant effect on the tumor growth. Deletion of Peli1 in B cells moderately reduced the ability of mice to control tumor growth. In contrast, T cell‐specific deletion of Peli1 greatly enhanced antitumor immunity, coupled with a profound suppression of tumor growth. Our data suggest that Peli1 predominantly functions in conventional T cells, but not Treg cells, since Treg‐conditional deletion of Peli1 only resulted in a moderate suppression of tumor growth. Furthermore, the phenotype of Peli1‐KO mice in antitumor immunity was not due to developmental effect, since inducible deletion of Peli1 in adult mice also greatly promoted antitumor immune responses. These results suggest that the function of Peli1 in regulating antitumor immunity may be predominantly mediated through controlling T cell activation and also implicate Peli1 as a potential therapeutic target for cancer immunotherapy.
Metabolic reprogramming is an important mechanism that regulates the process of T cell differentiation and effector function following TCR/CD28 costimulation (Maciver et al, 2013). The kinase mTORC1 plays a central role in regulating metabolic reprogramming of T cells (Yang & Chi, 2012; Maciver et al, 2013). In T cells, mTORC1 integrates signals from the TCR and diverse environmental cues, including cytokines, nutrients, and growth factors (Waickman & Powell, 2012). A primary mechanism of mTORC1 activation by the TCR/CD28 signals and growth factors is through activation of AKT, a kinase that phosphorylates TSC2 and inactivates the mTORC1‐inhibitory function of the TSC1‐TSC2 complex (Inoki et al, 2002; Chi, 2012). However, how the signal‐induced mTORC1 activation is negatively regulated is only partially understood. Our data demonstrated a crucial role for Peli1 in regulating mTORC1 activation and mTORC1‐mediated actions on T cell metabolism and antitumor immunity. Peli1 deficiency greatly promoted the induction of glycolytic metabolism by the TCR and CD28 costimulation, coupled with increased expression of a number of glycolysis‐related genes, including those encoding the transcription factors HIF1α and c‐Myc. HIF1α and c‐Myc are downstream targets of the mTORC1 pathway that coordinate T cell metabolic reprogramming and effector functions (Chi, 2012; Gnanaprakasam, Sherman et al, 2017). We obtained genetic evidence that Peli1 suppresses the activation of mTORC1 stimulated by both the TCR/CD28 agonistic antibodies and growth factors. The function of Peli1 in regulating growth factor‐stimulated mTORC1 activation was detected in both T cells and MEFs. These findings suggest that Peli1 may target a downstream mTORC1 signaling step common to TCR and growth factor receptor pathways.
We identified TSC1 as a novel target of Peli1. Peli1 induces conjugation of K63‐linked polyubiquitin chains to TSC1, and consistently, Peli1 deficiency impaired TSC1 ubiquitination in activated T cells. Interestingly, the Peli1 deficiency did not inhibit, but rather stimulated, the ubiquitination of TSC2. Furthermore, in contrast to the K63 ubiquitination of TSC1, TSC2 was conjugated with K48‐linked polyubiquitin chains, known to target proteins for proteasomal degradation. We found that the aberrant K48 ubiquitination of TSC2 in Peli1‐deficient T cells was associated with impaired TSC1‐TSC2 interaction. Consistently, overexpressed TSC1 suppressed TSC2 ubiquitination, and this function of TSC1 was enhanced in the presence of Peli1. We further demonstrated that Peli1 stimulates ubiquitin conjugation to lysine 30 of TSC1, which is required for Peli1‐stimulated TSC1‐TSC2 interaction and suppression of TSC2 ubiquitination and degradation. Our findings are in line with the previous reports that TSC1‐TSC2 binding is required for preventing ubiquitin‐dependent degradation of TSC2(Benvenuto et al, 2000; Chong‐Kopera et al, 2006; Huang & Manning, 2008; O'Brien et al, 2011) and provide novel insight into the mechanism regulating TSC1‐TSC2 interaction. Our findings also implicate that targeting Peli1 may be an effective approach to boost CD8 T cell functions in cancer immunotherapy.
Materials and Methods
Mice
OT‐I TCR transgenic mice (in C57BL/6 background) were purchased from The Jackson Laboratory. The Peli1‐targeted mice, Peli1tm1a(EUCOMM)Wtsi (in C57BL/6N genetic background), were created from ES cell clone Peli1_B06 generated by the European Conditional Mouse Mutagenesis Program and made into mice by the KOMP Repository (www.komp.org) and the Mouse Biology Program (www.mousebiology.org) at the University of California Davis. Methods used to create EUCOMM targeted alleles were as described (Testa, Schaft et al, 2004). Live mice were generated in the Genetically Engineered Mouse Facility of MD Anderson Cancer Center using the sperms obtained from KOMP. The Peli1‐targeted mice were crossed with FLP deleter mice (Rosa26‐FLPe; C57BL/6J background; Jackson Laboratory) to produce Peli1‐flox mice, which were further crossed with Cd4‐Cre, Cd19‐Cre, Lyz2‐Cre, and Foxp3‐Cre mice (all from Jackson Laboratory) to generate conditional KO mice with Peli1 specifically deleted in T cells (Peli1fl/flCd4‐Cre; TKO), B cells (Peli1fl/flCd19‐Cre; BKO), myeloid cells (Peli1fl/flLyz2‐Cre; MKO), and Treg cells (Peli1fl/flFoxp3‐Cre; Treg KO), respectively.
For inducible deletion of Peli1 in adult mice (Peli1‐iKO), the Peli1‐flox mice were crossed with ROSA26‐CreER mice (Jackson Laboratories) to produce Peli1fl/flCreER and Peli1+/+CreER mice, which were then injected with the Cre inducer tamoxifen (i.p., 2 mg/mouse) daily for four consecutive days. Peli1 germline KO (Peli1‐KO) mice were obtained from KOMP (Peli1tm1a(EUCOMM)Wtsi post‐Cre). For producing experimental animals, Peli1 heterozygous (Peli1+/− or Peli1fl/+) mice were bred to generate age‐matched Peli1 homozygous KO or conditional KO and wild‐type control mice. Primers used for genotyping are listed in Appendix Table S1. Mice were maintained in specific pathogen‐free facility, and all animal experiments were in accordance with protocols approved by the Institutional Animal Care and Use Committee of the University of Texas MD Anderson Cancer Center.
Plasmids, antibodies, and reagents
Expression vectors for HA‐tagged Peli1 and Etag‐Peli1 were described previously (Chang et al, 2011). Peli1ΔC is a truncation mutant that lacks the C‐terminal 138 amino acids covering the RING domain of Peli1. pRK7‐FLAG‐TSC1, pRK7‐FLAG‐TSC2, pcDNA3‐myc3‐TSC1, pcDNA3‐FLAG‐LKB1, pcDNA3‐His‐AMPKα1, pcDNA3‐myc‐AMPKα2, and pRK5‐HA‐Ubiquitin‐WT were purchased from Addgene. The pRK7‐FLAG‐TSC1 and pcDNA3‐myc3‐TSC1 were used as templates to generate human TSC1 point mutants, K30A and K632A, by site‐directed mutagenesis using a QuickChange II Site‐Directed Mutagenesis Kit (Agilent) and the primers listed in Appendix Table S2. PMA (phorbol 12‐myristate 13‐acetate) and ionomycin were purchased from Sigma, and rapamycin (9904S) was from Cell Signaling Technology. Human insulin was obtained from Sigma‐Aldrich (I9278), and mouse EGF was from R&D systems (2028‐EG). Tat‐Beclin 1 (Catalog 506048) and Tat‐Scrambled (Catalog 531038) peptides were from Calbiochem.
Functional‐grade anti‐mouse (m) CD3ε (145‐2C11) and anti‐mCD28 (37.51) were obtained from eBioscience, and goat anti‐hamster IgG (H + L) was from Southern Biotech. Anti‐ubiquitin (P4D1, SC‐8017), anti‐LKB1 (SC‐32245), and anti‐Peli1 (also detects Peli2) (F‐7) were from Santa Cruz Biotechnology. Anti‐actin (A2228), anti‐LC3 (L7543), and horseradish peroxidase‐conjugated anti‐Flag (M2, A5892) were from Sigma‐Aldrich. Horseradish peroxidase‐conjugated ubiquitin antibodies, Lys48‐specific (Apu2, 05‐1307) and Lys63‐specific (Apu3, 05‐1308), were from EMD Millipore corp. Antibodies for phospho‐AKT1 S473 (D9E), phospho‐AKT1 T308 (C31E5E, 2965L), phospho‐S6K1 Thr421/Ser424 (9204L), phospho‐S6K1 Thr389 (9205S), phospho‐S6 Ser235/236 (D57.2.2E, 4858L), phospho‐4EBP1 Thr37/46 (236B4, 2855S), S6K1 (49D7, 2708S), S6 (54D2, 2317S), 4EBP1 (9452S), TSC1 (1B2, 4963S), TSC2 (D93F12, 4308S), HK2 (C64G5, 2867S), α‐tubulin (2144S), Glut1 (D3J3A, 12939S), Hif1α (D2U3T, 14179S), c‐Myc (9402S), p‐LKB1 S428 (3482), and p‐AMPK T172 (2535) were purchased from Cell Signaling Technology. Horseradish peroxidase‐conjugated antibodies for HA (HA‐7) were from Roche. Horseradish peroxidase‐conjugated antibodies for E Tag (PA1‐21895) and anti‐TSC1 (370400) were purchased from Invitrogen.
Cell lines
Human embryonic kidney cell line 293T, melanoma cell lines B16F10 and B16‐OVA, and thymoma cell line E.G7‐OVA were originally obtained from the American Type Culture Collection (ATCC). Peli1+/+ and Peli1–/– MEF cells were prepared as previously described (Chang et al, 2009). TSC1–/– MEFs were generated by treating TSC1fl/flCreER MEFs (provided by Boyi Gan, MD Anderson cancer center) with 4‐hydroxytamoxifen (4‐OHT; 200 nM) for four days. The cell lines were cultured in DMEM supplemented with 10% FBS.
Flow cytometry and intracellular cytokine staining
Single‐cell suspensions were prepared from the indicated lymphoid organs or tumor tissues. The cells were stained with fluorescence‐conjugated antibodies and subjected to flow cytometry or cell sorting essentially as previously described (Reiley, Jin et al, 2007) using LSR II (BD Bioscience) and FACSJazz (BD Bioscience) flow cytometers, respectively. For intracellular cytokine staining (ICS), single‐cell suspensions were stimulated for 4 hours with PMA plus ionomycin in the presence of a protein secretion inhibitor, monensin, and then subjected to intracellular staining and flow cytometry. Flow cytometry data were analyzed using FlowJo software.
Metabolic assays
ECAR and OCR were measured by using an XF96 extracellular flux analyzer (Seahorse Bioscience) as previously described (Zhou, Yu et al, 2019). In brief, freshly isolated or in vitro activated (18 h with anti‐CD3 and anti‐CD28) CD8 T cells were seeded in XF96 microplates (300,000 cells per well) and immobilized by centrifugation (10 min at 500G). After incubation for 30 min with a non‐buffered assay medium (Seahorse Biosciences) in an incubator without CO2, the cells were subjected to glycolysis assays with an XF glycolysis stress test kit (Seahorse Biosciences) to measure background noise level (without glucose), basal ECAR (after injection with glycose), and maximal ECAR (after injection with oligomycin). A Mito stress test kit (Seahorse Biosciences) was used to measure basal OCR (no treatment) and maximum OCR (injection with oligomycin followed by FCCP).
qRT–PCR
RNA was extracted with TRIzol reagent from isolated CD8+ T cells and subjected to qRT–PCR analyses using SYBR reagent (Bio‐Rad) and the gene‐specific primer sets are listed in Appendix Table S3. Gene expression was assessed in triplicate and normalized to a reference gene, Actβ.
Analysis of TCR signaling
Purified T cells were stimulated with anti‐CD3 and anti‐CD28 using a crosslinking method described previously (Reiley et al, 2007). Briefly, the cells were incubated for 15 min on ice with anti‐CD3 (2 μg/ml) and anti‐CD28 (2 μg/ml) in RPMI medium containing 1% FBS, and after a wash with cold medium, incubated for another 15 min on ice with a secondary antibody (goat anti‐hamster immunoglobulin, 25 μg/ml). The cells were stimulated for the indicated time periods by moving to a 37ºC water bath. In some experiments, rapamycin (10 nM) or Torin 1 (100 nM) was added during the steps of incubation and stimulation. Stimulated T cells were immediately lysed for immunoblot analysis of protein phosphorylation. For longer time stimulation, T cells were incubated for 24 h with plate‐bound anti‐CD3 (1 μg/ml) and anti‐CD28 (1 μg/ml).
Immunoblot, co‐immunoprecipitation, and ubiquitination assays
T cells and other indicated cells were lysed in RIPA buffer containing 50 mM Tris–HCl (pH 7.4), 150 mM NaCl, 1% NP‐40, 0.5% sodium deoxycholate, 1 mM EDTA, 1 mM dithiothreitol, 1 mM sodium orthovanadate, 5 mM sodium fluoride, 20 mM p‐nitrophenyl phosphate, 1 mM phenylmethylsulfonyl fluoride, 1mg/ml pepstatin, and 1 mg/ml aprotinin. The whole‐cell lysates were subjected to immunoblot and co‐immunoprecipitation assays as described (Xiao, Harhaj et al, 2001). For immunoblot analysis of phosphorylated proteins, the RIPA lysis buffer was also supplemented with phosphatase inhibitors (1 mM sodium orthovanadate, 5 mM sodium fluoride, 20 mM p‐nitrophenyl phosphate). The density of the protein bands in photographic films was quantified by using the ImageJ software.
For ubiquitination assays, T cells or transiently transfected 293T cells were lysed in RIPA buffer supplemented with 4 mM N‐ethylmaleimide. The cell lysates were immediately boiled for 5 min in the presence of 1% (vol/vol) SDS, diluted ten times with RIPA buffer, and subjected to immunoprecipitation using the indicated antibodies and protein A or protein G agarose beads. After 5 washes with RIPA buffer, the precipitated proteins were subjected to SDS–PAGE and immunoblot analysis using antibodies detecting total ubiquitin chains, K48‐linked ubiquitin chains, or K63‐linked ubiquitin chains. For identifying the ubiquitination sites of TSC1, 293T cells were transiently transfected with HA‐ubiquitin and flag‐TSC1 in the presence or absence of ETag‐Peli1. After 48 h, the cells were lysed for ubiquitination assay. The samples were subjected to mass spectrometry analysis by the Taplin Mass Spectrometry Facility at Harvard University.
Identification of ubiquitination sites by mass spectrometry
A total of 293 cells were transfected with HA‐ubiquitin and Flag‐TSC1 in the presence or absence of ETag‐Peli1. After 48 h, TSC1 was isolated by immunoprecipitation using anti‐Flag and fractionated by SDS–PAGE. The gel was stained with Coomassie blue, and the ubiquitinated Flag‐TSC1 (a large molecular smear) was excised from the gel and subjected to mass spectrometry analysis in the Mass Spectrometry Facility of Harvard University. Briefly, the gel bands were reduced with 1 mM DTT, alkylated with 5 mM iodoacetamide, and then subjected to in‐gel trypsin digestion as described (Shevchenko, Wilm et al, 1996). Peptides were extracted and subjected to liquid chromatography tandem mass spectrometry (LC‐MS/MS) (Peng & Gygi, 2001). Peptides were detected, isolated, and fragmented to produce a tandem mass spectrum of specific fragment ions for each peptide. Peptide sequences were determined by matching protein or translated nucleotide databases with the acquired fragmentation pattern by the Sequest software (ThermoFinnigan, San Jose, CA) (Eng, McCormack et al, 1994). For determining ubiquitin‐modified peptides, the modification of 114.0429 mass units to lysine was included in the database searches. All databases contain a reversed version of all the sequences with the data being filtered to a one percent or lower peptide false discovery rate.
Autophagy assays
Autophagy assays were performed based on conversion of microtubule‐associated protein 1 light chain (LC3) from a cytosolic form (LC3‐I) to a lapidated form (LC3‐II), a central step of autophagic flux (Mizushima, 2007). Briefly, wild‐type and Peli1‐KO T cells were activated with anti‐CD3 and anti‐CD28 for 2 h and then incubated for the indicated time points with E64D and pepstasin A, cathepsin inhibitors known to block degradation of LC3II in the lysosome (Tanida, Minematsu‐Ikeguchi et al, 2005). The level of LC3‐I and LC3‐II was analyzed by immunoblot assays.
TSC1 and TSC2 stability analysis
Purified CD8 T cells were activated for 1 hours with plate‐bound anti‐CD3 and anti‐CD28 Abs. The cells were treated with the protein synthesis inhibitor cycloheximide for the indicated time periods, and the samples were then subjected to immunoblot analysis of TSC1 and TSC2 proteins. In some experiments, the cells were incubated for 2 h with cycloheximide in the presence of MG132 to test the involvement of proteasome in the degradation of TSC1 and TSC2. The level of TSC1 and TSC2 protein in photographic films was quantified by densitometry using the ImageJ software.
Tumor models
B16F10 and B16‐OVA (B16 expressing OVA) melanoma cells were cultured in DMEM supplemented with 10% FBS; E.G7 cells (a derivative of EL4 thymoma cells expressing OVA) were maintained in RPMI 1640 medium supplemented with 10% FBS. These tumor cells were injected s.c. into the dorsal flank of the indicated mice (2 × 10⁵ for B16F10 and B16‐OVA cells and 5 x 10⁵ for E.G7 cells in 200 μl PBS), and the challenged mice were monitored for tumor growth. Mice with a tumor size reaching 225 mm2 were considered lethal and sacrificed according to protocols approved by the Institutional Animal Care and Use Committee of the University of Texas MD Anderson Cancer Center. Age‐ and sex‐matched, mostly littermate, WT and Peli1 KO mice were used to minimize individual variations.
Tumor‐infiltrating lymphocyte (TIL) isolation and analysis
Tumors were pressed in complete RPMI 1640, and cell suspensions were collected by centrifugation (300 × g, 10 min), washed once, and resuspended in complete RPMI 1640 containing collagenase IV (0.05%; Roche Applied Science) and DNase I (100 μg/ml; Roche Applied Science). The cell suspensions were incubated at 37°C for 30‐40 min, and the cell suspensions were passed through a 70‐μm nylon cell strainer to prepare single‐cell suspensions. For intracellular cytokine staining (ICS), TILs were stimulated for 4 h with PMA plus ionomycin in the presence of a protein transport inhibitor, monensin (1:1,000), and then subjected to ICS and flow cytometry analyses. CD45+ cells (TILs) were sorted for further analysis.
Statistical and reproducibility
Statistical analyses were performed using Prism (GraphPad v.8.0.0). For tumor growth, the differences between groups were determined by a two‐way ANOVA with Bonferroni correction. All other statistical analyses were performed by a two‐tailed unpaired t‐test. P values of less than 0.05 were considered significant in all studies with the level of significance being denoted as *P < 0.05; **P < 0.01; ***P < 0.001. Each experiment was repeated independently with similar results, and the number of independent experiments and number of animals in each experiment are indicated in figure legends.
Author contributions
C‐JK designed and performed the experiments, prepared the figures, and wrote part of the manuscript; LZha, ZJ, LZhu, XZ, XX, TG, J‐YY, and XC contributed to the performance of the experiments. S‐CS supervised the work and wrote the manuscript.
Conflict of interest
The authors declare that they have no conflict of interest.
Supporting information
Appendix
Expanded View Figures PDF
Source Data for Expanded View
Review Process File
Source Data for Figure 3
Source Data for Figure 4
Source Data for Figure 5
Source Data for Figure 6
Source Data for Figure 7
Acknowledgements
We thank KOMP and EUCOMM for the Peli1‐targeted mice. This work was supported by grants from the National Institutes of Health (AI104519 and AI64639). This study also used the NIH/NCI‐supported resources under award number P30CA016672 at The MD Anderson Cancer Center. T.G. was a visiting student supported by a scholarship from the China Scholarship Council with the grant number of 201906380080.
The EMBO Journal (2021) 40: e104532.
Data availability
The mass spectrometry data from this publication have been deposited to the PRIDE database (https://www.ebi.ac.uk/pride/) and assigned the identifier (accession: PXD020734).
References
- Aagaard L, Lukas J, Bartkova J, Kjerulff AA, Strauss M, Bartek J (1995) Aberrations of p16Ink4 and retinoblastoma tumour‐suppressor genes occur in distinct sub‐sets of human cancer cell lines. Int J Cancer 61: 115–120 [DOI] [PubMed] [Google Scholar]
- Almeida L, Lochner M, Berod L, Sparwasser T (2016) Metabolic pathways in T cell activation and lineage differentiation. Semin Immunol 28: 514–524 [DOI] [PubMed] [Google Scholar]
- Benvenuto G, Li S, Brown SJ, Braverman R, Vass WC, Cheadle JP, Halley DJ, Sampson JR, Wienecke R, DeClue JE (2000) The tuberous sclerosis‐1 (TSC1) gene product hamartin suppresses cell growth and augments the expression of the TSC2 product tuberin by inhibiting its ubiquitination. Oncogene 19: 6306–6316 [DOI] [PubMed] [Google Scholar]
- Buck MD, Sowell RT, Kaech SM, Pearce EL (2017) Metabolic Instruction of Immunity. Cell 169: 570–586 [DOI] [PMC free article] [PubMed] [Google Scholar]
- Chang CH, Curtis JD, Maggi LB Jr, Faubert B, Villarino AV, O'Sullivan D, Huang SC, van der Windt GJ, Blagih J, Qiu J et al (2013) Posttranscriptional control of T cell effector function by aerobic glycolysis. Cell 153: 1239–1251 [DOI] [PMC free article] [PubMed] [Google Scholar]
- Chang M, Jin W, Chang JH, Xiao Y, Brittain GC, Yu J, Zhou X, Wang YH, Cheng X, Li P et al (2011) The ubiquitin ligase Peli1 negatively regulates T cell activation and prevents autoimmunity. Nat Immunol 12: 1002–1009 [DOI] [PMC free article] [PubMed] [Google Scholar]
- Chang M, Jin W, Sun SC (2009) Peli1 facilitates TRIF‐dependent Toll‐like receptor signaling and proinflammatory cytokine production. Nat Immunol 10: 1089–1095 [DOI] [PMC free article] [PubMed] [Google Scholar]
- Chi H (2012) Regulation and function of mTOR signalling in T cell fate decisions. Nat Rev Immunol 12: 325–338 [DOI] [PMC free article] [PubMed] [Google Scholar]
- Chong‐Kopera H, Inoki K, Li Y, Zhu T, Garcia‐Gonzalo FR, Rosa JL, Guan KL (2006) TSC1 stabilizes TSC2 by inhibiting the interaction between TSC2 and the HERC1 ubiquitin ligase. J Biol Chem 281: 8313–8316 [DOI] [PubMed] [Google Scholar]
- Cunha LD, Yang M, Carter R, Guy C, Harris L, Crawford JC, Quarato G, Boada‐Romero E, Kalkavan H, Johnson MDL et al (2018) LC3‐associated phagocytosis in myeloid cells promotes tumor immune tolerance. Cell 175(2): 429–441. [DOI] [PMC free article] [PubMed] [Google Scholar]
- DeVorkin L, Pavey N, Carleton G, Comber A, Ho C, Lim J, McNamara E, Huang H, Kim P, Zacharias LG et al (2019) Autophagy regulation of metabolism is required for CD8(+) T cell anti‐tumor immunity. Cell Rep 27(2): 502–513. [DOI] [PubMed] [Google Scholar]
- Durgeau A, Virk Y, Corgnac S, Mami‐Chouaib F (2018) Recent advances in targeting CD8 T‐cell immunity for more effective cancer immunotherapy. Front Immunol 9: 14 [DOI] [PMC free article] [PubMed] [Google Scholar]
- Eng JK, McCormack AL, Yates JR (1994) An approach to correlate tandem mass spectral data of peptides with amino acid sequences in a protein database. J Am Soc Mass Spectrom 5: 976–989 [DOI] [PubMed] [Google Scholar]
- Gnanaprakasam JNR, Sherman JW, Wang R (2017) MYC and HIF in shaping immune response and immune metabolism. Cytokine Growth Factor Rev 35: 63–70 [DOI] [PubMed] [Google Scholar]
- Huang J, Manning BD (2008) The TSC1‐TSC2 complex: a molecular switchboard controlling cell growth. Biochem J 412: 179–190 [DOI] [PMC free article] [PubMed] [Google Scholar]
- Inoki K, Li Y, Zhu T, Wu J, Guan KL (2002) TSC2 is phosphorylated and inhibited by Akt and suppresses mTOR signalling. Nat Cell Biol 4: 648–657 [DOI] [PubMed] [Google Scholar]
- Jin W, Chang M, Sun SC (2012) Peli: a family of signal‐responsive E3 ubiquitin ligases mediating TLR signaling and T‐cell tolerance. Cell Mol Immunol 9: 113–122 [DOI] [PMC free article] [PubMed] [Google Scholar]
- Kim YC, Guan KL (2015) mTOR: a pharmacologic target for autophagy regulation. J Clin Invest 125: 25–32 [DOI] [PMC free article] [PubMed] [Google Scholar]
- Li X, Wenes M, Romero P, Huang SC, Fendt SM, Ho PC (2019) Navigating metabolic pathways to enhance antitumour immunity and immunotherapy. Nat Rev Clin Oncol 16: 425–441 [DOI] [PubMed] [Google Scholar]
- Lunt SY, Vander Heiden MG (2011) Aerobic glycolysis: meeting the metabolic requirements of cell proliferation. Annu Rev Cell Dev Biol 27: 441–464 [DOI] [PubMed] [Google Scholar]
- Maciver NJ, Michalek RD, Rathmell JC (2013) Metabolic regulation of T lymphocytes. Annu Rev Immunol 31: 259–283 [DOI] [PMC free article] [PubMed] [Google Scholar]
- Menk AV, Scharping NE, Moreci RS, Zeng X, Guy C, Salvatore S, Bae H, Xie J, Young HA, Wendell SG et al (2018) Early TCR signaling induces rapid aerobic glycolysis enabling distinct acute T cell effector functions. Cell Rep 22: 1509–1521 [DOI] [PMC free article] [PubMed] [Google Scholar]
- Mizushima N (2007) Autophagy: process and function. Genes Dev 21: 2861–2873 [DOI] [PubMed] [Google Scholar]
- Moynagh PN (2009) The Pellino family: IRAK E3 ligases with emerging roles in innate immune signalling. Trends Immunol 30: 33–42 [DOI] [PubMed] [Google Scholar]
- Moynagh PN (2014) The roles of Pellino E3 ubiquitin ligases in immunity. Nat Rev Immunol 14: 122–131 [DOI] [PubMed] [Google Scholar]
- O'Brien TF, Gorentla BK, Xie D, Srivatsan S, McLeod IX, He YW, Zhong XP (2011) Regulation of T‐cell survival and mitochondrial homeostasis by TSC1. Eur J Immunol 41: 3361–3370 [DOI] [PMC free article] [PubMed] [Google Scholar]
- Pearce EL, Poffenberger MC, Chang CH, Jones RG (2013) Fueling immunity: insights into metabolism and lymphocyte function. Science 342: 1242454 24115444 [Google Scholar]
- Peng J, Gygi SP (2001) Proteomics: the move to mixtures. J Mass Spectrom 36: 1083–1091 [DOI] [PubMed] [Google Scholar]
- Poillet‐Perez L, Xie X, Zhan L, Yang Y, Sharp DW, Hu ZS, Su X, Maganti A, Jiang C, Lu W et al (2018) Autophagy maintains tumour growth through circulating arginine. Nature 563: 569–573 [DOI] [PMC free article] [PubMed] [Google Scholar]
- Pollizzi KN, Powell JD (2014) Integrating canonical and metabolic signalling programmes in the regulation of T cell responses. Nat Rev Immunol 14: 435–446 [DOI] [PMC free article] [PubMed] [Google Scholar]
- Reiley WW, Jin W, Lee AJ, Wright A, Wu X, Tewalt EF, Leonard TO, Norbury CC, Fitzpatrick L, Zhang M et al (2007) Deubiquitinating enzyme CYLD negatively regulates the ubiquitin‐dependent kinase Tak1 and prevents abnormal T cell responses. J Exp Med 204: 1475–1485 [DOI] [PMC free article] [PubMed] [Google Scholar]
- Rivadeneira DB, Delgoffe GM (2018) Antitumor T‐cell reconditioning: improving metabolic fitness for optimal cancer immunotherapy. Clin Cancer Res 24: 2473–2481 [DOI] [PMC free article] [PubMed] [Google Scholar]
- Shevchenko A, Wilm M, Vorm O, Mann M (1996) Mass spectrometric sequencing of proteins silver‐stained polyacrylamide gels. Anal Chem 68: 850–858 [DOI] [PubMed] [Google Scholar]
- Shoji‐Kawata S, Sumpter R, Leveno M, Campbell GR, Zou Z, Kinch L, Wilkins AD, Sun Q, Pallauf K, MacDuff D et al (2013) Identification of a candidate therapeutic autophagy‐inducing peptide. Nature 494: 201–206 [DOI] [PMC free article] [PubMed] [Google Scholar]
- Smith‐Garvin JE, Koretzky GA, Jordan MS (2009) T cell activation. Annu Rev Immunol 27: 591–619 [DOI] [PMC free article] [PubMed] [Google Scholar]
- Tanida I, Minematsu‐Ikeguchi N, Ueno T, Kominami E (2005) Lysosomal turnover, but not a cellular level, of endogenous LC3 is a marker for autophagy. Autophagy 1: 84–91 [DOI] [PubMed] [Google Scholar]
- Testa G, Schaft J, van der Hoeven F, Glaser S, Anastassiadis K, Zhang Y, Hermann T, Stremmel W, Stewart AF (2004) A reliable lacZ expression reporter cassette for multipurpose, knockout‐first alleles. Genesis 38: 151–158 [DOI] [PubMed] [Google Scholar]
- Waickman AT, Powell JD (2012) Mammalian target of rapamycin integrates diverse inputs to guide the outcome of antigen recognition in T cells. J Immunol 188: 4721–4729 [DOI] [PMC free article] [PubMed] [Google Scholar]
- Wang J, Saffold S, Cao X, Krauss J, Chen W (1998) Eliciting T cell immunity against poorly immunogenic tumors by immunization with dendritic cell‐tumor fusion vaccines. J Immunol 161: 5516–5524 [PubMed] [Google Scholar]
- Xiao G, Harhaj EW, Sun SC (2001) NF‐kappaB‐inducing kinase regulates the processing of NF‐kappaB2 p100. Mol Cell 7: 401–409 [DOI] [PubMed] [Google Scholar]
- Yang A, Herter‐Sprie G, Zhang H, Lin EY, Biancur D, Wang X, Deng J, Hai J, Yang S, Wong KK et al (2018) Autophagy sustains pancreatic cancer growth through both cell‐autonomous and nonautonomous mechanisms. Cancer Discov 8: 276–287 [DOI] [PMC free article] [PubMed] [Google Scholar]
- Yang K, Chi H (2012) mTOR and metabolic pathways in T cell quiescence and functional activation. Semin Immunol 24: 421–428 [DOI] [PMC free article] [PubMed] [Google Scholar]
- Zeng H, Chi H (2014) mTOR signaling and transcriptional regulation in T lymphocytes. Transcription 5: e28263 [DOI] [PMC free article] [PubMed] [Google Scholar]
- Zhou X, Yu J, Cheng X, Zhao B, Manyam GC, Zhang L, Schluns K, Li P, Wang J, Sun SC (2019) The deubiquitinase Otub1 controls the activation of CD8(+) T cells and NK cells by regulating IL‐15‐mediated priming. Nat Immunol 20: 879–889 [DOI] [PMC free article] [PubMed] [Google Scholar]
Associated Data
This section collects any data citations, data availability statements, or supplementary materials included in this article.
Supplementary Materials
Appendix
Expanded View Figures PDF
Source Data for Expanded View
Review Process File
Source Data for Figure 3
Source Data for Figure 4
Source Data for Figure 5
Source Data for Figure 6
Source Data for Figure 7
Data Availability Statement
The mass spectrometry data from this publication have been deposited to the PRIDE database (https://www.ebi.ac.uk/pride/) and assigned the identifier (accession: PXD020734).


