

SUMMARY
Here, we report that functional heterogeneity of macrophages in cancer could be determined by the nature of their precursors: monocytes (Mons) and monocytic myeloid-derived suppressor cells (M-MDSCs). Macrophages that are differentiated from M-MDSCs, but not from Mons, are immune suppressive, with a genomic profile matching that of M-MDSCs. Immune-suppressive activity of M-MDSC-derived macrophages is dependent on the persistent expression of S100A9 protein in these cells. S100A9 also promotes M2 polarization of macrophages. Tissue-resident- and Mon-derived macrophages lack expression of this protein. S100A9-dependent immune-suppressive activity of macrophages involves transcription factor C/EBPβ. The presence of S100A9-positive macrophages in tumor tissues is associated with shorter survival in patients with head and neck cancer and poor response to PD-1 antibody treatment in patients with metastatic melanoma. Thus, this study reveals the pathway of the development of immune-suppressive macrophages and suggests an approach to their selective targeting.
In Brief
Kwak et al. report that tumor immune-suppressive macrophages differentiate from the population of myeloid-derived suppressor cells (MDSCs). This effect is dependent on the persistent expression of S100A9 protein. The presence of S100A9-positive macrophages in tumors is associated with shorter survival and poor response to immunotherapy of cancer patients.
Graphical Abstract

INTRODUCTION
Myeloid cells are one of the major components of the tumor microenvironment (TME), contributing to tumor progression and limiting the success of cancer therapies. Tumor-associated macrophages (TAMs) and myeloid-derived suppressor cells (MDSCs) are the largest groups of myeloid cells in the TME. TAMs are a heterogeneous group of cells with diverse genomics and functional characteristics (Cassetta and Pollard, 2018; Pathria et al., 2019; Pinto et al., 2019). TAMs can promote tumor progression via various mechanisms, including suppression of T cells. However, some reports suggested a positive correlation between TAM infiltration and favorable clinical outcome (Kielbassa et al., 2019).
Under steady-state conditions, the population of macrophages in different tissues includes a larger population of tissue-resident (TR) macrophages and a smaller population of bone-marrow-derived macrophages (BMDMs). Genetic tracing studies revealed that TR macrophages were developed from embryonic progenitors and were able to self-renew (Schulz et al., 2012; Yona et al., 2013). In inflammatory conditions, and especially in cancer, most newly differentiated macrophages originated from BMD monocytic cells (Cortez-Retamozo et al., 2012). The immune landscape of many tumors displayed a more prominent M2-like macrophage signature (Thorsson et al., 2018). However, this characterization finds limitations in complex environments in vivo in which M1 and M2 stimuli can be present and generate very dynamic microanatomical niches (Sica et al., 2015). In tumors, space availability and growth factor expression are changing over time (Lyssiotis and Kimmelman, 2017), resulting in changing characteristics of TAMs (Murray et al., 2014; Xue et al., 2014). In most cases, the impaired accumulation of macrophages in the TME was associated with better control of the tumor and reduced metastatic dissemination (Lim et al., 2016; Qian et al., 2011; Sajti et al., 2020; Sanford et al., 2013). Most studies rely on transcriptomic analysis and highlight functional profiles of resident versus recruited TAMs that cannot be fully associated with their origin across the different models. In addition, very little information is available regarding immune suppression, which is a key feature of TAM biology.
Monocytic cells are precursors of BMDMs. In cancer, the population of monocytic cells consists of classical monocytes (Mons) and monocytic MDSCs (M-MDSCs). Both populations can differentiate to BMDMs (Bronte, 2019). M-MDSCs are pathologically activated Mons, with distinct functional, biochemical, and phenotypic characteristics (Binnewies et al., 2018; Veglia et al., 2018). MDSCs–which, in addition to M-MDSCs, include the population of pathologically activated neutrophils (PMN-MDSCs)–are not only an important component of negative regulation of immune responses, but also contribute to other aspects of tumor growth and metastasis, including the formation of premetastatic niche (Lu et al., 2020; Condamine et al., 2015). Accumulation of these cells is closely associated with negative clinical outcomes and failure of cancer immunotherapy (Wang et al., 2018). In cancer patients, at any given moment, the populations of Mons and M-MDSCs co-exist, and their balance can be critical for defining clinical outcome (Veglia et al., 2018). In this study, we tried to determine the impact of monocytic precursors on functional characteristics of macrophages. Surprisingly, we found that the immune-suppressive function of macrophages was largely dependent on the nature their precursors. Even in the absence of tumor-derived factors or conditions associated with the TME, M-MDSC-derived macrophages, in contrast to Mon-derived macrophages, retained immune-suppressive activity and gene expression profile of their precursors. We identified the possible mechanism of this phenomenon as persistent expression of S100A9 protein. We determined the molecular mechanism of the effect of S100A9 on macrophage function and demonstrated a close association between the presence of S100A9+ TAMs and clinical outcome in cancer patients.
RESULTS
Mons and M-MDSCs Differentiate to Functionally Distinct Macrophages
Mons and M-MDSCs were sorted from peripheral blood of the patients with non-small-cell lung cancer, colon cancer, or head and neck cancer based on a set of established criteria (CD14+CD15−HLA-DRhi Mons and CD14+CD15−HLA-DRlo/− M-MDSCs) (Bronte et al., 2016) (Figure S1A). Cells were cultured for 7 days in complete medium with GM-CSF. The purity of macrophages derived from Mons and M-MDSCs (>90%) was verified by the expression of CD68 marker (Figure S1B). To assess the differences between Mon- and M-MDSC-derived macrophages, we evaluated the expression of the genes known to be associated with M-MDSCs. Macrophages differentiated from M-MDSCs had substantially higher expression of S100A9, NOS2, ARG1, SIGLEC10, and S100P than did macrophages generated from Mons of the same patients (Figure 1A). Expression of S100A9 in macrophages was especially notable. Upregulation of S100A8/A9 is one of the hallmarks that distinguishes M-MDSCs from Mons (Gabrilovich, 2017; Mastio et al., 2019; Zhao et al., 2012). However, this protein is mostly absent in mature macrophages and DCs, lymphocytes, fibroblasts, and endothelial cells (Austermann et al., 2018; Cheng et al., 2008; Gebhardt et al., 2006). M-MDSC-derived macrophages had higher amounts of S100A9, NOS2, PD-L1, and ARG1 proteins and markedly lower amounts of HLA-DR than did Mon-derived macrophages (Figure 1B). Macrophages differentiated from M-MDSCs were potently immune-suppressive cells, whereas macrophages generated from Mons had minimal suppressive activity (Figure 1C). We asked whether the presence of tumor-derived factors during macrophage differentiation could recapitulate this phenomenon. Mons and M-MDSCs from heathy donors or cancer patients were cultured for 7 days with GM-CSF in the presence of tumor-explant supernatants (TESs) from resected tumors. Macrophages generated from Mons or M-MDSCs with TESs had the same expression of NOS2, S100A9, and ARG1, as well as HLA-DR, CD206, and CD80 proteins, as did macrophages derived from Mons or M-MDSCs not exposed to TESs (Figure 1D). Thus, macrophages derived from M-MDSCs were distinct from macrophages derived from Mons and display characteristics of suppressive cells.
Figure 1. Mons and M-MDSCs Differentiate to Functionally Distinct Macrophages in Cancer Patients.

(A) Relative mRNA expression of indicated genes in macrophages derived from M-MDSCs and Mons. For each patient, gene expression in macrophages derived from Mons was set as 1. Results of individual patients are shown (n = 6–9).
(B) Relative protein expression (geometric mean) of indicated proteins in macrophages derived from M-MDSCs and Mons. For each patient, protein expression in macrophages derived from Mons was set as 1. Results of individual patients are shown (n = 3–11). p values in Mann-Whitney test are shown.
(C) T cell proliferation stimulated by anti-CD3/CD28 dynabeads in the presence of macrophages derived from M-MDSCs or Mons measured in triplicate. CPM, counts per minute. Three experiments with similar results were performed. p values in unpaired two-tailed Student’s t test are shown.
(D) Relative expression of indicated genes and proteins in macrophages derived from Mons or M-MDSCs in the presence or absence of TESs. For each individual, gene or protein expression in macrophages differentiated from Mons in the absence of TESs was set as 1 (n = 3–7).
To verify that Mon- and M-MDSC-derived macrophages had different gene expression profiles, we have performed unbiased transcriptome analysis of Mon- and M-MDSC-derived macrophages using RNA sequencing. Our previous study described differences in gene expression between M-MDSCs and Mons (Mastio et al., 2019). We asked whether these differences were preserved in macrophages differentiated from these cells. We found 443 genes that were differentially expressed in macrophages derived from M-MDSCs as compared to Mon-derived macrophages. A significant proportion of those genes (16%, 72 genes; 2.3-fold more than expected by chance; p = 2 × 10⁻¹³ by Fisher’s exact test) were also different between M-MDSCs and Mons (Figure S1C). A list of the most changed genes is shown in Figure S1D.
Then, we asked whether a similar phenomenon was observed in mice. In tumor-free mice, BMDM precursors with phenotype CD11b+Ly6ChiLy6G−F4/80− are defined as Mons and in tumor-bearing (TB) mice as M-MDSCs due to the acquisition of immune-suppressive activity and the numbers of other functional, genomic, and biochemical characteristics (Bronte et al., 2016). We isolated Mons from spleens of naive mice and M-MDSCs with the same phenotype from spleens of EL4 TB mice. As expected, Mons did not suppress the proliferation of CD3/CD28-induced T cells, whereas M-MDSCs were potently suppressive (Figure 2A). Cells were then cultured for 6 days in complete medium supplemented with macrophage colony stimulating factor (M-CSF). Macrophages were isolated based on CD11b+F4/80+Ly6CloLy6G− phenotype and then used in suppression assay against CD3/CD28-activated T cells. Mons and M-MDSCs produced macrophages with similar purity (Figure S2A). Mon-derived macrophages lacked T cell suppressive activity, whereas macrophages derived from M-MDSCs were suppressive (Figure 2B). In mice, M-MDSCs are characterized by high expression of several genes and proteins involved in immune suppression (Arg1, Nos2, and Ptgs2) as well as S100A9 (Bronte et al., 2016). We found that macrophages derived from M-MDSCs had substantially higher expression of Arg1 and Ptgs2 but lower Nos2 than Mon-derived macrophages (Figure 2C). Since M-MDSC-derived macrophages had high expression of Arg1 and Ptgs2, we tested a possible role of arginase and prostaglandin E2 (PGE2) in suppressive activity of macrophages by using arginase 1 inhibitor Nor-NOHA and COX2 inhibitor Celecoxib. Both inhibitors reduced suppressive activity of TAMs (Figure S2B), suggesting that ARG1 and PGE2 play an important and non-redundant role in the suppressive activity of TAMs differentiated from M-MDSCs.
Figure 2. Mons and M-MDSCs Differentiate to Functionally Distinct Macrophages in Mice.

(A) Proliferation of splenocytes in the presence of CD3/CD28 and Mons from naive mice or M-MDSCs from EL4 TB mice.
(B) Proliferation of OT-1 splenocytes in response to specific peptides in the presence of Mon-derived or M-MDSC-derived macrophages. In (A) and (B), T cell proliferation was measured in triplicate by CPM of incorporation of [3H] thymidine. Three experiments with the same results were performed. *p < 0.05; **p < 0.01 in two-sided Student’s t test.
(C-E) Relative expression of indicated genes in Mon-derived and M-MDSC-derived macrophages.
(F) S100a9 expression in tumor-free Mon-derived macrophage in the absence or presence of TESs.
(G) Relative gene expression in lung macrophage 3 days after transfer of CD45.1 BM Mon from naive mice and CD45.2 spleen M-MDSCs from EL4 TB mice. Recipient mice: congenic CD45.1xCD45.2 tumor-free mice. Single positive CD45.1 and CD45.2 macrophages were sorted, and indicated gene expression was evaluated by qRT-PCR.
In (C)-(G), results of individual mice are shown. n = 3–4. p values were calculated in two-sided Student’s t test. In all panels, mean and SD are shown.
Because M-MDSC-derived macrophages displayed opposite changes in Arg1 and Nos2, which may suggest a possible shift toward M2-type polarization, we assessed other markers of M2 polarization of macrophages. M-MDSC-derived macrophages had markedly higher expression of Cd206 and Ym1 markers of M2 macrophages and a slight decrease in the expression of Ifnγ (Figure 2D). Consistent with human data, macrophages differentiated from M-MDSCs had much higher expression of S100a9 than did macrophages differentiated from Mons (Figure 2E). Because S100A9 forms heterodimers with S100A8, we also evaluated the expression of S100a8 in macrophages differentiated from Mons and M-MDSCs. Similar to changes in S100a9, expression of S100a8 was markedly higher in M-MDSC-derived macrophages than in Mon-derived macrophages (Figure S2C). Macrophages differentiated from Mons in the presence of TESs had substantially higher expression of S100a9 than did macrophages differentiated from Mons in the absence of TESs (Figure 2F).
To assess the differentiation of Mons and M-MDSCs in tumor-free mice in vivo, CD45.1 Mons from spleens of naive mice were mixed at a 1:1 ratio with M-MDSCs from spleens of EL4 TB mice and injected intravenously (i.v.) into sub-lethally irradiated tumor-free CD45.1×CD45.2 recipients. Three days later, CD45.1 or CD45.2 single-positive, CD11b+F4/80+Ly6G− macrophages were sorted from lungs and evaluated. Macrophages differentiated from M-MDSCs had substantially higher expression of S100a9, Arg1, Cd206, and Ym1 but much lower expression of Nos2 than did macrophages differentiated from Mons (Figure 2G). Thus, in the absence of tumor-derived factors, macrophages differentiated from M-MDSCs displayed T-cell-suppressive activity, polarization toward M2, and expression of S100a9.
In an attempt to better understand the mechanisms underlying the differences between Mon- and M-MDSC-differentiated macrophages, we assessed the expression of GM-CSF and M-CSF receptors on Mons and M-MDSCs. M-MDSCs from spleens of TB mice expressed markedly higher amounts of surface GM-CSFR than did Mons from spleens of naive mice. No differences were observed in the expression of M-CSFR (Figure S2D). When the surface expression of GM-CSFR was compared in vivo between TAMs and M-MDSCs in tumors of MC38 TB mice, M-MDSCs demonstrated more than 2-fold-higher expression than TAMs (Figure S2E). We then evaluated the levels of activated pSTAT3 and pSTAT5, main transcription factors downstream of GM-CSFR. Consistent with a higher expression of GM-CSFR on M-MDSCs, M-MDSCs had a higher baseline level of both transcription factors than Mons. Treatment of the cells with GM-CSF resulted in an increase of pSTAT5 in both populations of cells, maintaining the difference between M-MDSCs and Mons. In contrast, no effect on pSTAT3 was observed (Figure S2F). Consistent with previously published results, the amount of S100A9 protein in M-MDSCs was higher than in Mons. Treatment of Mons with GM-CSF caused upregulation of S100A9. This effect was not significant in M-MDSCs, probably due to the already-elevated level of the protein in these cells. No effect of M-CSF on the amount of S100A9 in these cells was observed (Figure S2G).
S100A9 Expression in Macrophages Depends on Their Origin and State of Polarization
Our data unexpectedly showed that M-MDSC-derived macrophages expressed substantial amounts of S100A9. Since most TR macrophages are derived from embryonic progenitors rather than from Mons, we hypothesized that the expression of S100A9 protein in macrophages may be associated with the BM origin of these cells. Lung TR macrophages and BMDMs were separated based on the expression of Siglec F, CD11b, F4/80, and Ly6G markers (Figure 3A). In tumor-free mice, neither TR macrophages nor BMDMs had detectable S100A9 (Figure 3B).
Figure 3. S100A9 Expression in Macrophages Depends on Their Origin and State of Polarization.
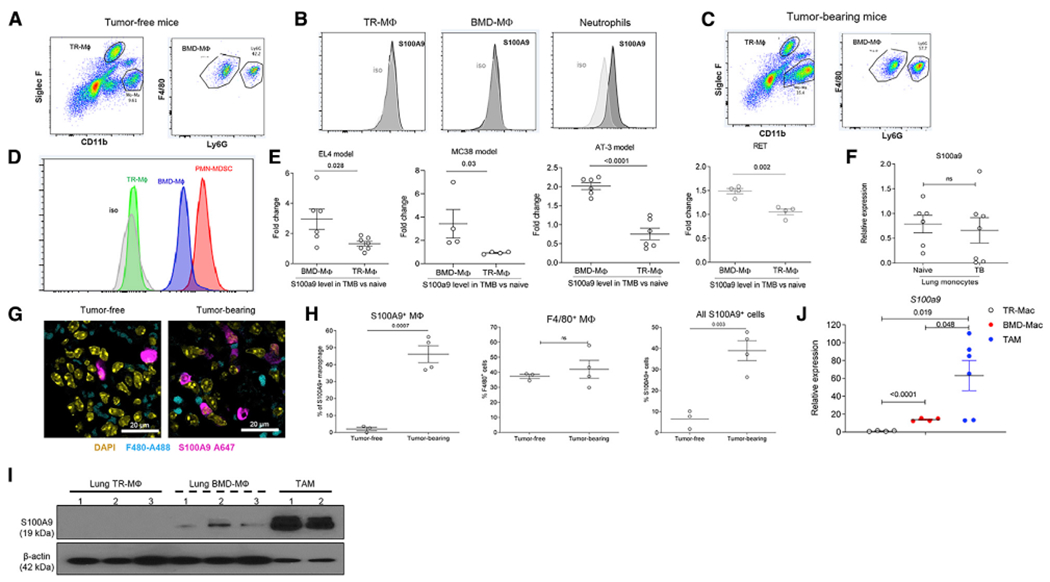
(A) Example of gating of TR macrophages and BMDMs in lung tissue of tumor-free mouse.
(B) Example of intracellular staining for S100A9 in TR macrophages, BMDMs, and neutrophils in lung tissue of naive mouse.
(C) Example of gating of TR macrophages and BMDMs in lung tissue of EL4 TB mouse.
(D) Example of intracellular staining for S100A9 in TR macrophages, BMDMs, and PMN-MDSCs in lung tissue of EL4 TB mouse.
(E) Relative intracellular level of S100A9 protein in TR macrophages and BMDMs in lungs of indicated TB mice normalized to the values in tumor-free mice in the experiments performed at the same time. The results of individual mice are shown (n = 4–6). Mean and SD are shown. p values were calculated in two-sided Student’s t test.
(F) Relative intracellular S100A9 protein level in CD11b+Ly6ChighF4/80− cells from lungs of tumor-free and TB (EL4) mice. n = 5–7. Mean and SD are shown.
(G) IHC image of lung tissue. Mouse F4/80 Alexa488 and mouse S100A9 Alexa647 antibody are used for detecting S100A9 positive macrophage. Scale bar: 20 μm.
(H) Proportion of indicated population of macrophages in lungs of EL4 TB mice detected by IHC. The results of individual mice are shown (n = 3–4). Mean and SD are shown. p values were calculated in two-sided Student’s t test.
(I) S100A9 protein on TR macrophages, BMDMs, and TAMs measured by western blot. TR macrophages and BMDMs were sorted from lung tissue of EL4 TB mice and TAMs from tumors of the same mice.
(J) Relative gene expression of s100a9 from each sorted macrophage population described in (I). The results of individual mice are shown (n = 4–6). Mean and SD are shown. p values were calculated in two-sided Student’s t test.
We then performed similar experiments in mice bearing subcutaneous (s.c.) tumors (EL4). Lungs were evaluated 2 weeks after tumor inoculation, when tumors reached 1 cm in diameter without evidence of lung metastasis (Figure 3C). TR macrophages from TB mice had no expression of S100A9 protein. In contrast, BMDMs had markedly elevated amounts of S100A9 protein (Figure 3D). This effect was evident in all four tested tumor models: EL4, colon carcinoma (MC38), orthotopic breast carcinoma (AT3), and spontaneous melanoma (RET) (Figure 3E). No differences in S100a9 expression were found in lung CD11b+Ly6ChiF4/80− Mons between tumor-free and EL4 TB mice (Figure 3F). We also evaluated the proportion of S100A9+ cells among F4/80+ macrophages in lungs of naive and EL4 TB mice by immune fluorescent histochemistry (Figure 3G). While the presence of F4/80+ macrophages in lungs was not significantly different between tumor-free and EL4 TB mice, the proportion of S100A9+ cells among macrophages in lungs of TB mice was markedly higher than in tumor-free mice (Figure 3H).
In the experiments described above, tumor-free lungs from TB mice were evaluated. Next, we compared the levels of S100A9 in TAMs from a s.c. tumor site. TAMs had markedly higher amounts of S100A9 protein (Figure 3I) and expression of S100a9 mRNA (Figure 3J) than did BMDMs in the lungs of the same mice. These data indicate that in contrast to BMDMs in naive mice, BMDMs in non-tumor tissues of TB mice and, especially, TAMs, retained high expression of S100A9.
Because we observed an association between higher expression of S100a9 and a shift toward M2 macrophages in cells differentiated from mouse M-MDSCs, we evaluated the effect of M1/M2 polarization on the expression of S100A9. Spleen BMDMs from naive mice were polarized to M1 and M2 types using LPS and interferon (IFN)-γ and interleukin (IL)-4 and IL-13, respectively (Figure S3A). M1-polarized macrophages had a very low expression of S100a9 (Figure S3B) and S100A9 protein (Figure S3C), whereas M2 macrophages demonstrated a marked expression of S100A9. The differences in S100A9 amounts between M1 and M2 macrophages were readily detectable by immune fluorescence microscopy (Figure S3D). A similar phenomenon was observed when macrophages were first differentiated from Mons and then polarized to M1 and M2. The expression of S100a9 in M1-polarized macrophages was significantly lower than in parental Mons, whereas in M2 macrophages, it was much higher (Figure S3E). We asked if treatment of Mon-derived macrophages with recombinant heterodimer S100A8/A9 could impact the polarization of macrophages. 24 h of treatment of macrophages with S100A8/A9 protein in the absence of polarizing cytokines resulted in an upregulation of the expression of Arg1, Nos2, and Tnf-α, whereas CD206 and Ym-1 were not changed (Figure S3F). These results indicate that exogenous S100A8/A9 proteins do not directly promote polarization of macrophages since Arg1 and Nos2 are associated with different states of macrophage polarization. Thus, high S100A9 was observed in TB mice only in BMDMs and TAMs, but not in TR macrophages, and was associated with M2 polarization of macrophages.
Functional Role of S100A8/A9 Expression in Macrophages
To assess the role of S100A8/A9 in macrophage function, we used two genetically engineered mouse models: S100A9 knockout (KO) mice that lack both S100A8 and S100A9 proteins (Manitz et al., 2003) and transgenic (S100A9Tg) mice with overexpression of S100A9 protein (Cheng et al., 2008; Ortiz et al., 2015). First, we evaluated the impact of S100A8/A9 on the growth of the tumors. In poorly immunogenic tumor models of Lewis lung carcinoma (LLC), B16 melanoma (B16), and AT3 breast carcinoma (AT3), no significant differences in tumor growth were seen (Figure 4). In contrast, in more immunogenic tumor models (EL-4, MC38, LLC with overexpression of ovalbumin [OVA, LLC-OVA]), tumor growth in S100A9Tg mice was markedly higher than in wild-type (WT) mice, while it was substantially delayed in S100A9KO mice (Figure 4).
Figure 4. Tumor Growth in WT, S100A9 Tg, and S100A9 KO Mice.

Lewis lung carcinoma (LLC), LLC with overexpression of OVA (LLC-OVA), melanoma (B16), breast carcinoma (AT-3), lymphoma (EL4), and colon carcinoma (MC38). Each group included four mice. p values were calculated in two-way ANOVA test with correction for repeated measurements.
Using these tumor models, we assessed the suppressive activity of TAMs. We confirmed a different expression of S100a9 in TAMs than in WT, S100ATg, and S100A9KO LLC TB mice (Figure S4A). TAMs from S100A9Tg mice had markedly stronger suppressive activity than TAMs from WT mice, whereas TAMs from S100A9KO TB mice had no suppressive activity (Figure 5A). This effect was observed in the models where regulation of S100A9 levels in KO and Tg mice had no substantial antitumor activity (LLC, B16, AT3), as well as in the models with an observed effect on tumor growth (EL4, MC38). The number of TAMs in S100A9Tg B16 TB mice was significantly higher than in WT mice. However, this effect was absent in EL4 TB mice (Figure 5B). In S100A9KO AT-3 TB mice, the number of TAMs was significantly lower than in AT-3 TB WT mice. However, this effect was not observed in B16 and MC38 TB mice (Figure 5C). Thus, the presence of S100A9 in TAMs regulated their suppressive activity in all tested models regardless of the effect on tumor burden, whereas it had a model-dependent effect on the number of these cells.
Figure 5. Effect of S100A9 on Suppressive Activity of Macrophages.

(A) Proliferation of OT-1 splenocytes in response to specific peptides in the presence of TAMs isolated from WT or S100A9 Tg or S100A9 KO TB mice. Proliferation was measured by 3H-thymidine uptake in triplicate. Experiments were performed three times. Dotted line shows T cell proliferation in the absence of TAMs. Mean and SD are shown. p values were calculated between WT and S100A9TG or WT and S100A9KO TAMs at the same TAMs: splenocytes ratios in two-sided Student’s t test. *p < 0.05, **p < 0.01 in two-sided Student’s t test.
(B) The number of TAMs in WT or S100A9 Tg mice.
(C) The number of TAMs in WT and S100A9 KO mice. Mean and SD are shown. p values were calculated in two-sided Student’s t test. n = 3–4.
No substantial difference in the presence of different populations of myeloid cells was observed in tumors of S100A9Tg, S100A9KO, and WT MC38 TB mice (Figure S4B). Using putative markers for the distinction of TR (CD45+CD11b−/dimLy6G−F4/80+) and BMD (CD45+CD11b+Ly6G−F4/80+) TAMs, we observed the prevalence of BMD TAMs in all tested tumor models (Figure S4C). We assessed some markers of M2 polarization in tumor TR macrophages and BMDMs. We could not detect the expression of Ym1 and CD206 in TR macrophages, whereas it was clearly detectable in BMDMs (Figure S4D). We also observed a markedly higher proportion of S100A9+ cells among BMDMs than in TR TAMs (Figure S4E).
TAMs from S100A9Tg LLC TB mice had a significantly higher expression of Arg1, Ptgs2, and Cd206 than did TAMs from WT LLC TB mice. In contrast, TAMs from S100A9KO mice had a lower expression of these genes than did WT mice (Figure S4F).
Previous studies demonstrated that a lack of S100A8/A9 dramatically reduced the suppressive activity of MDSCs (He et al., 2018; Ortiz et al., 2015). We asked whether suppressive activity of tumor-infiltrating MDSCs is augmented by the overexpression of S100A9. MDSCs were isolated from tumors of WT and S100A9Tg LLC TB mice. In contrast to TAMs, overexpression of S100A9 did not further enhance the suppressive activity of MDSCs (Figure S4G).
We evaluated markers of M1/M2 polarization in TAMs from S100A9Tg and S100A9KO TB mice. We observed that TAMs from S100A9Tg mice had a higher expression of M2 markers than did TAMs from WT mice. No differences were observed in the expression of M1-type markers (Figure S5).
Next, we tested whether overexpression of S100A9 was sufficient to generate immune-suppressive macrophages or MDSCs in tumor-free mice. CD11b+Gr1+ myeloid cells were purified from the BM of WT or S100A9Tg tumor-free mice. Cells were then added at different ratios to splenocytes from Pmel Tg mice stimulated in the presence of control or specific peptides. Gr-1+CD11b+ cells from either WT or S100A9 Tg mice did not suppress T cell proliferation or IFN-γ production by T cells (Figure 6A). Macrophages were differentiated from Mons from WT or S100A9Tg tumor-free mice for 6 days in the presence of M-CSF. In contrast to macrophages generated from WT Mons, macrophages differentiated from Mons from S100A9Tg mice had suppressive activity (Figure 6B). Macrophages differentiated from Mons from S100A9Tg had a higher expression of Arg1 and Cd206 and a lower expression of Nos2 (Figure 6C), suggesting that the overexpression of S100A9 during macrophage differentiation promoted M2-type polarization. Thus, overexpression of S100A9 in control macrophages recapitulated the effect observed in TAMs.
Figure 6. Mechanism of S100A9 Effect on Macrophages.

(A) Left: proliferation of OT-1 splenocytes in the presence of specific peptides in the presence of CD11b+Gr-1+ myeloid cells from BM of WT or S100A9 Tg tumor-free mice. Right: IFN-γ ELISpot. Experiments were performed in triplicate and repeated twice. Mean and SD are shown.
(B) T cell proliferation of OT-1 splenocytes in the presence of specific peptides and Mon-derived macrophages from WT or S100A9 Tg tumor-free mice. Dotted line indicates cell proliferation in the absence of macrophages. Experiments were performed in triplicate. Results of individual mice (n = 3–5) and mean and SD are shown. p values were calculated in two-sided Student’s t test.
(C) Indicated gene expression in WT or S100A9 Tg Mon-derived macrophages. Expression was normalized togadph. Results of individual mice (n = 3) and mean and SD are shown. p values were calculated in two-sided Student’s t test.
(D) Relative expression of cebpb in WT or S100A9 Tg TAMs isolated from LLC TB mice.
(E) Expression of C/EBPβ-targeted genes in WT, S100A9Tg, and S100AKO TAMs isolated from LLC TB mice. Expression was normalized to gadph. Results of individual mice (n = 3–5) and mean and SD are shown. p values were calculated in two-sided Student’s t test.
(F) Expression of C/EBP-β-targeted genes in BMDMs or TR macrophages isolated from lung tissue of EL4 TB mice. Expression was normalized to actb. Results of individual mice (n = 4) and mean and SD are shown. p values were calculated in two-sided Student’s t test.
(G) Expression of Arg-1 in control siRNA or C/EBP-β siRNA S100A9 Tg Mon-derived macrophages. n = 4.
(H) Proliferation of OT-1 splenocytes in response to specific peptides in the presence of Mon-derived macrophages treated with control siRNA or C/EBP-β siRNA. n = 5. Dotted line indicates cell proliferation in the absence of macrophages. Mean and SD are shown. p values were calculated in two-sided Student’s t test.
Molecular Mechanism of S100A9-Mediated Effects in Macrophages
We investigated a possible molecular mechanism regulation of macrophage function by S100A9. Transcription factor CCAAT enhancer binding protein beta (C/EBPβ) was previously implicated in the suppressive activity of MDSC (Marigo et al., 2010) and M2 macrophage polarization (Ruffell et al., 2009). C/EBPβ-targeted gene orosomucoid (ORM1) was the most upregulated gene in M-MDSC-differentiated macrophages (Figure S1D). Cebpb expression in TAMs from S100A9Tg LLC TB mice was higher than in TAMs from WT TB mice (Figure 6D), as well as the expression of several C/EBPβ-targeted genes (c-type lectin domain family 4 member E [Clec4e], xanthine dehydrogenase [xdh], protein tyrosine kinase 2 [Ptk2]; Figure 6E). BMDMs had a higher expression of C/EBPβ-targeted genes than did TR macrophages (Figure 6F). To assess the role of S100A9/C/EBPβ axis in the regulation of macrophage function, C/EBPβ was silenced in Mons from S100A9Tg mice using small interfering RNA (siRNA) (Figure S6A). Mons were differentiated to macrophages by 6-day culture with M-CSF. Silencing of C/EBPβ abrogated expression of Arg1 in S100A9 Tg macrophages (Figure 6G), as well as markedly reduced their suppressive activity (Figure 6H).
How can S100A9 regulate C/EBPβ? Previously, regulation of C/EBPβ in macrophages by endogenous prostaglandin E2 (PGE2) was demonstrated (Na et al., 2015). We have found that S100A9 can positively regulate PGE2 expression in PMN-MDSCs (He et al., 2018). Here, we evaluated the amount of PGE2 produced by M-MDSCs and TAMs in tumors of WT, S100A9TG, and S100A9KO TB mice. We found that M-MDSCs and TAMs from S100A9Tg TB mice had markedly higher production of PGE2 than did M-MDSCs and TAMs from WT mice (Figure S6B). Treatment of S100A9 Tg macrophages with inhibitor of PGE2 synthesis (COX2 inhibitor; celecoxib) abrogated the expression of C/EBPβ-targeted genes in macrophages from S100A9Tg mice (Figure S6C).
Association of S100A9-Expressing Macrophages with Clinical Outcome in Cancer Patents
Analysis of S100A9 expression based on the data from The Cancer Immunome Atlas (TCIA) revealed that many types of cancer had a higher expression of S100A9 than adjacent normal tissues (Figure 7A). To assess a possible link of S100A9+ TAMs with clinical outcome, we analyzed two cohorts of patients. The first cohort included tissue microarray (TMA) from 41 patients with head and neck cancer (Table S1). TMAs were stained for S100A9 and CD68 macrophage marker (Figure S7) and evaluated blindly by the investigator with no access to clinical data. No association was found between survival and the number of S100A9−CD68+ TAMs. In contrast, a higher number of S100A9+CD68+ TAMs was associated with significantly worse survival (median, 16 months versus 89 months; p = 0.0032). No such association was observed in S100A9+CD68− cells (Figure 7B). In the other cohort, we evaluated patients with metastatic melanoma treated with anti-PD1 antibody (pembrolizumab) (Table S2). Tumor tissues collected prior to the start of therapy were pre-selected by clinical investigators to include patients with complete response and progressive or stable disease. Samples were evaluated blindly as described above. We observed a significantly higher number of S100A9+CD68+ TAMs in patients with progressive disease than in those from patients with complete response (Figure 7C). Thus, a high presence of S100A9+ TAMs was associated with poor clinical outcomes in two different clinical settings.
Figure 7. Clinical Association of S100A9-Positive Macrophages.

(A) Analysis of S100A9 gene expression from cancer patients compared with adjacent normal tissues. The results were based on The Cancer Genome Atlas (TCGA) Research Network (https://www.cancer.gov/tcga). For computational analysis, the results were generated by The Cancer Immunome Atlas (TCIA) (https://tcia.at/home).
(B) Survival in 41 patients with head and neck cancer based on staining of TAMs. Patients were split based on the median number of indicated cells per 0.65 mm2. Chi square was calculated.
(C) Number of indicated populations of TAMs per 0.65 mm2 in patients treated with pembrolizumab. Tissues were collected prior to the start of therapy. Results of individual patients as well as mean and SD are shown.
DISCUSSION
Heterogeneity of BMDMs and TAMs is a well-established phenomenon (Mantovani and Sica, 2010). However, what determines this heterogeneity is not entirely clear. Several reports indicated that conditions of the TME can affect the function of TAMs. For instance, hypoxia can regulate differentiation, and hypoxic regions in tumor can impact the function of TAMs (Corzo et al., 2010; Kumar et al., 2016; Laoui et al., 2014). However, hypoxia and other tumor-associated factors would be less critical in tissues outside the TME, where macrophages contribute to the formation of tumor metastases. BMDMs differentiate from monocytic precursors. In this study, we tested the hypothesis that the nature of monocytic precursors can define the functional characteristics of macrophages. The premise of this hypothesis was based on the fact that in TB hosts, monocytic cells are composed of classically activated Mons and pathologically activated M-MDSCs. These cells have not only distinct functions (potent immune suppression is attributed to M-MDSCs but not to Mons), but also genomics, proteomics, and biochemical features (Veglia et al., 2018). Since in cancer patients Mons and M-MDSCs can be separated based on their phenotype, we were able to compare, side by side, macrophages differentiated from Mons and M-MDSCs from the same patients. Our data indicated that M-MDSC-derived macrophages retained major characteristics of their precursors, including immune-suppressive activity. The differences in gene expression profiles between Mons and M-MDSCs (Mastio et al., 2019) were largely preserved in macrophages differentiated from these cells. These results were reproduced in mice in vitro and in vivo after adoptive transfer to tumor-free recipients. Since all these experiments were performed in the absence of tumor-derived factors, it suggested that the nature of monocytic precursors might be an important factor in determining the function of macrophages. The molecular mechanism of this phenomenon is not clear. Recently, trained immunity has been described for myeloid cells (Milutinović and Kurtz, 2016; Petit et al., 2019; Song and Colonna, 2018). Trained immunity manifests in the production of elevated numbers of cytokines by myeloid cells in response to a second stimulation with the same stimuli (Arts et al., 2018; Bekkering et al., 2018; Christ et al., 2018). The emergence of the trained phenotype has been attributed to epigenetic changes (Christ et al., 2018; Mitroulis et al., 2018). It is quite possible that similar mechanisms could be active during macrophage differentiation. In this study, we did not investigate specific molecular mechanisms of potential epigenetic regulation but focused instead on the possible consequences of this phenomenon: expression of S100A9 protein.
S100A8 and S100A9 are low-molecular-weight intracellular calcium-binding proteins that have tissue- and cell-specific expression (Ghavami et al., 2009). Although S100A8 and S100A9 exist as homodimers, similar to many other S100 proteins, they preferentially form functional anti-parallel heterodimers of S100A8/A9, also known as calprotectin, as well as Ca2+-induced tetramers. S100A8/A9 are expressed primarily in neutrophils and, to a lesser extent, in Mons, but their expression is largely absent in mature macrophages and DCs, lymphocytes, fibroblasts, and endothelial cells (Austermann et al., 2018; Cheng et al., 2008; Gebhardt et al., 2006). A recent study demonstrated the absence of S100a9 expression in TR macrophages in lungs (Sajti et al., 2020). Upregulation of S100A9 expression is one of the hallmarks that distinguishes M-MDSCs from Mons (Gabrilovich, 2017; Mastio et al., 2019; Zhao et al., 2012). Deletion of S100A8/A9 dramatically reduced the suppressive activity of MDSCs (He et al., 2018; Ortiz et al., 2014). S100A8/A9 has diverse intracellular functions. These proteins are involved in the uptake and transport of arachidonic acid (Kerkhoff et al., 2005), NADPH oxidase activity, and reactive oxygen species (ROS) production (Oppenheim and Yang, 2005). S100A9 could regulate PMN-MDSC suppressive function via increased expression of Ptges and PGE2 production (He et al., 2018). Our data demonstrated that M-MDSC-derived macrophages retained expression of S100A9, whereas Mon-derived macrophages or TR macrophages were largely negative. Overexpression of S100A9 or its deletion demonstrated that the presence of S100A9 in macrophages was critical for their suppressive activity in all tested tumor models. Moreover, overexpression of S100A9 in naive macrophages was sufficient to convert these cells to suppressive macrophages and to shift their polarization toward M2 type. In contrast, the overexpression of S100A9 in PMNs or Mons in naive mice did not convert these cells to suppressive MDSCs. This may be the result of an already-high basal level of S100A9 in these cells. Apparently, there is a mechanism in these cells that prevents the acquisition of suppressive features in the presence of S100A9 alone, without the effect of tumor-derived factors. It suggests that in MDSCs, S100A9 is necessary, but not sufficient, for immune-suppressive activity.
What could be the mechanism of S100A9 effect on macrophage function? We investigated the possible role of transcription factor C/EBPβ. It is a member of the C/EBP family of basic region-leucine zipper proteins (Nerlov, 2007). During macrophage activation, Cebpb is transcriptionally induced by the cAMP response element-binding protein (CREB) transcriptional activator, which binds two cyclic AMP (cAMP) response elements (CREs) in the proximal Cebpb promoter. C/EBPβ was previously implicated in the suppressive activity of MDSCs (Marigo et al., 2010) and M2 macrophage polarization (Ruffell et al., 2009). Our data demonstrated that expression of S100A9 in macrophages positively regulated the expression of Cebpb and its target genes. Downregulation of Cebpb in macrophages abrogated the functional effects caused by S100A9, indicating that Cebpb was downstream of S100A9 in regulation of immune-suppressive macrophage function.
How could S100A9 regulate Cebpb? We suggested that this could be mediated by PGE2. PGE2 is one of the most potent inhibitors of immune responses. It suppresses T cell proliferation, activation of natural killer (NK) cells, and cytotoxic T cell activity (Böttcher et al., 2018; Chouaib et al., 1985; Goodwin and Ceuppens, 1983; Mao et al., 2014; Obermajer et al., 2011), and it induces regulatory T cells (Baratelli et al., 2005). PGE2 was implicated in the development of MDSCs (Sinha et al., 2007). PGE2 is synthesized from arachidonic fatty acid by the sequential actions of the cyclooxygenase 2 and prostaglandin E synthetase (Nakanishi and Rosenberg, 2013; Ricciotti et al., 2013). Importantly, PGE2 was implicated in the upregulation of C/EBPβ in macrophages (Na et al., 2015) and DCs (Kocieda et al., 2012) via activation of CREB. We found that overexpression of S100A9 in macrophages from S100A9 Tg mice resulted in an elevated level of PGE2. Blocking PGE2 synthesis with COX2 inhibitor abrogated the upregulation of Cebpb. Thus, it appears that mechanistically, upregulation of S100A9 in macrophages increases PGE2 production that can directly suppress T cell function, but also can upregulate C/EBP-β that mediates immune suppression and M2 polarization of TAMs. Previous reports established the potential role of COX2 inhibitors in the blockade of MDSC expansion in mouse tumor models and antitumor effects (Fujita et al., 2011; Rodriguez et al., 2005; He et al., 2018; Veltman et al., 2010). Our study underscores the potential value of treatment with non-steroid anti-inflammatory drugs in combination treatment of cancer patients.
The role of S100A9 as a marker of immune-suppressive TAMs was demonstrated by the fact that the presence of S100A9-positive TAMs was closely associated with shorter survival of patients with head and neck cancer and poor response to checkpoint inhibitors in patients with metastatic melanoma. S100A9 expression in tumors has been demonstrated to be associated with negative clinical outcome (Wagner et al., 2019). Here, we established the specific role of S100A9-expressing TAMs in this phenomenon since expression of S100A9 in non-TAMs did not provide a significant association with clinical outcome.
Our data not only describe the mechanism regulating the development of immune-suppressive TAMs and suggest methods for tracing these cells in the TME, but also propose a potentially different approach to a selective therapeutic targeting of immune-suppressive macrophages via targeting of M-MDSCs.
STAR★METHODS
KEY RESOURCES TABLE
| REAGENT or RESOURCE | SOURCE | IDENTIFIER |
|---|---|---|
| Antibodies | ||
| Mouse monoclonal anti-human CD68 (clone KP1) | Abcam | Cat#ab955; RRID: AB_307338 |
| Rabbit polyclonal anti-human S100A9 | Novus | Cat#NB110-89726; RRID: AB_1217846 |
| Mouse monoclonal anti-human HLA-DR (clone G46-6) | BD Biosciences | Cat#555811; RRID: AB_396145 |
| Mouse monoclonal anti-human S100A9 (clone MRP 1H9) | BioLegend | Cat#350708; RRID: AB_2564010 |
| Mouse monoclonal anti-human CD68 (clone Y1/82A) | BD Biosciences | Cat#562117; RRID: AB_10896283 |
| Mouse monoclonal anti-human ARG1 (clone 658922) | R&D Systems | Cat#IC8026P |
| Mouse monoclonal anti-human NOS2 (clone C11) | Santa Cruz | Cat#sc-7271 PE; RRID: AB_627810 |
| Mouse monoclonal anti-human PD-L1 (clone 29E.2A3) | BioLegend | Cat#329706; RRID: AB_940368 |
| Rat monoclonal anti-mouse CD11b (clone M1/70) | BD Biosciences | Cat#562605; RRID: AB_11152949 |
| Rat monoclonal anti-mouse CD45 (clone 30-F11) | BD Biosciences | Cat#45-0451-82; RRID: AB_1107002 |
| Rat monoclonal anti-mouse F4/80 (clone BM8) | Thermo Fisher Scientific | Cat#53-4801-82; RRID: AB_469915 |
| Rat monoclonal anti-mouse Ly6G (clone 1A8) | BD Biosciences | Cat#127617; RRID: AB_1877262 |
| Rat monoclonal anti-mouse Ly6C (clone HK1.4) | BD Biosciences | Cat#128005; RRID: AB_1186134 |
| Rat monoclonal anti-mouse S100A9 (clone 2B10) | Abcam | Cat#ab105472 |
| Rat monoclonal anti-mouse Siglec-F (clone E50-2440) | BD Biosciences | Cat#562681; RRID: AB_2722581 |
| Rat monoclonal anti-mouse S100A9 (clone 2B10) | BD Biosciences | Cat#565833; RRID: AB_2739373 |
| Rat monoclonal anti-mouse pSTAT3 (clone 4/P-STAT3) | BD Biosciences | Cat#562072; RRID: AB_10893601 |
| Rat monoclonal anti-mouse pSTAT5 (clone 47/Stat5) | BD Biosciences | Cat#562077; RRID: AB_10894188 |
| Rat monoclonal anti-mouse GM-CSFR (clone 698423) | R&D Systems | Cat#MAB6130; RRID: AB_10973454 |
| Rat monoclonal anti-mouse M-CSFR (clone 460615) | R&D Systems | Cat#MAB3818; RRID: AB_1293545 |
| Chemicals, Peptides, and Recombinant Proteins | ||
| Ficoll-paque plus | GE Healthcare Life Sciences | Cat#GE17-1440-03 |
| RBC Lysis buffer (10X) | eBioscience | Cat#00-4300-54 |
| DAPI | Thermo Fisher Scientific | Cat#D1306 |
| LIVE/DEAD Fixable Aqua Dead Cell Stain Kit | Thermo Fisher Scientific | Cat#L34957 |
| FcR Blocking Reagent, human | Miltenyi Biotec | Cat#130-059-901 |
| FcR Blocking Reagent, mouse | Thermo Fisher Scientific | Cat# MFCR00-4 |
| Thymidine | Sigma-Aldrich | Cat#50-89-5 |
| Fast SYBR Green master mix | Applied Biosystems | Cat#4385614 |
| Trypsin-EDTA (0.25%), phenol-red | Thermo Fisher Scientific | Cat#25200072 |
| NuPAGE Bis-Tris 10% gel, 12 wells | Thermo Fisher Scientific | Cat#NP030B |
| 4X Laemmli sample buffer | Bio-Rad | Cat#161-0747 |
| RIPA lysis buffer | Thermo Fisher Scientific | Cat#89901 |
| Pierce ECL Western Blotting Substrate | Thermo Fisher Scientific | Cat#32209 |
| Penicilin-Streptomycin (10,000U/mL) | Thermo Fisher Scientific | Cat#15140122 |
| Lipopolysaccharide (LPS) | Sigma-Aldrich | Cat#L2018 |
| Recombinant human GM-CSF | PeproTech | Cat#300-03 |
| Recombinant murine IL-4 | PeproTech | Cat#214-14 |
| Recombinant murine IL-13 | PeproTech | Cat#210-13 |
| Recombinant murine GM-CSF | PeproTech | Cat#315-03 |
| Recombinant murine M-CSF | PeproTech | Cat#315-02 |
| Critical Commercial Assays | ||
| PEG2 ELISA | Thermo Fisher Scientific | Cat#EHPGE2 |
| Cytofix/Cytoperm Fixation/Permeablization Kit | BD Biosciences | Cat#554714 |
| EasySep Human T Cell Isolation Kit | STEMCELL Technologies | Cat#17951 |
| LS columns | Miltenyi Biotec | Cat#130-042-401 |
| Dynabeads Human T-Activator CD3/CD28 | Thermo Fisher Scientific | Cat#11131D |
| cDNA reverse Transcription kit | Applied Biosystems | Cat#43-688-14 |
| Deposited Data | ||
| RNA-seq data | This paper | GEO accession number: GSE162353 |
| Experimental Models: Cell Lines | ||
| Murine LLC (Lewis Lung carcinoma) | ATCC | Cat# CRL-1642 |
| Murine EL4 (lymphoma) | ATCC | Cat# TIB-39 |
| Murine MC38 | ATCC | Cat# CRL-2639 |
| Murine AT-3 | Hudson Lab, University of Miami | N/A |
| Murine B16.F10 | Herlyn lab, Wistar Institute | N/A |
| Experimental Models: Organisms/Strains | ||
| Mouse: C57Bl6/J | Charles river | Cat#C57BL/6NCrl 027 |
| Mouse: S100A9 Tg | Gabrilovich lab, Wistar Institute | N/A |
| Mouse: S100A9 KO | Thomas Vogl, University of Munster | N.A |
| Mouse: RET spontaneous | Viktor Umansky, German Cancer Center | N/A |
| Oligonucleotides | ||
| Primers for qRT-PCR, see Table S4 | This paper | N/A |
| Software and Algorithms | ||
| Flowjo | Flowjo | https://www.flowjo.com/ |
| Prism 7 | GraphPad | https://www.graphpad.com/scientific-software/prism/ |
| NIS Elements | Nikon | https://www.nikon.com/products/microscope-solutions/support/download/software/imgsfw/nis-br_v4300164.htm |
| The Cancer Immunome Atlas algorism | TCIA | https://tcia.at/about |
RESOURCE AVAILABILITY
Lead contact
Further information and requests for resources and reagents should be directed to and will be fulfilled by the Lead Contact Dmitry Gabrilovich: dmitry.gabrilovich@astrazeneca.com
Materials availability
This study did not generate new unique reagents
Data and code availability
The dataset of RNaseq data generated during this study is available in GEO accession number: GSE162353, https://www.ncbi.nlm.nih.gov/geo/query/acc.cgi?acc=GSE162353
EXPERIMENTAL MODEL AND SUBJECT DETAILS
Human subjects
Peripheral blood (PB) was collected from patients at the Helen F. Graham Cancer Center, Newark, DE. The study was approved by the institutional review boards (IRBs) of the Christiana Care Health System at Helen F. Graham Cancer Center and The Wistar Institute. All the patients signed IRB approved consent forms. Peripheral blood was collected from previously untreated (i) 9 patients with advanced non-small cell lung cancer (NSCLC); (ii) 5 patients had pancreatic cancer; (iii) 4 patients with colorectal cancer; (iv) 3 patients with esophageal cancer; (v) 2 patients with advanced breast cancer; (vi) 1 patients with head and neck cancer; and (vii) 1 patient had prostate cancer. In some patients with pancreatic or colorectal cancer, tumor tissues (0.2 - 0.5g) were surgically removed, approved by pathology for tissue procurement and used to prepare tumor explant supernatants. Sixteen females and nine males between 44 and 84 years old were enrolled to the study. Peripheral sample of blood from 11 healthy donors (ages 31 to 64) 8 femaewere used as control for cancer patients or for in vitro experiments.
Tissue microarray were prepared at the Helen F. Graham Cancer Center from annotated tumor tissues samples from 41 patients with head and neck cancer (Table S1).
Clinical study at University of Pennsylvania. Paraffin-embedded tumor samples were collected from stage III/IV melanoma patients prior to anti-PD1 (Pembrolizumab) therapy (Table S2), under the University of Pennsylvania Abramson Cancer Center’s melanoma research program tissue collection protocol UPCC 08607 and IRB 703001 in accordance with the Institutional Review Board. Samples collection was performed after obtaining written consent prior to study initiation. Evaluation of staining was performed blindly by investigator on coded samples without access to clinical information. Results were assessed together with clinical investigators after breaking the codes.
Mice
Mouse experiments were approved by the Institutional Animal Care and Use Committee (IACUC) of The Wistar Institute. C57BL/6 mice were obtained from Charles River. S100A9 Tg, S100A9 KO, and RET spontaneous melanoma models were described previously (Cheng et al., 2008; Kato et al., 1998; Manitz et al., 2003; Meyer et al., 2011; Ortiz et al., 2015). In all experiments 6-10 weeks old female mice were used. All transgenic mice were backcrossed to C57BL/6 background for more than 10 generations. Littermates of the same sex were randomly assigned to experimental groups.
Cell lines
Tumor cell lines: LLC (Lewis lung carcinoma), EL4 (lymphoma) were obtained from the ATCC, AT-3 (mouse breast cancer) and B16.F10 were kindly provided by Dr. Barry Hudson and Dr. Meenhard Herlyn, respectively. LLC-OVA cells (LLC with overexpression of OVA) were described previously (Lu et al., 2011). All cells were cultured in RPMI1640 supplemented with 10% FBS (Atlanta Biologicals), 50 U/ml penicillin and 50 ug/ml streptomycin (SIGMA) at 37°C, 5% CO2 chamber. Periodically, all cell lines were tested for mycoplasma contamination by Universal Mycoplasma Detection kit (ATCC).
METHODS DETAILS
Differentiation of human M-MDSCs/monocytes to macrophages
Human PBMCs were isolated from peripheral blood by density gradient centrifugation using Ficoll-Paque™ Plus (GE Healthcare). Human M-MDSCs (CD14+CD15−HLA-DR−/lo) and monocytes (CD14+CD15−HLA-DRhigh) were isolated from PBMCs by cell sorting. To generate macrophages, M-MDSCs and monocytes were cultured for seven days in RPMI 1640 with L-Glutamine and 25 mM HEPES (Corning) supplemented with 10% FBS, 1% Penicillin-Streptomycin (Life Technologies), and 50 ng/mL recombinant human GM-CSF (PeproTech). One-half volume of medium was replaced by fresh medium every three days.
Human T cell suppression assay
T cells from healthy donor were isolated using EasySep Human T Cell Isolation Kit (STEMCELL Technologies). T cell proliferation was stimulated by Dynabeads® Human T-Activator CD3/CD28 (Life Technologies). MΦ derived from M-MDSC and Mon were added to the assay at a ratio of 1:1 (MΦ:T cells). T cell proliferation was assessed after 2 days of culture by 3[H]-thymidine incorporation.
Reagents
Peptide SIINFEKL and EGSRNQDWL were purchased from American Peptide Company. Antibody information is provided in Table S3.
T cell suppression assay
Single cell suspension of tumors or spleen were prepared and cells were sorted on Astrios EQ cell sorter after staining with antibodies. Monocytes (CD11b+Ly6ChiLy6G−F4/80−) and macrophage (CD11b+F4/80+Ly6CloLy6G−) were plated in triplicates in U-bottom 96-well plates in RPMI1640 with 10% FBS (GIBCO) and β-mercaptoethanol (1:1000, SIGMA). Pmel or OT.1 splenocytes were added at different ratios together with cognate peptides: Pmel (EGSRNQDWL, 0.1 μg/ml), OT-1 (SIINFEKL, 0.1 ng/ml). After 36-42 hr incubation at 37°C in 5% CO2, 1 μCu [3H] thymidine (PerkinElmer) was added and cells were incubated for additional 18 hr and radioactivity was measured on TopCount NXT instrument, PerkinElmer.
qRT-PCR
Total RNA was isolated using RNAzol (Zymo Research, R1057) and reverse transcription was performed with high-capacity cDNA RT kit (ThermoFisher, 4368813) according to manufacturer’s instructions. qRT-PCR was performed using Power SYBR Green PCR master mix (Applied Biosystems) in 96well plate on ABI7900 qPCR machine (Applied Biosystems). List of primers is provided in Table S4. Expression values were normalized to GAPDH or 18S.
Flow cytometry
Single cell suspension was incubated in 5 mL polystyrene round-bottom tube. (Falcon, 352045) with Fixable Aqua Dead Cell Stain (Thermo Fisher, L34957) and Fc block anti-mouse FcγRIII/II (CD16/CD32) (eBioscience), or human FcR Blocking Reagent (Miltenyi Biotec) for 15 min, 4°C. After wash with buffer (PBS/2% FBS/0.5 mM EDTA), cells were stained with antibodies for 30 min, 4°C for surface staining. For cytoplasmic staining, cells were incubated with Fixation & Permeabilization buffers (BD Bioscience) according to manufacturer’s instruction. Cells were evaluated on LSRII flow cytometer and data were analyzed by Flowjo (BD) software.
Immunofluorescence microscopy
Mouse lung tissues were harvested, fixed at least 24 hr in 4% paraformaldehyde (Electron Microscopy Science, no. 15710), and embedded in paraffin blocks. Unstained slides (4 μm thickness) were processed for deparaffinization and antigen retrieval and stained with DAPI, mouse F4/80 Alexa 488 and mouse S100A9 Alexa 647. Tissue microarray (TAM) patient slides were processed the same way described above and then stained with DAPI, human CD68 Alexa 488 and human S100A9 Alexa 594. Bone-marrow derived macrophages were seeded to poly-D lysine coated cover glass (Fisherfinest, 12-544-10) and 3 day later, cover glass was fixed in 4% paraformaldehyde. Then, cell were treated with permeable solution (0.1% Tween20, Fisher Chemical) for 10 min, blocking solution for 60 min at RT (3% BSA in PBS, SIGMA). DAPI, mouse F4/80 Alexa 488 and mouse S100A9 Alexa 647 were stained. All stained slides were mounted (Prolong Antifade Mounting solution, ThermoFisher) with cover glass (Fisherfinest, 12-548-5C). 10-15 different fields with 63X objective were captured by Leica TCS SP5 confocal microscope and calculated.
Western blot
Cells were lysed in RIPA buffer (SIGMA, R0278) with protease inhibitor cocktail (SIGMA, P8340) according to the manufacturer’s instruction. Western blotting was performed using Invitrogen NuPAGE system. Gels were transferred to methanol activated PVDF using Bio-lad transfer kit. The primary antibodies mouse S100A9 and mouse β-Actin were used for overnight incubation at 4°C (1:1,000 dilution). After washing in TBS-T, the membrane was incubated with secondary antibodies that conjugated to horse-radish peroxidase (HRP) (1:3,000 dilution, 1hr, RT, Cell Signaling). Detection was performed using the ECL Substrate (Pierce, 32106).
Tumor cell injections and kinetics
5 × 10⁵ cells were injected subcutaneously into 8-week-old wild-type, S100A9 Tg and S100A9 KO mouse. (LLC, LLC-OVA, B16, EL4, and MC38 models). For mouse breast cancer model, AT-3 cells were injected into the third inguinal mammary fat pad of 8 weeks female C57Bl6 wild-type, S100A9 Tg and S100A9 KO mouse. Tumor growth was monitored using calipers 2 times per week and animals were sacrificed when tumors reached 10% body weight. Primary tumors and organs were harvested and processed for following methods described in methods section.
PGE2 ELISA
Same number of sorted tumor-associated macrophage (TAM) from wild-type, S100A9 Tg and S100A9 KO were used to access prostaglandin E2 (PGE2) concentration by PGE2 ELISA kit (Invitrogen, EHPGE2) according to manufacturer’s instruction.
Macrophage polarization experiments
Bone marrow cells were collected from mouse femur and tibia. Hematopoietic cells were collected using lineage cell depletion kit (Miltenyl Biotec, 130-090-858) and cultured with complete RPMI1640 supplemented with 10% FBS (Atlanta Biologicals), 50 U/ml penicillin and 50 ug/ml streptomycin (SIGMA) and 10 ng/ml M-CSF (PeproTech, 315-02) for 6 day at 37°C, 5% CO2 chamber; medium was changed at day 3. For M1 and M2 macrophage polarization, cells were stimulated with LPS (100 ng/ml) and IFNϒ (50 ng/ml) or IL-4 (10 ng/ml) and IL-13 (10 ng/ml) for 24 hr respectively.
RNA-Sequencing
Total RNA was extracted from 0.5-1 million macrophages using the Direct-zol RNA Microprep (Zymo Research, Irvine, CA). RNA quantity was determined using the Qubit 2.0 Fluorometer (ThermoFisher Scientific, Waltham, MA) and the quality was validated using the TapeStation RNA ScreenTape (Agilent, Santa Clara, CA). 500 ng of DNase I treated, total RNA was used to prepare library for Illumina Sequencing using the Quant-Seq 3’mRNA-Seq Library Preparation Kit (Lexogen, Vienna, Austria). Library quantity was determined using qPCR (KAPA Biosystem, Wilmington, MA). Overall library size was determined using the Agilent TapeStation and the DNA High Sensitivity D5000 ScreenTape (Agilent, Santa Clara, CA). Equimolar amounts of each sample library were pooled, denatured and High-Output, Single- read, 75bp cycle. Next Generation Sequencing was done on a NextSeq 500 (Illumina, San Diego, CA).
Raw reads were aligned using Bowtie2 (Langmead and Salzberg, 2012) against hg19 genome and RSEM v1.2.12 software (Li and Dewey, 2011) was used to estimate gene-level read counts using Ensemble transcriptome information. DESeq2 (Love et al., 2014) was used to estimate significance of differential expression difference between the two experimental groups. Significance of overlap between genes differentially expressed in MΦ derived from M-MDSC as compared to Mon and baseline significant differences between M-MDSC and Mon were tested by Fisher Exact Test.
Bioinformatics analysis using web-based database, The Cancer Immunome Atlas (TCIA)
The Cancer Immunome Atlas (TCIA, https://tcia.at/home) provides bioinformatics analysis from The Cancer Genome Atlas (TCGA) for more than 8,000 samples in 20 solid tumors. In TCIA web-based database, macrophage composition in all solid tumor models were selected using integrated tool CIBERSORT and customized gene.
QUANTIFICATION AND STATISTICAL ANALYSIS
Statistical analysis was performed using unpaired two-tailed Student’s t test with significance determined at 0.05. Estimation of variation within each group of data were performed and variance was similar between groups that were compared. Assessment of clinical samples was blinded. Animal experiments were not blinded. Tumor growth was evaluated using two-way Anova test with Bonferroni correction for multiple comparisons.
Supplementary Material
Highlights.
M-MDSCs, in contrast to monocytes, differentiate into immune-suppressive macrophages
M-MDSC-derived macrophages fail to downregulate expression of S100A8/A9 proteins
High expression of S100A9 regulates suppressive activity of macrophages via C/EBPβ
S100A9+ macrophages are associated with negative clinical outcome in cancer patients
ACKNOWLEDGMENTS
This work was supported by NIH grants CA084488, CA165065, and CA100062 and flow cytometry and animal cores of Wistar Institute P30 CA010815.
Footnotes
SUPPLEMENTAL INFORMATION
Supplemental Information can be found online at https://doi.org/10.1016/j.celrep.2020.108571.
DECLARATION OF INTERESTS
D.I.G. is a current employee of AstraZeneca.
REFERENCES
- Arts RJW, Moorlag SJCFM, Novakovic B, Li Y, Wang SY, Oosting M, Kumar V, Xavier RJ, Wijmenga C, Joosten LAB, et al. (2018). BCG Vaccination Protects against Experimental Viral Infection in Humans through the Induction of Cytokines Associated with Trained Immunity. Cell Host Microbe 23, 89–100.e5. [DOI] [PubMed] [Google Scholar]
- Austermann J, Spiekermann C, and Roth J (2018). S100 proteins in rheumatic diseases. Nat. Rev. Rheumatol 14, 528–541. [DOI] [PubMed] [Google Scholar]
- Baratelli F, Lin Y, Zhu L, Yang SC, Heuzé-Vourc’h N, Zeng G, Reckamp K, Dohadwala M, Sharma S, and Dubinett SM (2005). Prostaglandin E2 induces FOXP3 gene expression and T regulatory cell function in human CD4+ T cells. J. Immunol 175, 1483–1490. [DOI] [PubMed] [Google Scholar]
- Bekkering S, Arts RJW, Novakovic B, Kourtzelis I, van der Heijden CDCC, Li Y, Popa CD, Ter Horst R, van Tuijl J, Netea-Maier RT, et al. (2018). Metabolic Induction ofTrained Immunitythrough the Mevalonate Pathway. Cell 172, 135–146.e9. [DOI] [PubMed] [Google Scholar]
- Binnewies M, Roberts EW, Kersten K, Chan V, Fearon DF, Merad M, Coussens LM, Gabrilovich DI, Ostrand-Rosenberg S, Hedrick CC, et al. (2018). Understanding the tumor immune microenvironment (TIME) for effective therapy. Nat. Med 24, 541–550. [DOI] [PMC free article] [PubMed] [Google Scholar]
- Böttcher JP, Bonavita E, Chakravarty P, Blees H, Cabeza-Cabrerizo M, Sammicheli S, Rogers NC, Sahai E, Zelenay S, and Reis E Sousa C (2018). NK Cells Stimulate Recruitment of cDC1 into the Tumor Microenvironment Promoting Cancer Immune Control. Cell 172, 1022–1037.e14. [DOI] [PMC free article] [PubMed] [Google Scholar]
- Bronte V (2019). Deciphering Macrophage and Monocyte Code to Stratify Human Breast Cancer Patients. Cancer Cell 35, 538–539. [DOI] [PubMed] [Google Scholar]
- Bronte V, Brandau S, Chen S-H, Colombo M, Frey A, Greten T, Mandruzzato S, Murray P, Ochoa A, Ostrand-Rosenberg S, et al. (2016). Recommendations for myeloid-derived suppressor cell nomenclature and characterization standards. Nat. Commun 7, 12150. [DOI] [PMC free article] [PubMed] [Google Scholar]
- Cassetta L, and Pollard JW (2018). Targeting macrophages: therapeutic approaches in cancer. Nat. Rev 17, 887–904. [DOI] [PubMed] [Google Scholar]
- Cheng P, Corzo CA, Luetteke N, Yu B, Nagaraj S, Bui MM, Ortiz M, Nacken W, Sorg C, Vogl T, et al. (2008). Inhibition of dendritic cell differentiation and accumulation of myeloid-derived suppressor cells in cancer is regulated by S100A9 protein. J. Exp. Med 205, 2235–2249. [DOI] [PMC free article] [PubMed] [Google Scholar]
- Chouaib S, Welte K, Mertelsmann R, and Dupont B (1985). Prostaglandin E2 acts at two distinct pathways of T lymphocyte activation: inhibition of interleukin 2 production and down-regulation of transferrin receptor expression. J. Immunol 135, 1172–1179. [PubMed] [Google Scholar]
- Christ A, Günther P, Lauterbach MAR, Duewell P, Biswas D, Pelka K, Scholz CJ, Oosting M, Haendler K, Baßler K, et al. (2018). Western Diet Triggers NLRP3-Dependent Innate Immune Reprogramming. Cell 172, 162–175.e14. [DOI] [PMC free article] [PubMed] [Google Scholar]
- Condamine T, Ramachandran I, Youn JI, and Gabrilovich DI (2015). Regulation of tumor metastasis by myeloid-derived suppressor cells. Annu. Rev. Med 66, 97–110. [DOI] [PMC free article] [PubMed] [Google Scholar]
- Cortez-Retamozo V, Etzrodt M, Newton A, Rauch PJ, Chudnovskiy A, Berger C, Ryan RJ, Iwamoto Y, Marinelli B, Gorbatov R, et al. (2012). Origins of tumor-associated macrophages and neutrophils. Proc. Natl. Acad. Sci. USA 100, 2491–2496. [DOI] [PMC free article] [PubMed] [Google Scholar]
- Corzo CA, Condamine T, Lu L, Cotter MJ, Youn JI, Cheng P, Cho HI, Celis E, Quiceno DG, Padhya T, et al. (2010). HIF-1α regulates function and differentiation of myeloid-derived suppressor cells in the tumor microenvironment. J. Exp. Med 207, 2439–2453. [DOI] [PMC free article] [PubMed] [Google Scholar]
- Fujita M, Kohanbash G, Fellows-Mayle W, Hamilton RL, Komohara Y, Decker SA, Ohlfest JR, and Okada H (2011). COX-2 blockade suppresses gliomagenesis by inhibiting myeloid-derived suppressor cells. Cancer Res 71, 2664–2674. [DOI] [PMC free article] [PubMed] [Google Scholar]
- Gabrilovich DI (2017). Myeloid-Derived Suppressor Cells. Cancer Immunol. Res 5, 3–8. [DOI] [PMC free article] [PubMed] [Google Scholar]
- Gebhardt C, Németh J, Angel P, and Hess J (2006). S100A8 and S100A9 in inflammation and cancer. Biochem. Pharmacol 72, 1622–1631. [DOI] [PubMed] [Google Scholar]
- Ghavami S, Chitayat S, Hashemi M, Eshraghi M, Chazin WJ, Halayko AJ, and Kerkhoff C (2009). S100A8/A9: a Janus-faced molecule in cancer therapy and tumorgenesis. Eur. J. Pharmacol 625, 73–83. [DOI] [PubMed] [Google Scholar]
- Goodwin JS, and Ceuppens J (1983). Regulation of the immune response by prostaglandins. J. Clin. Immunol 3, 295–315. [DOI] [PubMed] [Google Scholar]
- He YM, Li X, Perego M, Nefedova Y, Kossenkov AV, Jensen EA, Kagan V, Liu YF, Fu SY, Ye QJ, et al. (2018). Transitory presence of myeloid-derived suppressor cells in neonates is critical for control of inflammation. Nat. Med 24, 224–231. [DOI] [PMC free article] [PubMed] [Google Scholar]
- Kato M, Takahashi M, Akhand AA, Liu W, Dai Y, Shimizu S, Iwamoto T, Suzuki H, and Nakashima I (1998).Transgenic mouse model forskin malignant melanoma. Oncogene 17, 1885–1888. [DOI] [PubMed] [Google Scholar]
- Kerkhoff C, Nacken W, Benedyk M, Dagher MC, Sopalla C, and Doussiere J (2005). The arachidonic acid-binding protein S100A8/A9 promotes NADPH oxidase activation by interaction with p67phox and Rac-2. FASEB J. 19, 467–469. [DOI] [PubMed] [Google Scholar]
- Kielbassa K, Vegna S, Ramirez C, and Akkari L (2019). Understanding the Origin and Diversity of Macrophages to Tailor Their Targeting in Solid Cancers. Front. Immunol 10, 2215. [DOI] [PMC free article] [PubMed] [Google Scholar]
- Kocieda VP, Adhikary S, Emig F, Yen JH, Toscano MG, and Ganea D (2012). Prostaglandin E2-induced IL-23p19 subunit is regulated by cAMP-responsive element-binding protein and C/AATT enhancer-binding protein β in bone marrow-derived dendritic cells. J. Biol. Chem 287, 36922–36935. [DOI] [PMC free article] [PubMed] [Google Scholar]
- Kumar V, Cheng P, Condamine T, Mony S, Languino LR, McCaffrey JC, Hockstein N, Guarino M, Masters G, Penman E, et al. (2016). CD45 Phosphatase Inhibits STAT3 Transcription Factor Activity in Myeloid Cells and Promotes Tumor-Associated Macrophage Differentiation. Immunity 44, 303–315. [DOI] [PMC free article] [PubMed] [Google Scholar]
- Langmead B, and Salzberg SL (2012). Fast gapped-read alignment with Bowtie 2. Nat. Methods 9, 357–359. [DOI] [PMC free article] [PubMed] [Google Scholar]
- Laoui D, Van Overmeire E, Di Conza G, Aldeni C, Keirsse J, Morias Y, Movahedi K, Houbracken I, Schouppe E, Elkrim Y, et al. (2014). Tumor hypoxia does not drive differentiation of tumor-associated macrophages but rather fine-tunes the M2-like macrophage population. Cancer Res. 74, 24–30. [DOI] [PubMed] [Google Scholar]
- Li B, and Dewey CN (2011). RSEM: accurate transcript quantification from RNA-Seq data with or without a reference genome. BMC Bioinformatics 12, 323. [DOI] [PMC free article] [PubMed] [Google Scholar]
- Lim SY, Yuzhalin AE, Gordon-Weeks AN, and Muschel RJ (2016). Targeting the CCL2-CCR2 signaling axis in cancer metastasis. Oncotarget 7, 28697–28710. [DOI] [PMC free article] [PubMed] [Google Scholar]
- Love MI, Huber W, and Anders S (2014). Moderated estimation of fold change and dispersion for RNA-seq datawith DESeq2. Genome Biol. 15, 550. [DOI] [PMC free article] [PubMed] [Google Scholar]
- Lu T, Ramakrishnan R, Altiok S, Youn JI, Cheng P, Celis E, Pisarev V, Sherman S, Sporn MB, and Gabrilovich D (2011). Tumor-infiltrating myeloid cells induce tumor cell resistance to cytotoxic T cells in mice. J. Clin. Invest 121, 4015–4029. [DOI] [PMC free article] [PubMed] [Google Scholar]
- Lu Z, Zou J, Li S, Topper MJ, Tao Y, Zhang H, Jiao X, Xie W, Kong X, Vaz M, et al. (2020). Epigenetic therapy inhibits metastases by disrupting premetastatic niches. Nature 579, 284–290. [DOI] [PMC free article] [PubMed] [Google Scholar]
- Lyssiotis CA, and Kimmelman AC (2017). Metabolic Interactions in the Tumor Microenvironment. Trends Cell Biol. 27, 863–875. [DOI] [PMC free article] [PubMed] [Google Scholar]
- Manitz MP, Horst B, Seeliger S, Strey A, Skryabin BV, Gunzer M, Frings W, Schönlau F, Roth J, Sorg C, and Nacken W (2003). Loss of S100A9 (MRP14) results in reduced interleukin-8-induced CD11b surface expression, a polarized microfilament system, and diminished responsiveness to chemoattractants in vitro. Mol. Cell. Biol 23, 1034–1043. [DOI] [PMC free article] [PubMed] [Google Scholar]
- Mantovani A, and Sica A (2010). Macrophages, innate immunity and cancer: balance, tolerance, and diversity. Curr. Opin. Immunol 22, 231–237. [DOI] [PubMed] [Google Scholar]
- Mao Y, Sarhan D, Steven A, Seliger B, Kiessling R, and Lundqvist A (2014). Inhibition of tumor-derived prostaglandin-e2 blocks the induction of myeloid-derived suppressor cells and recovers natural killer cell activity. Clin. Cancer Res 20, 4096–4106. [DOI] [PubMed] [Google Scholar]
- Marigo I, Bosio E, Solito S, Mesa C, Fernandez A, Dolcetti L, Ugel S, Sonda N, Bicciato S, Falisi E, et al. (2010). Tumor-induced tolerance and immune suppression depend on the C/EBPbeta transcription factor. Immunity 32, 790–802. [DOI] [PubMed] [Google Scholar]
- Mastio J, Condamine T, Dominguez G, Kossenkov AV, Donthireddy L, Veglia F, Lin C, Wang F, Fu S, Zhou J, et al. (2019). Identification of monocyte-like precursors of granulocytes in cancer as a mechanism for accumulation of PMN-MDSCs. J. Exp. Med 216, 2150–2169. [DOI] [PMC free article] [PubMed] [Google Scholar]
- Meyer C, Sevko A, Ramacher M, Bazhin AV, Falk CS, Osen W, Borrello I, Kato M, Schadendorf D, Baniyash M, and Umansky V (2011). Chronic inflammation promotes myeloid-derived suppressor cell activation blocking antitumor immunity in transgenic mouse melanoma model. Proc. Natl. Acad. Sci. USA 108, 17111–17116. [DOI] [PMC free article] [PubMed] [Google Scholar]
- Milutinović B, and Kurtz J (2016). Immune memory in invertebrates. Semin. Immunol 28, 328–342. [DOI] [PubMed] [Google Scholar]
- Mitroulis I, Ruppova K, Wang B, Chen LS, Grzybek M, Grinenko T, Eugster A, Troullinaki M, Palladini A, Kourtzelis I, et al. (2018). Modulation of Myelopoiesis Progenitors Is an Integral Component of Trained Immunity. Cell 172, 147–161.e12. [DOI] [PMC free article] [PubMed] [Google Scholar]
- Murray PJ, Allen JE, Biswas SK, Fisher EA, Gilroy DW, Goerdt S, Gordon S, Hamilton JA, Ivashkiv LB, Lawrence T, et al. (2014). Macrophage activation and polarization: nomenclature and experimental guidelines. Immunity 41, 14–20. [DOI] [PMC free article] [PubMed] [Google Scholar]
- Na YR, Jung D, Yoon BR, Lee WW, and Seok SH (2015). Endogenous prostaglandin E2 potentiates anti-inflammatory phenotype of macrophage through the CREB-C/EBP-β cascade. Eur. J. Immunol 45, 2661–2671. [DOI] [PubMed] [Google Scholar]
- Nakanishi M, and Rosenberg DW (2013). Multifaceted roles of PGE2 in inflammation and cancer. Semin. Immunopathol 35, 123–137. [DOI] [PMC free article] [PubMed] [Google Scholar]
- Nerlov C (2007). The C/EBP family of transcription factors: a paradigm for interaction between gene expression and proliferation control. Trends Cell Biol. 17,318–324. [DOI] [PubMed] [Google Scholar]
- Obermajer N, Muthuswamy R, Lesnock J, Edwards RP, and Kalinski P (2011). Positive feedback between PGE2 and COX2 redirects the differentiation of human dendritic cells toward stable myeloid-derived suppressor cells. Blood 118, 5498–5505. [DOI] [PMC free article] [PubMed] [Google Scholar]
- Oppenheim JJ, and Yang D (2005). Alarmins: chemotactic activators of immune responses. Curr. Opin. Immunol 17, 359–365. [DOI] [PubMed] [Google Scholar]
- Ortiz ML, Lu L, Ramachandran I, and Gabrilovich DI (2014). Myeloid-derived suppressor cells in the development of lung cancer. Cancer Immunol. Res 2, 50–58. [DOI] [PMC free article] [PubMed] [Google Scholar]
- Ortiz ML, Kumar V, Martner A, Mony S, Donthireddy L, Condamine T, Seykora J, Knight SC, Malietzis G, Lee GH, et al. (2015). Immature myeloid cells directly contribute to skin tumor development by recruiting IL-17-producing CD4+ T cells. J. Exp. Med 212, 351–367. [DOI] [PMC free article] [PubMed] [Google Scholar]
- Pathria P, Louis TL, and Varner JA (2019). Targeting Tumor-Associated Macrophages in Cancer. Trends Immunol. 40, 310–327. [DOI] [PubMed] [Google Scholar]
- Petit J, Embregts CWE, Forlenza M, and Wiegertjes GF (2019). Evidence of Trained Immunity in a Fish: Conserved Features in Carp Macrophages. J. Immunol 203, 216–224. [DOI] [PMC free article] [PubMed] [Google Scholar]
- Pinto ML, Rios E, Duraes C, Ribeiro R, Machado JC, Mantovani A, Barbosa MA, Carneiro F, and Oliveira MJ (2019). The Two Faces of Tumor-Associated Macrophages and Their Clinical Significance in Colorectal Cancer. Front. Immunol 10, 1875. [DOI] [PMC free article] [PubMed] [Google Scholar]
- Qian BZ, Li J, Zhang H, Kitamura T, Zhang J, Campion LR, Kaiser EA, Snyder LA, and Pollard JW (2011). CCL2 recruits inflammatory monocytes to facilitate breast-tumour metastasis. Nature 475, 222–225. [DOI] [PMC free article] [PubMed] [Google Scholar]
- Ricciotti E, Yu Y, Grosser T, and Fitzgerald GA (2013). COX-2, the dominant source of prostacyclin. Proc. Natl. Acad. Sci. USA 110, E183. [DOI] [PMC free article] [PubMed] [Google Scholar]
- Rodriguez PC, Hernandez CP, Quiceno D, Dubinett SM, Zabaleta J, Ochoa JB, Gilbert J, and Ochoa AC (2005). Arginase I in myeloid suppressor cells is induced by COX-2 in lung carcinoma. J. Exp. Med 202, 931–939. [DOI] [PMC free article] [PubMed] [Google Scholar]
- Ruffell D, Mourkioti F, Gambardella A, Kirstetter P, Lopez RG, Rosenthal N, and Nerlov C (2009). A CREB-C/EBPbeta cascade induces M2 macrophage-specific gene expression and promotes muscle injury repair. Proc. Natl. Acad. Sci. USA 106, 17475–17480. [DOI] [PMC free article] [PubMed] [Google Scholar]
- Sajti E, Link VM, Ouyang Z, Spann NJ, Westin E, Romanoski CE, Fonseca GJ, Prince LS, and Glass CK (2020). Transcriptomic and epigenetic mechanisms underlying myeloid diversity in the lung. Nat. Immunol 21, 221–231. [DOI] [PMC free article] [PubMed] [Google Scholar]
- Sanford DE, Belt BA, Panni RZ, Mayer A, Deshpande AD, Carpenter D, Mitchem JB, Plambeck-Suess SM, Worley LA, Goetz BD, et al. (2013). Inflammatory monocyte mobilization decreases patient survival in pancreatic cancer: a role for targeting the CCL2/CCR2 axis. Clin. Cancer Res 19, 3404–3415. [DOI] [PMC free article] [PubMed] [Google Scholar]
- Schulz C, Gomez Perdiguero E, Chorro L, Szabo-Rogers H, Cagnard N, Kierdorf K, Prinz M, Wu B, Jacobsen SE, Pollard JW, et al. (2012). A lineage of myeloid cells independent of Myb and hematopoietic stem cells. Science 336, 86–90. [DOI] [PubMed] [Google Scholar]
- Sica A, Erreni M,Allavena P, and Porta C (2015). Macrophage polarization in pathology. Cell. Mol. Life Sci 72, 4111–4126. [DOI] [PMC free article] [PubMed] [Google Scholar]
- Sinha P, Clements VK, Fulton AM, and Ostrand-Rosenberg S (2007). Prostaglandin E2 promotes tumor progression by inducing myeloid-derived suppressor cells. Cancer Res. 67, 4507–4513. [DOI] [PubMed] [Google Scholar]
- Song WM, and Colonna M (2018). Immune Training Unlocks Innate Potential. Cell 172, 3–5. [DOI] [PubMed] [Google Scholar]
- Thorsson V, Gibbs DL, Brown SD, Wolf D, Bortone DS, Ou Yang TH, Porta-Pardo E, Gao GF, Plaisier CL, Eddy JA, et al. ; Cancer Genome Atlas Research Network (2018). The Immune Landscape of Cancer. Immunity 48, 812–830.e14. [DOI] [PMC free article] [PubMed] [Google Scholar]
- Veglia F, Perego M, and Gabrilovich D (2018). Myeloid-derived suppressor cells coming of age. Nat. Immunol 19, 108–119. [DOI] [PMC free article] [PubMed] [Google Scholar]
- Veltman JD, Lambers ME, van Nimwegen M, Hendriks RW, Hoogsteden HC, Aerts JG, and Hegmans JP (2010). COX-2 inhibition improves immunotherapy and is associated with decreased numbers of myeloid-derived suppressor cells in mesothelioma. Celecoxib influences MDSC function. BMC Cancer 10, 464. [DOI] [PMC free article] [PubMed] [Google Scholar]
- Wagner NB, Weide B, Gries M, Reith M, Tarnanidis K, Schuermans V, Kemper C, Kehrel C, Funder A, Lichtenberger R, et al. (2019). Tumor microenvironment-derived S100A8/A9 is a novel prognostic biomarker for advanced melanoma patients and during immunotherapy with anti-PD-1 antibodies. J. Immunother. Cancer 7, 343. [DOI] [PMC free article] [PubMed] [Google Scholar]
- Wang PF, Song SY, Wang TJ, Ji WJ, Li SW, Liu N, and Yan CX (2018). Prognostic role of pretreatment circulating MDSCs in patients with solid malignancies: A meta-analysis of 40 studies. OncoImmunology 7, e1494113. [DOI] [PMC free article] [PubMed] [Google Scholar]
- Xue J, Schmidt SV, Sander J, Draffehn A, Krebs W, Quester I, De Nardo D, Gohel TD, Emde M, Schmidleithner L, et al. (2014). Transcriptome-based network analysis reveals a spectrum model of human macrophage activation. Immunity 40, 274–288. [DOI] [PMC free article] [PubMed] [Google Scholar]
- Yona S, Kim KW, Wolf Y, Mildner A, Varol D, Breker M, Strauss-Ayali D, Viukov S, Guilliams M, Misharin A, et al. (2013). Fate mapping reveals origins and dynamics of monocytes and tissue macrophages under homeostasis. Immunity 38, 79–91. [DOI] [PMC free article] [PubMed] [Google Scholar]
- Zhao F, Hoechst B, Duffy A, Gamrekelashvili J, Fioravanti S, Manns MP, Greten TF, and Korangy F (2012). S100A9 a new marker for monocytic human myeloid-derived suppressor cells. Immunology 136, 176–183. [DOI] [PMC free article] [PubMed] [Google Scholar]
Associated Data
This section collects any data citations, data availability statements, or supplementary materials included in this article.
Supplementary Materials
Data Availability Statement
The dataset of RNaseq data generated during this study is available in GEO accession number: GSE162353, https://www.ncbi.nlm.nih.gov/geo/query/acc.cgi?acc=GSE162353