Abstract
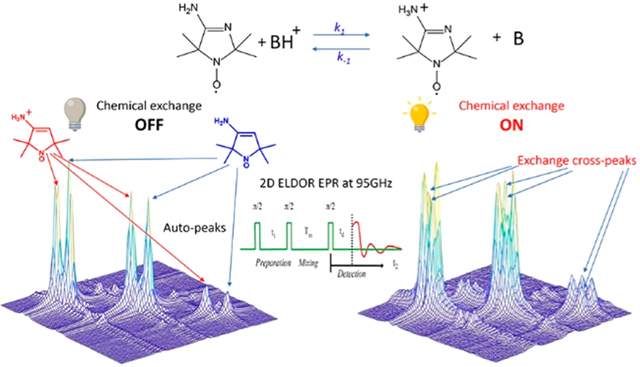
Exchange processes which include conformational change, protonation/deprotonation, and binding equilibria are routinely studied by 2D exchange NMR techniques, where information about the exchange of nuclei between environments with different NMR shifts is obtained from the development of cross-peaks. Whereas 2D NMR enables the real time study of millisecond and slower exchange processes, 2D ESR in the form of 2D-ELDOR (two-dimensional electron–electron double resonance) has the potential for such studies over the nanosecond to microsecond real time scales. Cross-peak development due to chemical exchange has been seen previously for semiquinones in ESR, but this is not possible for most common ESR probes, such as nitroxides, studied at typical ESR frequencies because, unlike NMR, the exchanging states yield ESR signals that are not resolved from each other within their respective line widths. But at 95 GHz, it becomes possible to resolve them in many cases because of the increased g-factor resolution. The 95 GHz instrumental developments occurring at ACERT now enable such studies. We demonstrate these new capabilities in two studies: (A) the protonation/deprotonation process for a pH-sensitive imidazoline spin label in aqueous solution where the exchange rate and the population ratio of the exchanging states are controlled by the concentration and pH of the buffer solution, respectively, and (B) a nitroxide radical partitioning between polar (aqueous) and nonpolar (phospholipid) environments in multilamellar lipid vesicles, where the cross-peak development arises from the exchange of the nitroxide between the two phases. This work represents the first example of the observation and analysis of cross-peaks arising from chemical exchange processes involving nitroxide spin labels.
Graphical Abstract
I. INTRODUCTION
Spin-label ESR spectroscopy is a useful and powerful tool in chemistry and biology. However, it has not been possible to develop it into the analogue of 2D NMR that is extensively used for applications such as protein structure determination at ambient temperatures and the study of exchange of an NMR probe between different chemical environments. In such NMR applications, the fundamental capability is the ability to resolve the signals from the different chemical sites due to their differences, often very small, in chemical shift.1,2 To perform similar studies using 2D ESR with nitroxide spin labels, it would be very useful to fully resolve different chemical environments that are labeled by nitroxide moieties. While this is rarely feasible by CW-ESR at standard frequencies (e.g., 9 GHz), it is now possible to achieve such separation by the use of high-field ESR (e.g., at around 95 GHz).3–6 However, in the past it was not possible to perform 2D ESR experiments enabling the observation of cross-peaks between the different chemical environments of a nitroxide spin label. Although 2D-ESR at lower frequencies (9–17 GHz)7–17 provided considerable resolution improvement compared to 1D ESR, this has not enabled the needed site separation for nitroxides. In this article, we report that with recent significant instrumental improvements18 to 2D-ESR at 95 GHz9,19,20 it is now possible to perform 2D-exchange ESR with nitroxide spin labels. We demonstrate this with two different examples: (1) the protonation/deprotonation process for a pH-sensitive imidazoline spin label21 in aqueous solution where the population ratio of the exchanging states and the exchange rate are controlled by pH and by the concentration of the buffer, respectively, and (2) a nitroxide radical partitioning between polar (aqueous) and nonpolar (lipid) environments in multilamellar lipid vesicles.6,22–26 In both cases, it was possible to observe cross-peaks that arise from microsecond exchange processes occurring between the two sites. This is a significant complement to the 2D NMR method that enables the real-time study of millisecond and slower exchange processes since 2D ESR (in the form of two-dimensional electron–electron ESR, 2D-ELDOR) has the potential to study in real time much faster processes occurring on the nanosecond-to-microsecond time scale. While other NMR and ESR methods do exist that cover a wider time range, they are indirect in that they do not utilize the 2D exchange advantage of explicitly observing the spectra of both sites and their cross-peaks and their time development due to the exchange.
2D-ELDOR has been used extensively in the past to study the motional dynamics of spin labels in complex fluids such as liquid crystals, peptides, polymers, and model membranes.9–15,27 The auto- and cross-peak development as a function of mixing time, Tm, provides rich details from which one extracts quantitative insight about local reorientational motion and local anisotropic potentials affecting the spin label, as well as overall dynamics of its surrounding solvent “cage.” In addition, one can study microscopic details of the translational motion of spin probes.8 Although our present study at 95 GHz addresses the new application of microsecond exchange processes involving nitroxide spin labels, these other features are still manifest in the 2D-ELDOR spectra, and we show in this work how one is able to distinguish the unique features of the exchange processes and obtain the relevant rate constants.
We do note that the present study is in the motional-narrowing range8,13 (also known at the Redfield limit) where we can resolve the distinct nitroxide signals, as is the case for 2D NMR studies that discriminate distinct proton sites and can be analyzed in a similar fashion.2,28
Past 2D-ELDOR studies on complex fluids often are in the slow-motional regime requiring more sophisticated analysis via the Stochastic Liouville equation (SLE),12 but that is not the case in the present work. We do note that in a very recent publication, predictions are made of the virtues of 2D-ELDOR at 95 GHz for the study of internal dynamics in proteins,29 but that application does require the SLE, which is not required in the present study.
We show how 2D-ELDOR can be successfully utilized for studies of chemical and physical exchange processes utilizing nitroxide spin labels, given our recent instrumental improvements at 95 GHz.18 These include the ability to deliver very short and intense nanosecond pulses at this frequency and to detect the 2D-ELDOR signals with very good sensitivity and with very short dead times. The g-factor resolution at 95 GHz then enables one to clearly distinguish the respective auto- and cross-peaks in the 2D-ELDOR experiment.
The recent substantial upgrades of the ACERT 95 GHz 2D-ELDOR spectrometer that have enabled this study are summarized in Section II. Section III presents the results on the exchange processes as studied by 2D-ELDOR. A discussion of the applicability of these methods for studies on exchange in the nanosecond to microsecond range and the significance of the two studies reported are given in Section IV. The conclusion appears in Section V.
II. MATERIALS AND METHODS
II.A. Materials.
The pH-sensitive spin label (R•), 4-amino-2,2,5,5-tetramethyl-3-imidazoline-1-yloxy, was synthesized and purified as previously reported.31 Perdeuterated tempone (PDT, D16–2,2,6,6-tetramethyl-4-oxo-1-piperidinyloxy) labeled with both 14N and 15N was purchased from Sigma-Aldrich. D54-DMPC (D54–1,2-dimyristoyl-sn-glycero-3-phosphocholine) was purchased from Avanti Polar lipids. Perdeuterated DTBN (di-tert-butyl nitroxide) was previously synthesized in the Freed laboratory by a previously published method32 and was purified for this study by TLC. Deuterated Finland trityl radical, trityl OX063_d24 (D24-methyl-tris[8-carboxy-2,2,6,6-tetrakis[2-hydroxyethyl]benzo[1,2-d:4,5-d′]bis[1,3]dithiol-4-yl]-trisodium salt), and the lithium phthalocyanine radical were a generous gift from Prof. Howard J. Halpern, Center for EPR Imaging In Vivo Physiology, University of Chicago Medicine.
Phosphate buffer was used to set the pH value close to the pKa of R• and to vary the chemical exchange rate. Fine pH adjustment was achieved by adding either H3PO4 or Na3PO4 of the same concentration as for the initial buffer.
II.B. Sample Preparation and ESR Spectroscopy.
The buffered water solutions of R• were placed in the sample holder (cf. Figure 1). It consists of a quartz plate that has a shallow concave depression of ca. 4.5 mm radius and 0.2 mm thickness, which was etched with a 48% HF solution and into which the solution is placed. It is then covered with another quartz plate and sealed with vacuum grease.33 This enables one to study relatively large volumes of the aqueous sample at 95 GHz. The sample holder illustrated in Figure 1 has a volume of ca. 13 μL. The samples containing 14N-PDT and 15N-PDT were prepared in a similar way as for R• but with no buffer used. To compensate for 14N-PDT’s lower signal intensity compared to that of 15N-PDT due to the presence of three hyperfine lines instead of two, we maintained their concentration ratio at 1:0.6 for all samples studied.
Figure 1.
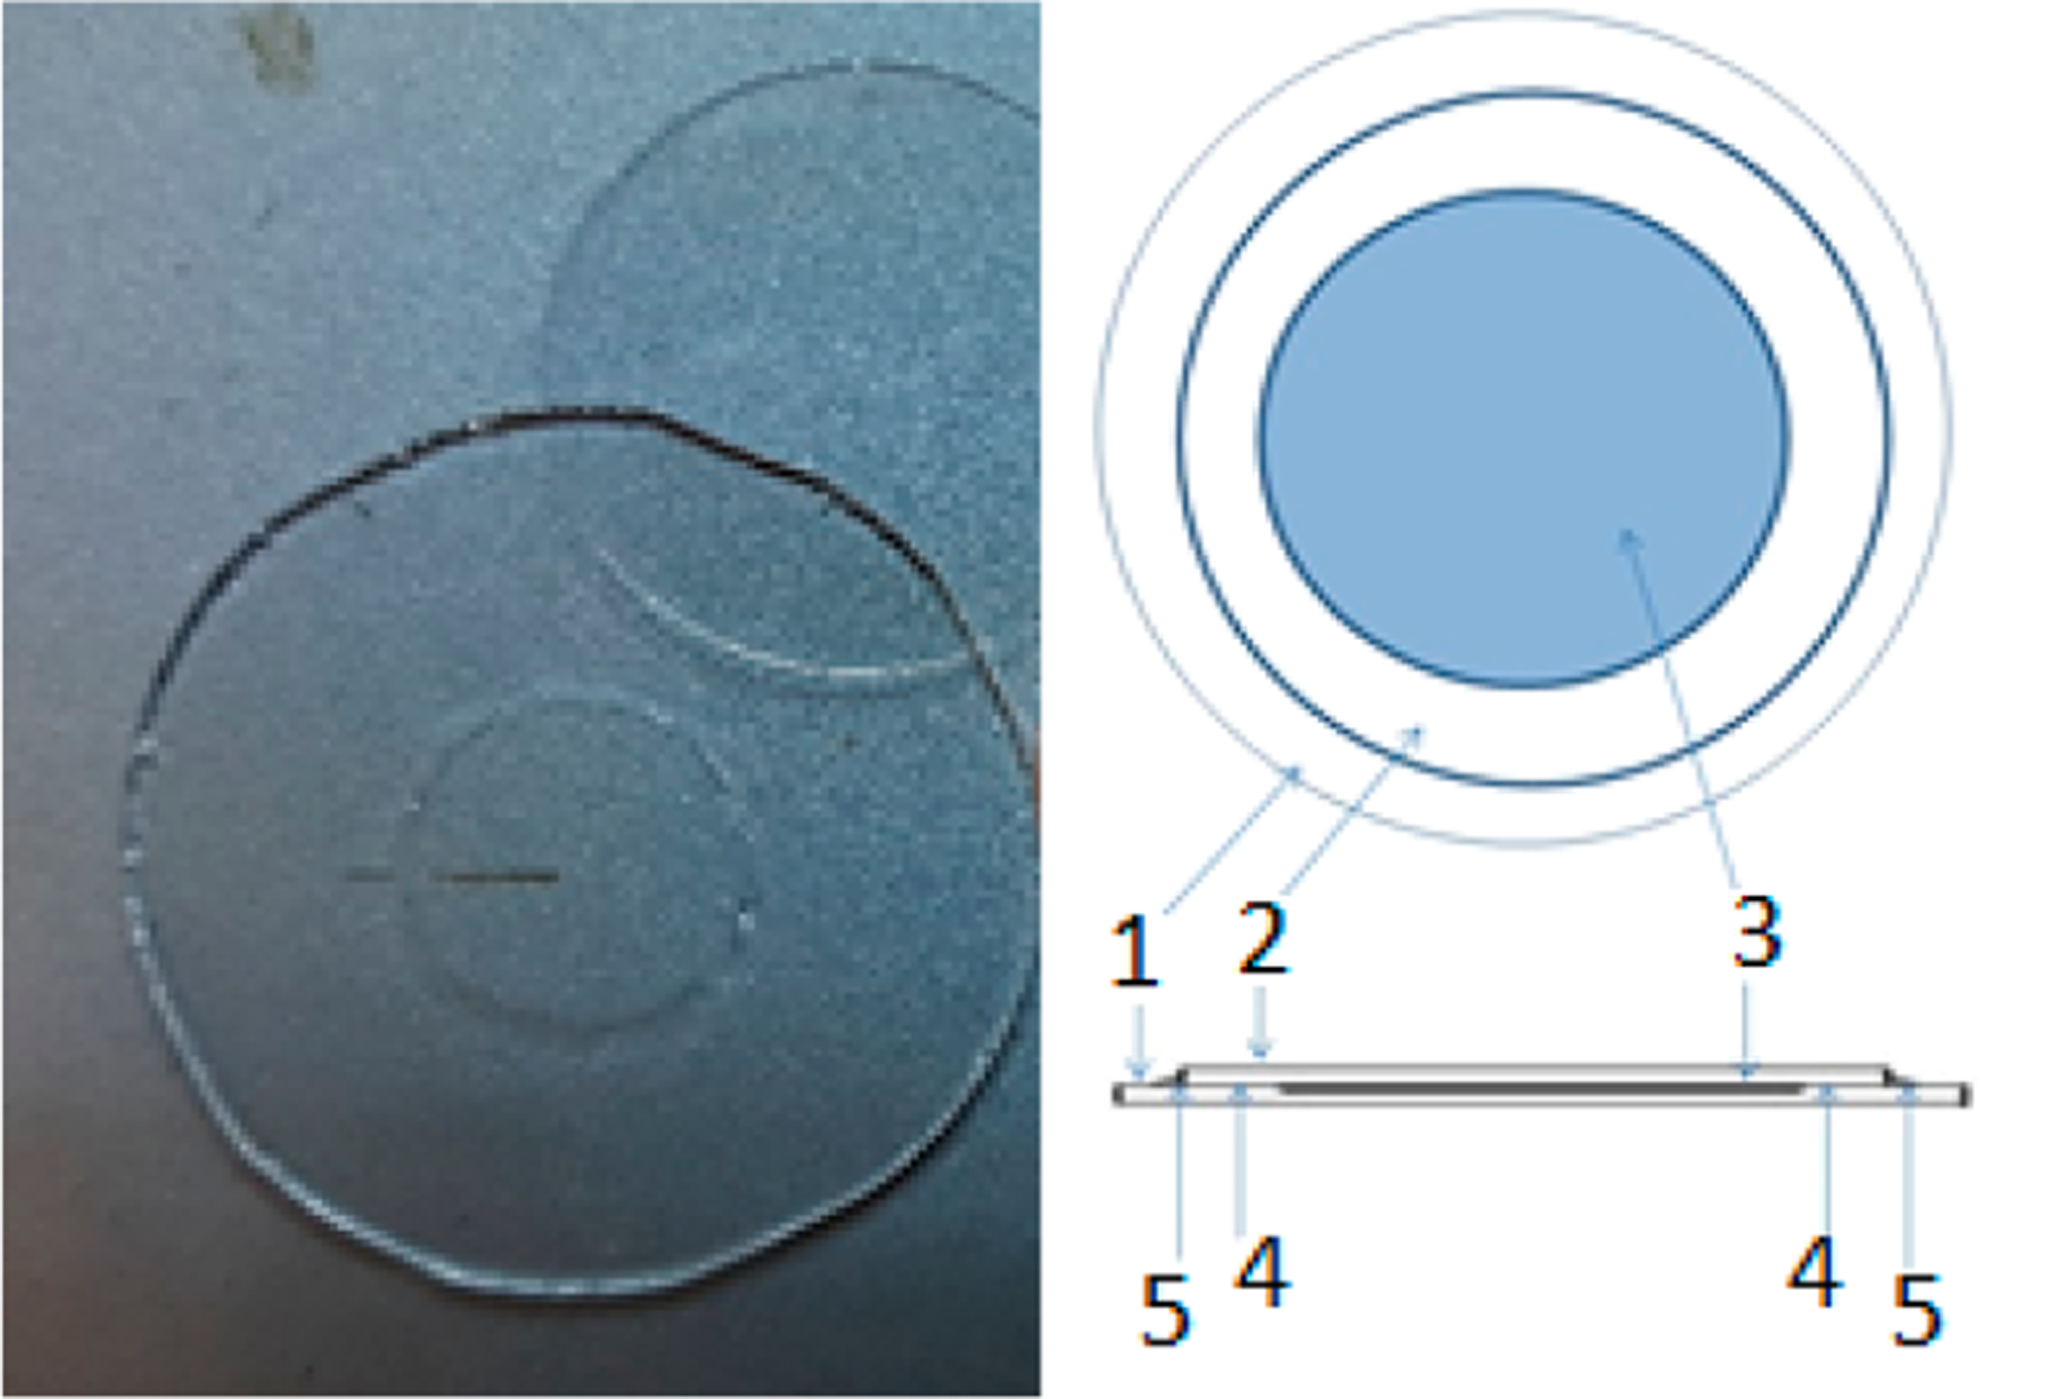
Standard sample holder for lossy samples. (1) Etched quartz plate, (2) unetched quartz plate, (3) etched concave depression filled with sample, (4) vacuum grease applied, and (5) epoxy sealant applied if necessary. The diameters of the etched plate and the cover plate are 25 and 17 mm, respectively, with a disc-like sample region etched into (1) with dimensions of a ca. 4.5 mm radius and 0.2 mm thickness.
Lipid samples for the pulse experiments were prepared by the hydration of 8 mg of d54-DMPC powder with 200 μL of a 0.2 mM solution of PD-DTBN in D2O for ~15 min at 45 °C with occasional vortex mixing. After centrifugation and the removal of the supernatant, the lipid pellet was then subjected to a triple freeze–thaw–pump deoxygenation cycle, sealed under vacuum, and transferred to an anaerobic glove chamber. Then, under argon, it was placed in the sample holder the same way as for the R• solution, but with additional sealing using Norland UV-hardening epoxy resin. Note that the step in which supernatant was removed from the pellet that had been equilibrated with a D2O solution of 0.2 mM PD-DTBN was performed below the main phase-transition temperature of DMPC of 23.7 °C. At 40 °C, the temperature of most 2D ELDOR experiments in this system, the actual concentrations of the nitroxide in the water and lipid phases are estimated to be ~60 μM and ~1.7 mM, respectively, due to a sharp change in the partition coefficient at the transition point.
The trityl radical standard for determining the intensity of the 2D ELDOR signal as a function of the magnetic field offset contained 0.4 mM trityl in 2 mM NaOH. It was also thoroughly deoxygenated by a triple freeze–thaw cycle and handled in an anaerobic manner similar to that of the lipid sample.
To estimate the effective B1 value for our experiments on lossy samples, a small crystal of LiPC was placed in the anaerobic chamber in the middle of the concave depression in the sample holder and coated with a small amount of melted paraffin. Then a test sample with the buffer solution using this concave plate was prepared to match the dielectric properties of the samples that were studied.
X-Band EPR spectra were recorded at a microwave frequency of 9.4 GHz on a Bruker ELEXYS-II E500 spectrometer. CW and 2D-ELDOR spectra at 95 GHz were recorded at the recently updated ACERT Mark II High Power quasioptical 95 GHz spectrometer.18–20 (See the next subsection.)
II.C. Instrumentation (95 GHz) for 2D ELDOR.
In 2D ELDOR, the second spectral dimension, coupled with the ability to distinguish homogeneous broadening, greatly increases the sensitivity to molecular motions. Whereas high-field, high-frequency experiments offer improved resolution of the structure and dynamics, 95 GHz millimeter-wave technology is not as well developed as microwave technology in the 9–17 GHz regime; therefore, we are engaged in a continuing process to improve its application to 2D ESR spectroscopy. We have developed a 95 GHz high-power pulse spectrometer based on quasioptical technology (Figure S1).19,20 In this instrument, we employ a 1.2 kW extended-interaction klystron (EIK) amplifier to generate intense and coherent nanosecond π/2 pulses, which are guided into the Fabry–Pérot (F–P) resonator containing the sample. A block diagram of the complete spectrometer is shown in Figure 2.
Figure 2.
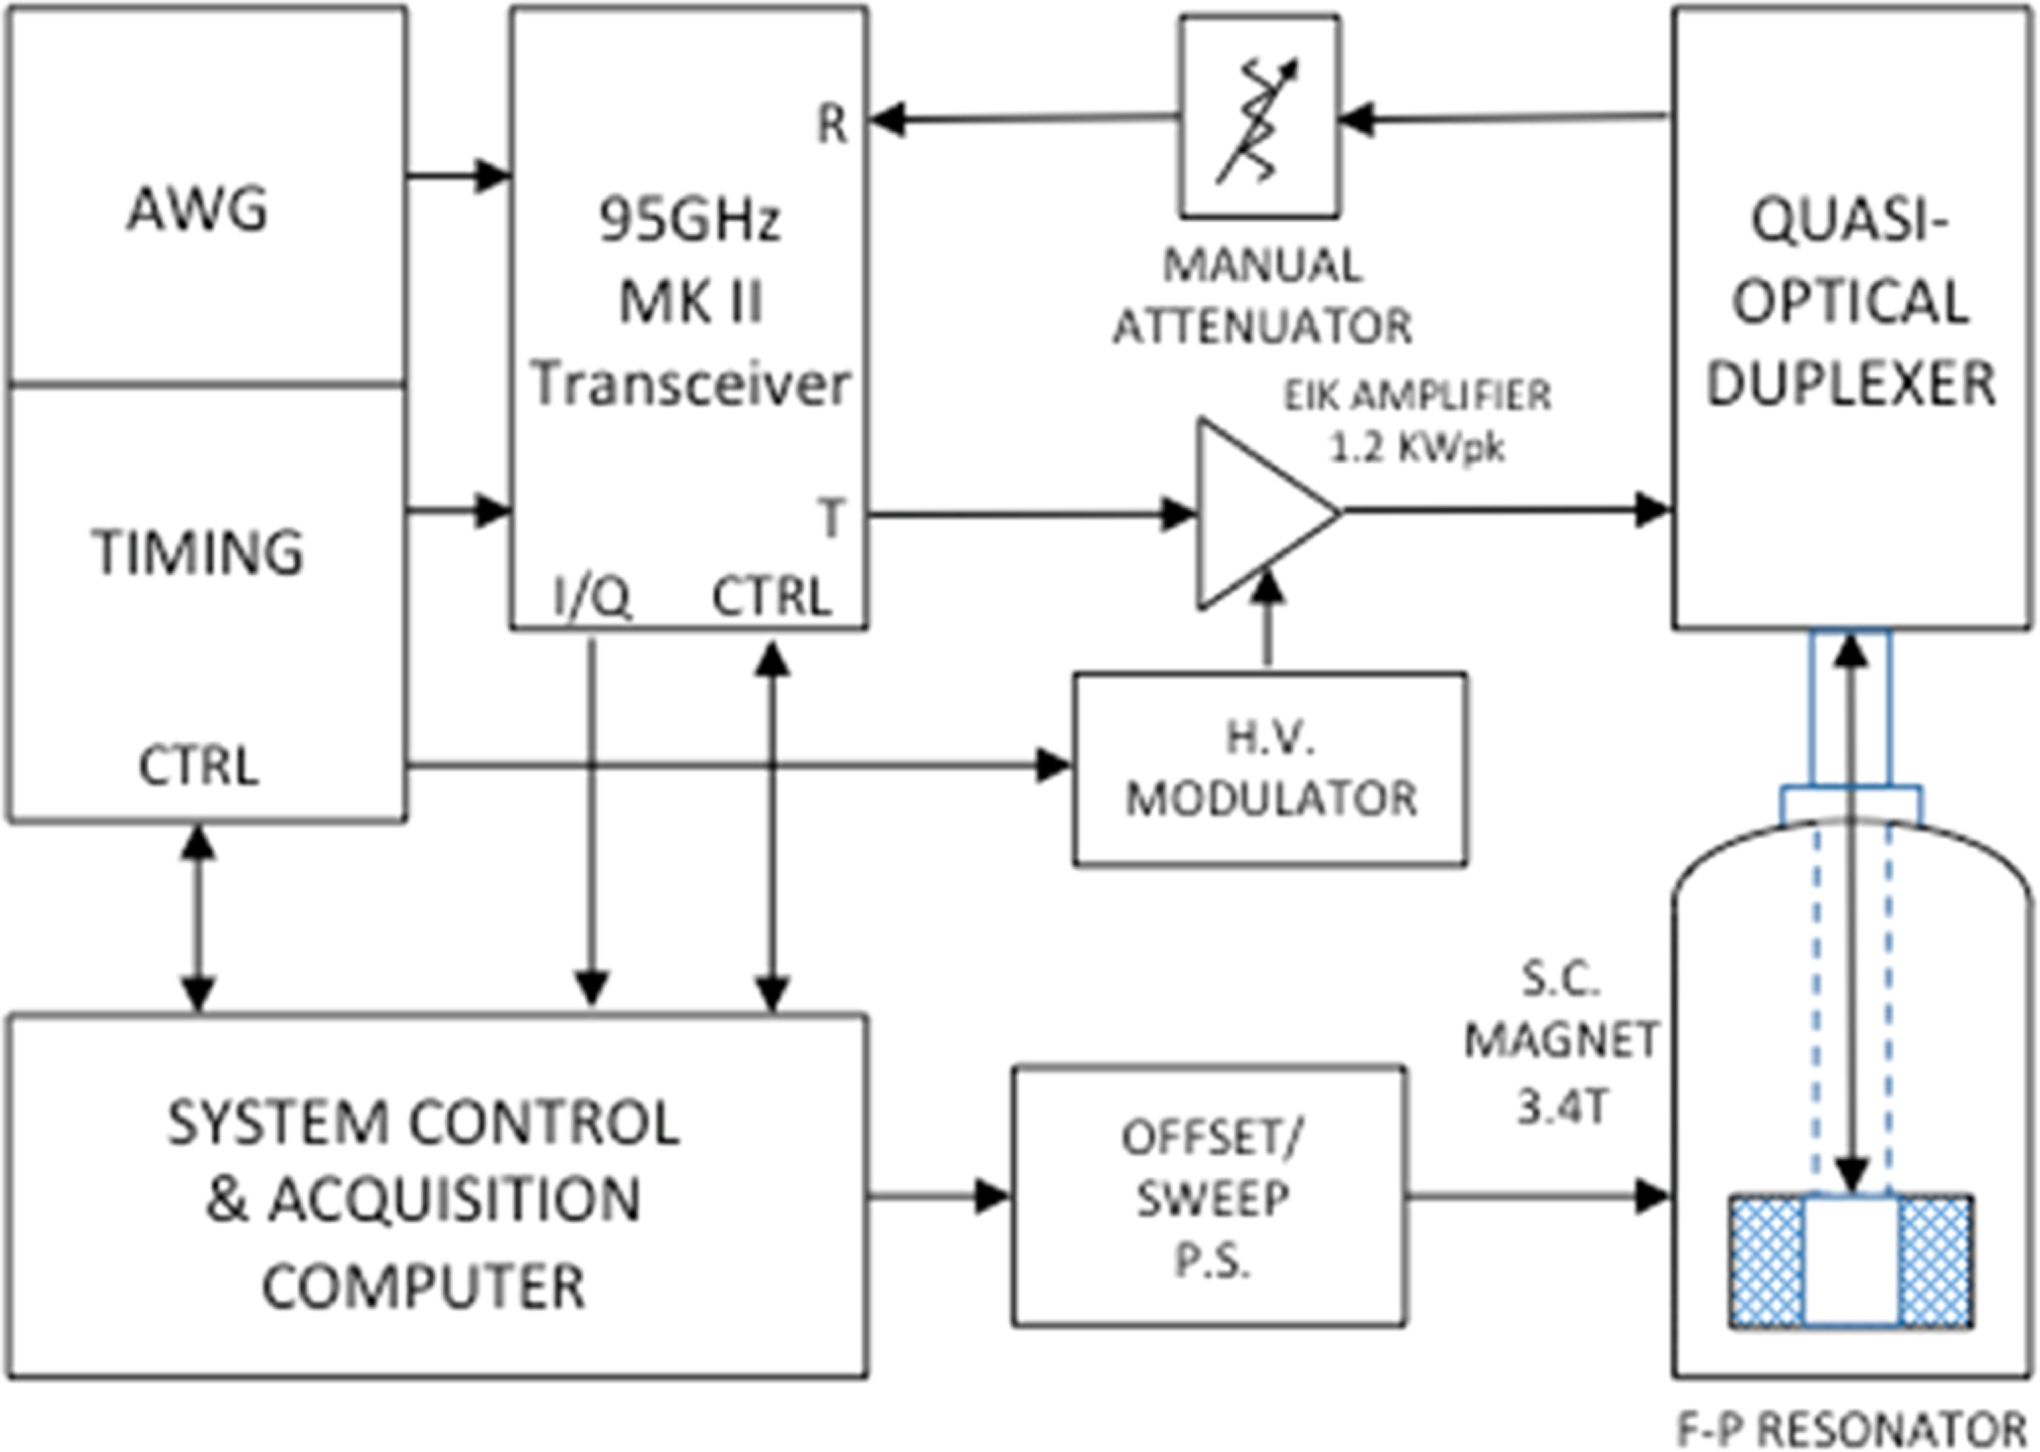
Block diagram of the MK II 95 GHz high-power pulse spectrometer. Pulse sequences of 1 ns resolution (software-upgradable to 500 ps resolution) are produced by the system-controlled computer and timing/arbitrary waveform generator (AWG) sections (DPG11–8M, DAX22000–8M, Wavepond, Langley, WA). The timing signals provide transmitter/receiver (Tx/Rx) gating and quadrature phase-shift keying (QPSK) phase-sequencing control; the AWG-driven wide-band analog I/Q vector-modulation inputs may be utilized simultaneously. Modulated 95 GHz pulses as narrow as a 2.5 ns FWHM are produced by the MK II transceiver (see the text), amplified to the 1.2 kW level in the EIK (extended interaction klystron, VKB2469, CPI Georgetown Ontario, Canada) and are directed via the quasioptical bridge of Figure S1 to an F–P resonator located in the bore of a superconducting magnet at 3.4 T (Oxford GT narrow bore, Abington, U.K.). The orthogonally coded ESR signal is directed through a manually operated attenuator to the receiver port of the transceiver. The 500 MHz bandwidth transceiver I/Q outputs are digitized at 1 G-sample/s. The overall bandwidth of the spectrometer hardware is ±250 MHz; consequently, the limiting factor in spectral coverage is the F–P resonator B1 of 15–18 G.
Recent ACERT millimeter-wave instrumentation development in cooperation with millimeter wave specialists (ELVA-1, St. Petersburg, Russia) has resulted in a substantial upgrade to a new, highly stable “MK II” version of the spectrometer’s original 95 GHz transceiver, providing significantly increased receiver sensitivity and bandwidth and transmit-modulation versatility. For probing molecular motions and exchange phenomena on a longer time scale, the sensitivity improvement of the MK II receiver now extends the capability of observing the evolution of cross-peaks to several microseconds, which is typically after substantial T1 decay. Receiver signal-to-noise performance has been significantly improved, with a reduction of the MK II receiver front-end noise figure to <4.5 dB from the “MK I” receiver’s value of ca. 12 dB, enabling weaker signals to be detected, thus permitting the use of longer mixing times, Tm. Also data collection and averaging times have been decreased by a factor of better than 2.4; this appreciably reduces drift effects. Transceiver frequency stability is now better than 1 ppm/h, thereby further enhancing resolution over long averaging times. The transmission bandwidth and versatility of the MK II transceiver are now based entirely on the heterodyne architecture, whereas the MK I transceiver relied upon frequency multiplication via bandwidth-limited IMPATT diode devices. Accordingly, the nanosecond-scale MK II transmitter pulse-forming and QPSK modulation performance now permit a wider range of pulse patterns. The MK II transceiver is capable of very well defined short pulses down to 2.5 ns FWHM compared to the 4.5 ns minimum pulse capability of the MK I transceiver.
Our quasi-optical bridge and state-of-the art MKII receiver section permits us to access signals with T2 decay times that are as short as 15 ns, which is more than sufficient for the present project. However, we are currently exploring the means of further spectrometer dead-time reduction by a minimization of transmission path impedance discontinuities and the utilization of AWG techniques for active ring-down compensation. Increased spectral coverage by B1 enhancement has been achieved in preliminary studies via dielectric loading of the 95 GHz F–P resonator and will be incorporated in the near future. AWG-driven wave-shaping for more extended coverage is also being explored.
II.D. MKII Spectrometer Performance.
As will be seen below, very good 2D-ELDOR signals could be obtained for shorter Tm times (100–200 ns) from 50 μM solutions of R• with about 8 min of signal averaging at a repetition rate of 5 kHz. But for longer Tm (e.g., 2 μs), greater accumulation times were required due to T1 signal decay and the use of a slightly reduced repetition rate of 3.6 kHz. The 16- and 32-step phase-cycle sequences that were utilized have been discussed elsewhere.34
Given a nominal dead time, td, of ca. 22 ns for the spectrometer, we chose a safe dead-time cutoff of 30 ns, which was sufficient for the present studies.
The B1 value for a point sample (a crystal of lithium phthalocyanine radical) in a nonlossy environment without dielectric enhancement is ~18 G, corresponding to a π/2 pulse of 5 ns. Under the conditions of our experiment, which is performed with relatively large volumes of water in the sample holder (cf. Figure 1) (ca. 13 μL), this value is about 13 G, as measured by Rabi oscillations for a single pulse FID experiment.
The spectral coverage for a 2D ELDOR experiment was obtained by recording signals from an aqueous solution of the trityl radical in the same sample holder that was used for our 2D exchange experiments.
As seen in Figure S2, the bandwidth for our 2D ELDOR experiments allows for nearly complete coverage for the whole spectrum of a nitroxide radical (32–35G) in the fast-motional regime and for full coverage of any of two hyperfine lines in this spectrum. As also shown in Figure S2, the bandwidth for the three π/2 pulse 2D ELDOR experiment is nearly half that of a single π/2 pulse FID.
The development of cross-peaks between two hyperfine lines (MI = +1 and 0) due to strong Heisenberg exchange36 (HE) in a 1 mM solution of PDT in water is shown in Figure 3. Note that the intensity of the cross-peaks at longer mixing times (see below) reaches the intensity of the auto-peaks, which is indicative of sufficient spectral coverage for these lines. At 50 μM, one sees that HE is completely suppressed, as evidenced by negligible cross-peaks between the hf lines with MI = +1 and −1 and the absence of any change in the cross-peak to auto-peak ratio with further decrease in the PDT concentration.
Figure 3.
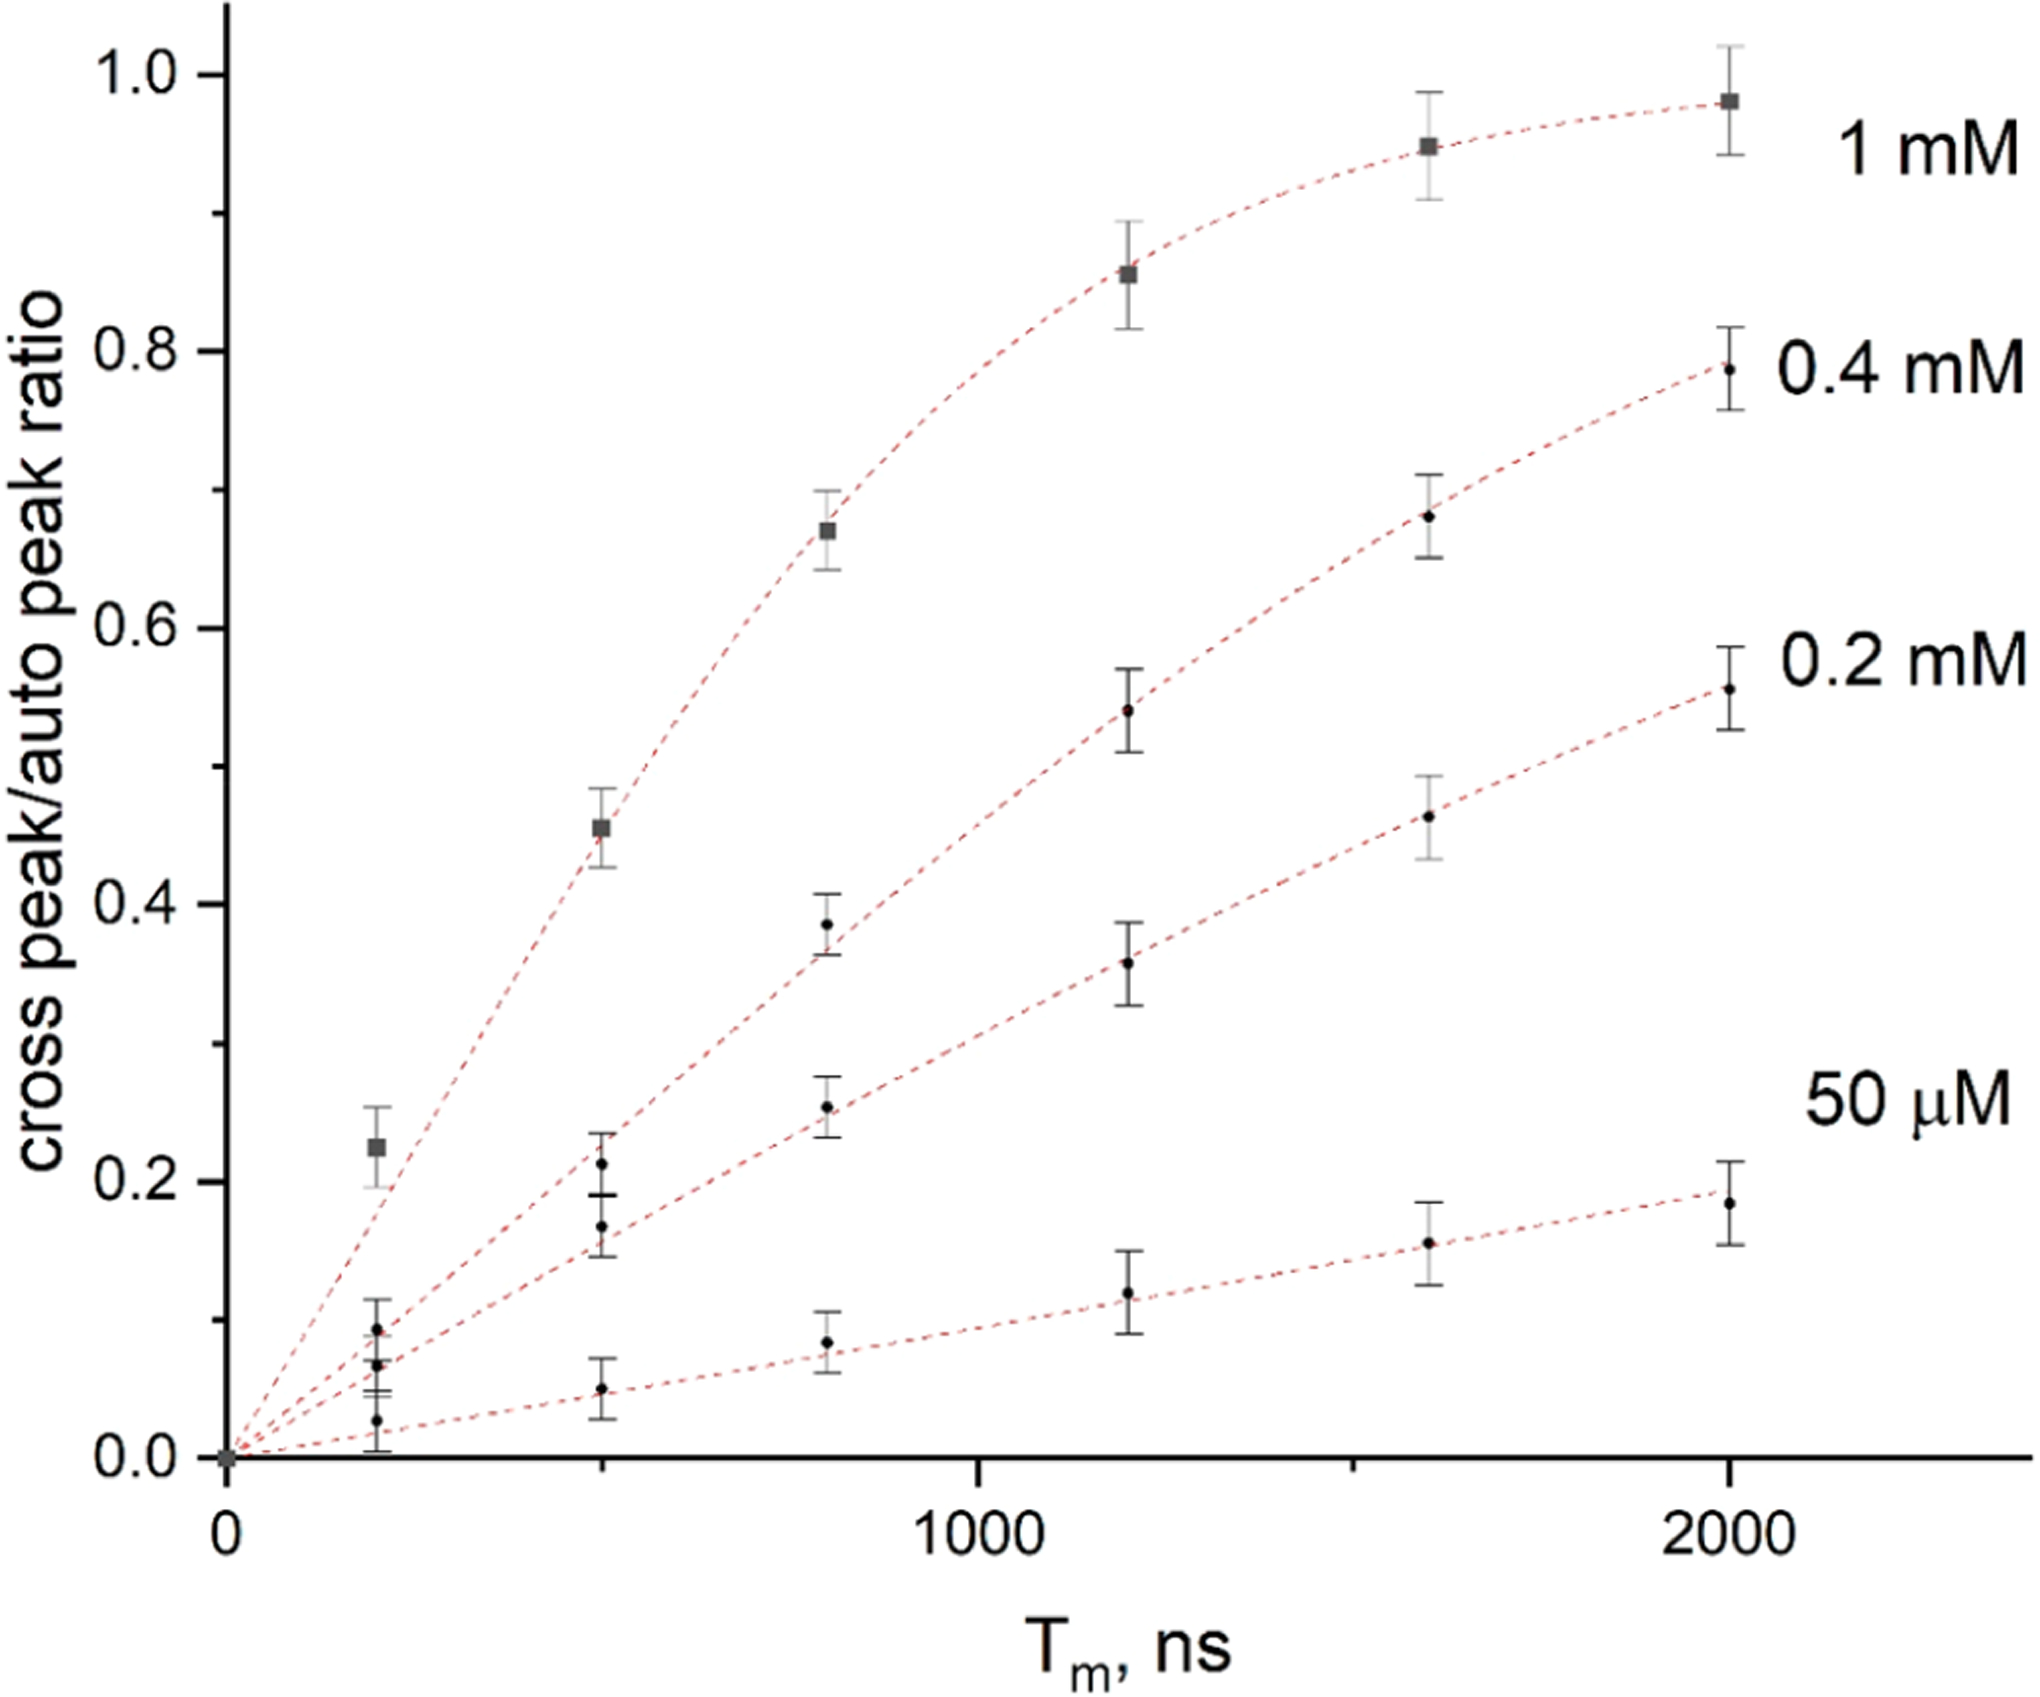
Cross-peak/auto-peak ratio vs Tm for different concentrations of PDT in water at 17 °C, determined as the average of the amplitudes of the two cross-peaks between hf lines with MI = 0 and +1 divided by the intensity of the auto-peak with MI = 0. Dotted lines present fits to the exponential expression (1 − exp(1 − ωcrossTm))/(1 + 2 exp(−ωcrossTm)) (ref 8), where ωcross is the rate of the cross-peak development due to both Heisenberg exchange and the END mechanism: ωcross = ωHE + 3Wn. Note that at 50 μM the HE has been significantly suppressed and the slow growth of cross-peaks is due to the weak electron–nuclear dipolar (END) mechanism, Wn (Section II.E).
Since the frequency separation between exchanging hf lines for both exchange experiments in Section III is substantially less than the distance between the hyperfine lines, our current capability, in terms of spectral coverage, is more than adequate for our study.
II.E. 2D-ELDOR Experiment.7–9
The 2D-ELDOR experiment utilizes three very short π/2 pulses, each of which simultaneously excites the full ESR spectrum in a coherent fashion. This pulse sequence is shown in Figure 4, and by appropriate phase cycling,8,34 the Sc− and Sc+ coherence pathways also shown in this figure are selected. The Sc− pathway is echo-like and is favored over the Sc+ pathway which is FID-like since it remains stronger after the finite dead time, td. The 2D spectrum is obtained by Fourier transforming with respect to times t1 and t2. This leads to auto-peaks, which provide the normal ESR spectral lines and cross-peaks. The real-time evolution of the 2D-ELDOR spectrum is obtained by stepping out the mixing time Tm. In typical 2D-ELDOR experiments, the cross-peak development as a function of Tm is due to nuclear-spin transitions induced by motional modulation of the electron–nuclear dipolar (END) term, coupling the different hf lines which have a selection rule of ΔMI = ±1, where MI is the nuclear spin quantum number (e.g., for 15N these are transitions between the MI = +1/2 and −1/2 nuclear spin states, and for 14N they correspond to −1 ↔ 0 and 0 ↔ + 1 transitions).7–9,35 For example, for 14N they lead to cross-peaks between the MI = ±1 and 0 hf lines but not between the ±1 and ∓1 hf lines. As the spin concentration is increased, the mechanism of Heisenberg spin exchange (HE), involving bimolecular collisions of electron-spin-bearing molecules, becomes increasingly important. This mechanism yields cross-peaks between all of the hf lines (e.g., for 14N: ±1 ↔ 0 and ±1 ↔ ∓1 hf lines).7–9,35,36 This difference in their cross-peak selection rules enables them to be distinguished in a 2D-ELDOR experiment. However, they are frequently distinguished by the simple fact that HE is a spin-concentration-dependent mechanism whereas END is concentration-independent.
Figure 4.
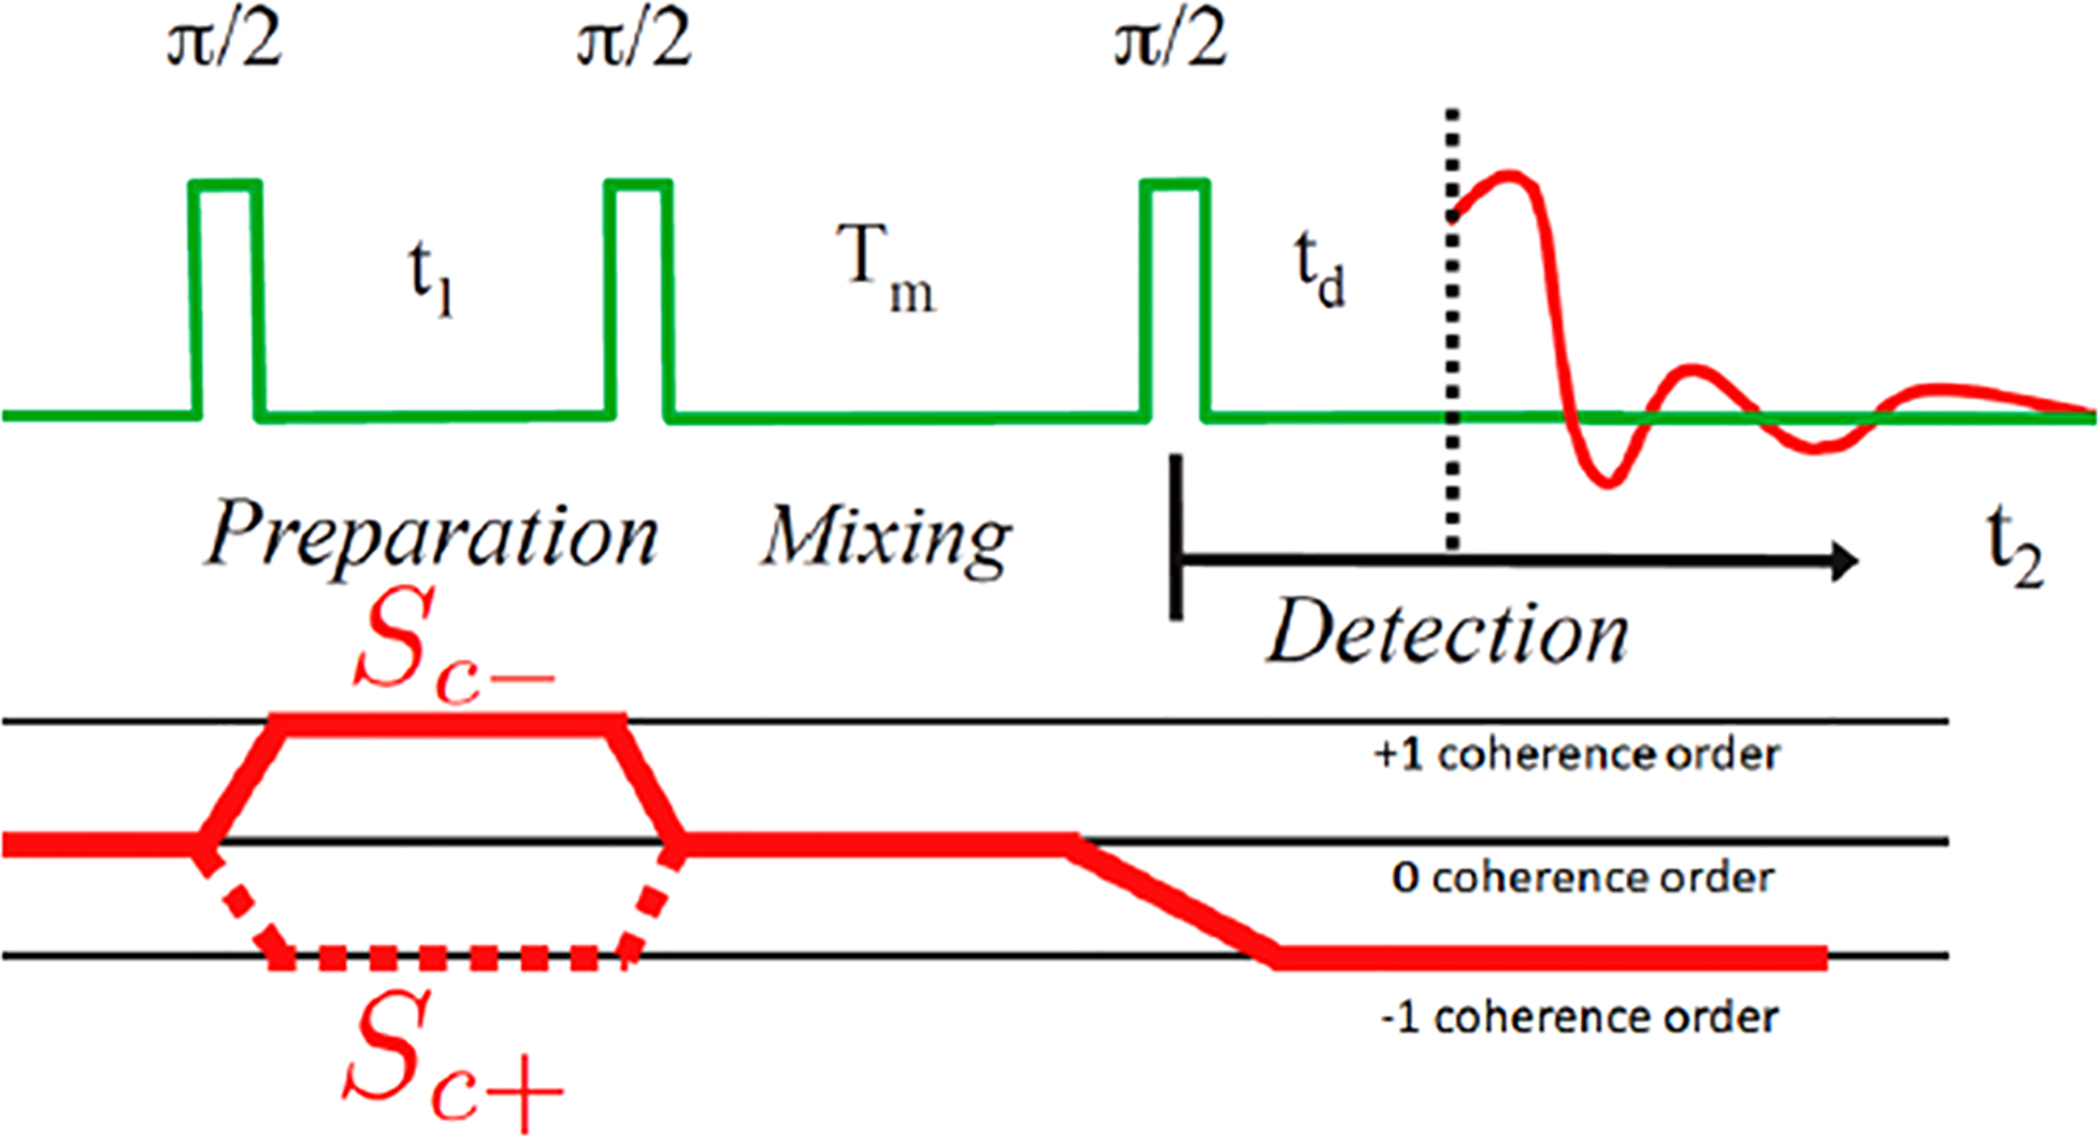
Schematic of the 2D-ELDOR experiment, with three π/2 rotation microwave pulses. Coherence pathways Sc+ and Sc− are also shown.
The 2D-ELDOR experiments described in this article are all in the motionally narrowed region wherein END and HE cross-peaks are usually clearly distinguishable. However, in this work we also consider chemical exchange (CE) [and physical exchange (PE)] processes, so we will need to distinguish their contributions to the 2D-ELDOR spectra from those of END and HE. All of these mechanisms are well-described within the context of fast motional theory.8,13
We first illustrate the effects of END and HE in 2D-ELDOR experiments with two different distinguishable species between which there is no CE (or PE) so that we can discriminate them from the effects of CE on 2D-ELDOR spectra which are described in Section III. This is a mixture of the 14N and 15N isotopes of PDT. In Figure 5, the various sources of cross-peaks are delineated. Note that HE can lead to cross-peaks between 14N and 15N hf lines, whereas END cannot.
Figure 5.
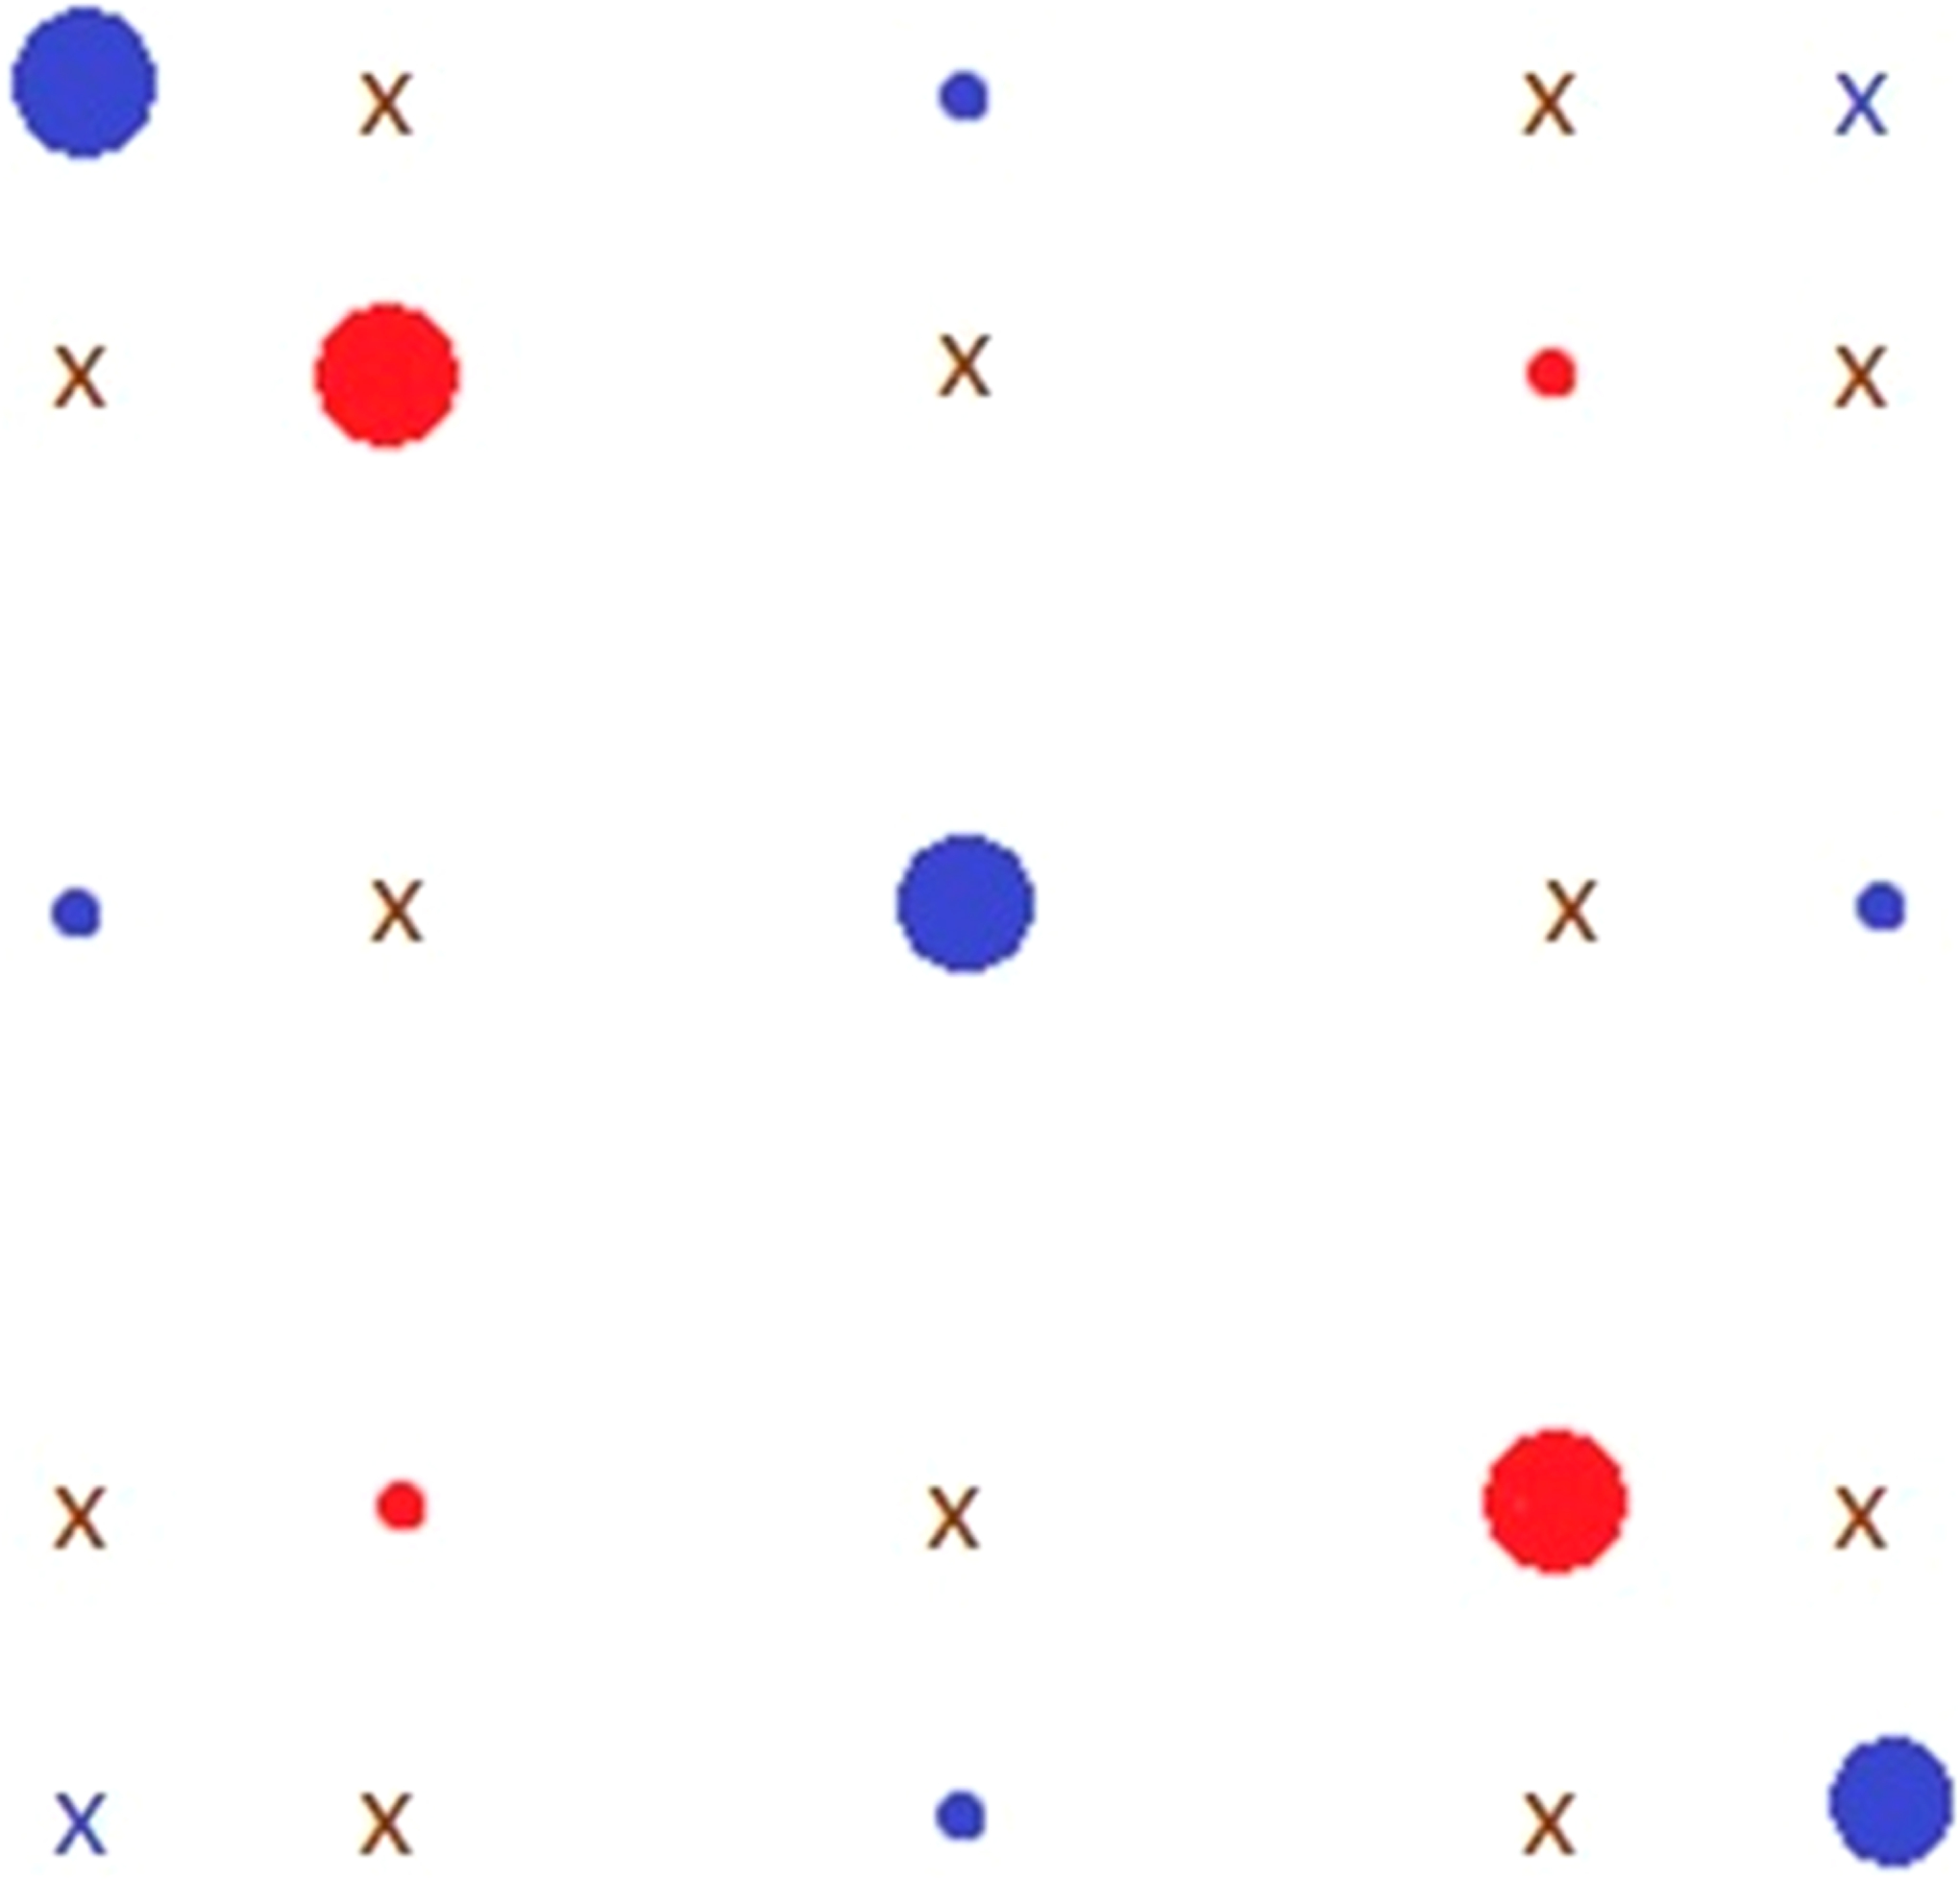
Possible cross-peaks in the mixture of 15N-PDT and 14N-PDT. Large circles represent the positions of the auto-peaks (red for 15N-PDT and blue for 14N-PDT), small circles show the corresponding cross-peaks which appear due to both HE and END, and symbol “x” indicates cross-peaks which appear only as a result of HE but not END. HE cross-peaks between the hf lines of 15N and 14N species are shown in brown, and the blue crosses show cross-peaks between hyperfine lines with MI = −1 and MI = +1 of 14N-PDT.
Figure 6 and Figure S3 show the manifestations of these two mechanisms of cross-peak development in mixtures of 15N- and 14N-PDT in aqueous solution. (Note that in this work we use the directions of f1 and f2 axes similar to29 and the reverse of those in some earlier publications on 2D ESR;7,15,20 this convention better visually relates the 2D ELDOR plots to the corresponding CW spectra.) Some of these figures have the auto-peaks removed by subtraction of the spectrum at the shortest Tm and just show the cross-peaks. One can see that for high concentrations (Figure 6) HE causes the development of multiple cross-peaks, including between the hf lines of different isotopic species. With a decrease in the spin concentration, most of these lines disappear, except two cross-peaks between the lines of 15N-PDT and four cross-peaks between adjacent lines of 14N-PDT (Figure S3). The presence of only these peaks indicates the END mechanism. 2D-ELDOR data in Figure S3 show the complete elimination of HE at a PDT concentration of between 25 and 50 μM, which is consistent with results obtained much earlier with CW-ELDOR.35 Note that no other ESR technique besides ELDOR is capable of studying and even detecting the END-related nuclear relaxation. The rate of this END process, which is intramolecular and cannot give cross-peaks between hf lines from the two different isotopic species, can be estimated from the plot of the cross-peak/auto-peak ratio vs mixing time Tm at low radical concentrations in the absence of HE. For example, for PDT in water this rate constant (Figure 3) determined as described in ref 7 is ~9 × 10⁴ s−1. At higher concentrations of PDT and the emergence of Heisenberg exchange, the cross-peaks develop more rapidly, with the rate of this development expressed as ωcross = ωHE + 3Wn (see the analysis in ref 8), where Wn is concentration-independent while Heisenberg exchange is a bimolecular reaction with a rate proportional to the concentration of the radical: ωHE = kHE[PDT].
Figure 6.
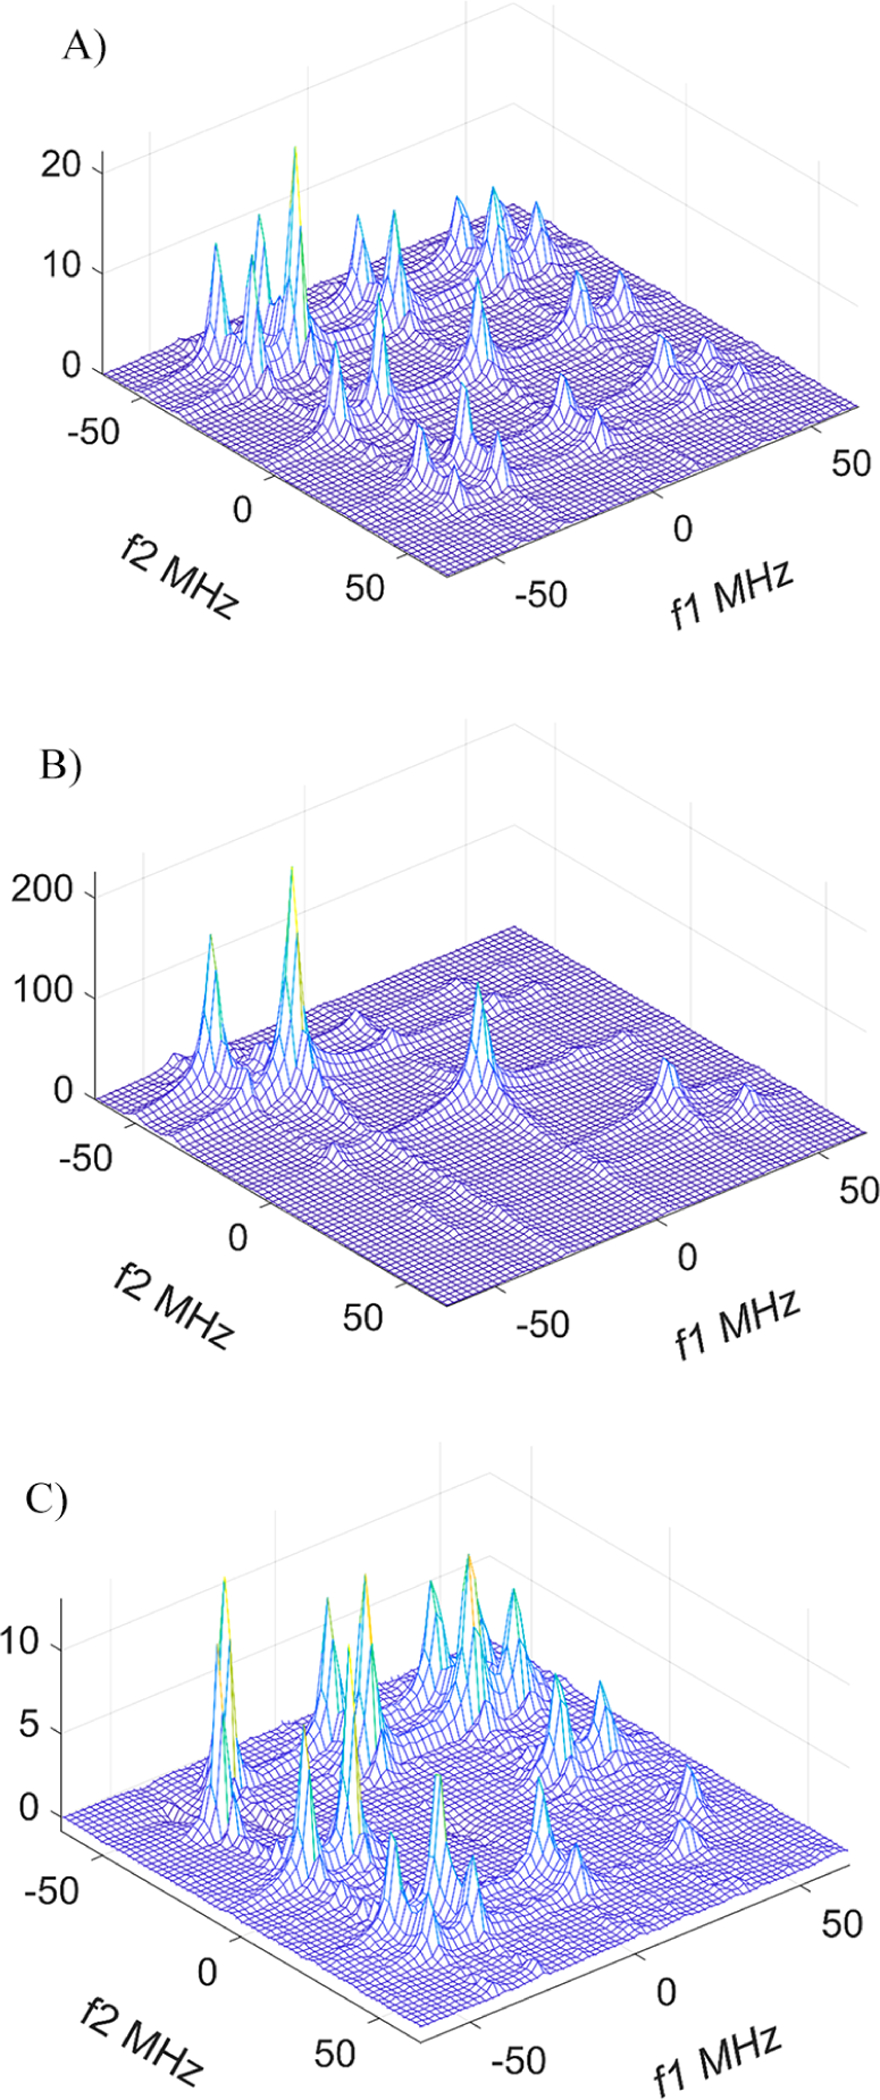
2D ELDOR spectra of the mixture of 620 μM of 14N-PDT and 380 μM of 15N-PDT at (A) Tm = 1.6 μs and (B) 100 ns. (C) Only cross-peaks are shown as obtained by subtraction of the scaled spectrum at Tm = 100 ns for this mixture. One finds the complete disappearance of cross-peaks caused by Heisenberg exchange at the lower concentrations (Figure S4). (Note that in this figure and all subsequent figures the frequency scales are set so that the zero frequency corresponds to the actual applied millimeter wave frequency of the experiment.)
For example, at 1 mM the rate of cross-peak development is 2.83 × 10⁶ s−1. Of this rate, ~2.56 × 10⁶ s−1 is due to Heisenberg exchange, which gives an HE constant for PDT of (2.56 ± 0.13) × 109 M−1 s−1. For comparison, the HE constant obtained with the CW X-Band EPR from the line broadening in PDT solutions is 2.77 × 10⁹ M−1 s−1 (Figure S3). Note that the estimates of the error for the rates and rate constants determined from fitting the experimental data in Figure 3 to the relevant exponential expressions or by linear regression in Figure S3 are well within 5%.
One notes in Figure 6 that the intensity of the auto- and cross-peaks decreases across the 2D spectrum as f1 and f 2 increase. This is largely due to the well-known hf broadening mechanism that is linear across the spectrum, arising from a cross-term between the g tensor and hf tensor, and more prominent at 95 GHz, as well as the effect of the finite dead time leading to greater attenuation of the broader hf lines during the deadtime.
In 2D-ELDOR, a useful means of measuring the overall electron spin signal decay with decay constant T1 is to measure the double integral over the f1-f 2 plane including all auto- and cross-peaks. This integrates out the effects of the END and HE mechanisms which merely transfer the electron-spin polarization among the hf components.8,9,20 However, in this work we simply use for the most part peak heights instead of integrals. It is generally a convenient approximation for obtaining cross-peak to auto-peak ratios between components with very similar shapes (e.g., hf lines with MI = 0, +1 for an 14N nitroxide (cf. Figures 3 and 6)). In the next section (Section III.A), we use a similar approach for this ratio due to chemical exchange (CE), which is the dominant process, thereby permitting a separate analysis of each hf region (i.e., MI = +1, 0, and −1) and yielding very similar line shapes for the two exchanging nitroxide species. The case of physical exchange (PE) (Section III.B) is a more complex one, requiring actual T1 measurements of auto-peaks, since cross-peaks are weak and thus affected by the tails of the strong auto-peaks as well as by residual artifacts. It is also a case where the auto-peaks of the two components have different T1 and T2 values, which would require a more complex analysis anyway.8 Fortunately it is a case where the END and HE mechanisms are weak compared to the electron-spin relaxation rate We = (2T1)−1 for the aqueous component, which is the one utilized for the T1 measurements. This means that we are able to analyze each hf component (MI = −1, 0, and 1) separately. The use of peak heights vs Tm to obtain T1 is shown for simpler cases of just a single component in Figure S5 to yield virtually identical results to that of the double integrals.
III. CHEMICAL EXCHANGE PROCESSES STUDIED BY 2D-ELDOR
III.A. Chemical exchange between charged and noncharged forms of a pH-sensitive radical.
For the study of protonation/deprotonation, we chose a pH-sensitive imidazoline spin label, 4-amino-2,2,5,5-tetramethyl-3-imidazo-line-1-yloxy (Figure 7) with a pKa at pH 6.1. It is referred to as R•. Figure 7 shows CW spectra of this compound at a pH close to this value. It consists of two triplet components, which are resolved at 95 GHz but not at 9.4 GHz. The component with larger hyperfine splitting and a lower g factor is the uncharged form of R•, and it is virtually identical to the only spectral component seen at pH 10. The second component corresponds to the protonated form, RH•+, and is virtually identical to that recorded at pH 2.5. This provides a very convenient model system since both the ratio of exchanging states and the exchange rate are controlled by the composition and the concentration of the buffer solution, respectively.21
Figure 7.
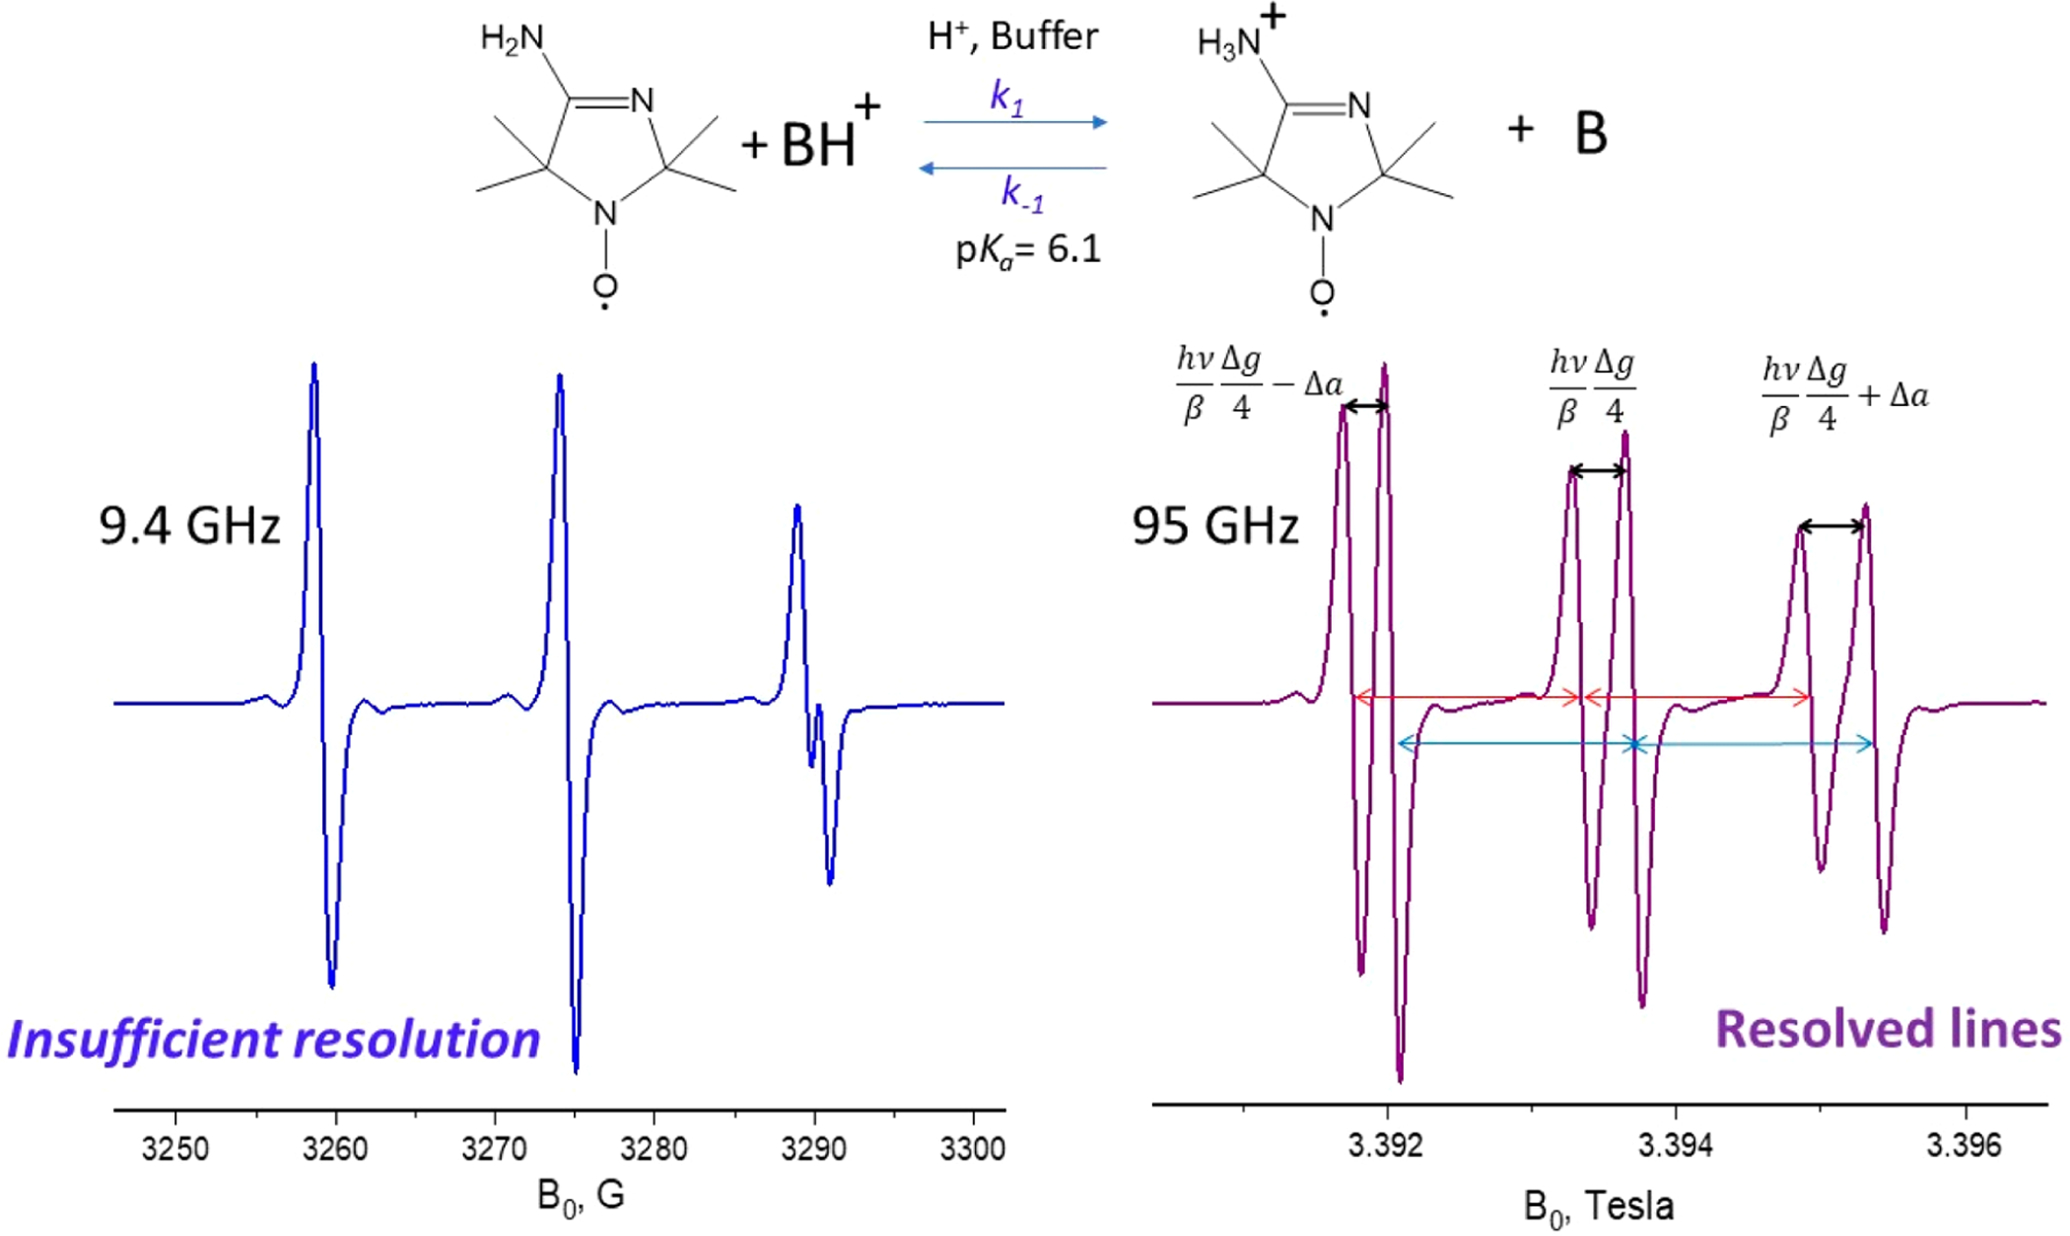
CW spectra of 4-amino-2,2,5,5-tetramethyl-3-imidazoline-1-yloxy in water at pH 6.1 at 9.4 and 95 GHz. The hf separations for the protonated (14.98 G) and unprotonated (15.80 G) forms of the radical are marked in red and blue, respectively, since the pH value is equal to pKa, and the concentrations of the protonated and nonprotonated forms are equal. This difference alone is insufficient to provide good resolution at 9.4 GHz, but the components are well resolved at 95 GHz due to the difference in the g factor of 2.1 × 10⁻⁴ which manifests itself in separations of 0.35 G at 9.4 GHz and 3.6 G at 95 GHz and 3.6 at 95 GHz.
The protonation/deprotonation equilibrium in the presence of buffer is
| (1) |
The concentration ratio of the RH•+ and R• forms of the radical depends only on the pH of the buffer solution according to
| (2) |
However, the exchange rates depend on the buffer concentration. The rates of the protonation and deprotonation reactions for R• are given by the following expressions:
| (3a) |
| (3b) |
Here, k1 and k−1 are the rate constants of the protonation and reverse reactions, respectively, and in this study we keep the ratio of [RH•+] to [R•] close to unity by working at pH close to pKa and controlling the rate of chemical exchange by changing the buffer concentration while keeping the pH value the same. Thus, at equilibrium, where κdeprotonation = κprotonation ≡ κ, equating eqs 3a and 3b, we have k1/k−1 ≅ [B]/[BH+] since [RH•+] ≈ [R•]. In the 2D ELDOR experiment, the chemical exchange manifests itself in the development of cross-peaks between the hf lines corresponding to the [R•] and [RH•+] forms of the imidazoline nitroxide.
To ensure that the cross-peaks originate only from CE but not from HE due to bimolecular collisions between the two forms of the radical present in the solution, the total radical concentration was kept at 50 μM (25 μM for each state). A clear indication of a negligible contribution of HE is the absence of cross-peaks between hf components with MI: ±1 ↔ ∓1 (i.e., ΔMI = ±2). As seen in Figure 8, this criterion is well met at 50 μM concentration so that all of the cross-peak intensity between the spectral lines of charged and noncharged forms of R• (R• and RH•+) is due to chemical exchange. Note also that the dominant CE cross-peaks are primarily between RH•+ and R• hf lines corresponding to the same MI nuclear-spin quantum number. This clearly indicates that it is the same nitroxide moiety exchanging between the protonated and unprotonated forms (i.e., this is a mononuclear process with respect to the nitroxide). The small cross-peaks involving ΔMI = ±1 that are just between hf lines belonging to the same radical species are primarily from the END mechanism that is occurring at a slower rate.
Figure 8.
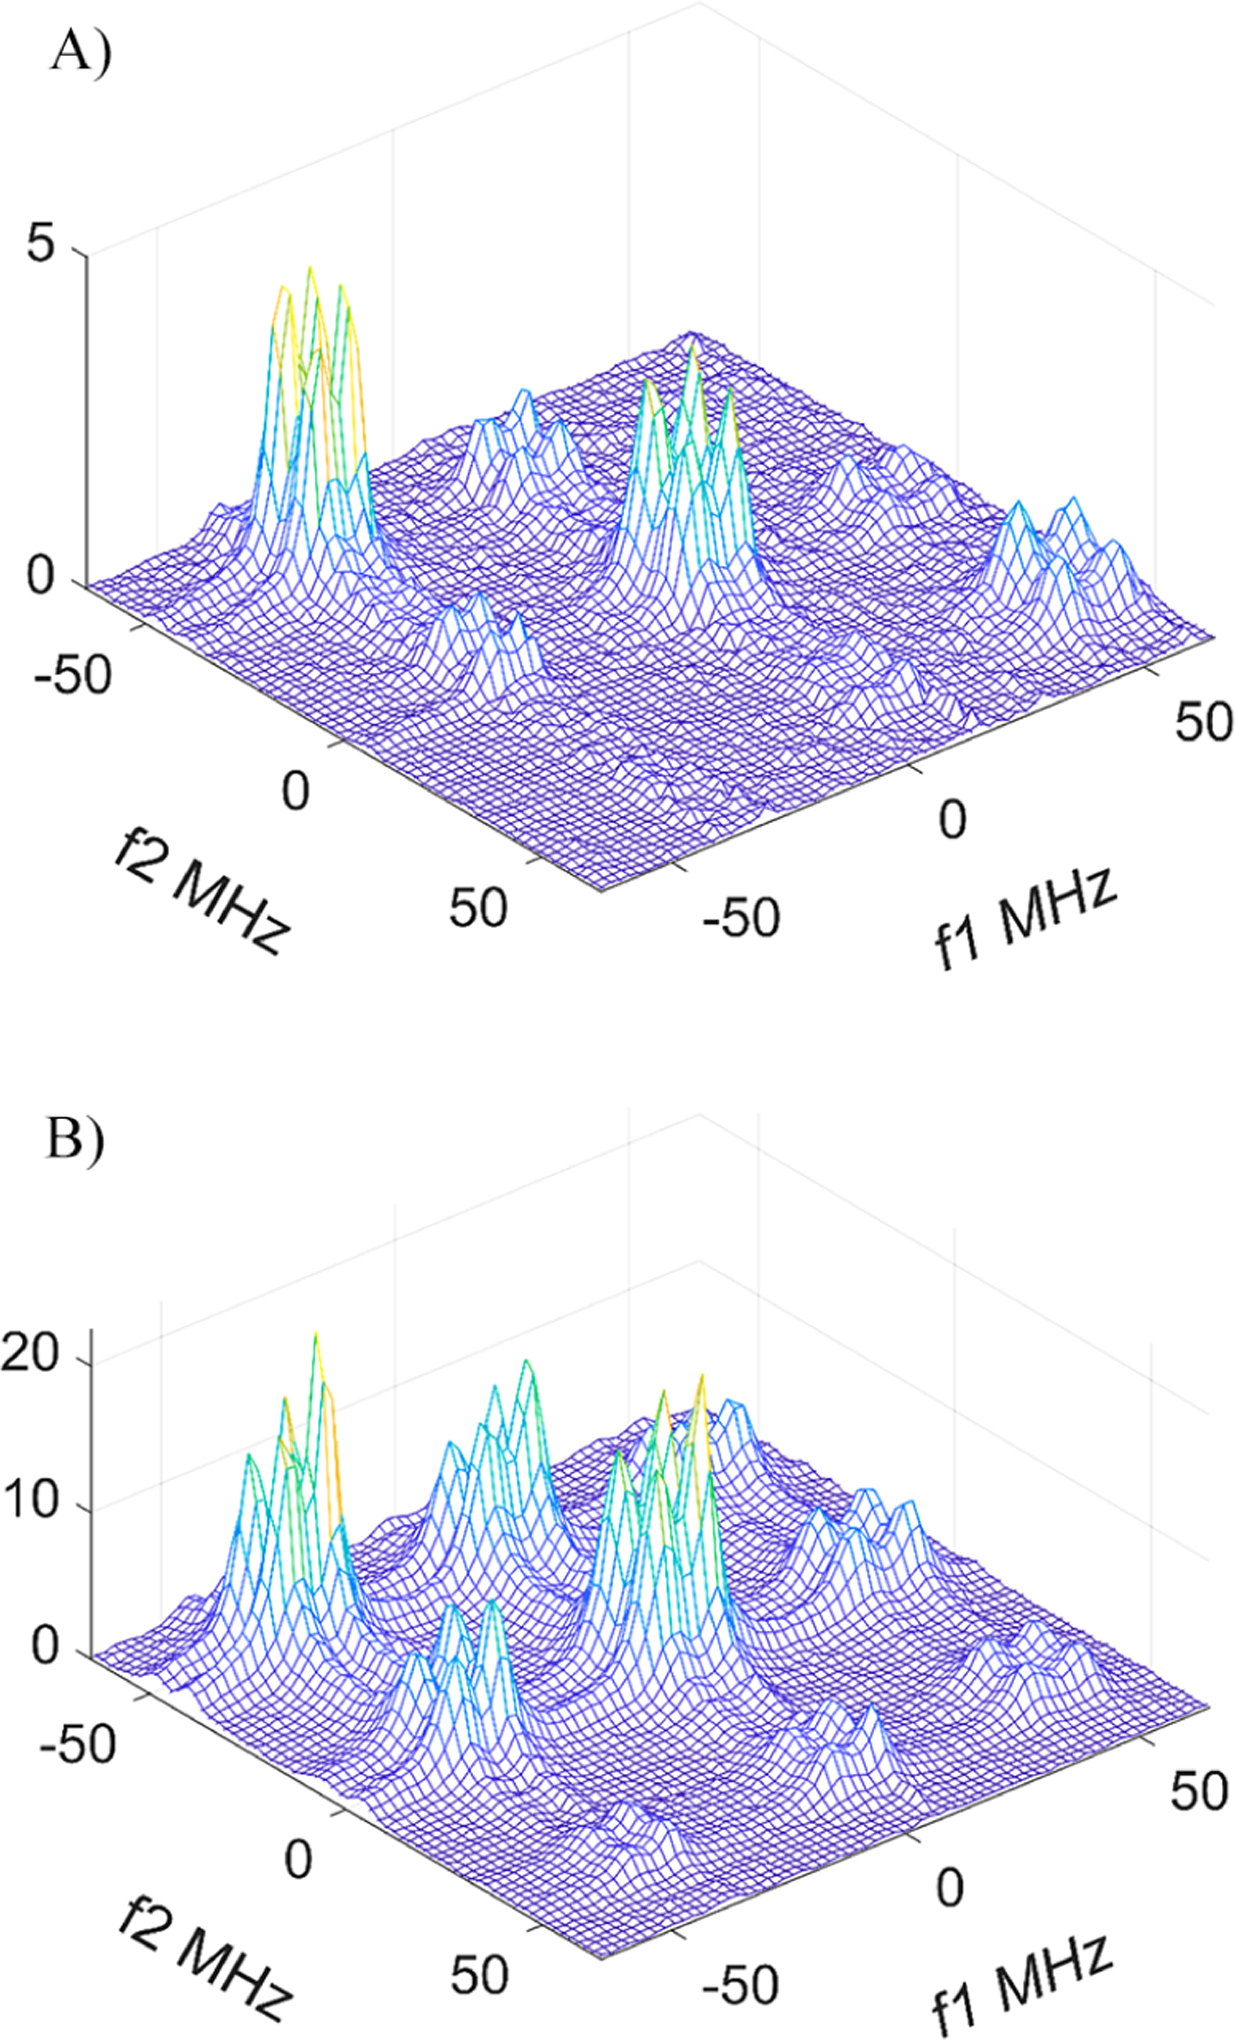
2D ELDOR spectra of (A) 50 and (B) 400 μM of R• at pH 6.1 with a concentration of phosphate buffer of 8 mM. Tm = 1600 ns. Note the near absence of cross-peaks between the hyperfine lines with MI = ±1 (i.e., ΔMI = ± 2) at 50 μM and their presence at 400 μM. It indicates virtually no HE at 50 μM. At this radical concentration, all cross-peak intensity between the lines of protonated and unprotonated forms of R• (R• and RH•+) can be attributed to chemical exchange, while the cross-peaks that are between only the respective hyperfine lines of either R• and RH•+ with ΔMI = ±1 are just due to the END mechanism.
To separate the cross-peaks from the partially overlapping auto-peaks and to analyze the development of the former with increasing Tm, we subtracted the scaled spectrum for Tm = 100 ns from the other consecutive spectra in the Tm series1,37 (Figure 9). The intensity of cross-peaks may be seen from these 2D plots after this subtraction. A helpful result of this subtraction indicates little change in the line shapes during the Tm evolution and very similar T1 relaxation times for both exchanging components. Indeed, if the T1 values were different, then the intensity ratio of the components would be different at different Tm values and we would observe decreasing relative intensity for the component with shorter T1.
Figure 9.
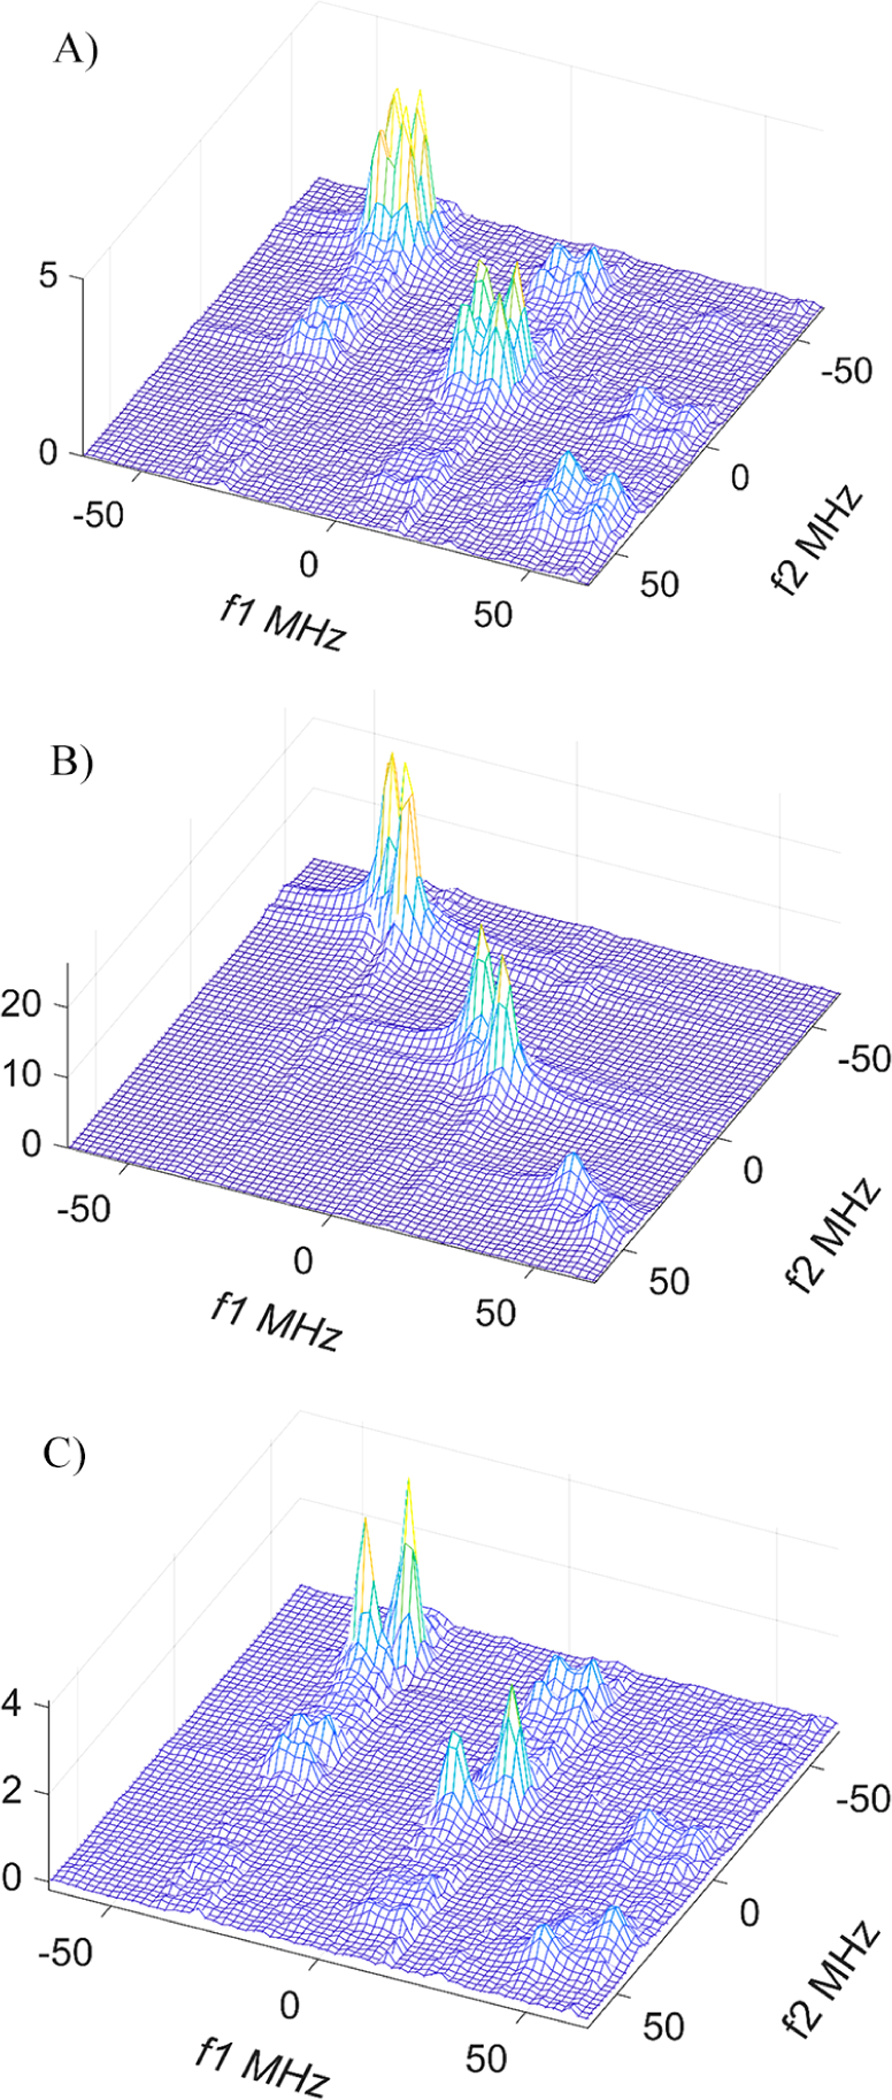
Separation of cross-peaks and auto-peaks by subtraction of the 2D ELDOR spectrum at the shortest Tm. The plots shown correspond to the original spectra with Tm = 1600 ns (A) and 100 ns (B) and the result of their subtraction (C). The concentration of R• + RH•+ is 50 μM, the total phosphate concentration is 8 mM, and T = 17 °C. The amplitude of cross-peaks for each hf line was determined from (C) as a half-sum of the two peak heights and compared with the amplitude of auto-peaks from (A).
To calculate the rate of chemical exchange, we measured the ratio of cross-peaks to auto-peaks and fitted it to the exponential expression (cf. eq S5)
| (4) |
where κ is the exchange rate. Note that eq 4 for F(Tm) is valid for equal populations of the exchanging states, which is true since the experiments have been adjusted to achieve this (see the above discussion), but small deviations would not significantly affect the results as noted in the SI. As expected in this case (Figure 9C), the intensities of both cross-peaks around each hf line are equal.
The development of cross-peaks due to chemical exchange at different buffer concentrations is shown in Figure 10A. As expected, the rate of this exchange is proportional to the buffer concentration (Figure 10B). However, for the HPO42− + H+⇄H2PO4− equilibrium, which includes the two buffering agent forms present under our experimental conditions, pKa = 7.21,38 this means that at this pH, [H2PO4− = [BH] = 12.9 [B] = [HPO42−]. Therefore, for reaction 1, k−1 = 12.9k1 with the corresponding difference in the lifetime of unprotonated and protonated forms of R•. Thus, the chemical exchange rates, as determined from cross-peak to auto-peak ratios (Figure 10), yield k1 = (1.44 ± 0.06) × 108 L/(mol·s) (protonation) and k−1 = (1.84 ± 0.08) × 109 L/(mol·s) (deprotonation). Note that the rate constant for the deprotonation reaction is about one-third of the Smoluchowski limit for a diffusion-controlled reaction in water, which is and equal at 17 °C in water to 6 × 10⁹ L/(mol·s). Note that under these conditions of mM buffer concentrations the rates are insufficient to cause significant line broadening in CW-ESR. To render enough line broadening, it is necessary to increase buffer concentration by an order of magnitude. Furthermore, as in 2D NMR, the cross-peaks clearly show which are the exchanging species.
Figure 10.
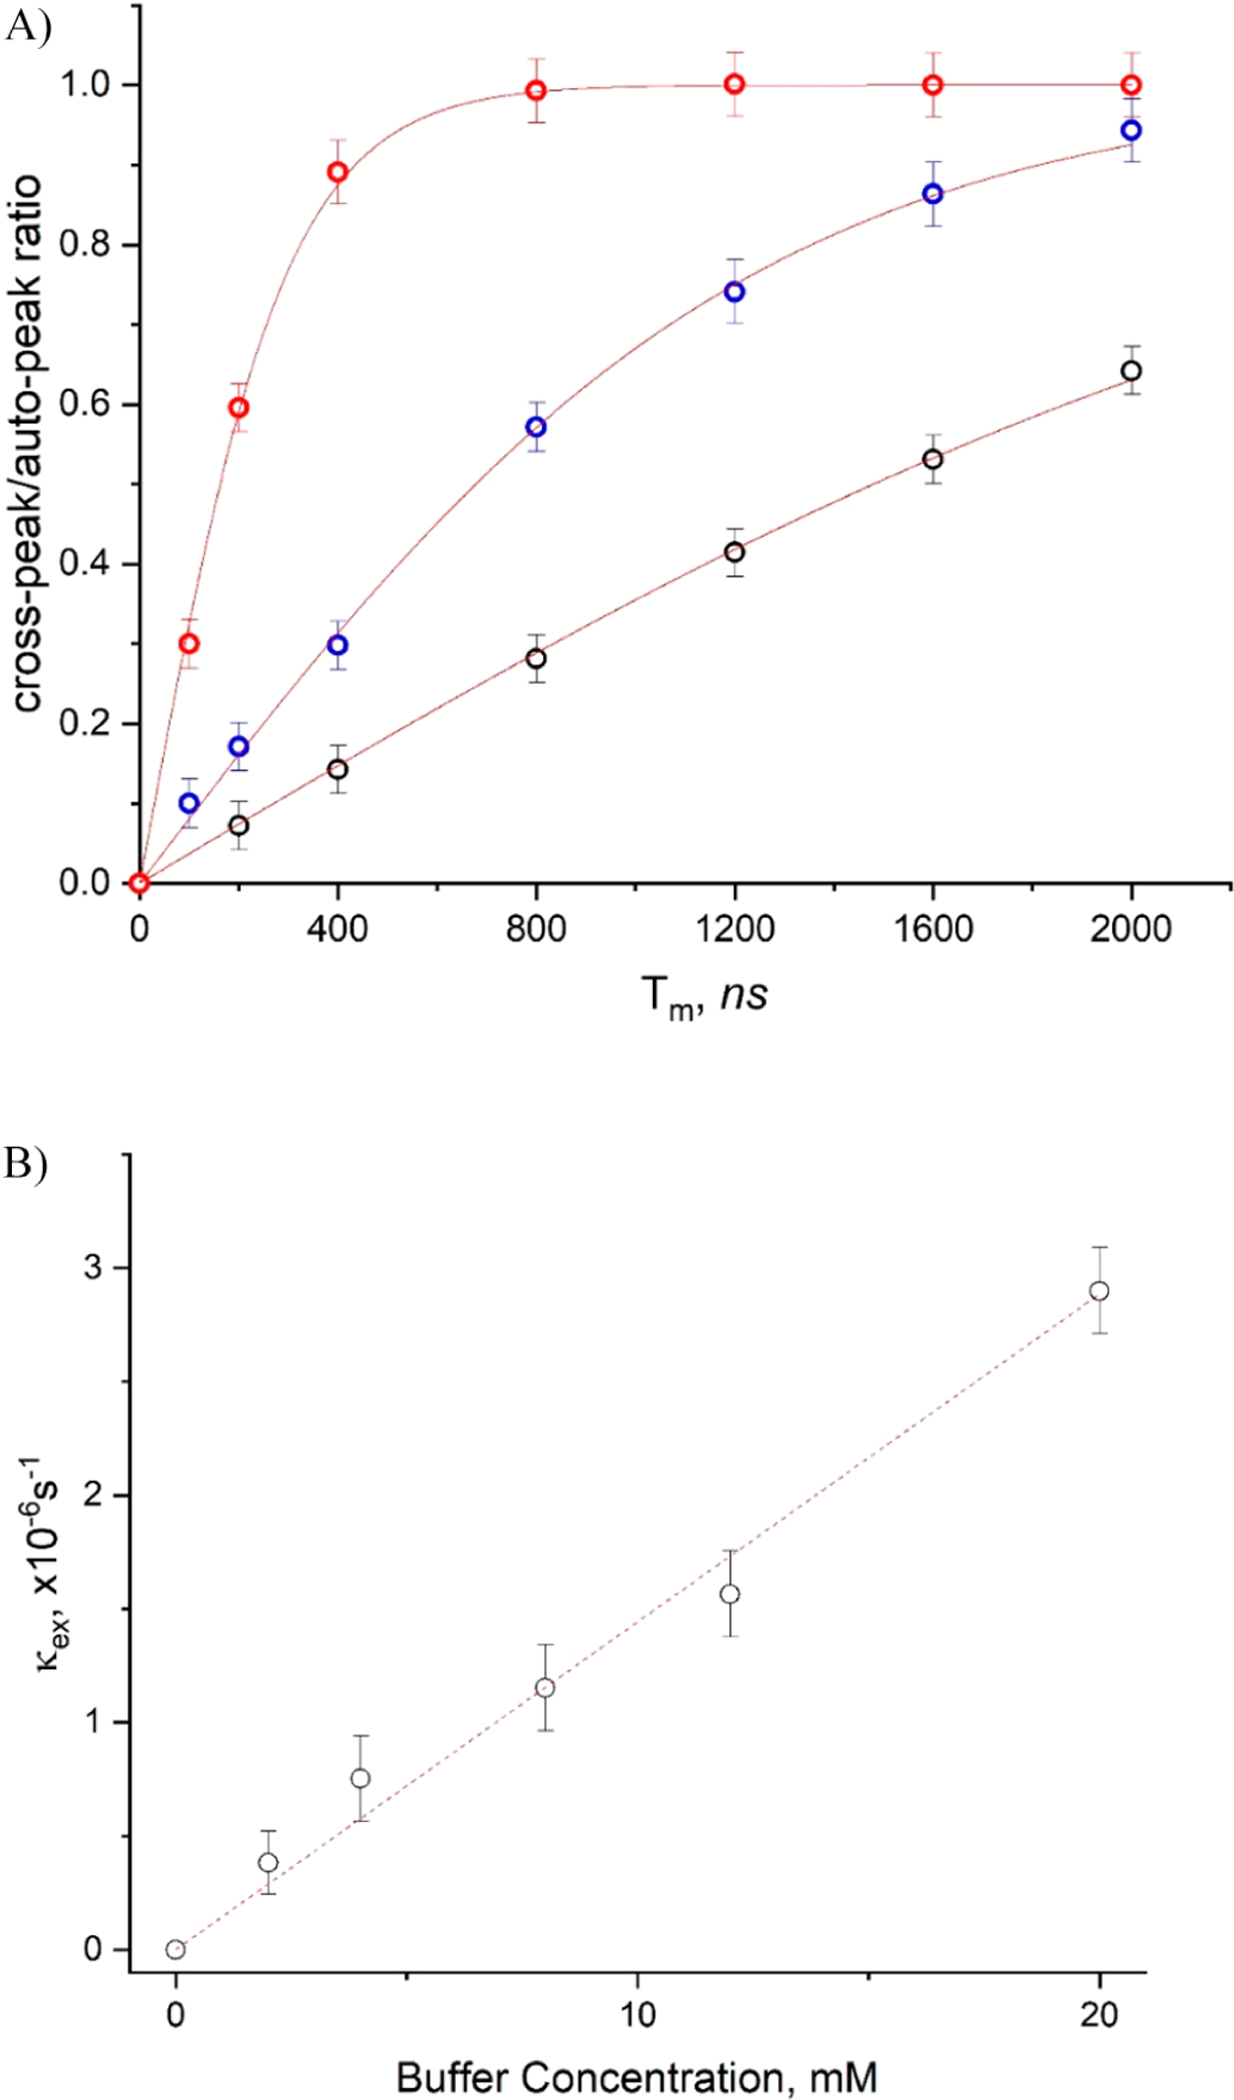
(A) Development of cross-peaks due to chemical exchange between protonated and unprotonated forms of R• with Tm at different phosphate concentrations at pH 6.1 and T = 17 °C. Dotted lines present fits to the exponential expression of eq 4. (B) Dependence of the rate of this exchange on the phosphate buffer concentration. The linear fitting yields k1 = 1.44 ± 0.06 L/(mol·s).
This example of chemical exchange between the protonated and unprotonated forms of R• (R• and RH•+) shows key advantages of 2D ELDOR at 95 GHz. It offers a simple and reliable way to detect and analyze exchange processes on the microsecond time scale. These rates are too fast to be detected by NMR, and to a large extent they are too slow to be studied by conventional ESR methods.
III.B. Partition of Nitroxide Probe between Phospholipid Bilayers and Interbilayer Water in Multilamellar Membranes.
The second system we studied by 2D ELDOR is the physical partitioning of a nitroxide between the hydrophobic core of the phospholipid membrane and the interbilayer water. A schematic representation of this system is shown in Figure 11. The thickness of the hydrophobic core of the membrane in the fluid phase of DMPC (phosphate-to-phosphate distance) is 3.03 nm,39 and the interbilayer water spans 2 to 3 nm.22,40
Figure 11.
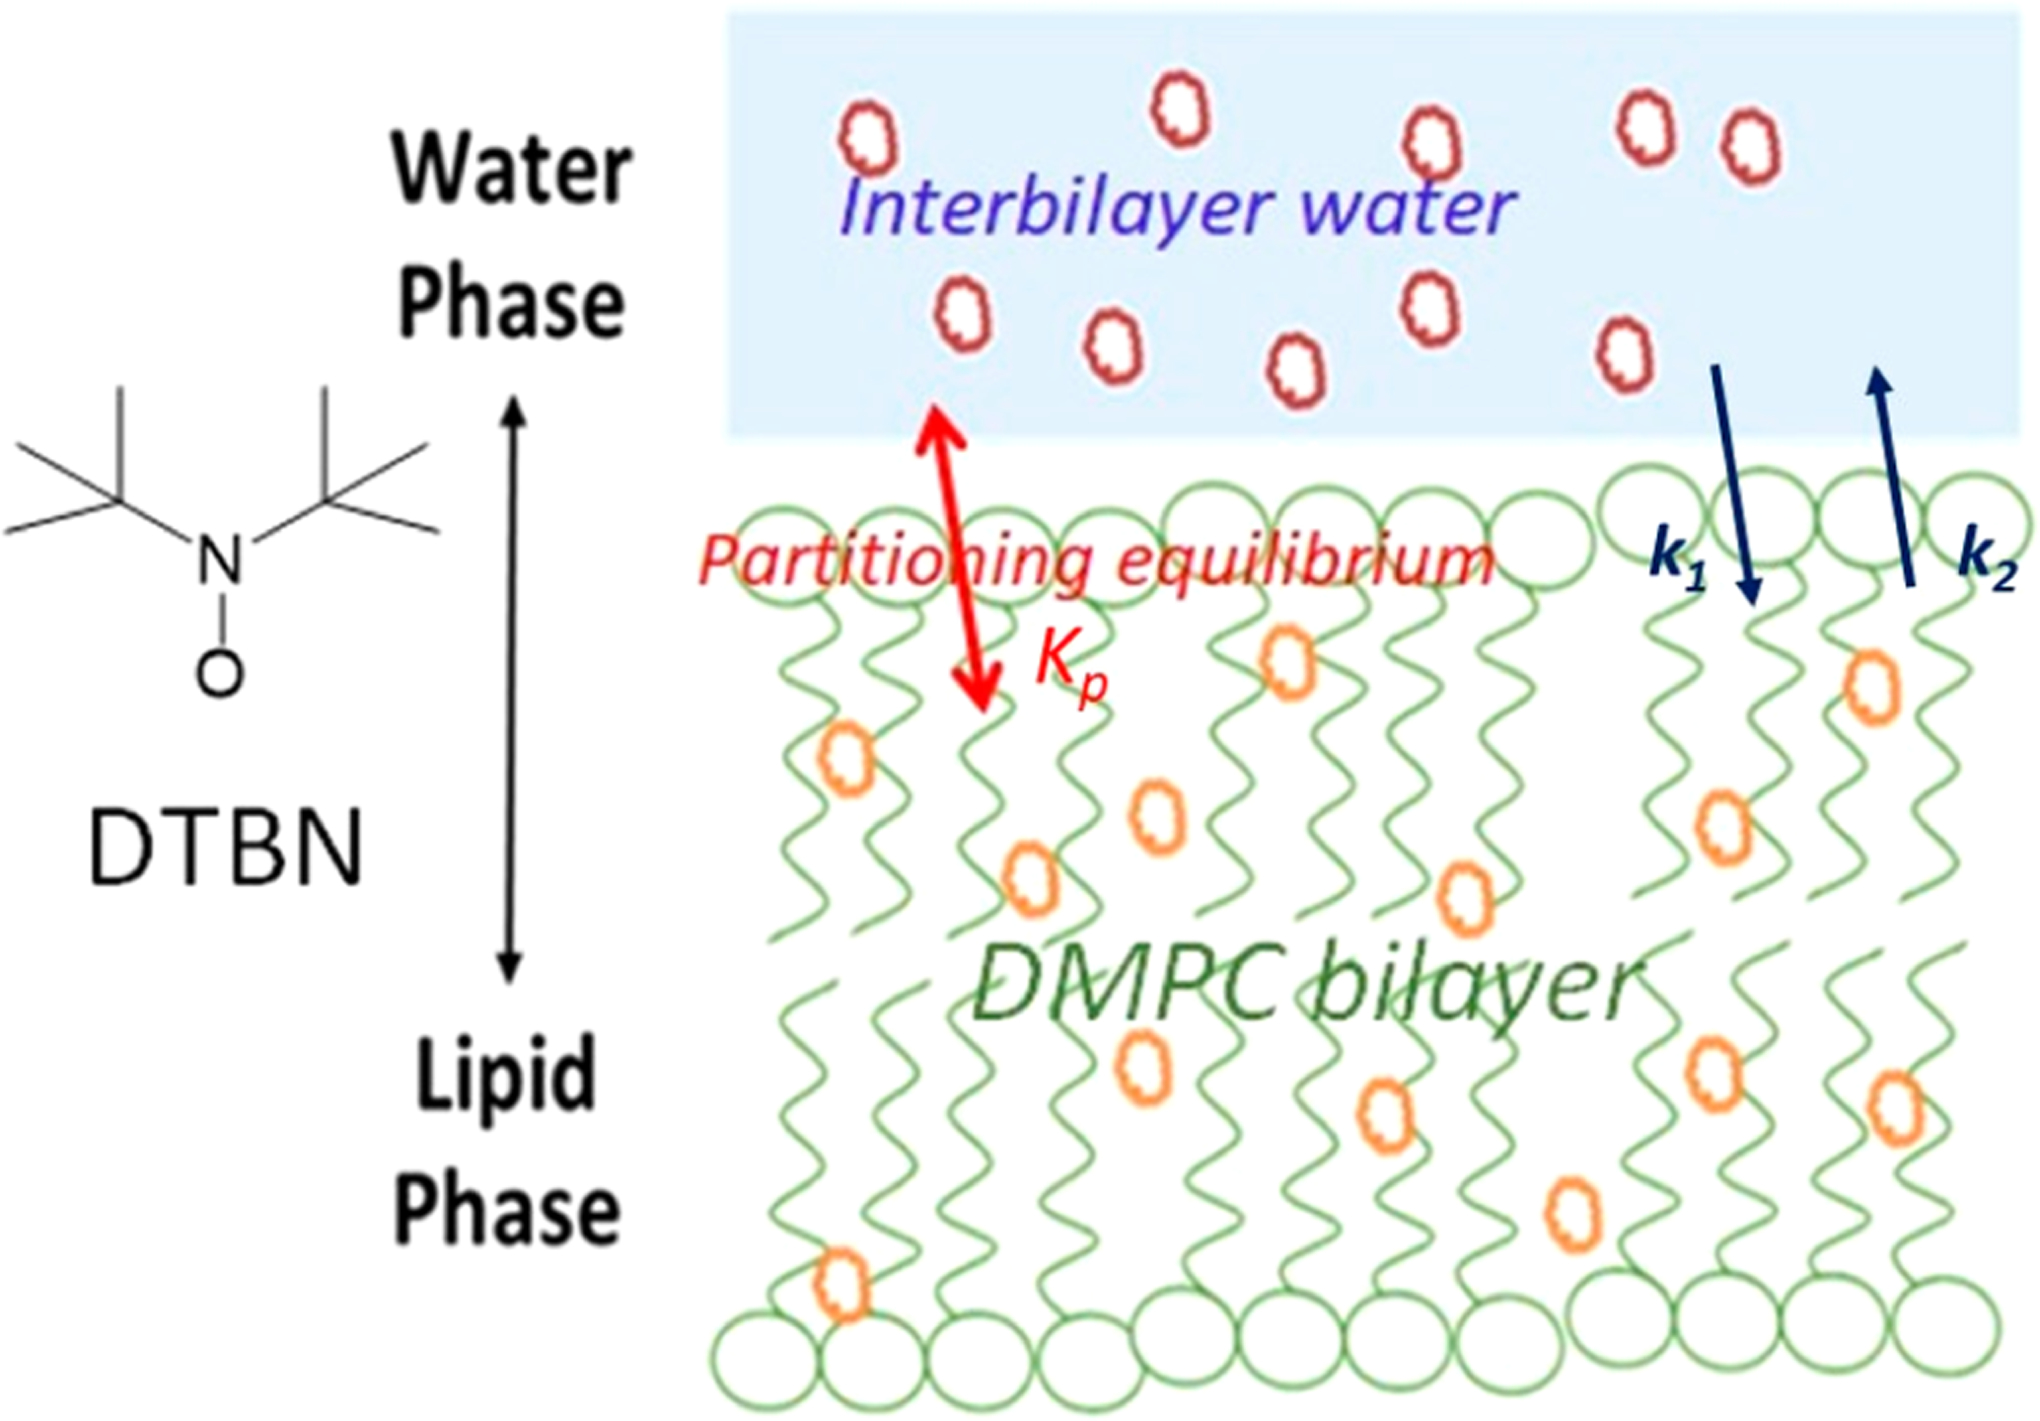
Schematic representation of nitroxide partitioning between the hydrophobic lipid core and interbilayer water in the fluid phase of the DMPC membrane.
Nitroxide probes partition between the membrane phases, showing a superposition of two triplet hf spectra: one with the larger hf splitting (aiso) and the smaller giso corresponds to the nitroxide in the water phase and the other with larger giso but smaller aiso is the lipid phase. The partition coefficient strongly favors a hydrophobic environment (e.g., octanol) for nitroxides without a polar substituent in its structure,24 with the partition pattern for DTBN (cf. Figure 12) similar to that of Tempo.25 The PD-DTBN we use (also referred to as DTBN below) has been suggested to be an excellent probe for partition studies.41 It is the smallest amphiphilic nitroxide radical, exhibiting narrow triplets in both interbilayer water and the hydrophobic core of the membrane. As seen in Figure 12 (see also ref 23), 95 GHz provides very good separation of the components corresponding to the different polarity of the local environment, so 95 GHz could be considered to be an ideal frequency to study this system. In Figure 12, in the 40 °C spectrum the more intense hf triplet corresponds to DTBN in the liquid-crystalline lipid phase, while the weaker triplet is from DTBN in the water phase. For the spectrum at 17 °C, the water-phase triplet remains sharp but that from the lipid gel phase is significantly broadened. Note the strong variation of the hf line widths for the lipid component.
Figure 12.
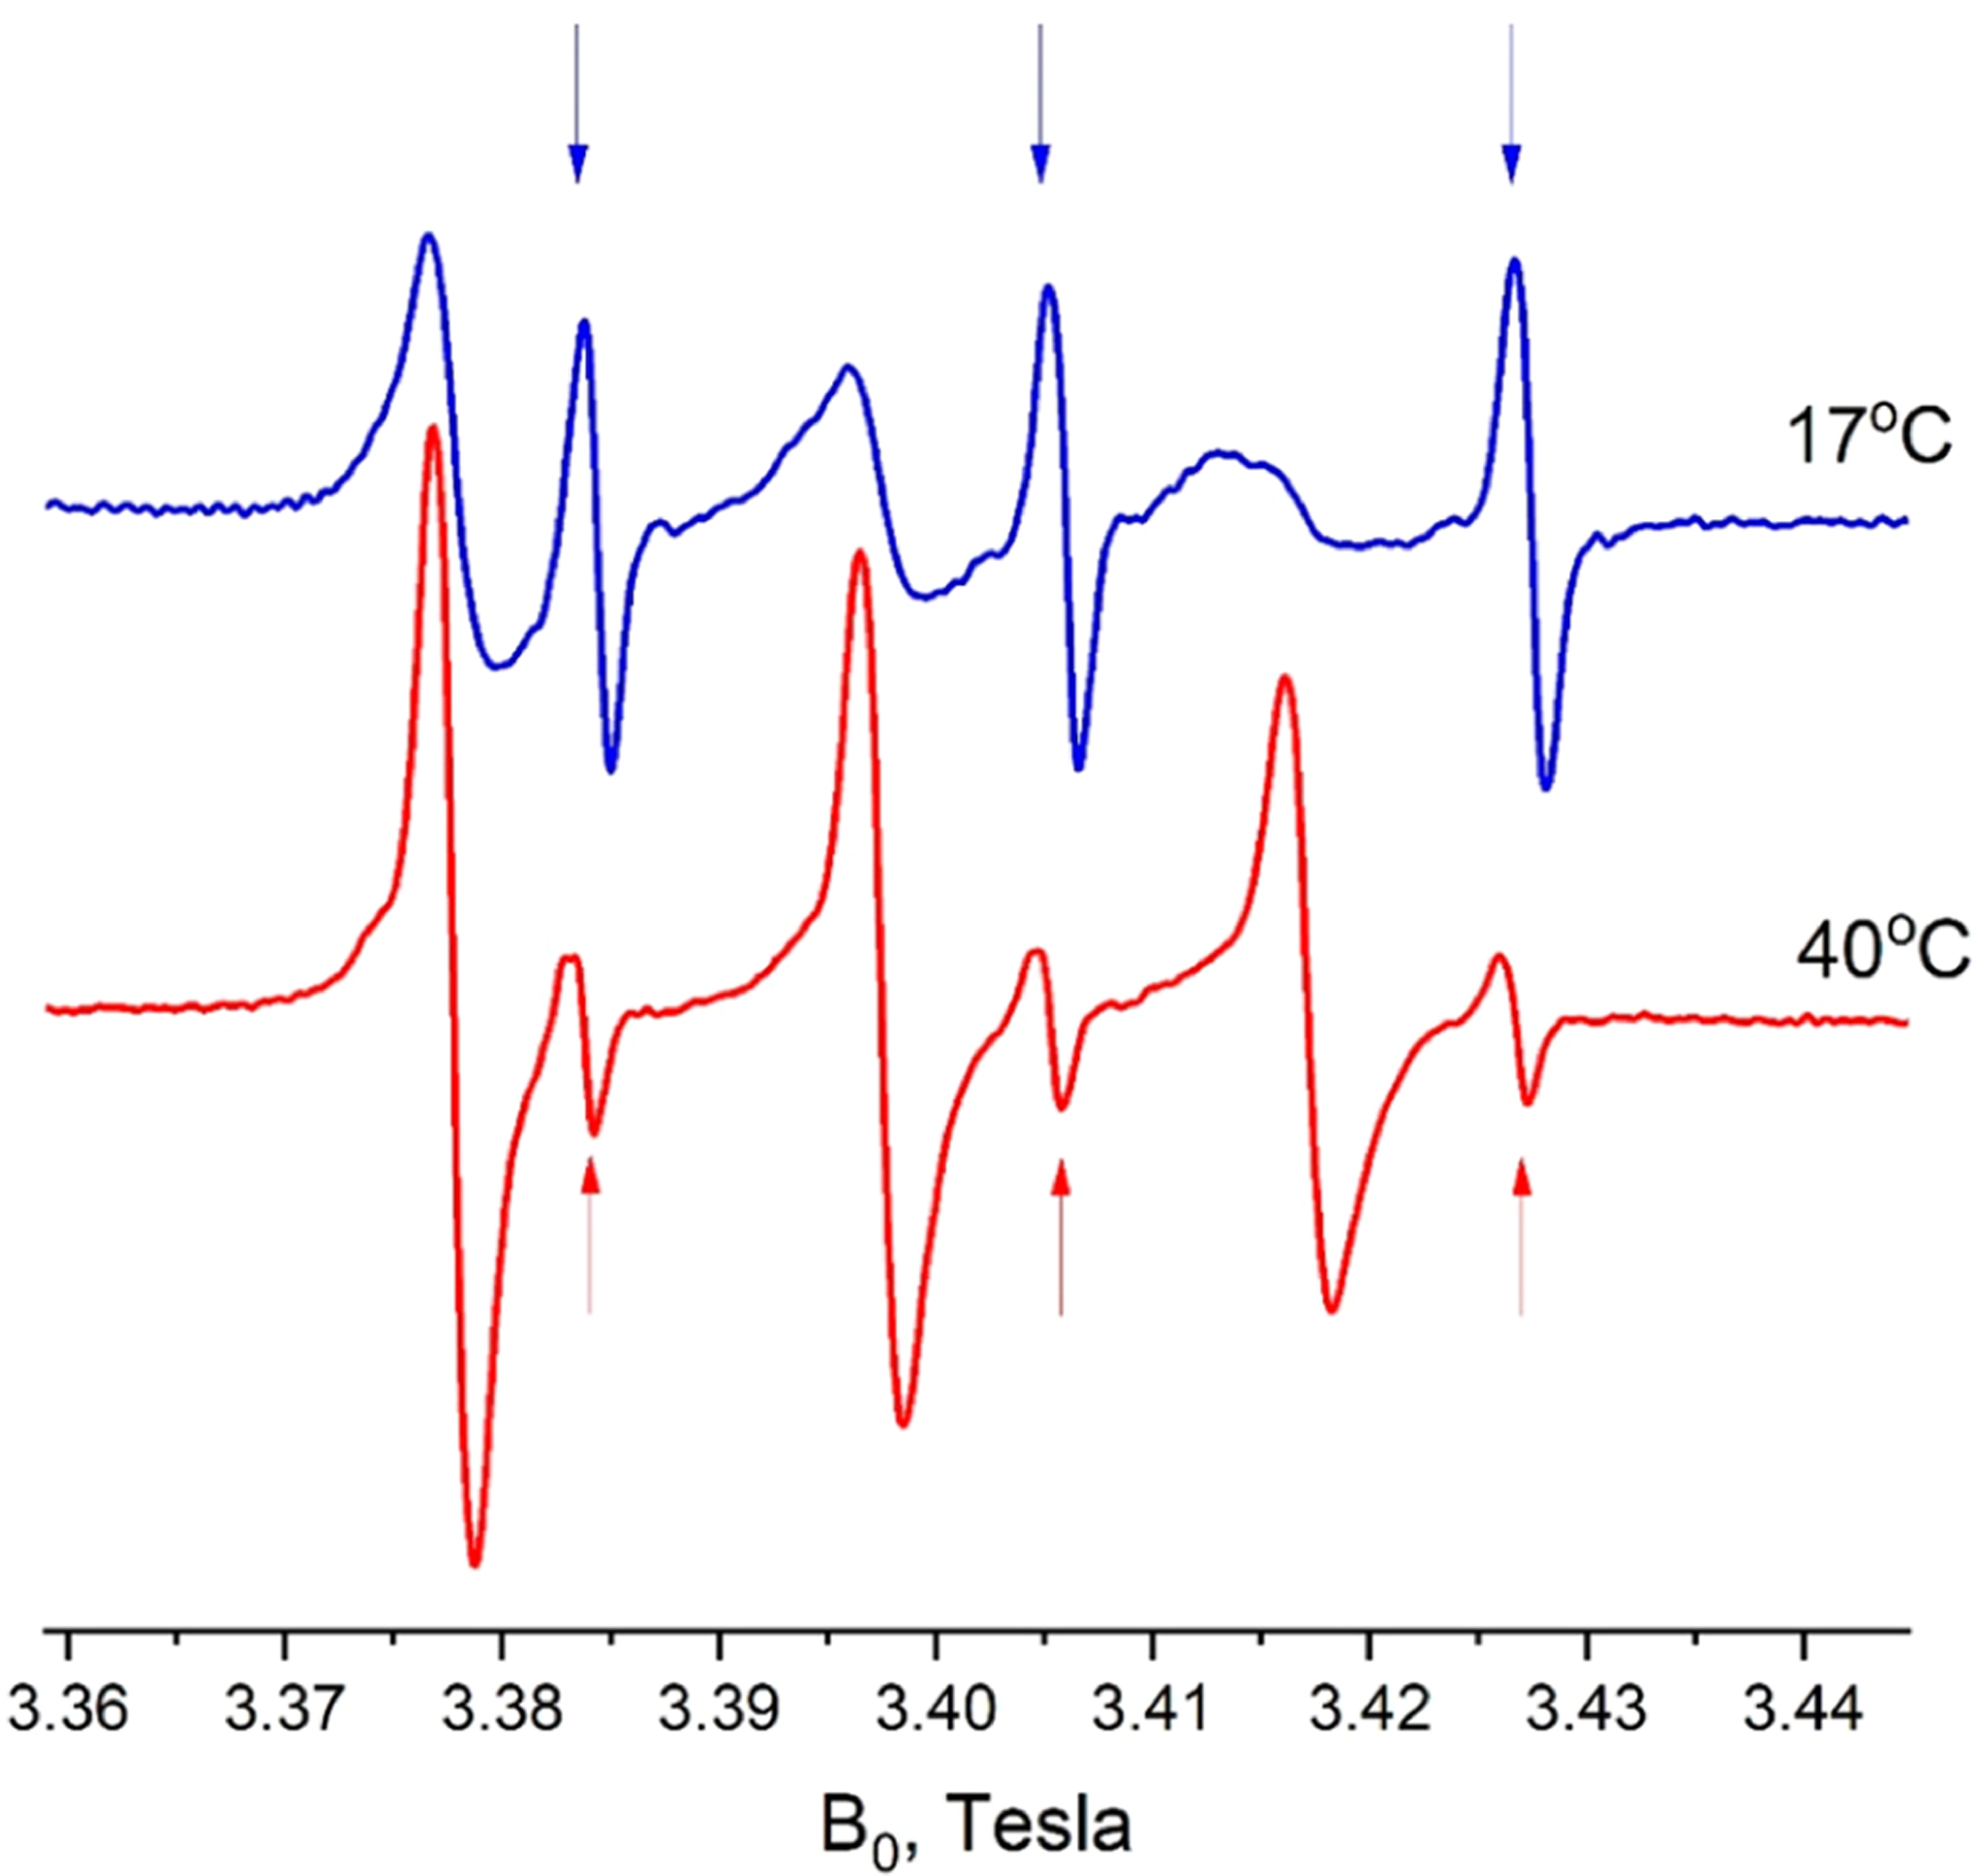
Partitioning of DTBN between the lipid bilayer and interbilayer water in multilamellar vesicles (MLVs) of DMPC as shown by 95 GHz CW ESR spectra. Note the difference in the partition coefficient and the DTBN line shapes at 17 and 40 °C. At 17°, the sharp peaks are from the interbilayer water phase and the broad peaks correspond to signal from the MLV gel phase. At 40 °C, the stronger signals are from the MLV in the LC phase. In the LC phase at 40 °C, the lines are in the motional narrowing regime and are stronger than those from the aqueous phase because they are 28 times more concentrated in the LC phase (partition coefficient Kp ≅ 28), with the water/lipid volume ratio being close to unity.22,39,40 In the gel phase at 17 °C, the lines from the gel phase are much broader due to both slower motional effects and higher concentrations than in the aqueous phase. Even though the partition coefficient for the gel phase is about 3.6 times smaller than for the fluid phase, in the gel phase the nitroxide molecules are excluded from the hydrophobic core and instead are concentrated near the membrane surface in the phosphate region,6 resulting in a high local concentration.
Figure 12 is consistent with the fact that the partition coefficient of DTBN between the lipid bilayer and water phase experiences an increase above the main transition temperature for DMPC of 23.7 °C, with most probe molecules located in the fluid hydrophobic core of the membrane in its liquid-crystal phase.
Integration of the CW spectrum for 40 °C in Figure 12 shows that only about 1/30 of all DTBN spins are located in the water phase versus ca. 1/8 at 17 °C. The fraction of DTBN in the water phase at 40 °C is consistent with our experimental estimate of the partition coefficient for DTBN in octanol/water, which is 28; octanol has been used routinely as a model of the membrane environment.42 It indicates that nearly all of the water is present as highly dispersed interbilayer water, not as large water pockets trapped in the MLV. Thus, we may expect that the DTBN molecules are likely to travel between the membrane phases on the time scale of a 2D ELDOR experiment.
Indeed, if we assume the translational diffusion coefficient for DTBN in water ~2 × 10⁻⁵ cm2/s (Tempone in water 1.7 × 10⁻⁵, 25 °C),45 the mean linear traveled distance in 1 μs will be there <z>water= 2Dt~ 70 nm. If we take the diffusion coefficient in the fluid lipid phase to be D ≈ 10−6 cm2/s,43–45 it yields ⟨z⟩lipid ≈ 14 nm. Both values are about an order of magnitude larger than the thickness of the lipid bilayer and of the water-filled gap between them.
While the CW-EPR spectrum shows most spins in the lipid phase, in the 2D ELDOR spectrum (Figures 13 and S6) the water signal is more pronounced at all Tm values than it is in the CW spectrum. It dominates the spectrum for the longer Tm at 40 °C and at all Tm values for 17 °C (Figure S6). This is due to the different relaxation properties of these two signals. In the LC phase at 40 °C, both T2 and T1 are significantly shorter than in water. Moreover, the T2 in the LC phase is short enough for the signal to decay noticeably during the dead time td of the spectrometer. T2 is even shorter and the decay during the dead time is more pronounced for the gel phase at 17 °C because of (1) the slower molecular motion in this viscous phase and (2) the enhanced role of intermolecular electron-spin dipolar interaction, which has effects similar to HE in both 1 and 2D ESR, in this viscous medium.26,36,43
Figure 13.
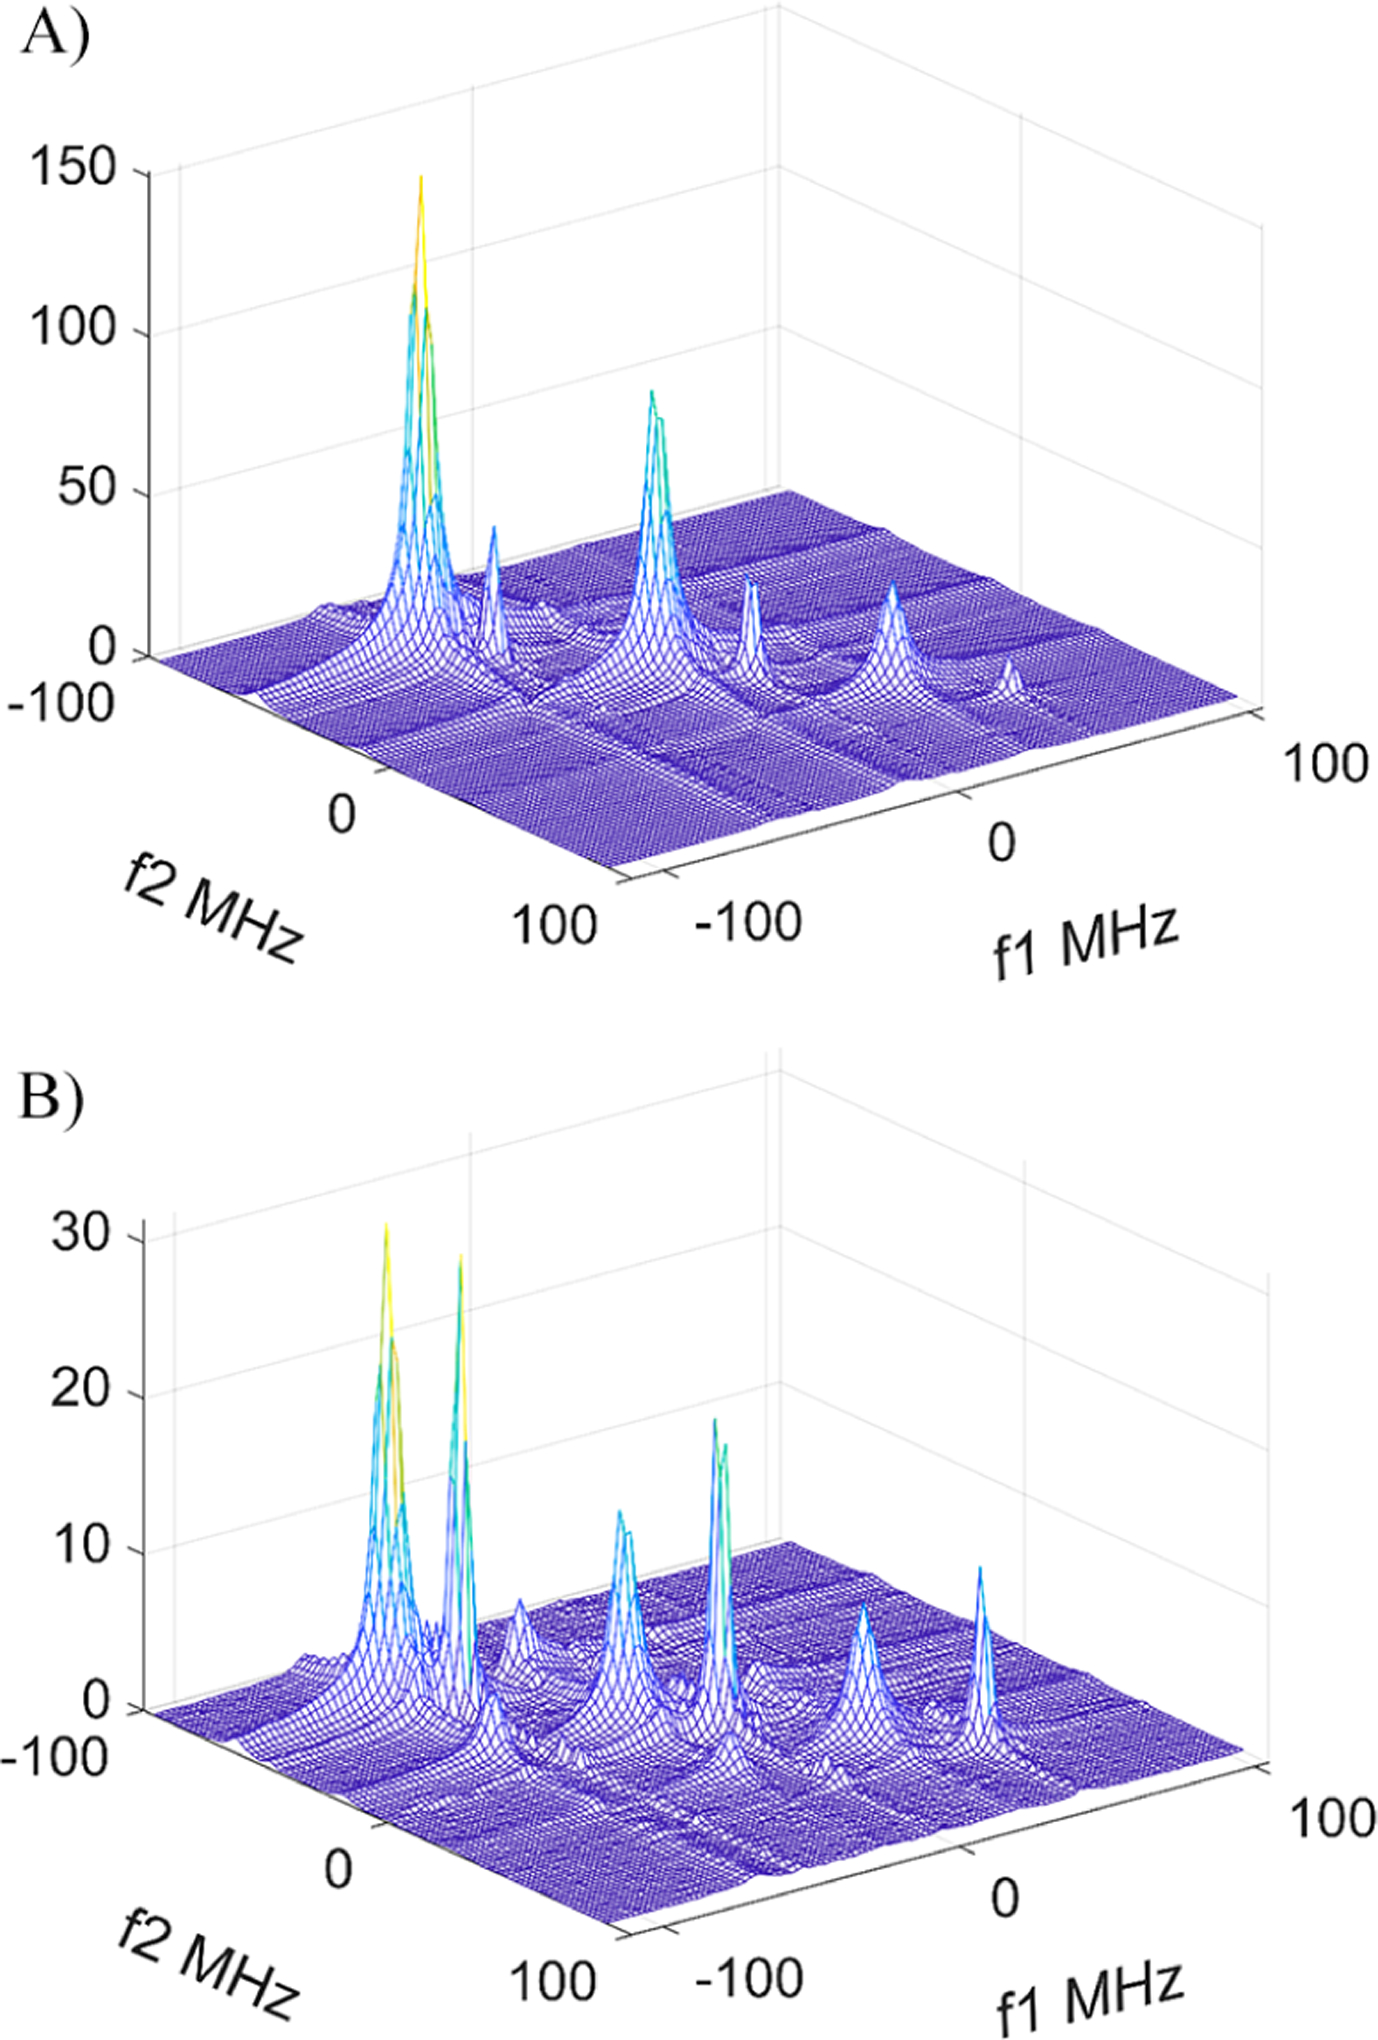
Relative 2D-ELDOR intensities of spectral components for DTBN partitioning between the hydrophobic lipid core and the water phase in multilamellar vesicles of DMPC at (A) Tm = 50 ns and (B) Tm = 800 ns. T = 40 °C. The broader components correspond to the lipid phase. The concentrations of DTBN are ca. 60 μM and 1.5 mM in the interbilayer water and lipid phases, respectively.
The fraction of the signal from the probe in water increases with increasing Tm because the nitroxide signal in the LC phase is decaying faster with its shorter T1 (Figure 13). The T1 values for different components in a 2D-ELDOR spectrum can be directly estimated from their rate of decay with Tm.8 In our case, T1lipid = 272 ± 3 ns and T1water = 449 ± 9 ns (Figure S7).
The ability of 2D-ELDOR to identify and separate spectral components based on their different relaxation times can be a useful advantage. By changing the component ratio with Tm, one can demonstrate the presence of multiple components in the spectrum and distinguish them from a single component with a complex line shape, which is a common issue in ESR.
However, the difference in T1 complicates some aspects of the analysis of the 2D-ELDOR spectra. For example, with the constantly changing ratio of spectral components vs Tm, the subtraction method we used to separate and measure cross-peaks to study the R• + BH+ ⇄ RH•+ + B process is not applicable. Also, there is a relatively narrow range of Tm in which to look for cross-peaks between the partition components in the system: at short Tm, the cross-peaks do not have time to develop, while at Tm > 1.2 μs, the DTBN signal from the lipid phase nearly disappears because of the T1 decay. That means that that the best range of Tm for observing the cross-peaks is around 600–800 ns when the components still have comparable intensity.
Figure 14 shows views of the high-field (MI = −1, panels A and B) and central (MI = 0, panels C and D) components in the 2D-ELDOR spectrum of DTBN in DMPC at 40 °C at a mixing time Tm of 700 ns. For both the MI = −1 and 0 cases, panels A and C are stack plots and panels B and D are the equivalent contour plots, respectively. One can see small cross-peaks between the hf lines corresponding to the different polarities of the local environment. The cross-peaks appear at precisely the correct frequencies confirming their identification. Note that we do not utilize the most intense (cf. Figure 13) low-field MI = +1 region for our analysis because the auto-and cross-peaks are bunched too close to each other.
Figure 14.
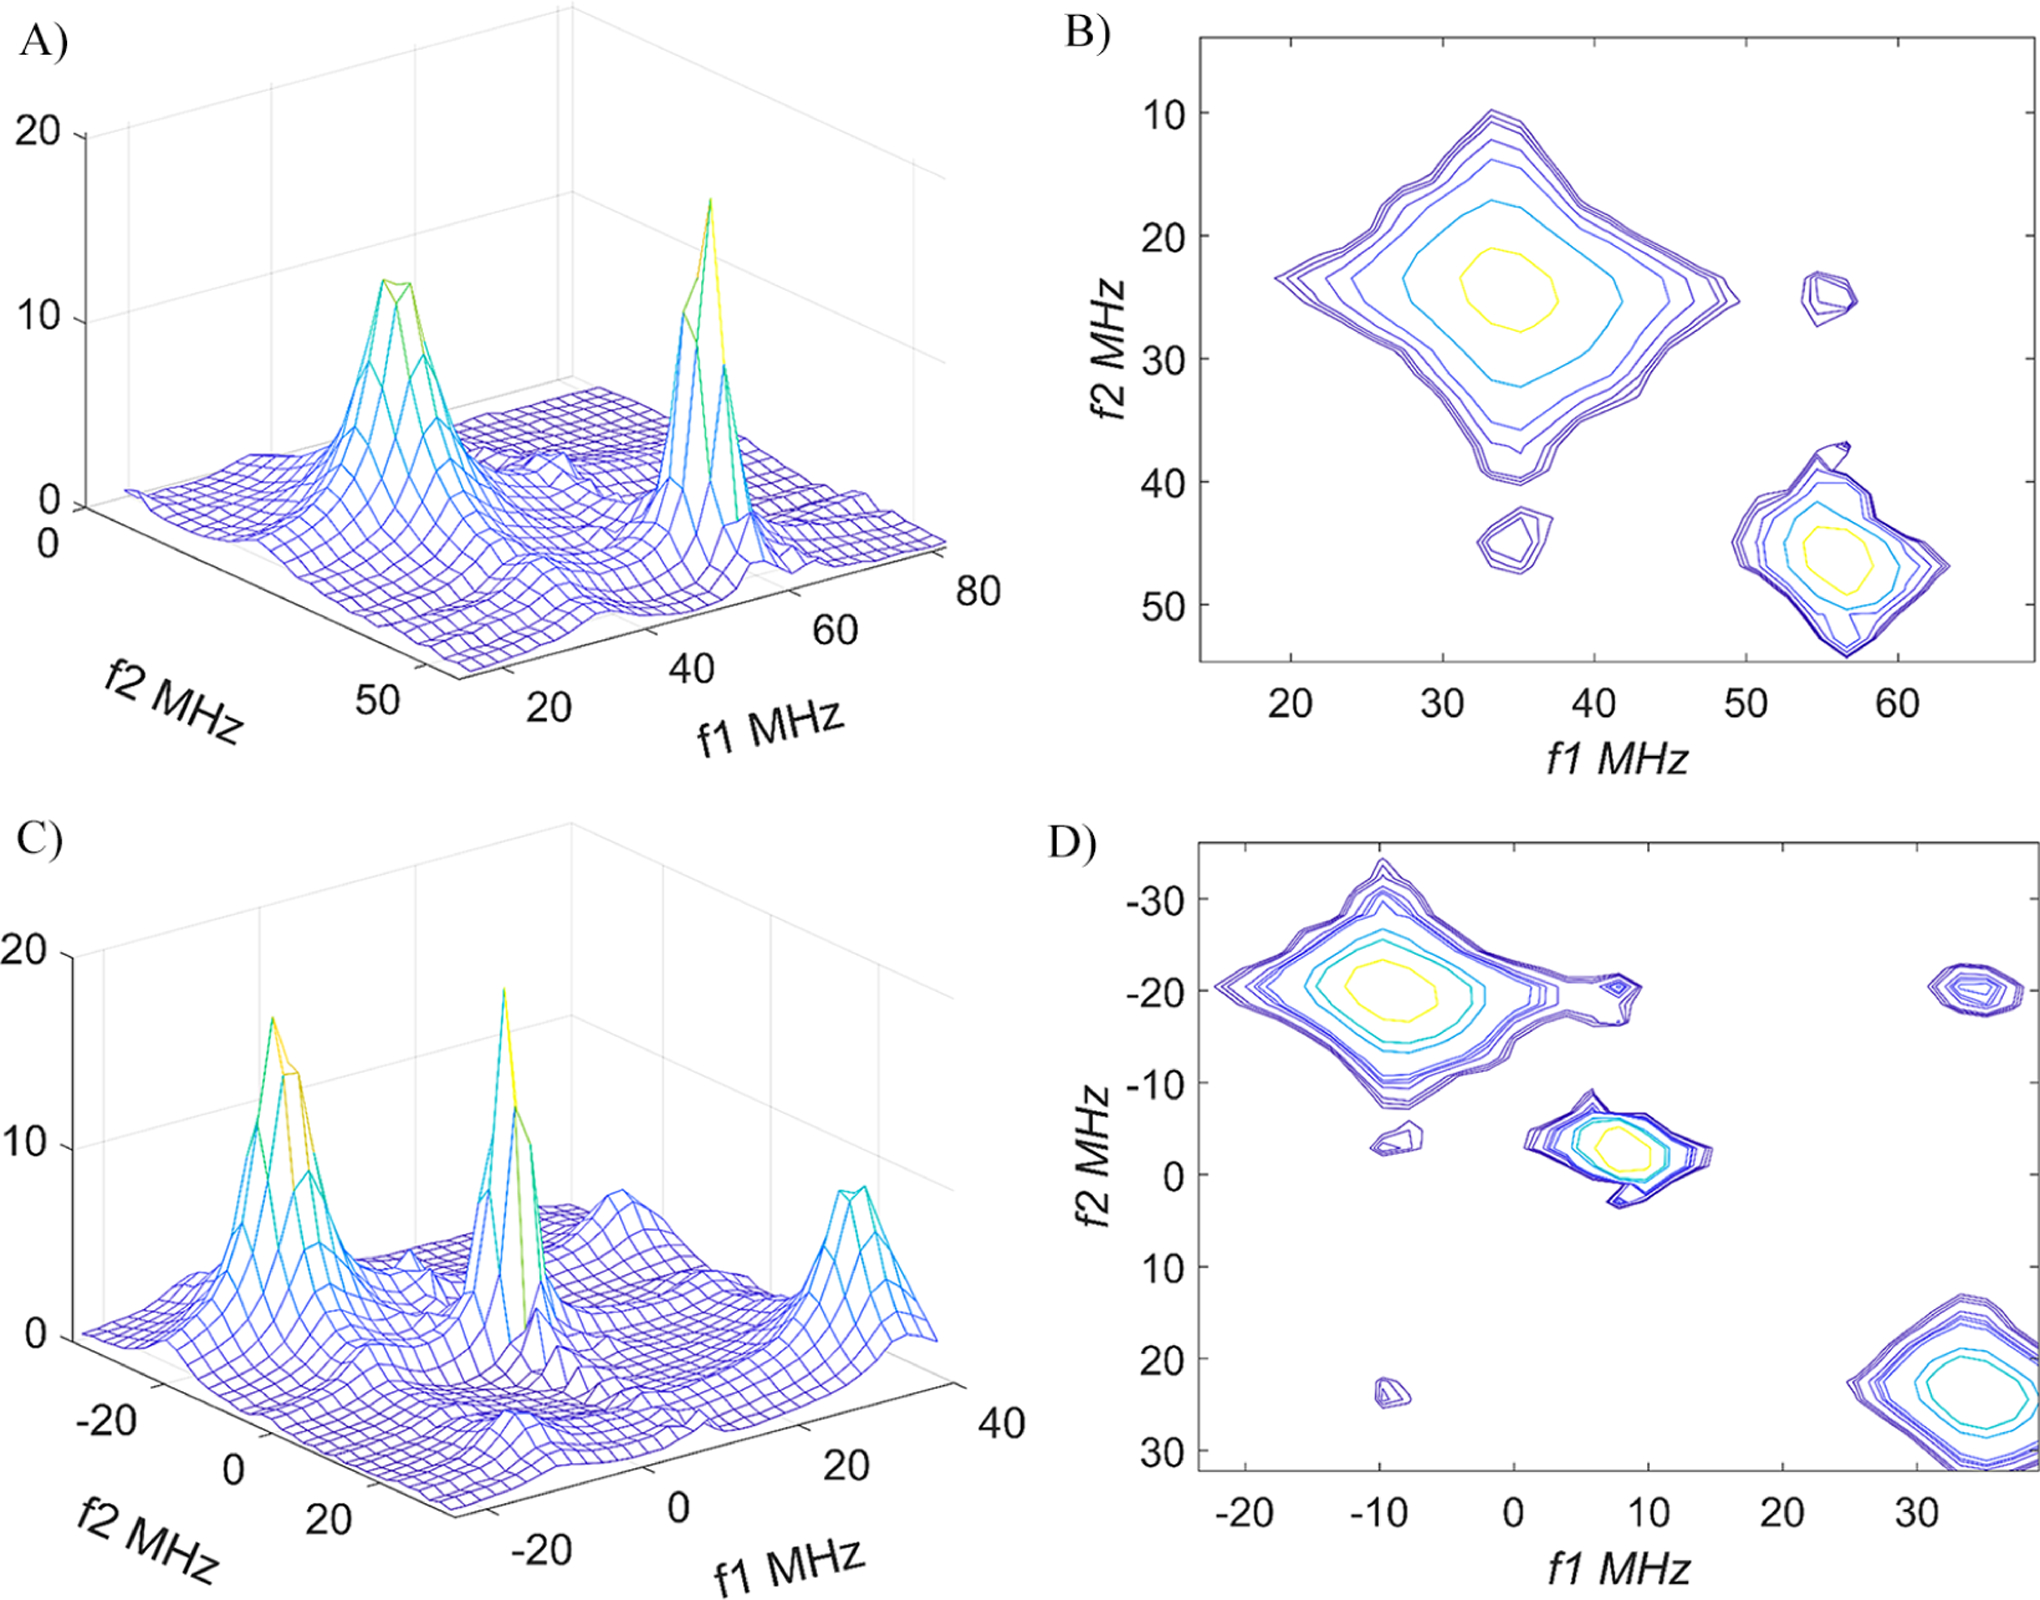
High-field (MI = −1) (A and B) and central (MI = 0) (C and D) hyperfine components of DTBN in DMPC at 40 °C at Tm= 700 ns. Panels B and D show contour plots for panels A and C, respectively.
Because of very different populations of the exchanging states and their different T1 and T2 values, the simple formula (eq 4) used for the R• equilibrium is no longer applicable. Full expressions for nitroxide spectra in the fast motional regime are given elsewhere and in general involve coupled relaxation among the hf lines.8 However, in the limit when HE (and intermolecular dipolar) and END terms are small, simple expressions describing manifestations of chemical exchange in a system of two species with different populations are simply given by the Bloch-McConnell equations46,47 for a two-level electron-spin system because each hf line relaxes independently of the others with its distinct T1.
These expressions are summarized in SI eqs S1–S4. For the special case of k1 ≫ k2 (since k1/k2 = 28), one obtains the limiting expressions for the auto-peaks (eq S6) and the cross-peaks (eq S7). For the former, we have
| (5) |
which means that we just require T1 measurements in the presence and absence of exchange in the aqueous phase. The results for the T1(1) and T1(2) measurements for DTBN in the presence of exchange at 40 °C are 449 ± 9 and 272 ± 3 ns, respectively, whereas in pure D2O it is 680 ± 5 ns (cf. Figure S7).
Ample evidence exists that the interbilayer water is similar to bulk water in its properties, except for the 1–3 Å region adjacent to the lipid bilayers.40 An ESR study using the 4-phospho-Tempo probe showed almost no difference in ESR parameters between interbilayer water and bulk water, provided one is not near the freezing point of the former.48 Thus, for our well-deoxygenated samples we attribute the decrease in T1(1) in the interbilayer phase compared to its value in pure D2O to the exchange process.
The derivation of the physical exchange rate from the enhancement in the T1 relaxation caused by this exchange is given in the SI as noted above. It follows from eq 5 that we estimate k1 ≌ (7.4 ± 0.4) × 105 s−1, so k2 = k1/K ≌ 2.6 ± 0.1 × 10⁴ s−1.
In justifying the approximate treatment of each hf region (i.e., MI = −1 and MI = 0, cf. Figure 14) separately, we note that the cross-peak development from the END mechanism gives 9 × 10⁴ s−1, which is more than an order of magnitude smaller than T1(1)−1 = (680 × 10−9)−1 = 1.5 × 10⁶ s−1. Note also that the low concentration of DTBN (60 μM) leads to HE being negligible (cf. Figure 3 for the similarly size nitroxide PDT). If we compare k2 to T1(2)−1 = 3.7 × 10⁶ s−1, we see it must have a negligible effect on the T1(2) measurement so that T1(2)−1 + k2 ≌ T1(2)−1. For this reason (as well as the difficulty of obtaining an estimate of T1(2) in the absence of exchange), one cannot obtain any estimate of k2 from the lipid components of the 2D-ELDOR spectrum vs Tm. As noted at the end of Section II, the weak cross-peaks, as now seen in Figure 14, have made it difficult to obtain quantitative measures of their peak heights (or integrated intensities) due to artifacts and tails of nearby auto-peaks. Even where they are maximized (at Tm = 600–800 ns), we estimate from the above results on k1 and k2 that they are only 3 to 4% of the auto-peaks, roughly consistent with our observations. Thus, the T1 vs Tm approach we have used is clearly the more reliable way to extract these rate constants.
IV. DISCUSSION
We have demonstrated that 2D-ELDOR can be used to study microsecond-scale processes of chemical and physical significance, and the specific relevance of the two examples we studied, namely, proton transfer and transport between phases, is discussed below in Section IV.B. But first we discuss the range of applicability of 2D-ELDOR at 95 GHz in Section IV.A.
IV.A. Range of Applicability of Exchange by 2D-ELDOR at 95 GHz.
We wish to comment on the range of applicability of exchange studies by 2D-ELDOR at 95 GHz when it is possible to distinguish the exchanging sites. First we note the time-scale range. Given our current dead-time limitation (ca. 22 ns), processes occurring as fast as 50–100 ns should pose no challenge. Maximum useful mixing times Tm are limited by the nitroxide spin T1, which we have found to be in the range of 500–1000 ns. It is possible to have Tm to extend out perhaps 2- to 3-fold of T1 depending on the SNR (as well as on artifacts), yet this may be further extended by modern denoising techniques.49,50 Therefore, the slowest processes would correspond to 1–10 μs. For example, the inverse rate constants for DTBN transfer between interbilayer water and lipid are 1.35 and 38 μs, but with the latter determined indirectly. The proton-transfer process was readily studied on the microsecond time frame.
Both processes studied were first order in nitroxide concentration, with the proton exchange rate dependent upon the buffer concentration. This meant that we could work at low enough concentrations to suppress HE in the aqueous phase. Chemical exchange processes that are bimolecular (i.e., involving collisions between nitroxide species) will, however, lead to identical cross-peak patterns as for the HE mechanism,36 which is typically diffusion-controlled, so they may be difficult to study. In the first-order processes that we studied, there was the additional advantage that the cross-peak development between exchanging species preserved the nuclear-spin quantum number, MI, which provides a clear indication of its nature. This is not the case for HE as described in Section II.
One might ask if there would be any advantage in going to even higher frequencies, as has been the case for NMR. The instrumental challenge is the lack of affordable high-power pulse sources needed to provide intense and very short pulses above ca. 95 GHz. But there is a more fundamental issue. Above this frequency, the role of the g tensor becomes dominant. Whereas the g-value separation between the signals from the different nitroxide sites increases linearly with the field and frequency, the g-tensor contribution to the line widths increases quadratically, thereby overwhelming any site resolution.4,6,30 Furthermore, given the increase in g-tensor effects, line shapes would no longer be governed by a motional narrowing approach.
One might consider the possibility of utilizing a frequency of 35 GHz for which in some cases (e.g., Figure 7) the high-field component would show some site resolution, but likely there would still be some bunching of auto- and cross-peaks analogous to what we observed in Figure 13 for the low-field line at 95 GHz; therefore, we did not use it for our analysis as noted in Section III.B. However, detailed line-shape simulations would be helpful in such cases.
IV.B. Significance of the Two Cases Studied.
It is difficult to imagine a more important process in chemistry or biology than proton transfer. Acid–base reactions involving protons appear in nearly all enzymatic reactions. Acid or base catalysis is the most common phenomenon in organic chemistry and chemical technology.
Studies of the mechanism of proton transfer have a long history. The first publication on this topic appeared more than 200 years ago and correctly hypothesized that H+ exchange was the mechanism of water conductivity long before the chemical formula of water was understood to be H2O.51 Although acid–base reaction rates in simple fluids can be extremely fast,52 their rate varies dramatically depending on the nature of the sites participating in the transfer and their steric arrangements.52–54 The barriers for proton transfer and hence the rate of the process depend on the molecular structure and the strength of the hydrogen bonds. Thus, different proton-transfer processes should be studied by different techniques operating on different time scales.
Although direct time-resolved techniques with fast reaction triggering have been used for such studies55 for nanosecond and faster processes, spectroscopic 2D techniques are more convenient and more clearly identify the process. For superfast kinetics occurring on a picosecond scale (e.g., short-distance intramolecular transfer), the spectroscopic technique of choice is 2D-IR,56 while for slow exchange on time scales of a millisecond or slower the most valuable and proven method is 2D NMR.57 However, the range of transfer rates between nanoseconds and several microseconds is difficult to directly study by either 2D exchange NMR or IR methods. However, this range is relevant for many important phenomena in chemistry and biology, including such common cases as diffusion-controlled reactions in simple fluids and proton permeation through biological channels.58 Our work using 2D-ELDOR aims to fill the niche and to introduce it as a method of choice for such cases. Although the present study is limited to an imidazoline nitroxide in water, similar pH-sensitive radicals can be introduced into protein molecules and biological membranes59,60 and thus provide valuable kinetic information about proton transfer and acid–base interactions at the labeling site.
ESR has been routinely used to measure partition coefficients (Kp) of free radicals between different phases in phospholipid membranes but not individual rate constants k1 and k2 of their transport between the phases where Kp= k1/k2. Partition studies on spin-labeled drugs or on simple nitroxide radicals in combination with other membrane-modifying compounds are important for drug delivery.61–63 Whereas Kp is an important factor in the membrane permeability of relatively small nonpolar molecules by the solubility-diffusion mechanism,64 the actual permeability is affected by the effects of interfacial resistance.65 This means that the permeability kinetics may be very different for the same Kp values. For this reason, 2D ELDOR capable of obtaining k1 and k2 may provide important insights into the membrane permeability and delivery of small-molecule drugs.
V. CONCLUSIONS
In this study, we have successfully demonstrated that both chemical and physical exchange processes occurring on the microsecond time scale can be definitively studied by 2D-ELDOR at 95 GHz using nitroxide probes, which constitute the most common form of spin probe/label. This has been enabled by recent improvements in instrumentation, and it is expected that further improvements will enable exchange studies in more complex cases.29
Supplementary Material
ACKNOWLEDGMENTS
This work was supported by NIH/NIGMS grants P41GM103521 and R01GM123779 to J.H.F., with partial support of S.C. by grant R35GM122535 to B. R. Crane and grants R01CA194013 and R01CA192064 to V.V.K. The authors are also grateful to John M. Franck of Syracuse University for useful discussions.
Footnotes
Supporting Information
The Supporting Information is available free of charge at https://pubs.acs.org/doi/10.1021/jacs.0c09469.
Mathematical basis for the chemical exchange; 95 GHz quasioptical bridge schematic diagram; spectral coverage measurements; estimate of the self-exchange constant for PDT in water by CW ESR; example of the gradual elimination of Heisenberg exchange by lowering the PDT concentration and its manifestation in 2D ELDOR; comparison of T1 decay curves obtained for single-component spectra either by integration of the whole 2D ELDOR plot or by summation of the heights of all auto and cross peaks; 2D ELDOR spectrum of DTBN in multilamellar vesicles of DMPC at 17 °C; decay of the signal intensity due to T1 relaxation for two components of the ESR spectrum corresponding to two phases shown in Figure 11 (PDF)
The authors declare no competing financial interest.
Complete contact information is available at: https://pubs.acs.org/10.1021/jacs.0c09469
Contributor Information
Boris Dzikovski, Department of Chemistry and Chemical Biology, and ACERT, National Biomedical Center for Advanced Electron Spin Resonance Technology, Cornell University, Ithaca, New York 14853-1301, United States;.
Valery V. Khramtsov, In Vivo Multifunctional Magnetic Resonance Center, Robert C. Byrd Health Sciences Center, West Virginia University, and Department of Biochemistry, West Virginia University School of Medicine, Morgantown, West Virginia 26506, United States;.
Siddarth Chandrasekaran, Department of Chemistry and Chemical Biology, and ACERT, National Biomedical Center for Advanced Electron Spin Resonance Technology, Cornell University, Ithaca, New York 14853-1301, United States;.
Curt Dunnam, Department of Chemistry and Chemical Biology, and ACERT, National Biomedical Center for Advanced Electron Spin Resonance Technology, Cornell University, Ithaca, New York 14853-1301, United States.
Meera Shah, Department of Chemistry and Chemical Biology, and ACERT, National Biomedical Center for Advanced Electron Spin Resonance Technology, Cornell University, Ithaca, New York 14853-1301, United States.
Jack H. Freed, Department of Chemistry and Chemical Biology, and ACERT, National Biomedical Center for Advanced Electron Spin Resonance Technology, Cornell University, Ithaca, New York 14853-1301, United States;.
REFERENCES
- 1.Bodenhausen G; Ernst RR Two-dimensional exchange difference spectroscopy Applications to indirect observation of quadrupolar relaxation. Mol. Phys 1982, 47, 319–328. [Google Scholar]
- 2.Ernst RR; Bodenhausen G; Wokaun A Principles of Nuclear Magnetic Resonance in One and Two Dimensions; Oxford University Press: New York, 1987. [Google Scholar]
- 3.Möbius K; Savitsky A; Schnegg A; Plato M; Fuchs M High-field EPR spectroscopy applied to biological systems: characterization of molecular switches for electron and ion transfer. Phys. Chem. Chem. Phys 2005, 7 (1), 19–42. [DOI] [PubMed] [Google Scholar]
- 4.Möbius K; Savitsky A; Wegener C; Plato M; Fuchs M; Schnegg A; Dubinskii AA; Grishin YA; Grigor’ev IA; Kühn M; Duché D; Zimmermann H; Steinhoff H-J Combining high-field EPR with site-directed spin labeling reveals unique information on proteins in action. Magn. Reson. Chem 2005, 43 (S1), S4–S19. [DOI] [PubMed] [Google Scholar]
- 5.Smirnova TI; Smirnov AI, High-Field ESR Spectroscopy in Membrane and Protein Biophysics In ESR Spectroscopy in Membrane Biophysics; Hemminga MA, Berliner LJ, Eds.; Springer US: Boston, 2007; pp 165–251. [Google Scholar]
- 6.Dzikovski B; Tipikin D; Freed J Conformational distributions and hydrogen bonding in gel and frozen lipid bilayers: a high frequency spin-label ESR study. J. Phys. Chem. B 2012, 116 (23), 6694–6706. [DOI] [PMC free article] [PubMed] [Google Scholar]
- 7.Gorcester J; Freed JH Two-dimensional Fourier transform ESR spectroscopy. J. Chem. Phys 1986, 85 (9), 5375–5377. [Google Scholar]
- 8.Gorcester J; Freed JH Two-dimensional Fourier transform ESR correlation spectroscopy. J. Chem. Phys 1988, 88 (8), 4678–4693. [Google Scholar]
- 9.Franck JM; Chandrasekaran S; Dzikovski B; Dunnam CR; Freed JH Focus: Two-dimensional electron-electron double resonance and molecular motions: The challenge of higher frequencies. J. Chem. Phys 2015, 142 (21), 212302 1–14. [DOI] [PMC free article] [PubMed] [Google Scholar]
- 10.Patyal BR; Crepeau RH; Freed JH Lipid-gramicidin interactions using two-dimensional Fourier-transform electron spin resonance. Biophys. J 1997, 73 (4), 2201–2220. [DOI] [PMC free article] [PubMed] [Google Scholar]
- 11.Costa-Filho AJ; Shimoyama Y; Freed JHA 2D-ELDOR study of the liquid ordered phase in multilamellar vesicle membranes. Biophys. J 2003, 84 (4), 2619–2633. [DOI] [PMC free article] [PubMed] [Google Scholar]
- 12.Lee S; Budil DE; Freed JH Theory of Two-Dimensional Fourier Transform Electron Spin Resonance for Ordered and Viscous Fluids. J. Chem. Phys 1994, 101, 5529–5558. [Google Scholar]
- 13.Sastry VSS; Polimeno A; Crepeau RH; Freed JH Studies of spin relaxation and molecular dynamics in liquid crystals by two-dimensional Fourier transform electron spin resonance. II. Perdeuterated-tempone in butoxy benzylidene octylaniline and dynamic cage effects. J. Chem. Phys 1996, 105 (14), 5773–5791. [Google Scholar]
- 14.Xu D; Crepeau RH; Ober CK; Freed JH Molecular Dynamics of a Liquid Crystalline Polymer Studied by Two-Dimensional Fourier Transform and CW ESR. J. Phys. Chem 1996, 100 (39), 15873–15885. [Google Scholar]
- 15.Chiang Y-W; Costa-Filho A; Baird B; Freed JH 2D-ELDOR Study of Heterogeneity and Domain Structure Changes in Plasma Membrane Vesicles upon Cross-Linking of Receptors. J. Phys. Chem. B 2011, 115, 10462–10469. [DOI] [PMC free article] [PubMed] [Google Scholar]
- 16.Angerhofer A; Massoth RJ; Bowman MK Fourier transform EPR measurement of homogeneous electron transfer rates. Isr. J. Chem 1988, 28 (4), 227–238. [Google Scholar]
- 17.Fauth JM; Kababya S; Goldfarb D Application of 2D FTEPR spectroscopy to study slow intramolecular chemical exchange. J. Magn. Reson 1991, 92 (1), 203–207. [Google Scholar]
- 18.Dunnam C; Dzikovski B; Franck J; Freed JH In ACERT 95 GHz MKII ESR Spectrometer, 21st International Society of Magnetic Resonance Conference; Berlin, 2019. [Google Scholar]
- 19.Earle KA; Dzikovski B; Hofbauer W; Moscicki JK; Freed JH High-frequency ESR at ACERT. Magn. Reson. Chem 2005, 43 (S1), S256–S266. [DOI] [PubMed] [Google Scholar]
- 20.Hofbauer W; Earle KA; Dunnam CR; Moscicki JK; Freed JH High-power 95 GHz pulsed electron spin resonance spectrometer. Rev. Sci. Instrum 2004, 75 (5), 1194–1208. [Google Scholar]
- 21.Khramtsov VV; Bobko AA; Tseytlin M; Driesschaert B Exchange Phenomena in the Electron Paramagnetic Resonance Spectra of the Nitroxyl and Trityl Radicals: Multifunctional Spectroscopy and Imaging of Local Chemical Microenvironment. Anal. Chem 2017, 89 (9), 4758–4771. [DOI] [PMC free article] [PubMed] [Google Scholar]
- 22.Liz LJ; Allister M; Fuller N; Rand RP; Parsegian VA Interactions between neutral phospholipid bilayer membranes. Biophys. J 1982, 37, 651–666. [PMC free article] [PubMed] [Google Scholar]
- 23.Smirnov A; Smirnova T; Morse PD II Very High Frequency Electron Paramagnetic Resonance of 2,2,6,6-Tetramethyl-1-Piperidinyloxy in 1,2-Dipalmitoyl-sn-Glycero-3-Phosphatidylcholine Liposomes: Partitioning and Molecular Dynamics. Biophys. J 1995, 68, 2350–2360. [DOI] [PMC free article] [PubMed] [Google Scholar]
- 24.Fuchs J; Nitschmann WH; Packer L; Hankovszky OHKHFRRC pKa values and partition coefficients of nitroxide spin probes for membrane bioenergetic masurements. Free Radical Res. Commun 1990, 10 (6), 315–323. [DOI] [PubMed] [Google Scholar]
- 25.Nakagawa K Electron spin resonance investigation of small spin probes in aqueous and vesicle phases of mixed membranes made from poly(oxyethylene) hydrogrnated castor oil and hexadecane. Lipids 2005, 40 (7), 745–750. [PubMed] [Google Scholar]
- 26.Dzikovski B; Livshits V; Freed JH Interaction of Spin-Labeled Lipid Membranes with Transition Metal Ions. J. Phys. Chem. B 2015, 119, 13330–13346. [DOI] [PMC free article] [PubMed] [Google Scholar]
- 27.Saxena S; Freed JH Two-Dimensional Electron Spin Resonance and Slow Motions. J. Phys. Chem. A 1997, 101 (43), 7998–8008. [DOI] [PubMed] [Google Scholar]
- 28.Farrow NA; Zhang O; Forman-Kay JD; Kay LE A heteronuclear correlation experiment for simultaneous determination of 15N longitudinal decay and chemical exchange rates of systems in slow equilibrium. J. Biomol. NMR 1994, 4 (5), 727–734. [DOI] [PubMed] [Google Scholar]
- 29.Gupta P; Liang Z; Freed JH Microsecond dynamics in proteins by two-dimensional ESR: Predictions. J. Chem. Phys 2020, 152 (21), 214112. [DOI] [PMC free article] [PubMed] [Google Scholar]
- 30.Zhang Z; Fleissner MR; Tipikin DS; Liang Z; Moscicki JK; Earle KA; Hubbell WL; Freed JH Multifrequency electron spin resonance study of the dynamics of spin labeled T4 lysozyme. J. Phys. Chem. B 2010, 114 (16), 5503–5521. [DOI] [PMC free article] [PubMed] [Google Scholar]
- 31.Volodarsky LB; Grigoriev IA; Sagdeev RZ Stable imidazoline nitroxides In Biological Magnetic Resonance; Plenium Press: New York, 1980; Vol. 2, pp 169–242. [Google Scholar]
- 32.Hoffmann AK; Henderson AT A new stable free radical: dit-butyl nitroxide. J. Am. Chem. Soc 1961, 83, 4671–4672. [Google Scholar]
- 33.Dzikovski B Sample Preparation for Quasioptical High Field ESR. EPR Newsletter 2012, 22 (1), 14–15. [Google Scholar]
- 34.Gamliel D; Freed JH Theory of two-dimensional ESR with nuclear modulation. J. Magn. Reson 1990, 89 (1), 60–93. [Google Scholar]
- 35.Hyde JS; Chien JCW; Freed JH Electron-electron double resonance of free radicals in solution. J. Chem. Phys 1968, 48 (9), 4211–4226. [Google Scholar]
- 36.Freed JH Theory of saturation and double resonance effects in electron spin resonance spectra. II. Exchange vs. Dipolar mechanisms. J. Phys. Chem 1967, 71, 38–51. [Google Scholar]
- 37.Denk W; Wagner G; Rance M; Wüthrich K Combined suppression of diagonal peaks and t1 ridges in two-dimensional nuclear Overhauser enhancement spectra. J. Magn. Reson 1985, 62, 350–355. [Google Scholar]
- 38.CRC Handbook of Chemistry and Physics, 92nd ed.; CRC Press: Boca Raton, FL, 2011–2012. [Google Scholar]
- 39.Tristram-Nagle S; Liu Y; Legleiter J; Nagle JF Structure of gel phase DMPC determined by X-ray diffraction. Biophys. J 2002, 83 (6), 3324–3335. [DOI] [PMC free article] [PubMed] [Google Scholar]
- 40.Rand RP; Parsegian VA Hydration forces between phospholipid bilayers. Biochim. Biophys. Acta, Rev. Biomembr 1989, 988 (3), 351–376. [Google Scholar]
- 41.Severcan F; Cannistraro S Use of PDDTBN spin probe in partition studies of lipid membranes. Chem. Phys. Lett 1988, 153, 263–267. [Google Scholar]
- 42.Hansch C Quantitative approach to biochemical structure-activity relationship. Acc. Chem. Res 1969, 2, 232–239. [Google Scholar]
- 43.Shin YK; Ewert U; Budil DE; Freed JH Microscopic versus macroscopic diffusion in model membranes by electron spin resonance spectral-spatial imaging. Biophys. J 1991, 59 (4), 950–957. [DOI] [PMC free article] [PubMed] [Google Scholar]
- 44.Freed JH Field gradient ESR and molecular diffusion in model membranes. Annu. Rev. Biophys. Biomol. Struct 1994, 23, 1–25. [DOI] [PubMed] [Google Scholar]
- 45.Hornak JP; Moscicki JK; Schneider DJ; Freed JH Diffusion coefficients in anisotropic fluids by ESR imaging of concentration profiles. J. Chem. Phys 1986, 84 (6), 3387–3395. [Google Scholar]
- 46.Bloch F Nuclear Induction. Phys. Rev 1946, 70, 460–474. [Google Scholar]
- 47.McConnell HM Reaction Rates by Nuclear Magnetic Resonance. J. Chem. Phys 1958, 28, 430–431. [Google Scholar]
- 48.Ge M; Freed JH Hydration, structure, and molecular interactions in the headgroup region of dioleoylphosphatidylcholine bilayers: an electron spin resonance study. Biophys. J 2003, 85 (6), 4023–4040. [DOI] [PMC free article] [PubMed] [Google Scholar]
- 49.Srivastava M; Anderson CL; Freed JH A New Wavelet Denoising Method for Selecting Decomposition Levels and Noise Thresholds. IEEE Access 2016, 4 (1), 3862–3877. [DOI] [PMC free article] [PubMed] [Google Scholar]
- 50.Srivastava M; Georgieva ER; Freed JH A New Wavelet Denoising Method for Experimental Time-Domain Signals: Pulsed Dipolar Electron Spin Resonance. J. Phys. Chem. A 2017, 121 (12), 2452–2465. [DOI] [PMC free article] [PubMed] [Google Scholar]
- 51.Grotthuss CJT Sur la decomposition de l’eau et des corps q’uelle tient en dissolution à l’aide de l’électricité galvanique. Ann. Chim. Phys 1806, LVIII, 54–74. [Google Scholar]
- 52.Eigen M Proton Transfer, Acid-Base Catalysis, and Enzymatic Hydrolysis. Part I: Elementary Processes. Angew. Chem., Int. Ed. Engl 1964, 3, 1–19. [Google Scholar]
- 53.Hibbert F Slow proton transfer involving amino groups. J. Chem. Soc., Chem. Commun 1973, 463. [Google Scholar]
- 54.Denisov ET; Sarkisov OM; Likhtenshtein GI Acid-base catalysis In Chemical Kinetics; Denisov ET, Sarkisov OM, Likhtenshtein GI, Eds.; Elsevier Science: New York, 2003; Chapter 15, pp 430–451. [Google Scholar]
- 55.Cohen B; Huppert D Non-Exponential Smoluchowski Dynamics in Fast Acid-Base Reaction. J. Am. Chem. Soc 2000, 122, 9838–9839. [Google Scholar]
- 56.Terranova ZL; Corcelli SA Monitoring Intramolecular Proton Transfer with Two-Dimensional Infrared Spectroscopy: A Computational Prediction. J. Phys. Chem. Lett 2012, 3 (13), 1842–1846. [DOI] [PubMed] [Google Scholar]
- 57.Dempsey CE Hydrogen exchange in peptides and proteins using NMR spectroscopy. Prog. Nucl. Magn. Reson. Spectrosc 2001, 39, 135–170. [Google Scholar]
- 58.Wraight CA Chance and design—Proton transfer in water, channels and bioenergetic proteins. Biochim. Biophys. Acta, Bioenerg 2006, 1757 (8), 886–912. [DOI] [PubMed] [Google Scholar]
- 59.Voinov MA; Ruuge A; Reznikov VA; Grigor’ev IA; Smirnov AI Mapping local protein electrostatics by EPR of pH-sensitive thiol-specific nitroxide. Biochemistry 2008, 47 (20), 5626–5637. [DOI] [PMC free article] [PubMed] [Google Scholar]
- 60.Voinov MA; Kirilyuk IA; Smirnov AI Spin-labeled pH-sensitive phospholipids for interfacial pKa determination: synthesis and characterization in aqueous and micellar solutions. J. Phys. Chem. B 2009, 113 (11), 3453–3460. [DOI] [PMC free article] [PubMed] [Google Scholar]
- 61.Subczynski WK; Wojas J; Pezeshk V; Pezeshk A Partitioning and localization of spin-labeled amantadine in lipid bilayers: an EPR study. J. Pharm. Sci 1998, 87 (10), 1249–54. [DOI] [PubMed] [Google Scholar]
- 62.Omote H; Al-Shawi MK A novel electron paramagnetic resonance approach to determine the mechanism of drug transport by P-glycoprotein. J. Biol. Chem 2002, 277 (47), 45688–45694. [DOI] [PubMed] [Google Scholar]
- 63.dos Anjos JL; Alonso A Terpenes increase the partitioning and molecular dynamics of an amphipathic spin label in stratum corneum membranes. Int. J. Pharm 2008, 350 (1–2), 103–112. [DOI] [PubMed] [Google Scholar]
- 64.Shinoda W Permeability across lipid membranes. Biochim. Biophys. Acta, Biomembr 2016, 1858 (10), 2254–2265. [DOI] [PubMed] [Google Scholar]
- 65.Diamond JM; Katz Y Interpretation of nonelectrolyte partition coefficients between dimyristoyl lecithin and water. J. Membr. Biol 1974, 17, 121–154. [DOI] [PubMed] [Google Scholar]
Associated Data
This section collects any data citations, data availability statements, or supplementary materials included in this article.


