Abstract
Purpose:
To investigate whether positron emission tomography/computed tomography (PET/CT) initial and restaging imaging predicts for pathologic response measured by tumor regression grade (TRG) after preoperative chemoradiotherapy (CRT) in patients with locally advanced esophageal cancer.
Methods:
A retrospective review of 220 patients with stage II-III esophageal cancer treated with neoadjuvant CRT followed by surgery was performed. In total, 187 patients were eligible for statistical analysis. Pretreatment and posttreatment PET/CT scans were reviewed. Maximum standard uptake value (SUV) at the site of the primary tumor was recorded before and 6 weeks after neoadjuvant therapy. Upon completion of surgery, TRG was determined by a specialized site-specific gastrointestinal pathologist. Spearman correlation was used to compare pre, post, and change in maximum SUV, TRG, and overall survival.
Results:
The median follow-up was 24 months. Although no significant correlation was found between pretreatment SUV and TRG (r = 0.073, P = 0.32), post-CRT SUV, however, showed a significant positive correlation with TRG (r = 0.374, P < 0.01). There was no significant correlation between the absolute change in fluorodeoxyglucose uptake after CRT and TRG (r = 0.057, P = 0.44); however, the rate of SUV change showed a significant correlation with TRG (r = 0.178, P = 0.017). Similar to previous studies, our study showed a significant difference in overall survival between TRG groups (log-rank test, P = 0.019). Patients with TRG 3 showed prominently worse survival with median survival of 27.4 months. Patients with favorable pathologic responses were those whose scans demonstrated a metabolic response defined as a decrease in SUV≥70%.
Conclusions:
Changes in SUV uptake on PET/CT scans after CRT have prognostic value in predicting pathologic response of esophageal cancer after neoadjuvant therapy. Further studies are needed to validate the integration of PET/CT as a decision-making tool.
Keywords: TRG, PET, esophagus cancer
Esophageal cancer is the seventh leading cause of cancer-related death among men, and carries a dismal 17.3% overall 5-year survival rate.1 The American Cancer Society estimates that there have been roughly 16,980 new cases of esophageal cancer diagnosed in the year 2015 with 15,590 deaths from the disease. With a historic increase in the incidence and prevalence of the disease, the most effective treatment of esophageal cancer with the least toxicity is the subject of ongoing debate.
Our current practice, according to the National Comprehensive Cancer Network guidelines, has been to use preoperative chemoradiotherapy (CRT) followed by esophagectomy in patients with locally advanced esophageal carcinoma. This standard of care was brought about by several clinical trials and more recently the CROSS trial. Published in 2012, the CROSS trial was the largest randomized trial to date to show the benefits of preoperative CRT among patients with locally advanced esophageal and esophagogastric-junction cancers.2
The most widely used noninvasive means of evaluating response to neoadjuvant CRT is by measuring positron emission tomography-fluorodeoxyglucose (PET-FDG) activity posttreatment. There have been several studies showing a correlation between FDG activity and tumor response (ie, metabolic and histopathologic response).3 PET/computed tomographic (CT) scans taken at baseline and as soon as after 2 weeks of chemotherapy in patients with locally advanced esophageal adenocarcinoma were found to be predictive of histologic response to neoadjuvant therapy in the MUNICON study.4
The effects of neoadjuvant chemotherapy and radiation are best determined by histopathologic evaluation of the resection specimen. The tumor regression grade (TRG) system categorizes the regressive changes after neoadjuvant therapy and refers to the amount of fibrosis in relation to the residual tumor and the percentage of residual tumor. For esophageal cancer, the commonly used TRG systems are the one extrapolated from the rectal literature including Mandard grading and the Becker grading systems among others.5
Several studies in other gastrointestinal malignancies supported the use of PET scans in staging, and predicting response to neoadjuvant therapy. In a recent meta-analysis to assess the predictive value of 18F-FDG PET/CT for pathologic response to neoadjuvant CRT in locally advanced rectal cancer, the analysis supported the use of PET scans for staging, restaging as well as a predictive of response with major response group showing similar sensitivity to the complete response group (74% and 71%, respectively).6
Another series tried to correlate several qualitative visual response and various PET quantification factors with the TRG classification of pathologic response to neoadjuvant CRT in rectal cancer. In that series, FDG PET/CT accurately stratified patients preoperatively. The most commonly used parameter in clinical practice (standard uptake value [SUVmax] after CRT and visual response assessment) showed the best accuracy in predicting TRG.7
Similar finding were seen in a smaller series of patients with rectal cancer, where posttreatment and pretreatment PET scans were predictive of response: the following parameters were obtained: 79.2% specificity, 81.2% sensitivity, 77% positive predictive value, 89% negative predictive value, and 80% overall accuracy.8
The purpose of this study is to investigate whether PET-FDG uptake before and after neoadjuvant CRT predicts for pathologic response after CRT in patients with esophageal cancer and whether it should be used as a decision-making tool.
METHODS
Our Institutional Review Board approved this retrospective study. Using the Moffitt Cancer Center prospective database maintained by the Department of Gastrointestinal Oncology, a total of 220 patients with stage II and III esophageal cancer treated with neoadjuvant CRT between June 2001 and July 2014 were identified. Of this number, 187 patients were eligible for statistical analysis. The remaining 33 patients had missing data from PET-FDG readings (either pre-CRT or post-CRT) from scans that were not obtained at our institution. All 220 of our patients underwent neoadjuvant CRT comprising of cisplatin and fluorouracil in combination with 45 to 56 Gy over 5.5 weeks. Restaging PET/CT scans were performed 6 to 8 weeks after completion of neoadjuvant chemoradiation. Metabolic tracer imaging was performed with FDG-positron emission tomography (PET) integrated with CT, using either a Siemens Biograph Classic PET/CT or a General Electric Healthcare Discovery PET/CT scanner. Imaging was initiated at 90 minutes after intravenous injection of 296 to 555 MBq (8 to 15 mCi) of radiotracer. Both devices provide for the selection of a voxel within a selected volume of interest for the maximum standardized uptake rate (SUVmax), defined as the ratio of tissue radioactivity concentration and the injected dose at the time of injection divided by body weight.
Surgery was scheduled within 2 to 4 weeks after the restaging PET/CT scan showed no evidence of disease progression. The pathologic response was determined by the tumor regression grading system. TRG was classified into 3 tiers: a score of 0 correlated with 0% residual tumor or complete pathologic response; a score of 1 correlated with <10% residual tumor; a score of 2 correlated with 10% to 50% residual tumor, whereas a score of 3 correlated with >50% residual tumor.9
Descriptive statistics were then used to summarize variables. To compare the change in PET/CT with TRG, a Spearman test was used. Kaplan-Meier curves were fit to estimate overall survival. The median survival estimates were calculated, as well as specific year survival estimates. Log-rank P-values were computed to test survival group differences and P-values were considered 2 sided unless otherwise specified. All analyses were performed using SAS version 9.3 (SAS Institute, Cary, NC) and R version 3.0.2.
RESULTS
Demographic and Clinical Characteristics
Of the total 220 patients, 187 patients had documented SUVs on PET/CT imaging before and after neoadjuvant CRT. On the pretreatment PET/CT imaging, 192 patients had SUV between 0 and 81 (n = 192, M = 12, SD = 9.2). There were 38 with missing SUV readings and 9 patients had an SUV of zero.
With regards to post-PET/CT imaging, 205 patients had SUVs between 0 and 24 (n = 205, M = 3.6, SD = 3.4). There were 15 patients who were missing SUV readings and 63 patients had an SUV of zero. The change in paired SUV before and after CRT ranged from −7.6 to 8.3 (n = 187, M = −7.8, SD = 9.3) and was significantly different between pretreatment and posttreatment measurement (paired t test, P < 0.01, Fig. 1, Supplemental Digital Content 1, http://links.lww.com/AJCO/A113).
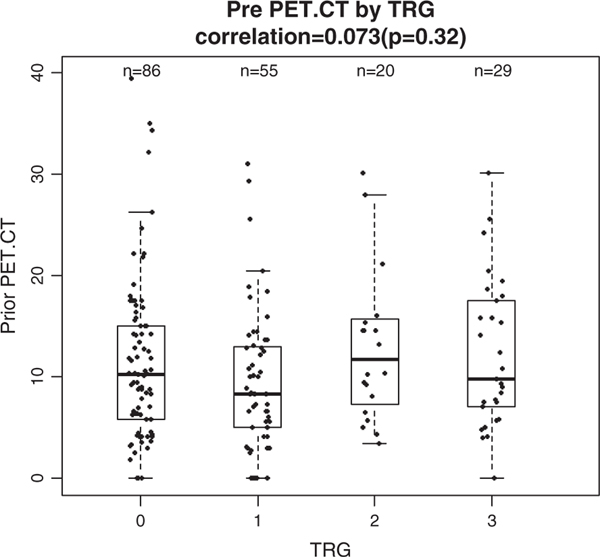
FIGURE 1.
Correlation between prior positron emission tomography (PET) standard uptake value (SUV) by tumor regression grade (TRG). No significant relationship between TRG and pretreatment PET SUV value. CT indicates computed tomography.
There were 159 patients who had an absolute reduction in SUV after neoadjuvant CRT, whereas 20 patients had increased SUVs. Of note there were 7 patients who had non-PET avid disease with SUVs of zero.
Correlation Between SUV Values Pre-CRT and Post-CRT and TRG
Pretreatment PET/CT SUV values did not correlate with TRG (r = 0.073, P = 0.32) and there was no significant difference in the means of SUV across TRG values (1-way analysis of variance, P = 0.318) (Fig. 1).
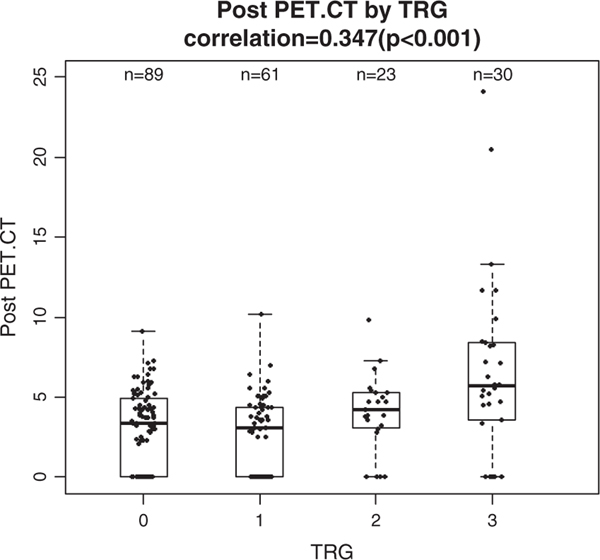
Post-CRT SUV, however, showed a significant positive correlation with TRG (r = 0.374, P < 0.01) and there was a significant difference in means of SUV across TRG groups (1-way analysis of variance, P < 0.01). Post-CRT, SUV of patients also showed increasing trend across TRG from 0 to 3 with corresponding averages of 2.9, 2.8, 4, and 6.6 (Fig. 2).
FIGURE 2.
Correlation between posttreatment positron emission tomography (PET) standard uptake value (SUV) and tumor regression grade (TRG). Significant relationship between TRG and posttreatment PET SUV value (r = 0.374, P < 0.001). CT indicates computed tomography.
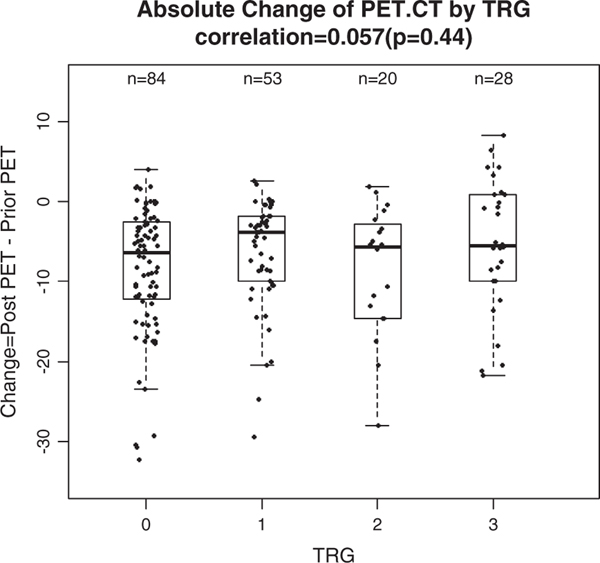
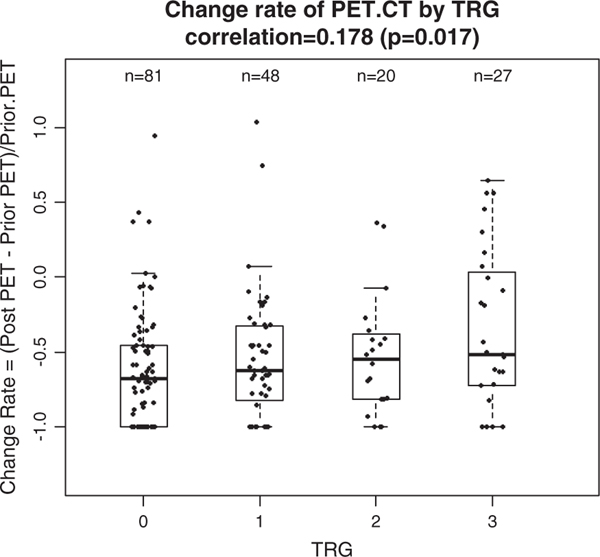
The absolute change between pre-SUV and post-SUV on PET/CT was calculated and did not correlate with TRG (r = 0.057, P = 0.44, Fig. 3), whereas the rate of standard uptake value (RSUV) change, defined as the ratio of the difference of post-SUV to pre-SUV, showed a significant correlation with TRG (r = 0.178, P = 0.017). The median RSUV of patients in this study showed an increasing trend across TRG from 0 to 3 with corresponding medians of −0.68, −0.63, −0.66, and −0.51 and there was a borderline significant difference between those medians of RSUV (Kruskal-Wallis test, P = 0.097) table on the right (Fig. 4).
FIGURE 3.
Absolute difference of positron emission tomography (PET) standard uptake value before and after chemotherapy. Insignificant correlation. CT indicates computed tomography; TRG, tumor regression grade.
FIGURE 4.
Correlation between tumor regression grade (TRG) and change rate of positron emission tomography (PET) standard uptake value. Significant rank correlation of 0.178 (P = 0.017). CT indicates computed tomography.
Prognostic Value of TRG
To investigate the prognostic effect of TRG, survival distributions were compared among the 4 TRG groups using the log-rank test. Results showed a significant difference in overall survival between TRG groups (log-rank test, P = 0.019). Survival curves of patients with TRG of 0, 1, and 2 crossed during the follow-up and there was no prolonged survival trend along TRG (Renyi trend test, P = 0.384, Fig. 2, Supplemental Digital Content 2, http://links.lww.com/AJCO/A114). However, patients with TRG 3 showed prominently worse survival with the shortest median survival of 27.4 months and significantly worse survival distribution than each of other groups (log-rank test P-values : P = 0.02 vs. TRG 0; P < 0.01 vs. TRG 1; P = 0.048 vs. TRG 2; results not shown). An additional survival analysis after aggregating 186 patients with TRG 0, 1, and 2 and plotting this against the 36 patients who had a TRG of 3 showed that the median overall survival was 55.8 versus 27.4 months (log-rank test, P = 0.002, Fig. 3, Supplemental Digital Content 3, http://links.lww.com/AJCO/A115)
Prognostic Value of SUV Reduction Rate
As the change in SUV did not consider the baseline SUV before neoadjuvant CRT, we investigated the prognostic value of the reduction rate of SUV on PET/CT. Patients with a SUV reduction rate of >35% were defined as metabolic responders and all others were considered metabolic nonresponders. Survival comparison analysis resulted in no significant difference between the 2 groups (log-rank test, P = 0.803, Fig. 4, Supplemental Digital Content 4, http://links.lww.com/AJCO/A116).
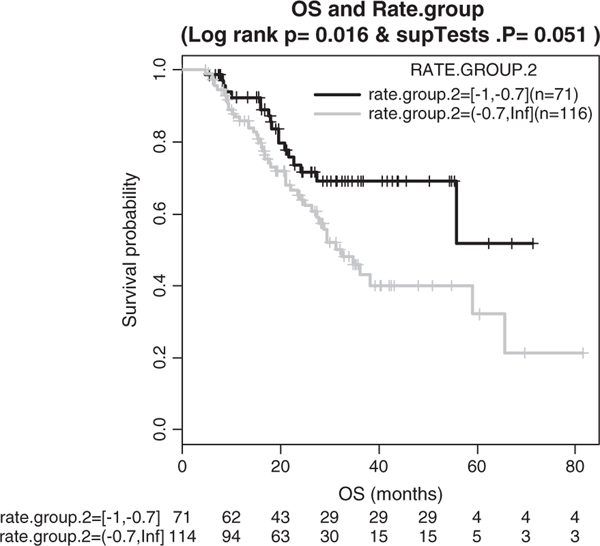
We further performed an exhaustive search of a cutoff of RSUV that can predict patients’ survivorship. Patients were stratified again into metabolic responders and nonresponders at gradually increased cutoffs in a range of RSUV and the survival distributions were compared at each cutoff. The cutoff of 70% resulted in the largest survival difference between metabolic responders and nonresponders (log-rank test, P = 0.016, Fig. 5). Cox proportional hazard regression analysis was performed to evaluate the effect of RSUV as a continuous prognostic marker itself on overall survival after excluding cases with infinite and missing RSUVs. This showed that decreased RSUV was significantly associated with a lower hazard ratio (P = 0.031, hazard ratio = 0.543, 95% confidence interval, 0.312–0.945).
FIGURE 5.
Kaplan-Meier survival curves comparing responders (noted as “yes” in KM plot) to nonresponders. Responders defined as standard uptake value decrease rate ≥70%.
DISCUSSION
Despite integrating neoadjuvant CRT in the treatment of locally advanced esophageal cancer, the prognosis is still dismal. A significant percentage of patients do not respond to neoadjuvant therapy or even progress after treatment. In fact, studies estimate a pathologic response rate ranging from 27% to 64%, with rates of stable or progressive disease ranging from 20% to 39%.10,11
Furthermore, neoadjuvant CRT is associated with significant potential morbidity. Depending on the regimen chosen, grade 3 or 4 systemic side effects are not uncommon, including leukopenia (6% to 11%), granulocytopenia (2% to 23%), anorexia (5%), nausea (15%), vomiting (13%), and fatigue (3%).9,12,13
The role of surgical resection in patients with esophageal cancer is still controversial, but it is still the best option for cure to patients with early-stage disease. In addition, esophagectomy, even with advances in surgical techniques and perioperative management, is still associated with significant morbidity and mortality. The ability to predict for pathologic response and eventually survival would be an important tool to identify patients for whom definitive chemotherapy and radiation might be an option.
Several modalities have been suggested to assess for tumor response during neoadjuvant CRT. Comparisons have been made among endoscopic ultrasound, CT, and PET. In a review article published in 2006, Sloof3 concluded that PET was superior to CT and endoscopic ultrasound in assessing tumor response to CRT as metabolic imaging with PET-FDG is able to discriminate viable tumor from necrotic scar tissue.
Flamen et al11 showed a concordance rate of 78% between the response on PET imaging postneoadjuvant CRT and histopathology. It is important to differentiate, however, that the definition of histopathology used was the TNM staging system. Thus, this study showed a clear correlation between post-CRT PET and down-staging of tumors. This phenomenon has been proven and is distinct from TRG.
TRG has been shown to correlate with disease-free survival.4,5,14–17 It was first quantitated into 5 grades by Mandard et al.15 It was later refined to a 3-tier grading system by Wu et al5 and was officially incorporated into the National Comprehensive Cancer Network guidelines as the gold standard for assessing pathologic response to neoadjuvant CRT in the treatment of esophageal carcinoma in 2011.
Levine and colleagues showed a correlation between the change in SUV preneoadjuvant and postneoadjuvant CRT and pathologic response. Their data suggested that the larger the difference in SUV preneoadjuvant and postneoadjuvant treatment, the more likely the patient was to respond.10 The reason as to why this was observed is uncertain. Perhaps more FDG-active masses imply more aggressive/active disease and dividing cells are more apt to respond—a phenomenon observed in hematologic malignancies.
Our study was undertaken to further evaluate the value of PET/CT in predicting response to CRT in patients with esophageal cancer. First, we found no difference in the pretreatment FDG uptake between responders and nonresponders that has been reported in other malignancies such as lung and head and neck. Second, while we found no correlation between the absolute change in SUV (preneoadjuvant and postneoadjuvant CRT) and TRG, we did find a significant correlation between the reduction rate of SUV and TRG. This suggests that, patients who exhibit a metabolic response on PET/CT imaging after neoadjuvant CRT are more apt to have a pathologic response.
Similar findings of patients exhibiting early metabolic response were used to conduct the MUNICON Trial.4 In that phase II trial, all patients were treated with chemotherapy upfront for 2 weeks. Metabolic responders, defined as patients who experienced a >35% reduction in FDG activity between prechemotherapy and postchemotherapy scans, continued to receive neoadjuvant chemotherapy for 12 weeks and then proceeded to surgery. Nonresponders proceeded to surgery. Metabolic responders, not surprisingly, had higher overall survival. The MUNICON trial is one of the first prospective trials to implement response-guided treatment in esophageal and gastric cancer.
Third, we found that, across different rates of change in SUVs after neoadjuvant CRT, patients with decrease in RSUV ≥70%, have better survival. Further validation is needed before using this cutoff as a prognostic indicator and in treatment decisions. Fourth, we found a strong correlation between TRG and overall survival as previously confirmed in several studies.4,5,14–17
Our study has several limitations including a non-randomized design, single institutional cohort, and the lack of standardized PET/CT technology and cutoff values.
The use of PET scans is recommended as part of the initial staging workup as well as the evaluation of response to treatment in patients with gastrointestinal malignancies in general and esophageal cancer in particular. Nonetheless, our data support the use of PET scan as a predictive test for responders and possibly survival; however, using metabolic imaging with FDG PET to guide treatment is very premature. Further testing and large randomized trials are needed for validation.
Supplementary Material
Footnotes
The authors declare no conflicts of interest.
Supplemental Digital Content is available for this article. Direct URL citations appear in the printed text and are provided in the HTML and PDF versions of this article on the journal’s Website, www.amjclinicaloncology.com.
REFERENCES
- 1.Howlader N, Noone AM, Krapcho M, Garshell J, Miller D, Altekruse SF, Kosary CL, Yu M, Ruhl J, Tatalovich Z, Mariotto A, Lewis DR, Chen HS, Feuer EJ, Cronin KA. (eds). SEER Cancer Statistics Review, 1975–2009. Bethesda, MD: National Cancer Institute; 2012. [Google Scholar]
- 2.van Hagen P, Hulshof MC, van Lanschot JJ, et al. Preoperative chemoradiotherapy for esophageal or junctional cancer. N Engl J Med. 2012;366:2074–2084. [DOI] [PubMed] [Google Scholar]
- 3.Sloof GW. Response monitoring of neoadjuvant therapy using CT, EUS, and FDG-PET. Best Pract Res Clin Gastroenterol. 2006;20: 941–957. [DOI] [PubMed] [Google Scholar]
- 4.Lordick F, Ott K, Krause BJ, et al. PET to assess early metabolic response and to guide treatment of adenocarcinoma of the oesophagogastric junction: the MUNICON phase II trial. Lancet Oncol. 2007;8:797–805. [DOI] [PubMed] [Google Scholar]
- 5.Wu TT, Chirieac LR, Abraham SC, et al. Excellent interobserver agreement on grading the extent of residual carcinoma after preoperative chemoradiation in esophageal and esophagogastric junction carcinoma: a reliable predictor for patient outcome. Am J Surg Pathol. 2007;31:58–64. [DOI] [PubMed] [Google Scholar]
- 6.Maffione AM, Marzola MC, Capirci C, et al. Value of 18F-FDG PET for predicting response to neoadjuvant therapy in rectal cancer: systematic review and meta-analysis. AJR Am J Roentgenol. 2015;204:1261–1268. [DOI] [PubMed] [Google Scholar]
- 7.Maffione AM, Ferretti A, Grassetto G, et al. Fifteen different 18F-FDG PET/CT qualitative and quantitative parameters investigated as pathological response predictors of locally advanced rectal cancer treated by neoadjuvant chemoradiation therapy. Eur J Nucl Med Mol Imaging. 2013;40:853–864. [DOI] [PubMed] [Google Scholar]
- 8.Capirci C, Rampin L, Erba PA, et al. Sequential FDG-PET/CT reliably predicts response of locally advanced rectal cancer to neoadjuvant chemo-radiation therapy. Eur J Nucl Med Mol Imaging. 2007;34:1583–1593. [DOI] [PubMed] [Google Scholar]
- 9.Stahl M, Stuschke M, Lehmann N, et al. Chemoradiation with and without surgery in patients with locally advanced squamous cell carcinoma of the esophagus. J Clin Oncol. 2005;23: 2310–2317. [DOI] [PubMed] [Google Scholar]
- 10.Levine EA, Farmer MR, Clark P, et al. Predictive value of 18-fluorodeoxy glucose-positron emission tomography (18F-FDG-PET) in the identification of responders to chemoradiation therapy for the treatment of locally advanced esophageal cancer. Ann Surg. 2006;243:472–478. [DOI] [PMC free article] [PubMed] [Google Scholar]
- 11.Flamen P, Van Cutsem E, Lerut A, et al. Positron emission tomography for assessment of the response to induction radiochemotherapy in locally advanced oesophageal cancer. Ann Oncol. 2002;13:361–368. [DOI] [PubMed] [Google Scholar]
- 12.Medical Research Council Oesophageal Cancer Working Party. Surgical resection with or without preoperative chemotherapy in oesophageal cancer: a randomised controlled trial. Lancet. 2002;359:1727–1733. [DOI] [PubMed] [Google Scholar]
- 13.Cunningham D, Allum WH, Stenning SP, et al. Perioperative chemotherapy versus surgery alone for resectable gastroesophageal cancer. N Engl J Med. 2006;80:11–20. [DOI] [PubMed] [Google Scholar]
- 14.Guo K, Cai L, Zhang Y, et al. The predictive value of histological tumor regression grading (TRG) for therapeutic evaluation in locally advanced esophageal carcinoma treated with neoadjuvant chemotherapy. Chin J Cancer. 2012;31:399–408. [DOI] [PMC free article] [PubMed] [Google Scholar]
- 15.Mandard AM, Dalibard F, Mandard JC, et al. Pathologic assessment of tumor regression after preoperative chemoradiotherapy of esophageal carcinoma. Clinicopathologic correlations. Cancer. 1994;73:2680–2686. [DOI] [PubMed] [Google Scholar]
- 16.Becker K, Mueller JD, Schulmacher C, et al. Histomorphology and grading of regression in gastric carcinoma treated with neoadjuvant chemotherapy. Cancer. 2003;98:1521–1530. [DOI] [PubMed] [Google Scholar]
- 17.Langer R, Ott K, Feith M, et al. Prognostic significance of histopathological tumor regression after neoadjuvant chemotherapy in esophageal adenocarcinomas. Mod Pathol. 2009;22: 1555–1563. [DOI] [PubMed] [Google Scholar]
Associated Data
This section collects any data citations, data availability statements, or supplementary materials included in this article.


