

Abstract
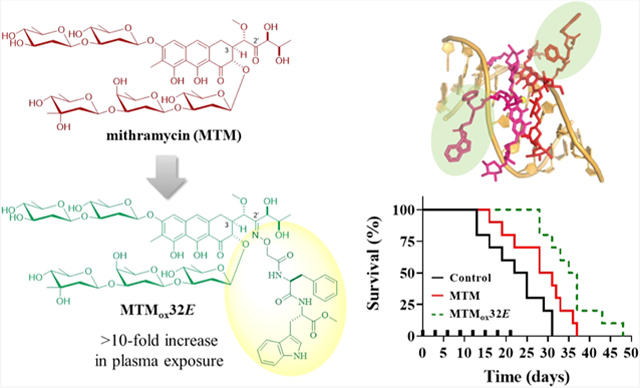
Mithramycin A (MTM) inhibits the oncogenic transcription factor EWS-FLI1 in Ewing sarcoma, but poor pharmacokinetics (PK) and toxicity limit its clinical use. To address this limitation, we report an efficient MTM 2′-oxime (MTMox) conjugation strategy for rapid MTM diversification. Comparative cytotoxicity assays of 41 MTMox analogues using E-twenty-six (ETS) fusion-dependent and ETS fusion-independent cancer cell lines revealed improved ETS fusion-independent/dependent selectivity indices for select 2′-conjugated analogues as compared to MTM. Luciferase-based reporter assays demonstrated target engagement at low nM concentrations, and molecular assays revealed that analogues inhibit the transcriptional activity of EWS-FLI1. These in vitro screens identified MTMox32E (a Phe–Trp dipeptide-based 2′-conjugate) for in vivo testing. Relative to MTM, MTMox32E displayed an 11-fold increase in plasma exposure and improved efficacy in an Ewing sarcoma xenograft. Importantly, these studies are the first to point to simple C3 aliphatic side-chain modification of MTM as an effective strategy to improve PK.
Graphical Abstract
INTRODUCTION
Dysregulation of E26 transformation-specific or E-twenty-six (ETS) transcription factors is central to cell cycle control, differentiation, proliferation, apoptosis, tissue remodeling, and angiogenesis.1 These proteins, when dysregulated, are key drivers in many cancers such as Ewing sarcoma, leukemias, prostate cancer, ovarian cancer, breast cancer, gastric cancer, and liver cancer.2 Among these cancers, Ewing sarcoma is the second most common malignant bone tumor in childhood,3 a signature of which are ETS transcription factor genetic rearrangements EWS-FLI1 (~85% occurrence) or EWS-ERG (~10% occurrence).4,5 The DNA-binding domains of EWS-FLI1 and EWS-ERG are conserved and their transcriptional control activity drives tumor cell differentiation, malignancy, proliferation, and invasiveness.2,6–13 Current treatment of Ewing sarcoma includes local radiotherapy and surgical resection with neoadjuvant chemotherapy.14,15 Importantly, the prognosis of patients with metastatic, recurrent, or refractory Ewing sarcoma is poor and second-line therapies are lacking.
To address the lack of suitable Ewing sarcoma therapies, a ~50,000 compound screen conducted by the National Cancer Institute identified mithramycin A (MTM) as a potent EWS-FLI1 inhibitor.16 MTM (Figure 1A) is a DNA-binding natural product that, prior to the NCI study, was known as a Sp1 transcription factor inhibitor.17–19 Subsequent validation studies confirmed that MTM interferes with EWS-FLI1 binding on the NR0B1 promoter and selectively inhibits EWS-FLI1 transcriptional activation. MTM also inhibited tumor growth of Ewing sarcoma xenografts in mice.16 Yet, despite the success of MTM in preclinical Ewing sarcoma models, a phase I/II clinical trial investigating MTM therapy in children and adults with refractory Ewing sarcoma was recently terminated because of dose-limiting liver toxicity.20 Similar severe MTM dose-limiting toxicities were observed in previous clinical studies for testicular carcinoma.21,22 Cumulative preclinical and clinical studies also highlighted the poor pharmacokinetics (PK) of MTM as a critical liability that prevents attainment of pharmacologically relevant concentrations in plasma.20,23–25
Figure 1.
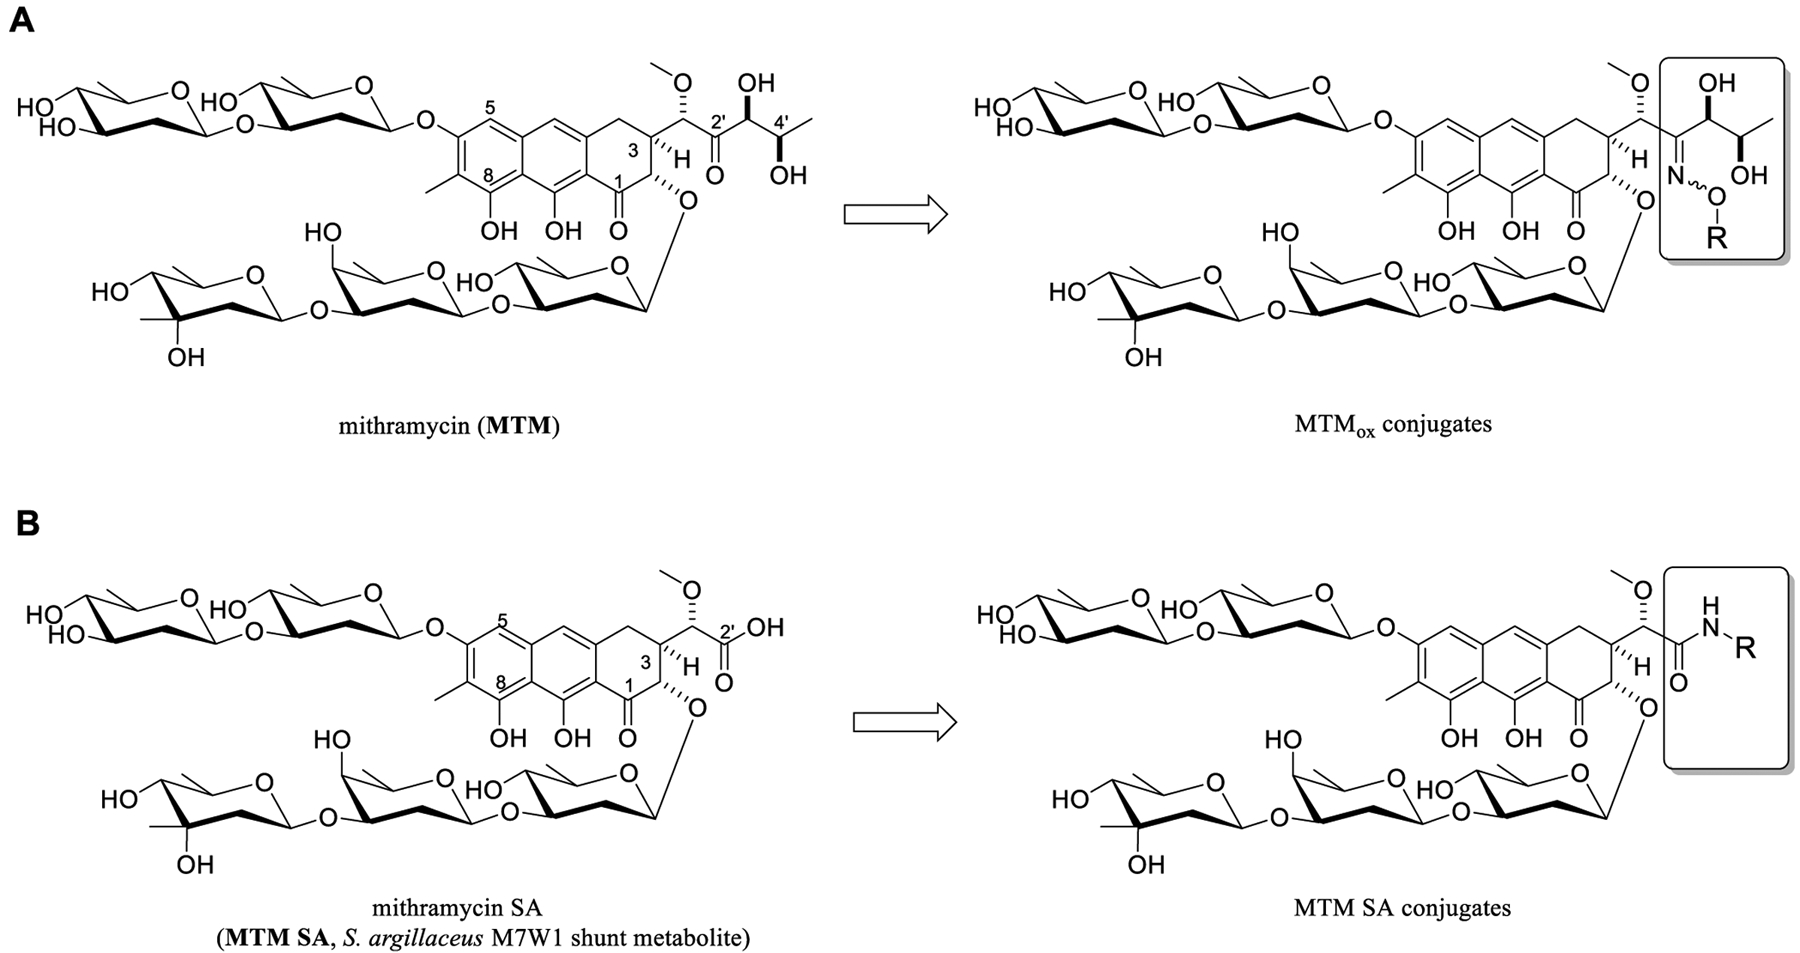
(A) Structure of the natural product drug mithramycin (MTM) and corresponding 2′-oxime conjugates (MTMox conjugates, this work). (B) Structure of engineered shunt metabolite mithramycin SA (MTM SA) and corresponding 2′-amide conjugates (prior work).
In an attempt to address the putative off-target activities of MTM that contribute to dose-limiting toxicities, we recently reported strategic modification of MTM C3 aliphatic side chain to afford analogues with improved EWS-FLI1 and Ewing sarcoma cell line selectivity.26 The prior chemistry leveraged the 2′-carboxylic acid of the shunt metabolite mithramycin SA (MTM SA; Figure 1B) produced in low-to-moderate yields by a genetically engineered strain Streptomyces argillaceus M7W1.25 This proof-of-concept study, in conjugation with corresponding EWS-FLI1-DNA-MTM structural models,27 suggested that the modified MTM C3 aliphatic side chain modulated the interactions of transcription factors with DNA. In this context, we describe the development of a robust one-step selective MTM 2′-oxime (MTMox; Figure 1A) conjugation strategy for rapid MTM diversification. Here, we used in vitro cytotoxicity as well as biochemical and molecular assays to identify analogues with selective efficacy in ETS-dependent cell lines and to demonstrate target engagement. Subsequent in vivo studies with the proof-of-concept Phe–Trp dipeptide-based 2′-conjugate MTMox32E highlighted notably improved PK and enhanced efficacy in an Ewing sarcoma mouse xenograft relative to MTM. Cumulatively, these studies provide further support for MTM C3 aliphatic side-chain modification as a means to improve selectivity toward EWS-ETS transcription factors and, for the first time, point to MTM C3 aliphatic side-chain modification as a strategy to improve MTM PK.
RESULTS AND DISCUSSION
Selective MTMox Conjugation.
Development of selective conjugation chemistry is key to assessing the impact of MTM C3 aliphatic side-chain diversification on EWS-FlI1 inhibition. Tevyashova and co-authors reported selective 2′-keto oxime formation of the C3 side chain with the natural product olivomycin I (a natural product with the identical MTM core pharmacophore and distinct C2- and C6-appended saccha-rides).28 To test the utility of this reaction in the context of MTM (Figure 2A), MTM (0.05 mmol) was initially reacted with a representative alkoxyamine (2.5 equivalents O-isobutylhydroxylamine HCl salt) in anhydrous methanol at room temperature in the dark. LC–MS revealed 90% conversion of MTM to two monooxime products in this pilot reaction. Subsequent isolation via preparative HPLC revealed the two products to be the corresponding 2′-(E)-oxime (Figure 2B, 7E; 44% isolated yield) and 2′-(Z)-oxime (Figure 2B, 7Z; 7% isolated yield); here, the E/Z assignments were based on comparative 1H NMR chemical shifts of the corresponding oxime α-protons (Figure S1).29 Based on computational modeling, reaction bias toward selective E-oxime formation likely derives from steric infringement by MTM C2-trisaccharide. Consistent with previously observed MTM instability at low pH,30 acid-catalyzed saccharide hydrolysis was observed in pilot scale-up reactions following the original oxime conjugation protocol. Subsequent reaction condition optimization revealed alkoxyamine free base in the presence of weak acid [v/v, 2% trifluoroacetic acid (TFA)] to eliminate the undesired hydrolysis of MTM while maintaining the oxime conjugation efficiency.
Figure 2.
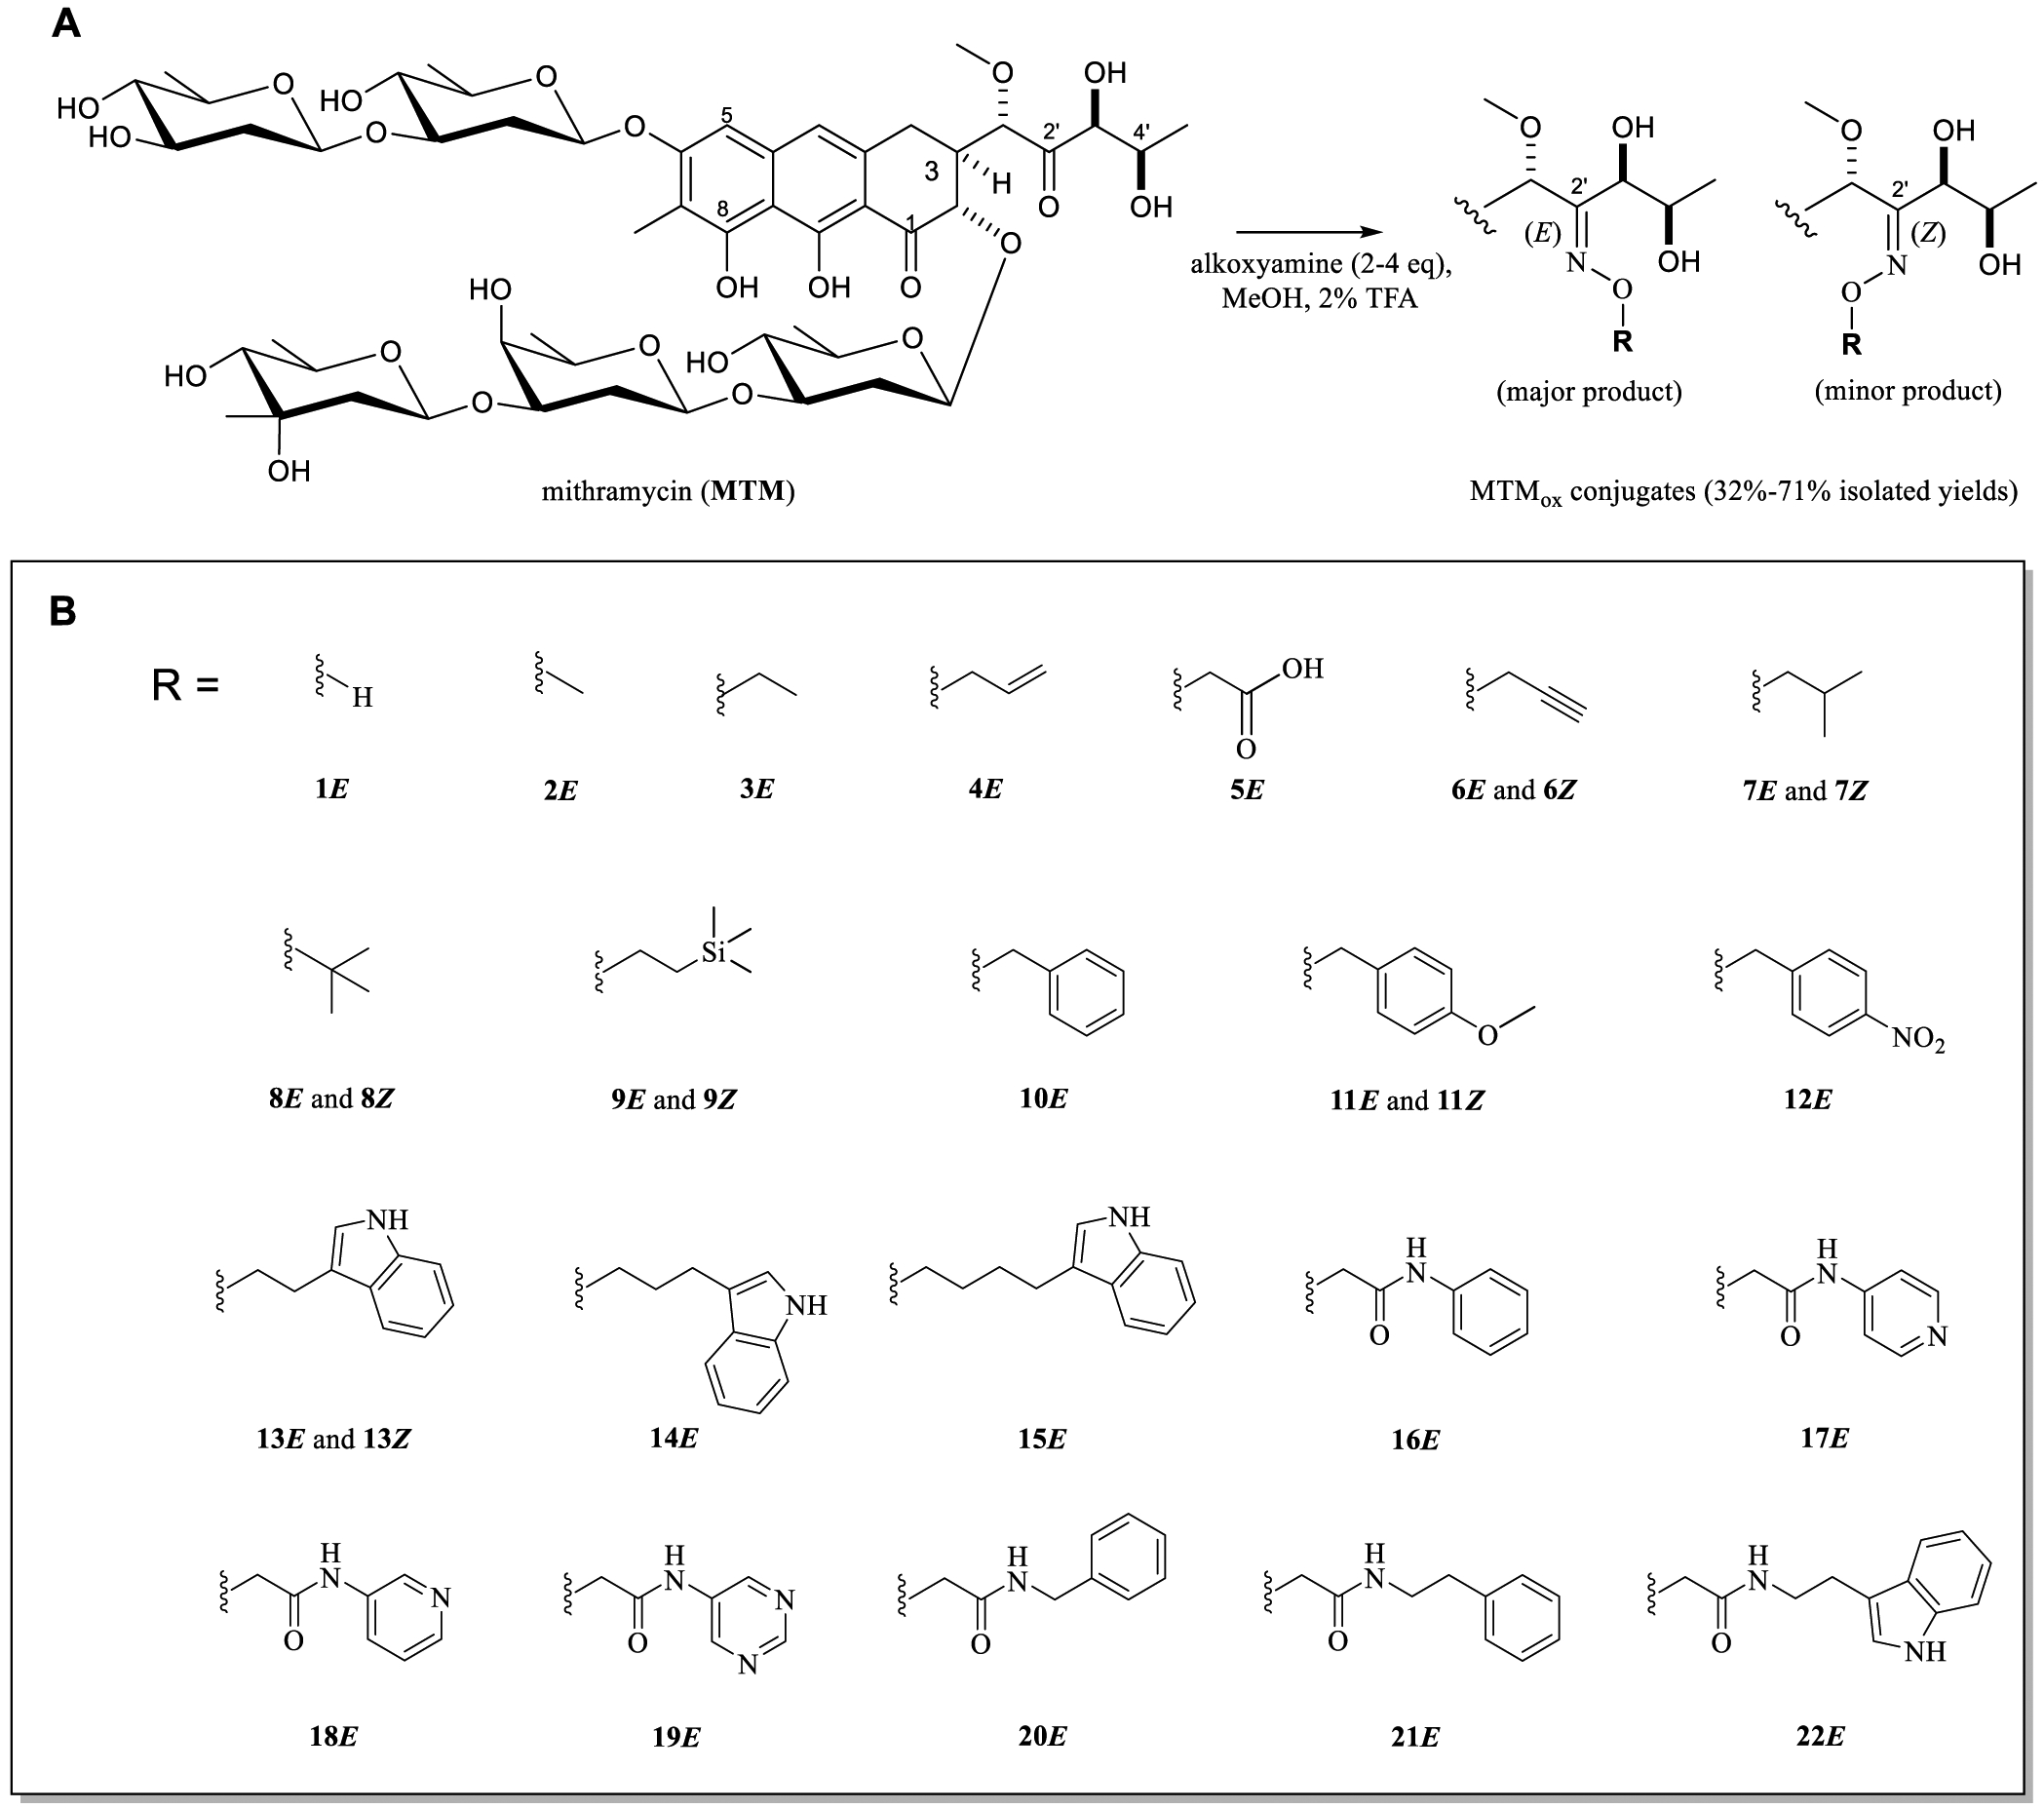
Initial set of MTMox conjugates for SAR studies. (A) MTMox conjugation reaction scheme (2–4 equiv alkoxyamine, 2% v/v TFA, anhydrous MeOH, room temperature, dark, 16–48 h). (B) Initial set of MTMox conjugates evaluated in differential cytotoxicity assays (Table 1). For all conjugates, the major reaction product (E isomer, designated with “E” compound numbering) was isolated and tested. For some analogues, the minor reaction product (Z isomer, designated with “Z” compound numbering) was also evaluated.
Synthesis of MTMox Conjugates and Preliminary Structure–Activity Relationship.
With suitable precursors and a validated synthetic protocol in hand, an initial set of 28 structurally diverse MTMox conjugates was subsequently synthesized to assess the impact of MTM C2′-oxime conjugation on bioactivity (Figure 2B). Preliminary bioactivity evaluation relied on the determination of differential cytotoxicity in two representative cancer cell lines, TC32 Ewing sarcoma and PC3 prostate (Table 1). The TC32 cells were chosen as they express the prototypical ETS fusion, EWS-FLI1 type I, which is prevalent in the Ewing sarcoma tumors.31 PC3 cells were chosen because they lack ETS fusions. Additionally, both cell lines were previously used to assess the preliminary structure–activity relationship (SAR) in our studies with MTM SA analogues.26
Table 1.
Cytotoxicity (GI50) of MTM and MTMox1E-22E in TC32 and PC3 Cell Lines
| compound | TC32 | PC3 | selectivity ratioa | ||
|---|---|---|---|---|---|
| GI50 (nM) | 95% CI (nM) | GI50 (nM) |
95% CIb (nM) |
||
| MTM26 | 32 | 26–38 | 83 | 62–112 | 2.6 |
| MTMox1E | 231 | 210–253 | 518 | 412–669 | 2.2 |
| MTMox2E | 86 | 62–119 | 226 | 195–266 | 2.6 |
| MTMox3E | 44 | 32–61 | 114 | 87–151 | 2.6 |
| MTMox4E | 116 | 73–184 | 155 | 91–264 | 1.3 |
| MTMox5E | 1149 | 1020–1300 | 1814 | 1542–2203 | 1.6 |
| MTMox6E | 37 | 26–53 | 78 | 61–99 | 2.1 |
| MTMox6Z | 127 | 90–179 | 345 | 236–508 | 2.7 |
| MTMox7E | 84 | 60–116 | 102 | 88–121 | 1.2 |
| MTMox7Z | 583 | 522–671 | 1369 | 1002–1888 | 2.3 |
| MTMox8E | 67 | 47–95 | 122 | 96–160 | 1.8 |
| MTMox8Z | 416 | 298–582 | 839 | 531–1343 | 2.0 |
| MTMox9E | 620 | 541–707 | 618 | 401–956 | 1.0 |
| MTMox9Z | 2019 | 1440–2865 | 1795 | 1578–2042 | 0.9 |
| MTMox10E | 117 | 106–129 | 120 | 103–144 | 1.0 |
| MTMox11E | 28 | 26–31 | 57 | 48–67 | 2.0 |
| MTMox11Z | 281 | 263–299 | 685 | 455–1041 | 2.4 |
| MTMox12E | 75 | 46–122 | 113 | 72–178 | 1.5 |
| MTMox13E | 32 | 24–43 | 53 | 35–79 | 1.70 |
| MTMox13Z | 547 | 515–580 | 1072 | 674–1728 | 2.0 |
| MTMox14E | 59 | 51–69 | 69 | 40–121 | 1.2 |
| MTMox15E | 60 | 51–69 | 140 | 113–174 | 2.3 |
| MTMox16E | 36 | 24–56 | 55 | 45–66 | 1.5 |
| MTMox17E | 81 | 53–124 | 201 | 174–231 | 2.5 |
| MTMox18E | 77 | 68–86 | 185 | 143–236 | 2.4 |
| MTMox19E | 361 | 302–439 | 985 | 591–1669 | 2.7 |
| MTMox20E | 115 | 89–153 | 292 | 249–349 | 2.5 |
| MTMox21E | 243 | 193–393 | 580 | 341–985 | 2.4 |
| MTMox22E | 189 | 171–209 | 1028 | 857–1292 | 5.4 |
Ratio of PC3/TC32 GI50 estimates.
CI, confidence interval.
As the baseline comparator in this assay, the parent drug MTM displayed potent cytotoxicity toward both cell lines with a PC3 to TC32 GI50 ratio of 2.6 (Table 1). Similar assessment of the preliminary MTMox conjugate set revealed the following general SAR trends. First, comparison of available E and Z isomeric sets (6E/6Z, 7E/7Z, 8E/8Z, 9E/9Z, 11E/11Z, and 13E/13Z) revealed that E isomers notably outperformed Z isomers in all cases with Z/E TC32 GI50 ratios ranging from 3 (6Z/6E) to 17 (13Z/13E). Second, MTMox conjugates bearing diverse hydrophobic side chains of increasing size (e.g., 3E, 6E, 11E, and 13E), including those bearing amide tethers (16E), retained the relative potencies and selectivities of the parent drug MTM. Consistent with this, only modest variations in bioactivity were observed by altering aliphatic chain length (e.g., 2E, 3E, 4E, and 6E) or extending the length of aromatic tether (13E, 14E, and 15E; 16E, 20E, and 21E). Third, increasing charge (5E, with GI50 values reminiscent, e.g., of free acid MTM SA26), electronegativity (e.g., 16E vs 17E, 18E, and 19E) or steric bulk (9E) were detrimental to bioactivity. Finally, among the initial 28 MTMox analogues tested, the extended indole conjugate 22E was found to display a ~2-fold improvement in selectivity compared to MTM (based on the PC3-to-TC32 GI50 ratio). This observed altered selectivity of 22E is reminiscent of the previously reported MTM SA-substituted indole and Trp methyl ester conjugates with similarly improved MTM SA selectivity in ETS-dependent cell lines.26 This suggests that MTMox conjugates may serve as suitable MTM SA conjugate mimetics, a clear advantage of which is the starting material employed for production. Namely, MTM is a commercially available approved drug while MTM SA is a shunt metabolite produced in moderate yield via fermentation requiring subsequent multistep purification.32
The previously published MTM SA conjugate study revealed that EWS-FLI1 selectivity could be further improved via amide conjugation with l-Phe methyl ester, l-Phe–l-Trp methyl ester, and l-Trp–l-Trp methyl ester.26 Thus, a set of 13 select amino acid and dipeptide-based MTMox conjugates were synthesized (Figure 3) to further assess the feasibility of MTMox conjugates to serve as MTM SA conjugate mimetics. The syntheses for noncommercial alkoxyamine precursors for this latter set of MTMox analogues are outlined in Scheme 1. The preliminary bioactivity evaluation of amino acid and dipeptide-based MTMox conjugates also employed the previously described TC32 Ewing sarcoma and PC3 prostate cell line differential cytotoxicity strategy (Table 2). This assessment enabled the following observations. Among the single amino acid MTMox conjugates, the l-Phe (23E) and l-Trp (25E) methyl ester analogues were the most potent. In contrast, Trp indole N-methylation (26E), corresponding d-amino acid comparators (e.g., 24E, the comparator to 23E), or corresponding free acids (e.g., 27E, the free acid of 26E; 28E, the free acid of 25E) were detrimental to potency. Interestingly, 24E also displayed poor selectivity (PC3 to TC32 GI50 ratio of 2.1) compared to the l-amino acid and dipeptide analogues tested. Among the dipeptide MTMox conjugates, the l-Phe-l-Trp methyl ester analogue 32E was the most potent and the most selective (PC3 to TC32 GI50 ratio of 10). Inversion of the dipeptide (l-Trp-l-Phe 30E, PC3 to TC32 GI50 ratio of 6) led to slight reductions in potency and selectivity compared to those of 32E, and inclusion of a d-amino acid (e.g., 31E) led to a further reduction in selectivity (PC3 to TC32 GI50 ratio of 2.1). In addition, substitution with l-Ala at the first or second position of the dipeptide (e.g., 34E and 35E) and a dipeptide composed of l-Phe-l-Phe (33E) led to notable reductions in potency. Importantly, the SAR trends observed among amino acid and dipeptide-based MTMox analogues generally mirrored that observed with corresponding MTM SA conjugates, lending further support to MTMox conjugates as potential MTM SA conjugate mimetics. Within this context, the extended C3 side chain of MTM SA and MTMox analogues with selective cytotoxicity against EWS-ETS fusion-dependent tumors are postulated to uniquely infringe on and/or alter EWS-FLI1 binding (Figure 4).27
Figure 3.
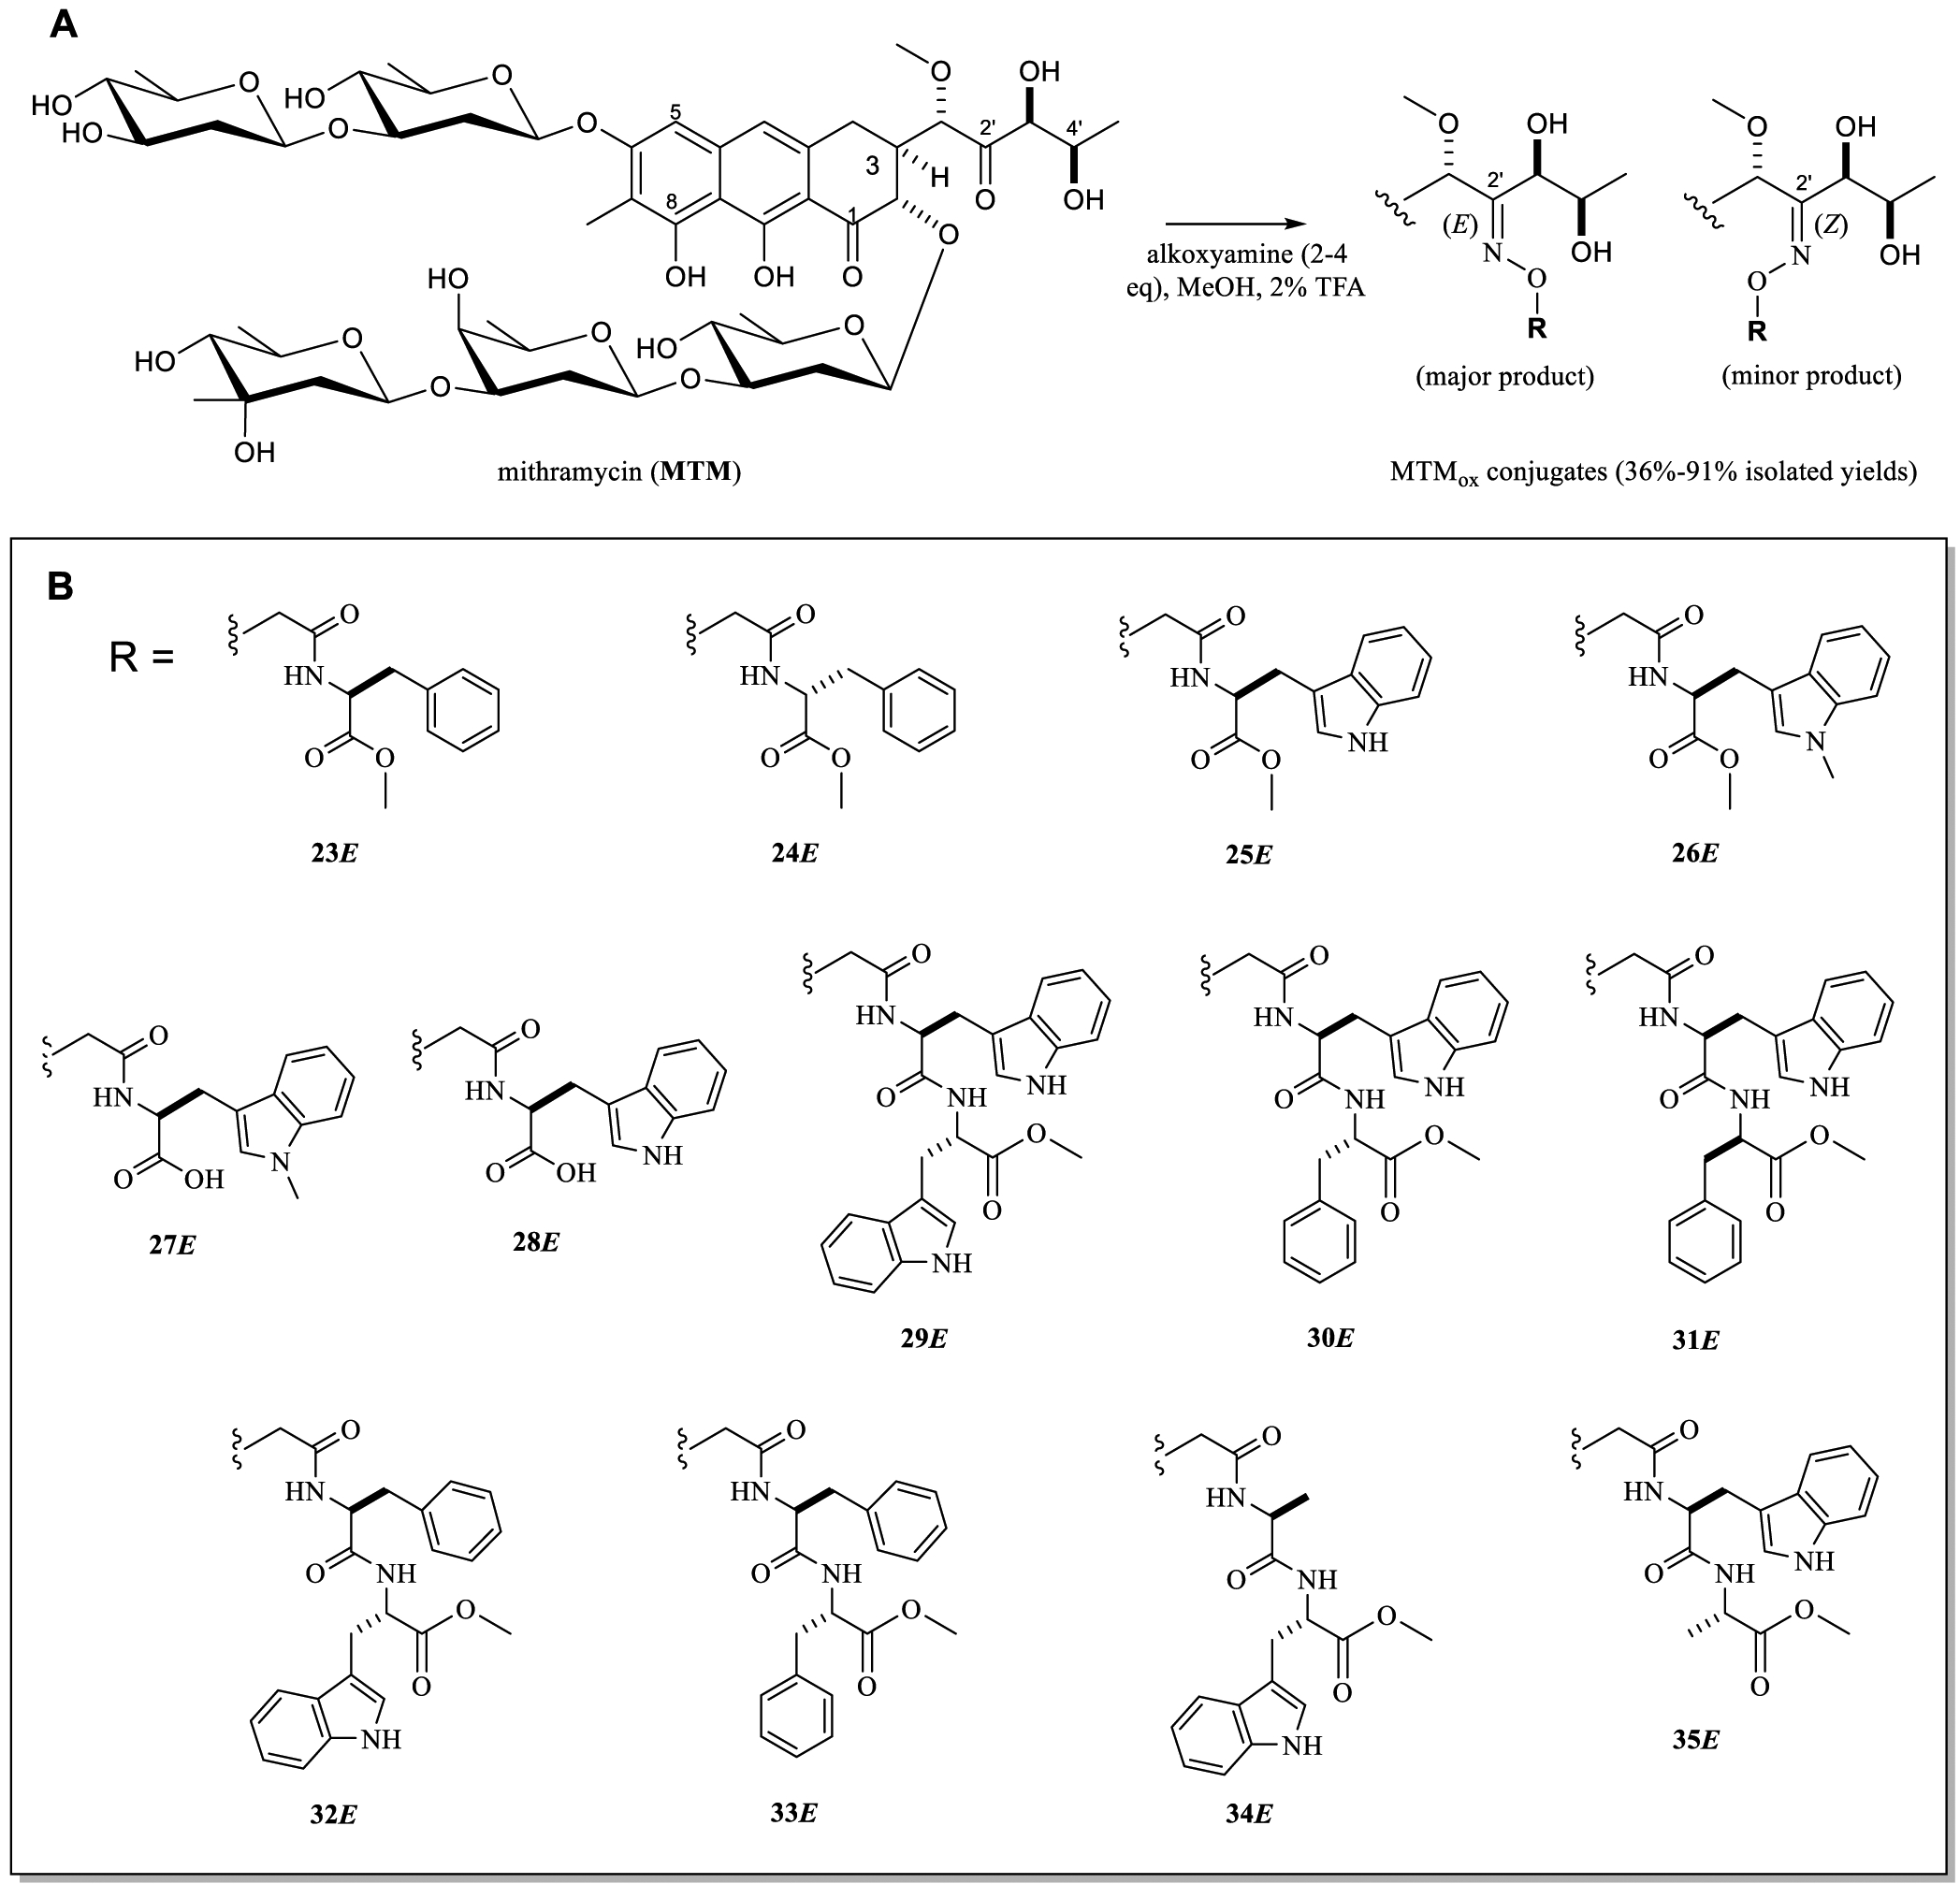
Amino acid and peptide MTMox conjugates for SAR studies. (A) MTMox conjugation reaction scheme (2–4 equiv alkoxyamine, 2% v/v TFA, anhydrous MeOH, room temperature, dark, 16–48 h). (B) Corresponding MTMox conjugates evaluated in differential cytotoxicity assays. For all conjugates, the major reaction product (E isomer, designated with “E” compound numbering) was isolated and tested. For MTMox16E-35E, the syntheses of their corresponding noncommercial alkoxyamine precursors (overall yields of 25–81%) are highlighted in Scheme 1.
Scheme 1.
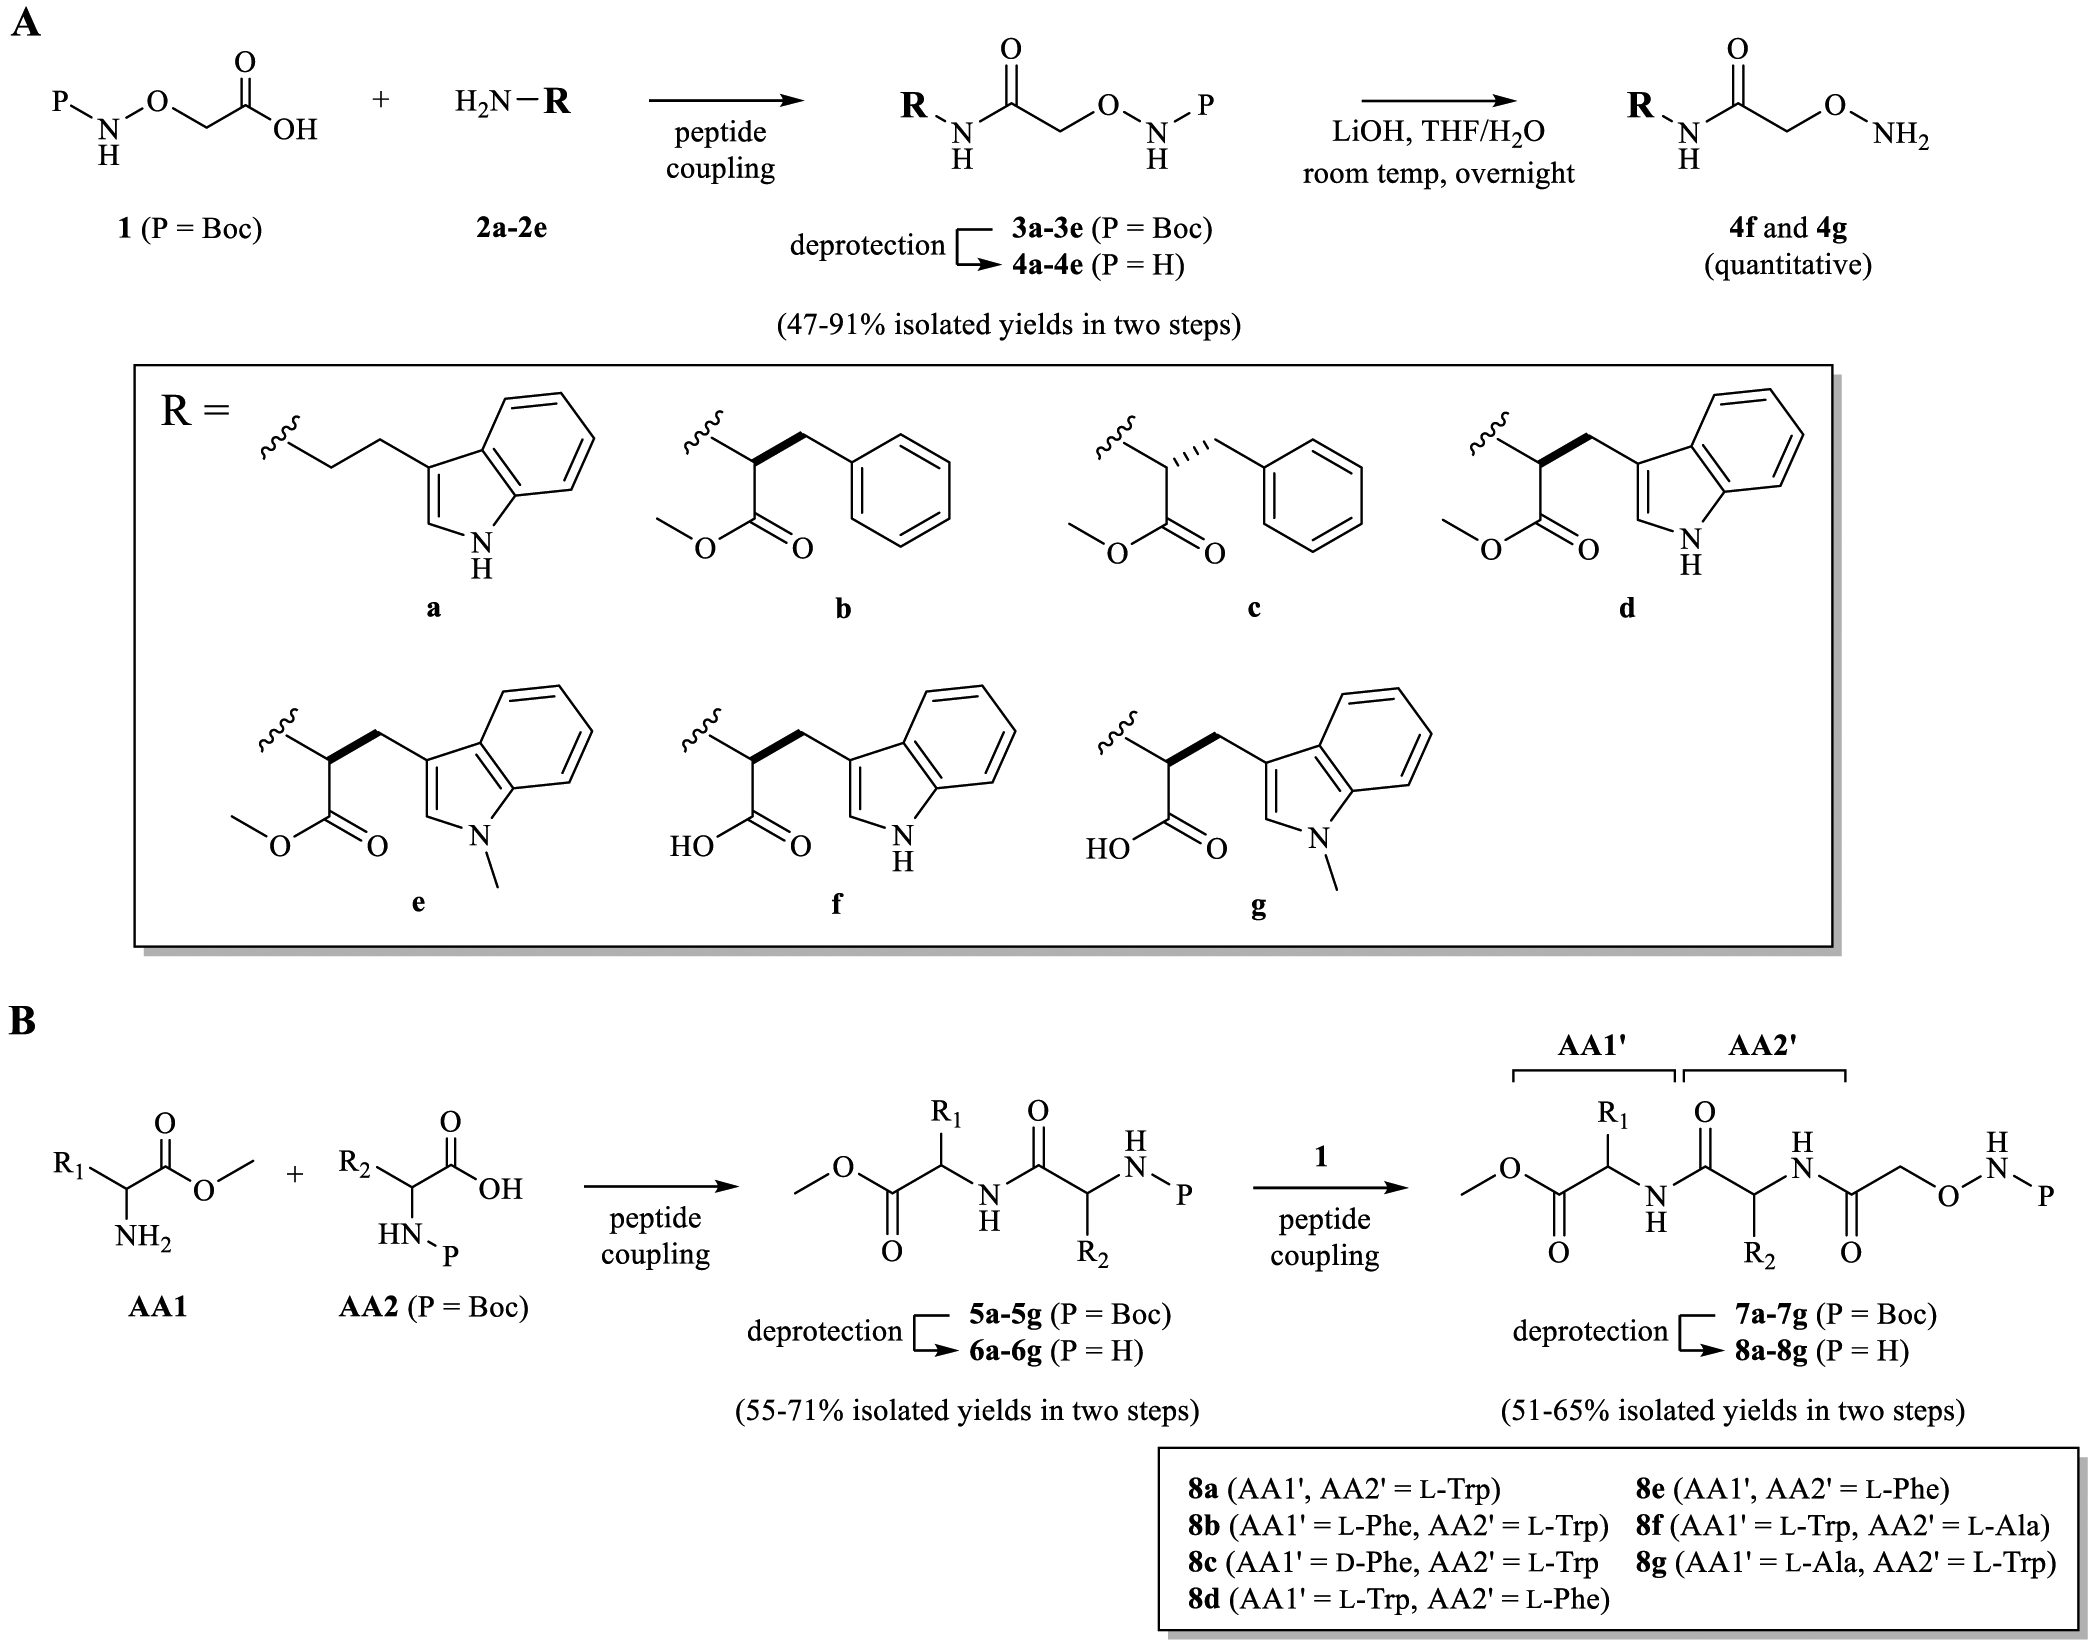
Synthetic Strategy for Noncommercial Alkoxyamine Precursors of MTMox22E-35E; (A) 4a–4e; (B) 8a–8g
Table 2.
Cytotoxicity (GI50) of MTMox23E-35E in TC32 and PC3 Cell Lines
| compound | TC32 | PC3 | selectivity ratiob | ||
|---|---|---|---|---|---|
| GI50 (nM) | 95% CI (nM) | GI50 (nM) | 95% CIc (nM) | ||
| MTMox23E | 63 | 58–69 | 381 | 316–473 | 6.0 |
| MTMox24E | 279 | 208–464 | 579 | 465–711 | 2.1 |
| MTMox25E | 92 | 82–102 | 450 | 358–572 | 4.9 |
| MTMox26E | 126 | 119–133 | 703 | 613–798 | 5.6 |
| MTMox27E | a | a | a | ||
| MTMox28E | 1346 | 740–2588 | a | a | |
| MTMox29E | 116 | 109–124 | 555 | 438–685 | 4.8 |
| MTMox30E | 123 | 96–158 | 744 | 622–885 | 6.0 |
| MTMox31E | 116 | 113–119 | 258 | 153–435 | 2.2 |
| MTMox32E | 79 | 58–107 | 787 | 499–1255 | 10.0 |
| MTMox33E | 355 | 327–390 | a | a | |
| MTMox34E | 450 | 412–493 | 2134 | 1880–2455 | 4.7 |
| MTMox35E | 313 | 282–349 | 2086 | 1540–2824 | 6.7 |
GI50 > 10 μM, CI not estimated, selectivity ratio not determined.
Ratio of PC3/TC32 GI50 estimates.
CI, confidence interval.
Figure 4.
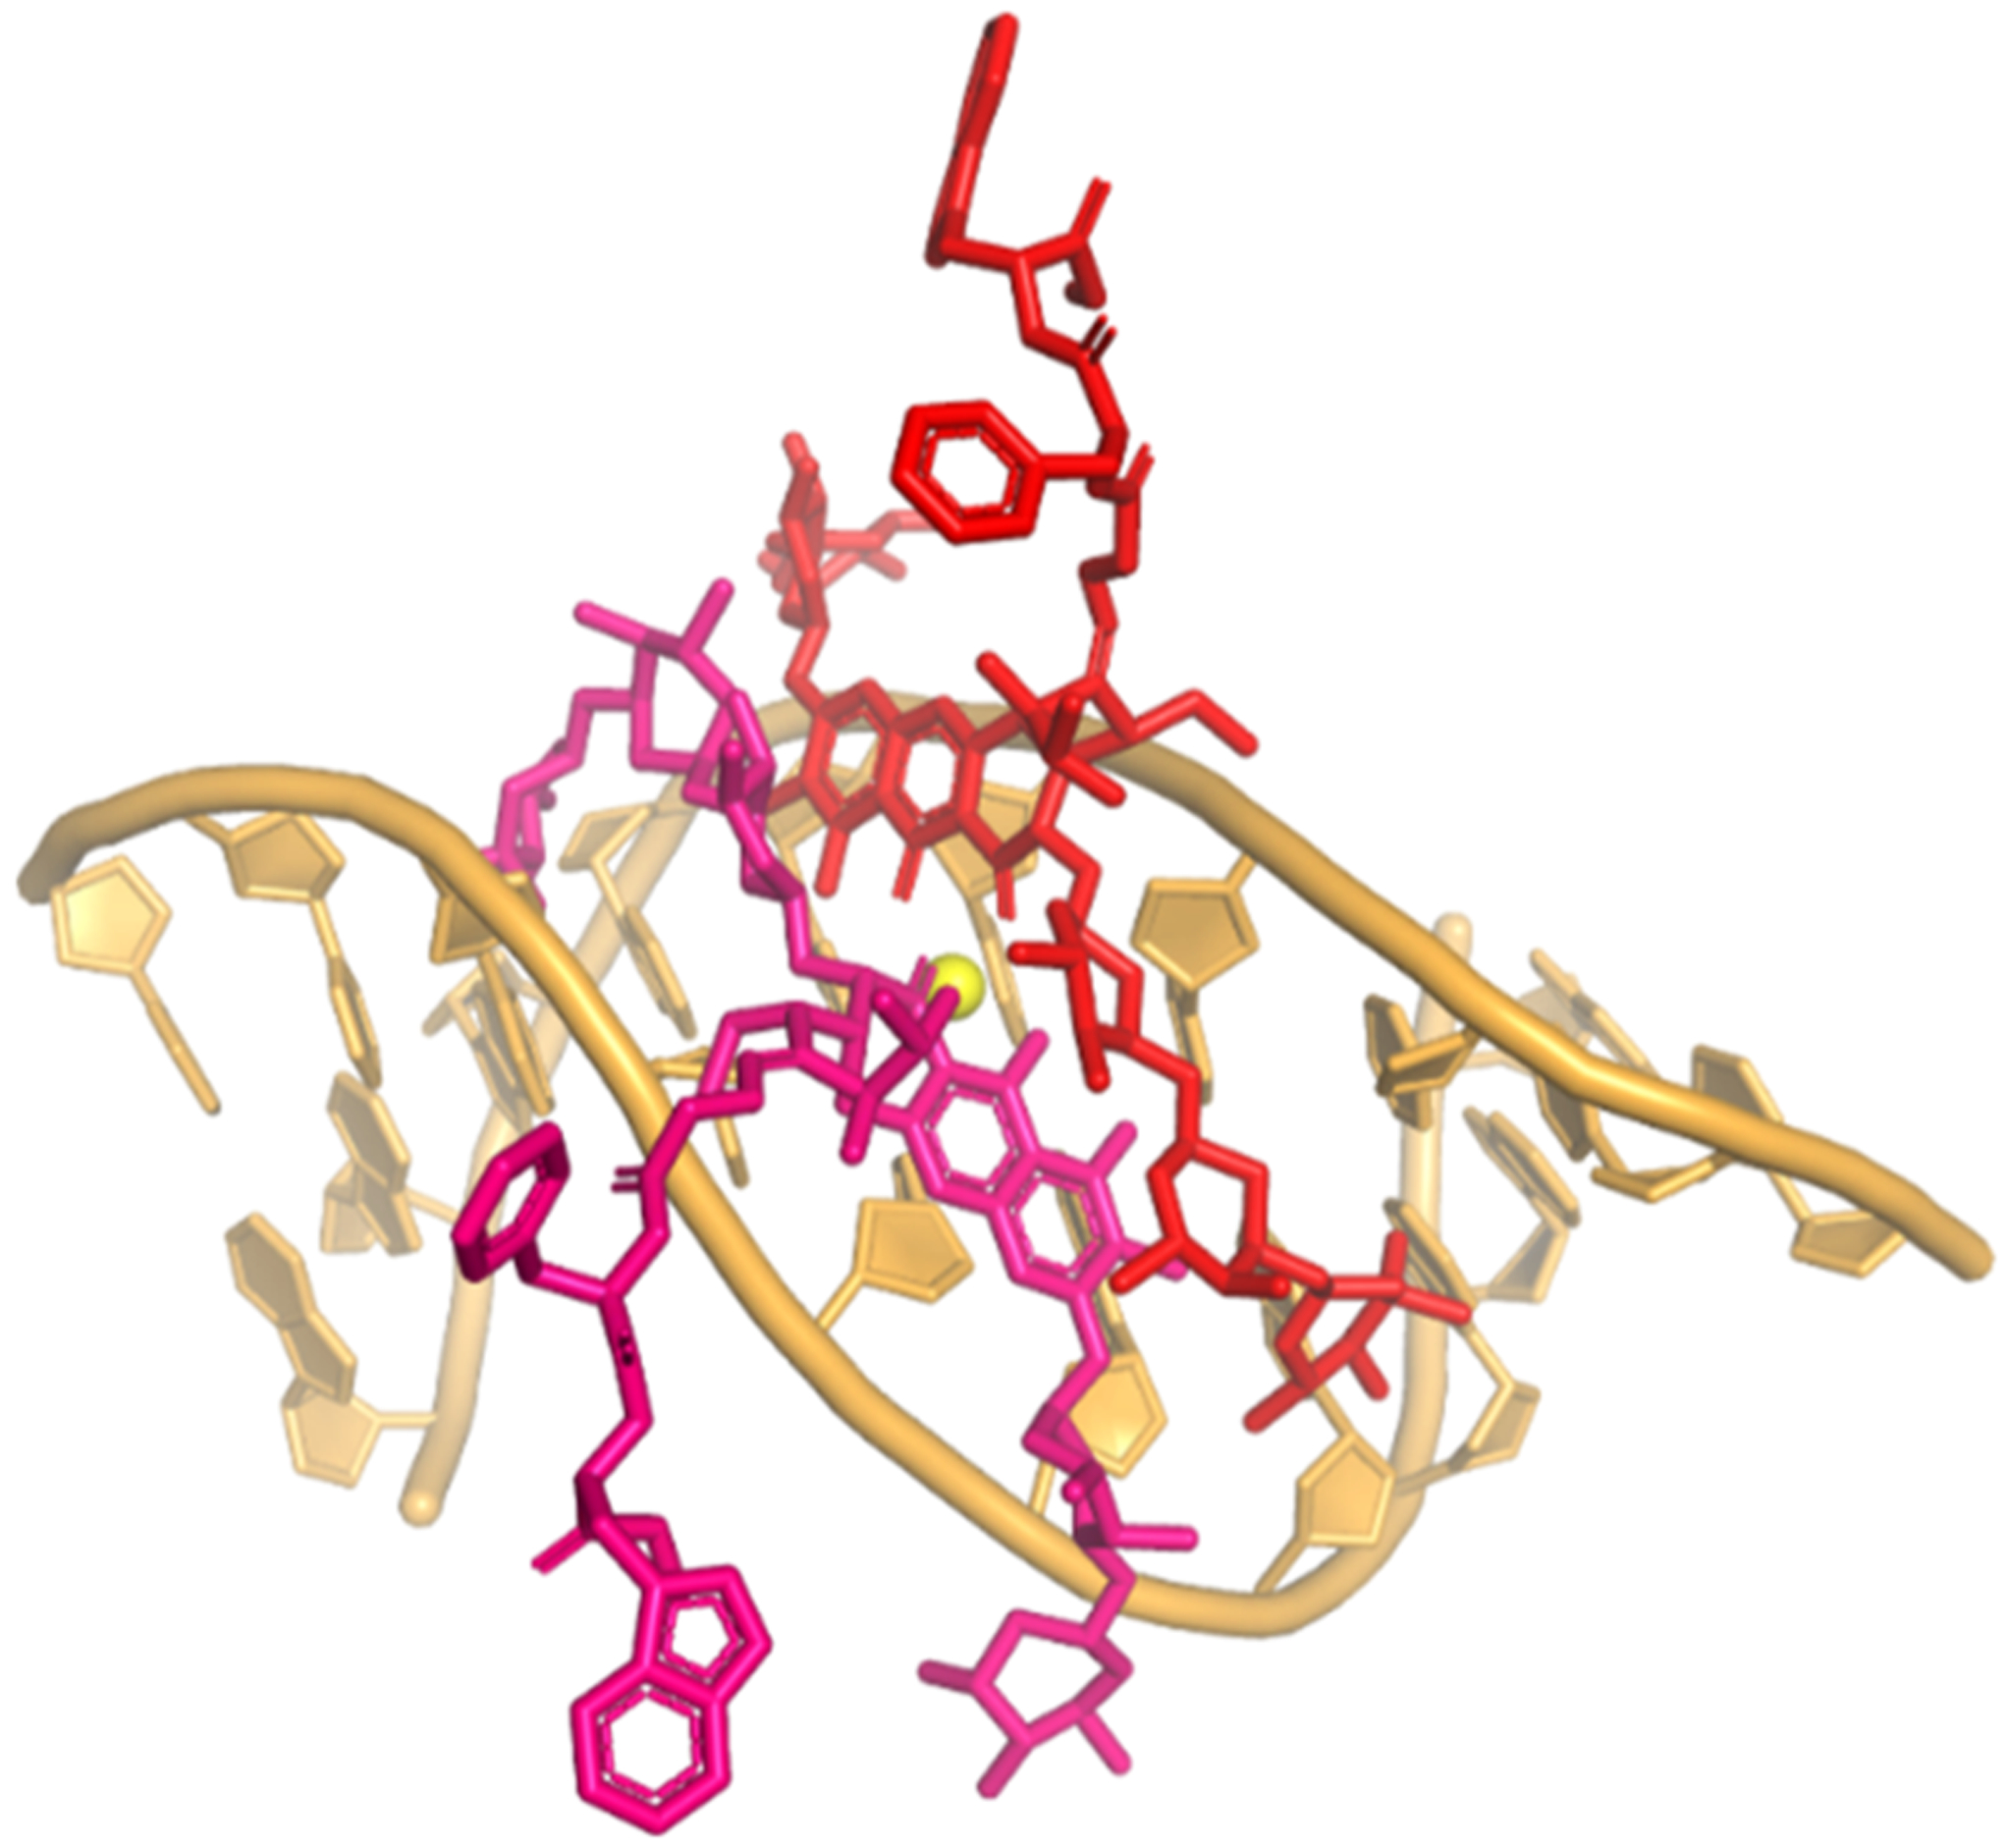
Model of MTMox32E in complex with DNA. The conformation of the (MTMox32E)2-Mg2+ -DNA dimer was modeled based on the crystal structure of the (MTM SA-Trp)2-Zn2+-DNA complex (PDB ID: 5JVW).27 The 3-side chain is in an extended, unhindered conformation. The two MTMox32E structures in red are coordinated by a Mg2+ ion (the yellow ball).
Validation Studies Using a Broader Panel of ETS Fusion-Dependent and Non-ETS Fusion Cell Lines and Molecular Assays.
Following the initial in vitro evaluation of all analogues in TC32 and PC3 cells, we assessed whether selectivity was observed in larger panels of Ewing and non-Ewing sarcoma cell lines. In this screen, we chose all analogues with PC3 to TC32 GI50 ratio >3.0 to assess whether the preliminary observed selectivity held across a larger panel of cell lines. Eight additional ETS fusion-dependent cell lines (TC71, 5838, RDES, ES8, ES2, ES7, and A673 Ewing sarcoma cells) and the VCaP prostate cancer cell line, which expresses TMPRSS2-ERG were used for this broader assessment (Tables S2 and S3).33 For comparison, cytotoxicity studies were also conducted in nine cell lines that did not harbor ETS fusion. These included DU145 and LNCaP prostate cancer cells, HCT116 colon carcinoma, PANC-1 pancreatic cancer, U118 MG glioma, HeLa cervical cancer, A549 nonsmall cell lung cancer, DMS114 small cell lung cancer, and HepG2 carcinoma lines (Tables S4 and S5). Individual and median GI50 values for the ETS fusion-dependent and non-ETS fusion expressing cell lines are illustrated on the left (red) and right (blue) set of data for each compound in Figure 5. All cell lines were exposed to diluent and compound concentrations of 0.3–10,000 nM. The selectivity ratio estimated from the median GI50 values obtained for each analogue is also indicated along the x-axis (see also Table S6). Values at 10,000 nM (Figure 5) indicate inactivity in select cell lines and were included to estimate the median GI50. This analysis demonstrated broad selectivity among analogues with phenylalanine and tryptophan amino acid substitutions. MTMox32E was selected for additional studies based on its GI50 of ~80 nM in the TC32 cell line, which harbors the most prevalent ETS fusion (EWS-FLI1, type I), and a median GI50 of 345 nM across all ETS fusion sarcoma panel cell lines (Table S6, selectivity ratio 4.6).
Figure 5.
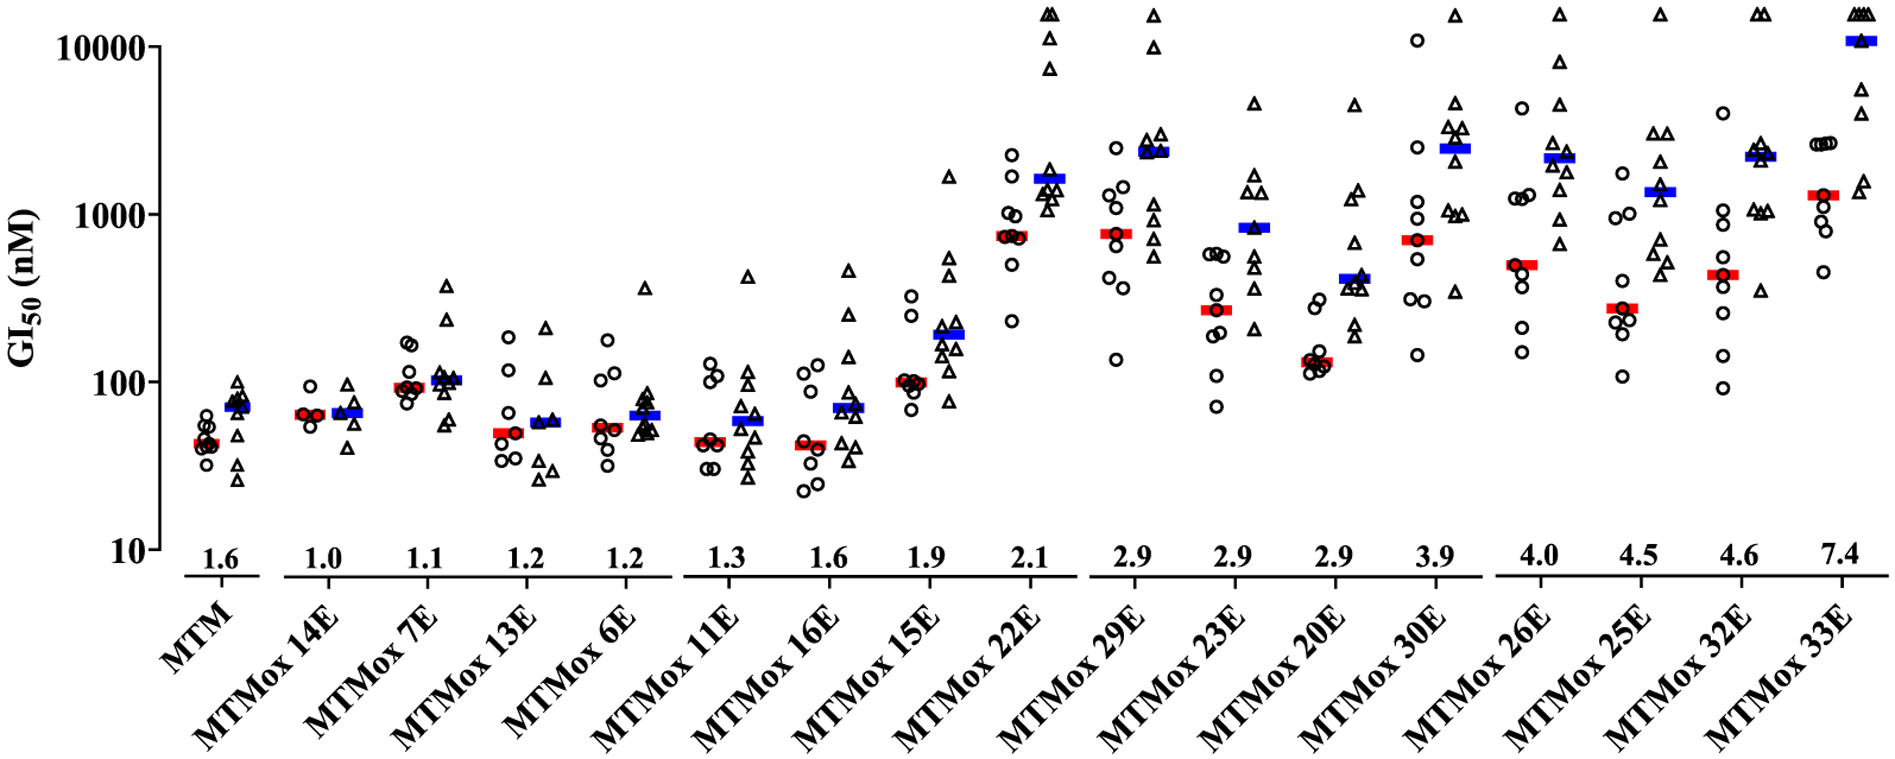
MTMox analogues with aromatic substitutions display increased cytotoxicity in ETS fusion-dependent cell lines. Median GI50 in ETS fusion-dependent (circles) and non-ETS fusion (triangles) cell lines (n = 4–9 cell lines per compound). Symbols represent the mean GI50 of each cell line. Numbers adjacent to the x-axis represent the selectivity ratio calculated based on the median GI50 (bars) ratio of the non-ETS/ETS fusion values.
To determine whether MTMox32E interferes with the transcriptional activity of EWS-FLI1, we used a previously described cell line which expresses Gaussia-luciferase under the control of NR0B1 promoter.26 Cells were incubated with increasing concentrations of MTMox32E or MTM for 12 h, and a control cell line expressing luciferase under the influence of the CMV promoter was used to evaluate nonspecific interaction. As illustrated in Figure 6, both MTMox32E and MTM potently inhibited NR0B1-mediated luciferase expression. The estimated MTMox32E EC50 (95% confidence interval) was 57 nM (19–168 nM). This was comparable to the effect of MTM treatment, which had an estimated EC50 of 68 nM (28–170 nM). In contrast, the EC50 of MTMox32E and MTM in the CMV promoter-controlled cell line (Figure 6A) were 593 nM (54–9269 nM) and 748 nM (419–1433 nM), respectively. These results agree with a previous study by Grohar et al. reporting the EC50 of MTM in a similar reporter cell line being 5–100 nM but had no effect on cells expressing luciferase under the control of a CMV promoter.16
Figure 6.
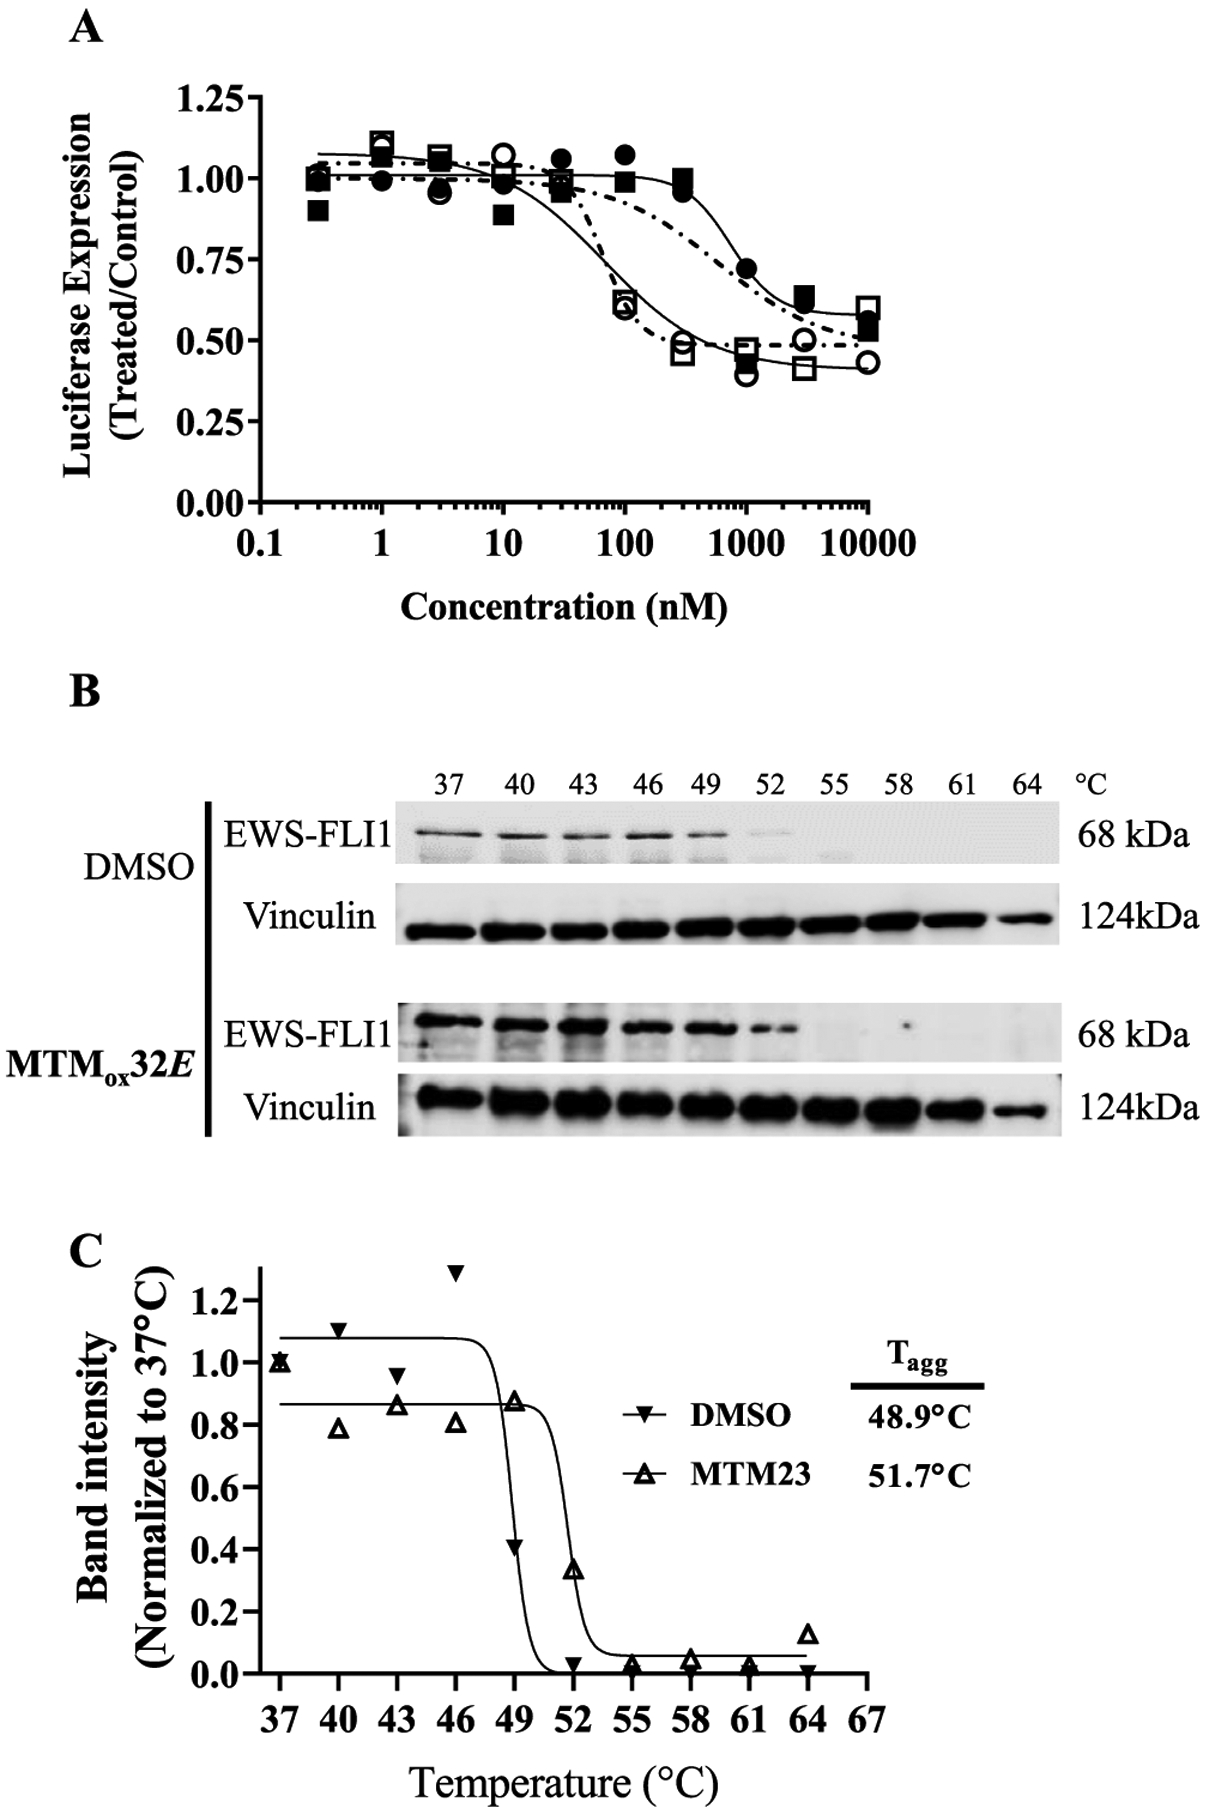
MTMox32E potently inhibits EWS-FLI1 transcriptional activity by physically interacting with EWS-FLI1. Effect of MTMox32E (□) and MTM (○) on luciferase expression driven by the full-length NR0B1 promoter harboring EWS-FLI1-binding elements, and effect of MTMox32E (■) and MTM (●) on luciferase expression driven by the CVM promoter (A). CETSA assay assessed the stability of EWS-FLI1 by western blot following treatment with diluent (0.01% DMSO) or MTMox32E (B). Band analysis and nonlinear fitting was used to estimate the aggregation temperature (Tagg) for DMSO (▼) and MTMox32E (Δ) treatments (C).
We next sought to extend our findings and determine whether MTMox32E physically interacts with EWS-FLI1 in TC32 cells using the cellular thermal shift assay (CETSA).34 Following 6 h incubation with diluent (0.01% DMSO) or 10 μM MTMox32E, cell lysates were aliquoted and incubated at increasing temperatures before being subjected to western blotting for EWS-FLI1 (Figure 6B). The estimated Tagg of untreated cells (0.01 DMSO) was 48.9 °C while that of MTMox32E-treated cells was estimated to be 51.7 °C (Figure 6C). The increased stability of EWS-FLI1 observed with MTMox32E is consistent with direct binding or interaction with the transcription factor,34 as predicted by the computational structural model (Figure 4). Our previous solution NMR study demonstrated that MTM and its SA analogues do not interact with the DNA-binding domain of FLI1 in the absence of DNA.27 Therefore, the observed MTMox32E-EWS-FLI1 interaction likely occurs when both EWS-FLI1 and MTMox32E are bound to DNA.
Effect of MTMox32E Treatment on EWS-FLI1 and Sp1 mRNA and Protein Expression.
To investigate the effect of MTMox32E on disrupting the expression of EWS-FLI1 and Sp1-regulated genes, we then performed qRT-PCR and western blot analyses. We used TC32 cells because they express EWS-FLI1 and Sp1 and PC3 cells, which only express Sp1. MTM treatment was used for comparison. TC32 cells were treated with 30, 100, and 300 nM because these concentrations bracketed the 72 h GI50 reported in Table 1. Six hour incubation with MTMox32E and MTM decreased EWS-FL1 mRNA levels in a concentration-dependent manner and had the same effect on the downstream target gene, NR0B1 (Figure 7A,B). Additionally, MTMox32E and MTM inhibited the known target of MTM, Sp1, as well as VEGFA and BCL-2, which are known to be affected by Sp1 transcriptional activity (Figure 7A,B). PC3 cells were treated at the above concentrations and 1000 nM because this concentration bracketed the 72 h GI50 reported in Table 1 for MTMox32E. In contrast to the effects in TC32 cells, treatment of PC3 cells with either compound minimally affected Sp1, VEGFA, and BCL-2, with the exception of BCL-2, which was affected by MTM treatment at 300 and 1000 nM (Figure 7C,D). These results are in accord with the 10-fold selective cytotoxicity (Table 2) of MTMox32E in these two cell lines. However, the sensitivity of PC3 cells to MTM treatment (GI50, 83 nM) is not entirely consistent with its effect on Sp1, and it suggests that MTM may mediate its effect through other mechanisms.
Figure 7.
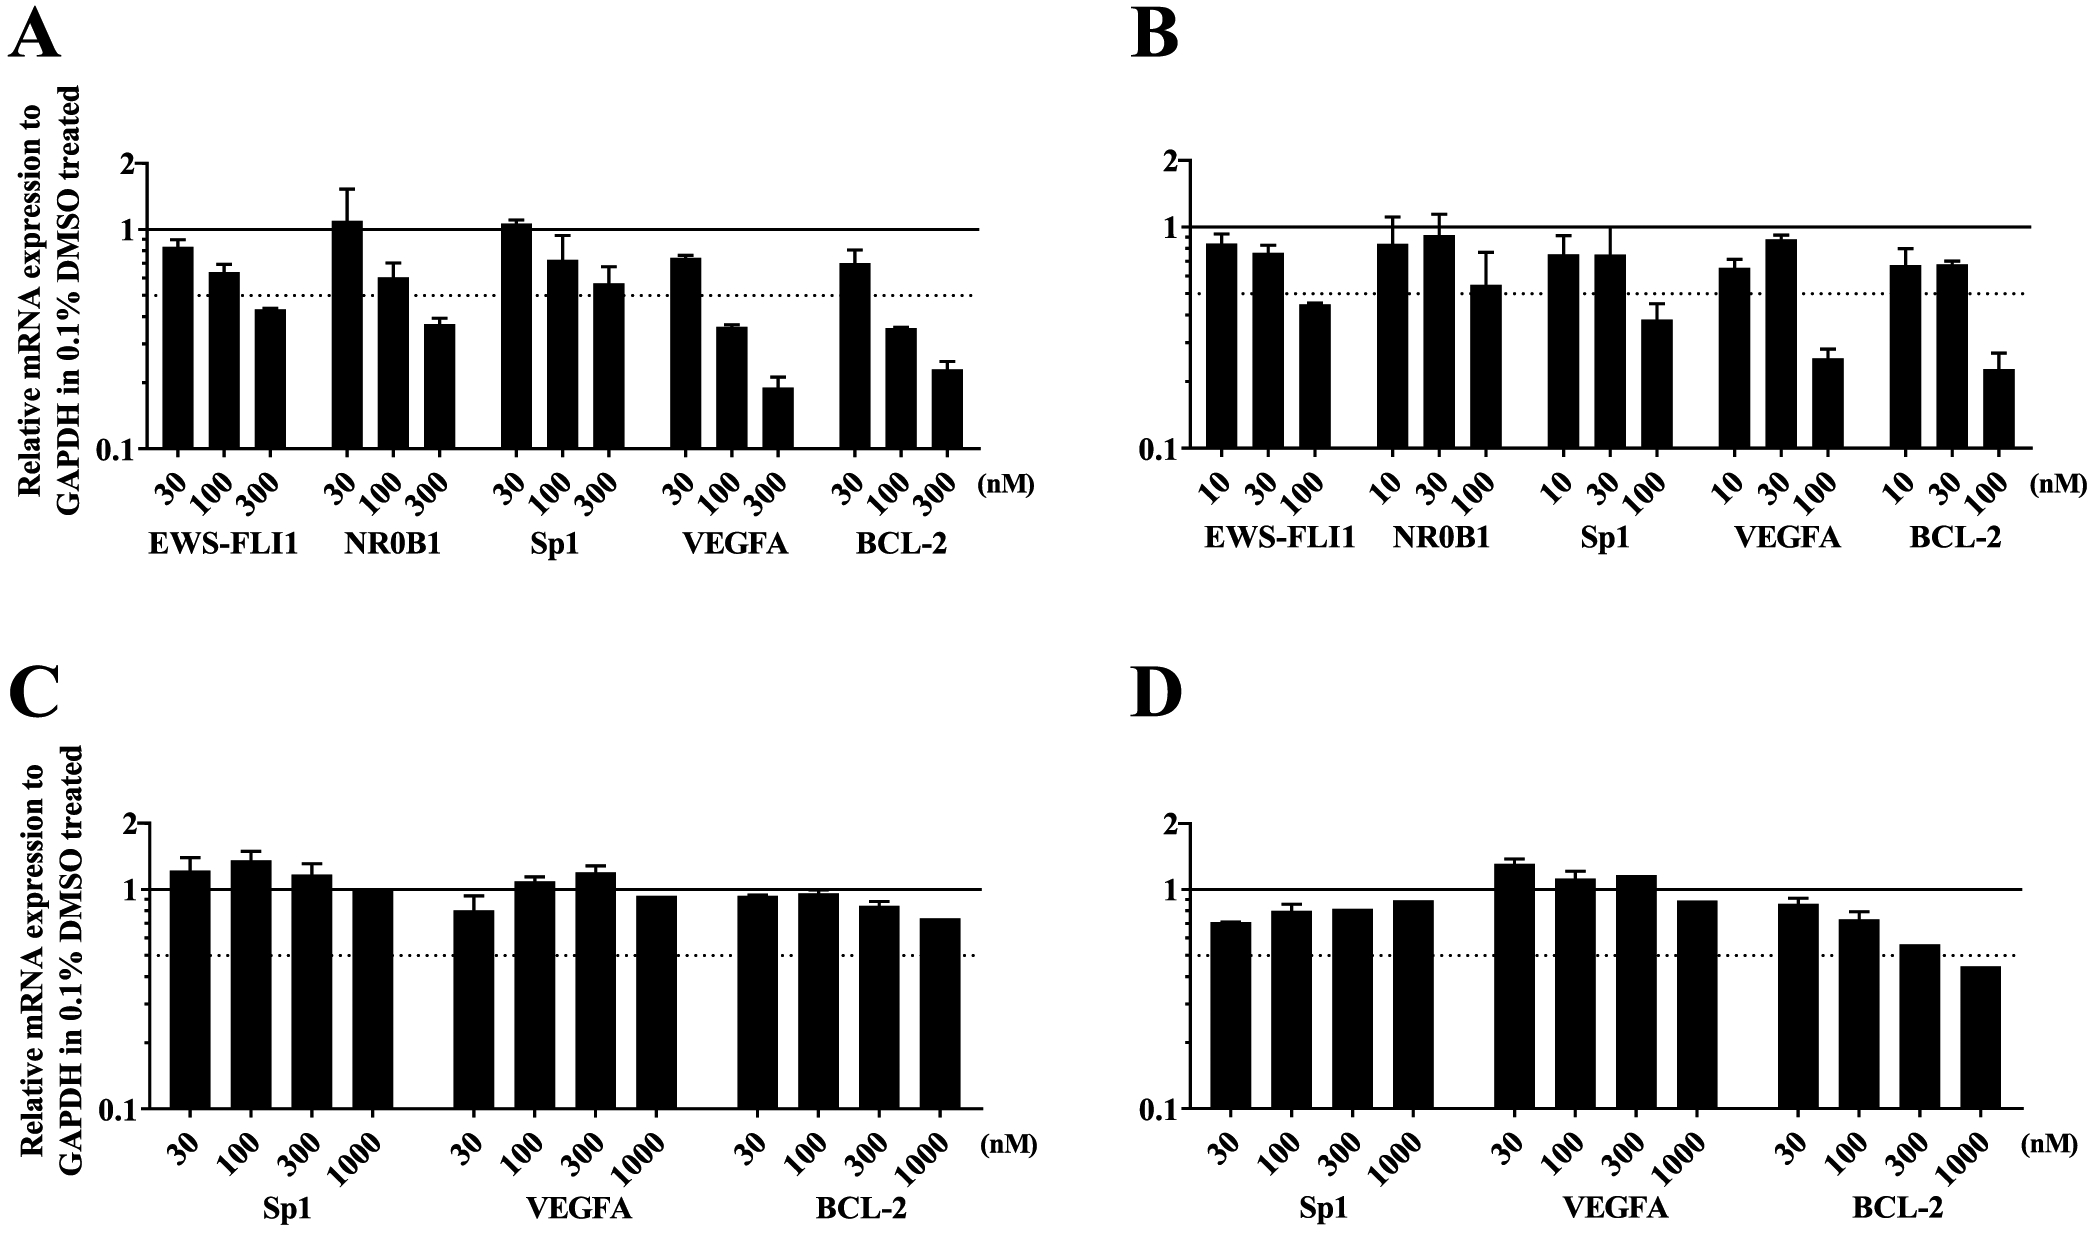
MTMox32E treatment inhibits EWS-FLI1 and Sp1 expression and transcriptional activity. Expression of EWS-FLI1, NR0B1, Sp1, VEGFA, and BCL-2 mRNA were evaluated in TC32 cells following 6 h treatment with increasing concentrations that bracketed the GI50 of (A) MTMox32E and (B) MTM. Expression of Sp1, VEGFA, and BCL-2 mRNA were evaluated in PC3 cells following 6 h treatment with increasing concentrations that bracketed the GI50 of (C) MTMox32E and (D) MTM. Error bars represent the SEM of at least two biological replicates.
The effect of MTMox32E and MTM on the protein expression of EWS-FLI1 and Sp1 as well as their target gene products, NR0B1 and VEGF, was also evaluated in TC32 cells following 24 h treatment with 0, 10, 30, and 300 nM concentrations (Figure 8). In contrast, to the mRNA results, treatment with MTMox32E did not affect the protein levels of EWS-FLI1 but greatly diminished the expression of NR0B1. Treatment also decreased expression of Sp1 and VEGF but to a lesser extent (Figure 8A,B). In comparison, the effect of MTM treatment (Figure 8A,C) was more pronounced on EWS-FL1 and NR0B1, but not as significant on Sp1 protein, and consistent with its transcriptional activity, VEGFA levels were also not diminished with treatment at this time point. It is possible that even though both MTM and MTMox32E downregulate EWS-FLI1 at the transcriptional level, MTMox32E (but not MTM) has a compensatory effect, for example, protecting EWS-FLI1 from degradation. This potential explanation is consistent with the observed thermal stabilization of EWS-FLI1 by MTMox32E (Figure 6) and the computational model (Figure 4).
Figure 8.
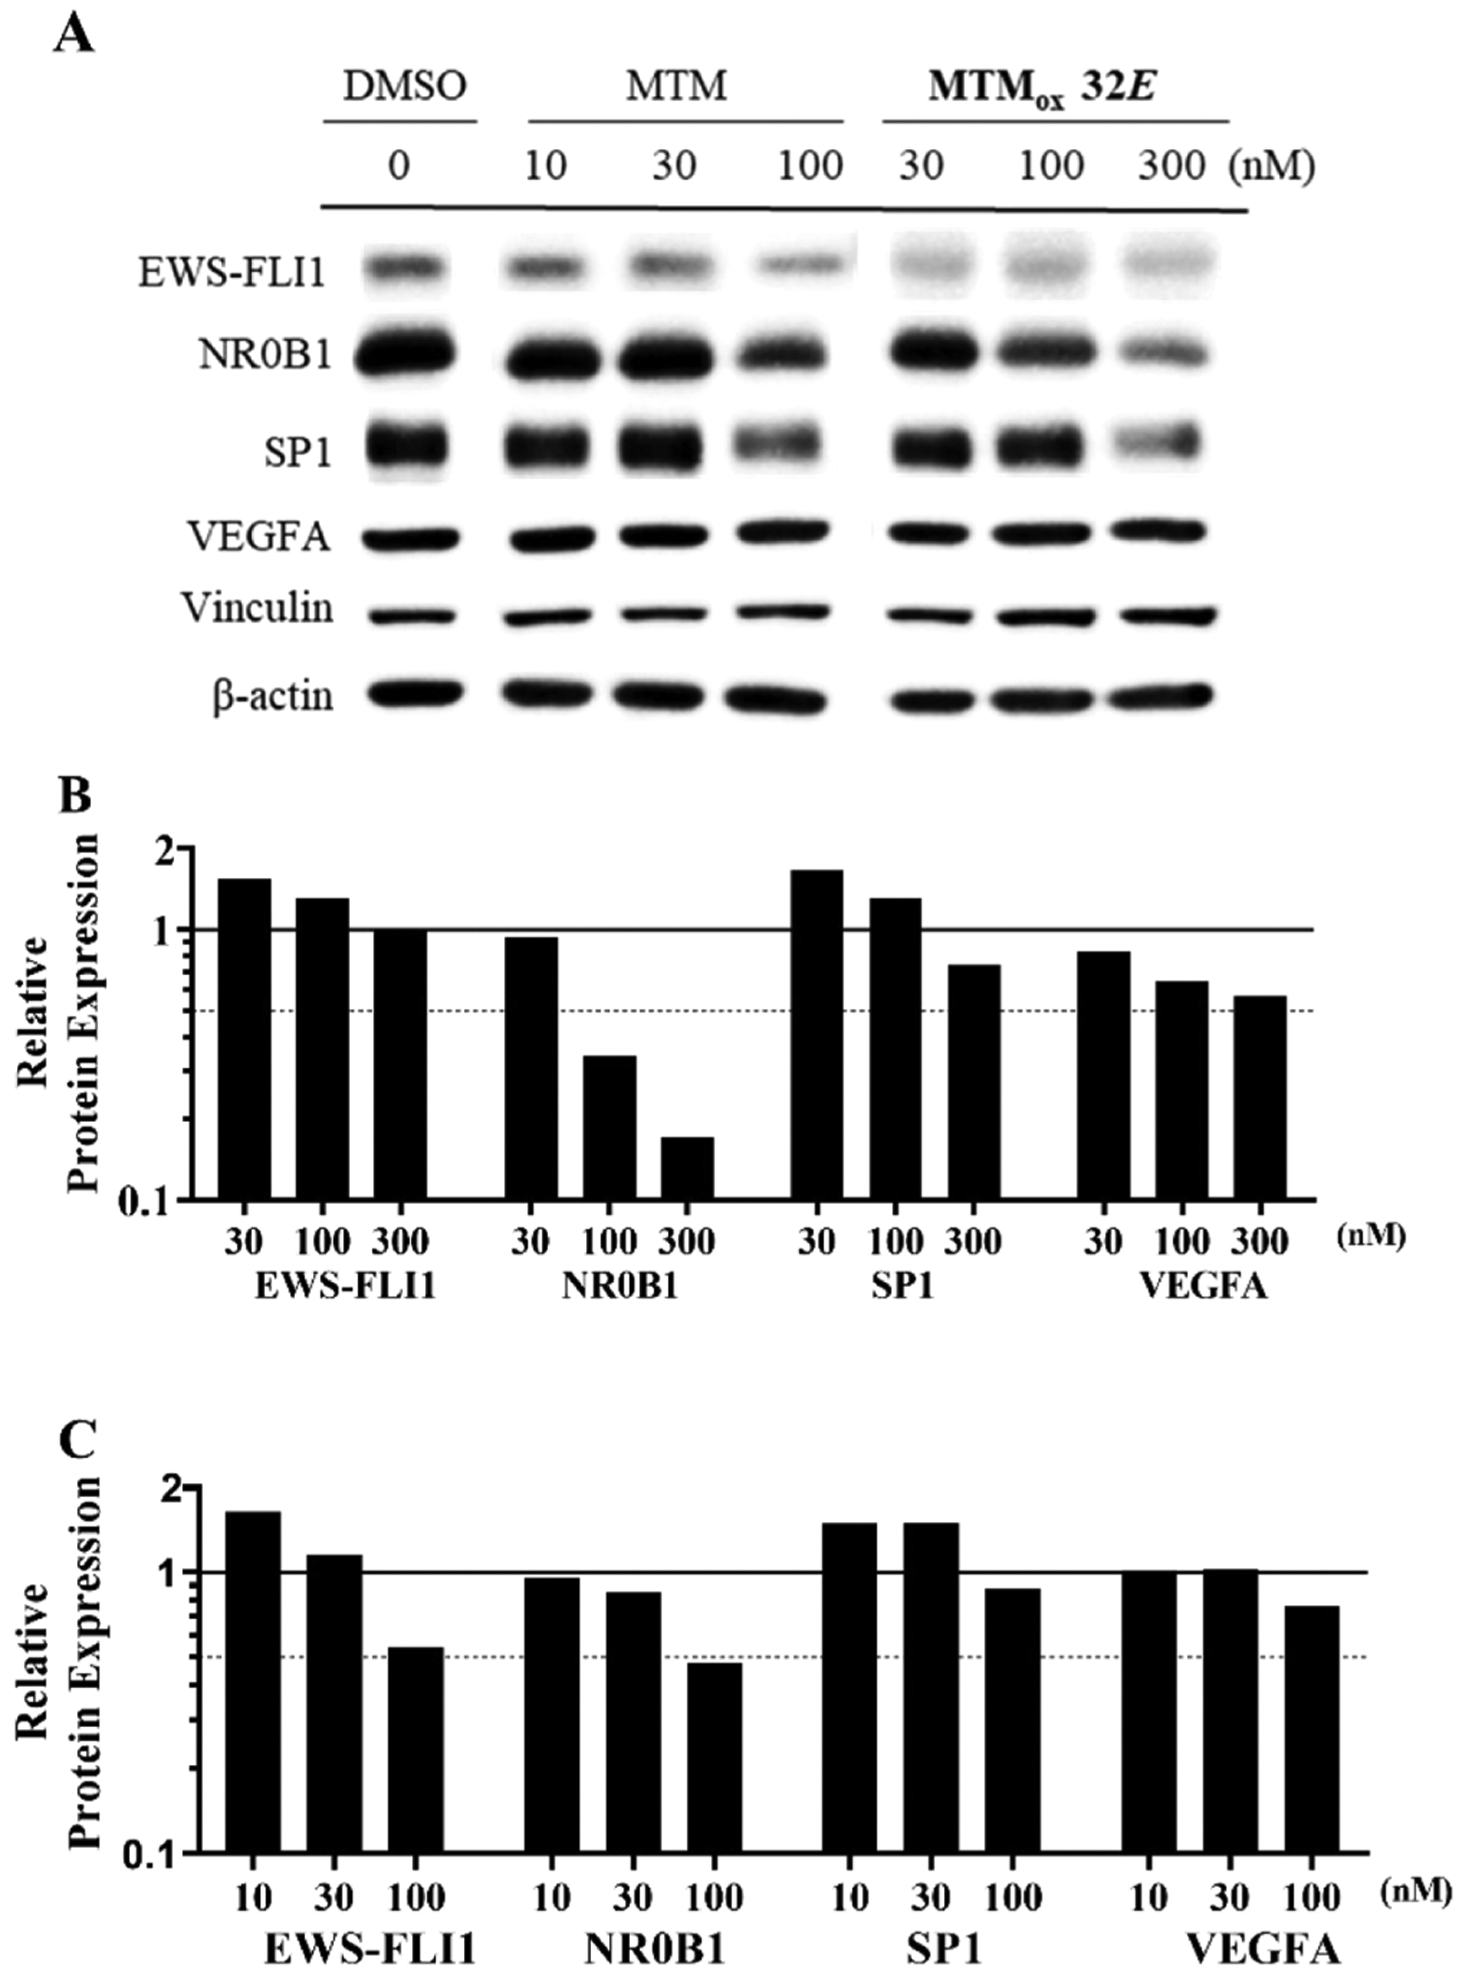
Effects of MTMox32E on protein expression. (A) Expression of EWS-FLI1, Sp1, and respective regulated target gene products NR0B1 and VEGFA evaluated in TC32 cells after 24 h treatment with MTMox32E and MTM. Semiquantitative analysis of band intensities of (B) MTMox32E and (C) MTM effects. Band intensities (GelQuant, OmicX) were normalized with either β-actin (VEGFA, EWS-FLI1, NR0B1) or vinculin (Sp1), from the corresponding protein gel. Normalized values were plotted relative to the nontreated sample (0.1% DMSO).
Determination of In Vivo Tolerance and Dose-Limiting Toxicities.
Having observed significant cytotoxic selectivity toward Ewing sarcoma cells in vitro as well as target engagement in biochemical and in vitro assays, we sought to determine whether MTMox32E had appropriate pharmacological properties in vivo. With the goal of conducting a tumor efficacy study, we first sought to determine the maximum tolerated dose (MTD) of MTMox32E in mice and to conduct PK. The maximum tolerated (single) dose was first evaluated by administering an intravenous bolus dose of MTMox32E (Figure S3). In addition to body weight loss, we followed parameters indicative of hematologic and hepatic toxicity, which are the hallmark dose-limiting toxicities associated with MTM treatment. White blood cells, lymphocytes, and platelets decreased significantly within 2 days after treatment at doses of 35 mg/kg and greater. This was consistent with the alanine aminotransferase (ALT) results that showed a sharp increase on day 2. Notably, these effects were transient and, in surviving animals, ALT levels normalized by day 6 after treatment. Collectively, the body weight loss, hematology, and transaminase data suggested that the single administration of MTMox32E that can be tolerated without dose-limiting toxicities was approximately 25 mg/kg (Figure S3). Additionally, animals receiving toxic doses developed spots of subdermal hemorrhage or petechiae, which served as a toxicity surrogate marker in subsequent multidose tolerance studies. Similarly, the MTD of MTM was estimated to be approximately 1 mg/kg, which is in line with previously reported dosing regiments (Figure S4). In further tolerance studies, protracted MTMox32E dosing schedules of three times weekly for 2 weeks (qMWFx2), every 4 days × 6 (q4dx6) and every 7 days for 3 weeks (q7dx3), showed no weight loss, hematologic toxicity, or hepatic toxicity at doses of 14, 17, and 25 mg/kg, respectively (Figures S5–S7). Additionally, noting that the 25 mg/kg dose was well tolerated, we tested a protracted schedule, in which we administered a total of eight doses at 3-day intervals (q3dx8). There was no weight loss or petechia noted.
Pharmacokinetics.
Following the determination of the single-dose tolerance study, we sought to assess the pharmacokinetic properties of MTMox32E in mice. This is a critical assessment because MTM has notoriously poor PK in mice and in humans, which are limiting for its clinical use.20 Recently developed analogues, such as MTM SK and EC-8042 (Figure S2), also display poor PK, which may impede their clinical development even though they are purported to be less toxic than mithramycin.23,24 MTMox32E was administered as a single intravenous bolus dose (5 mg/kg), and blood was collected at the indicated times (Figure 9). The MTMox32E disposition profile displayed biphasic elimination. The estimated drug clearance was approximately 16-fold lower than that of MTM, and the volume of distribution was approximately 34-fold lower (Table 3). This is consistent with the significantly higher plasma concentrations observed following MTMox32E dosing. Consequently, we anticipate that if MTMox32E kinetics in humans mirror those in mice, it will attain significantly higher exposure to allow drug penetration into tumors. The inability to achieve sufficient drug concentrations in plasma was recently attributed to the failure of MTM to yield clinical responses in Ewing sarcoma patients.20
Figure 9.
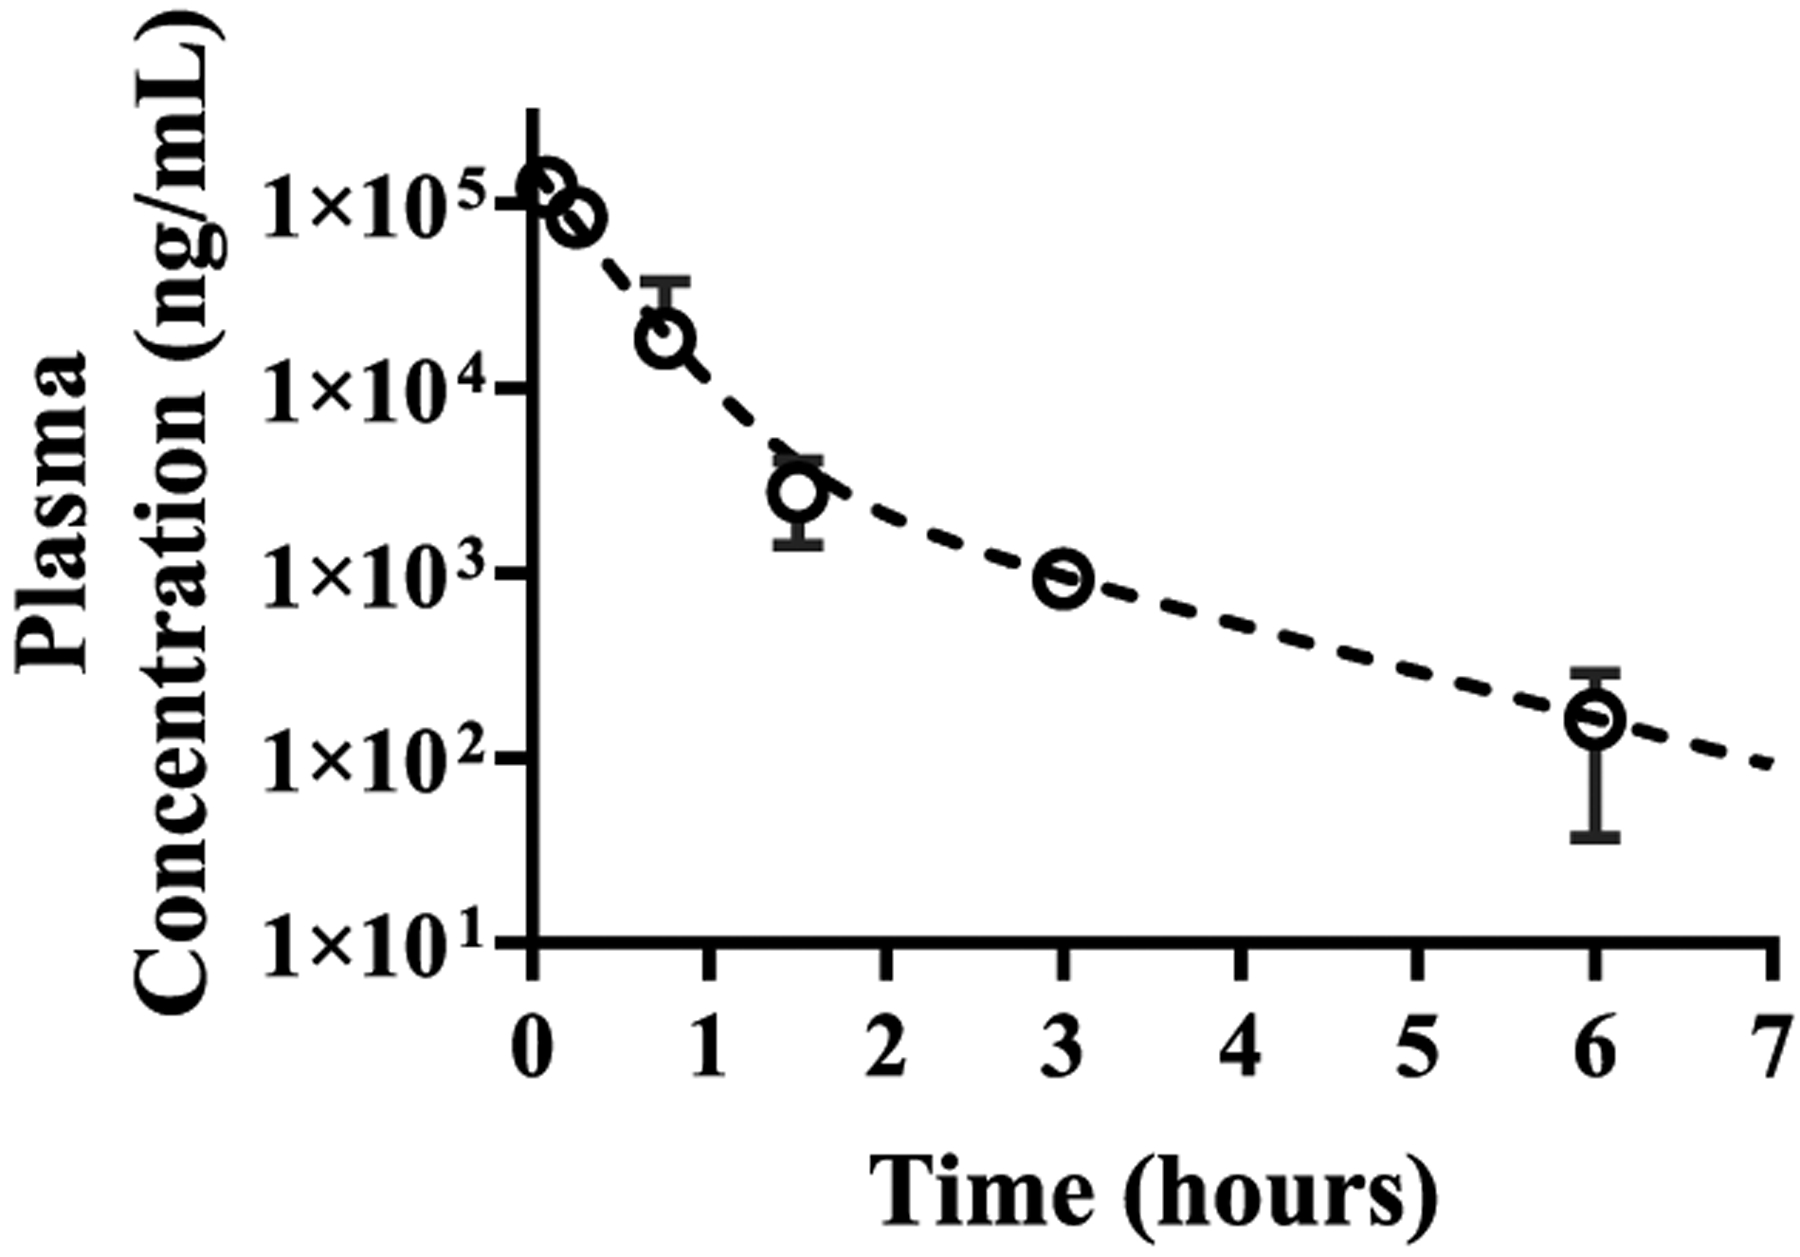
Pharmacokinetic profile of MTMox32E in female nu/nu mice. Concentrations are the average of 2 or 3 samples per time point. Mice were grouped into two or three per group and blood was collected from each mouse at three different time points to construct the pharmacokinetic profile. Pharmacokinetic parameter estimates are presented in Table 3.
Table 3.
Pharmacokinetic Parameter Estimates
Determination of In Vivo Efficacy.
To assess the antitumor efficacy of MTMox32E, we implanted Ewing sarcoma TC32 cells subcutaneously in female athymic nu/nu mice and evaluated the effect of different dosing schedules on tumor growth. Vehicle- and MTM-treated animals were used for comparison. Our initial studies evaluated three dosing schedules [qMWFx2 (14 mg/kg), q4dx6 (17 mg/kg) and q7dx3 (25 mg/kg)]. These schedules were chosen based on the assumption that multiple high doses at short intervals would be more toxic. Therefore, the more frequently dosed schedules were at a lower fraction of the MTD. Although there were trends toward significant effects on tumor size and survival, these dosing regiments were less effective than MTM and only the qMWFx2 (14 mg/kg MTMox32E) schedule afforded a statistically significant improvement in survival over vehicle control group (Figure S8). Based on these observations and the lack of cumulative toxicity with the 25 mg/kg dose, we then evaluated efficacy using a protracted dosing schedule every 3 days for a total of eight doses (q3dx8). MTM (1 mg/kg) was also tested at this protracted schedule. Tumor growth in MTMox32E and MTM-treated animals had a slower growth trajectory, in comparison to vehicle control-treated animals (Figure 10A). However, the tumor volumes and survival of the MTM group was not statistically different than the control group. Notably, the effect of MTMox32E on survival, at this schedule, was significant in comparison to control (p = 0.0001) and MTM (p = 0.0385) groups (Figure 10B). The median survival in the MTMox32E group was of 38 days versus 31 and 22 days for the MTM and vehicle groups, respectively. To determine whether the effect of MTMox32E correlated with the expression of EWS-FLI1 and Sp1 in vivo (i.e., target engagement), we dosed tumor-bearing animals (n = 3/group) and collected tissues 6 h after the sixth dose (Figure S9). MTM treatment reduced Sp1 mRNA levels (p = 0.003), but not EWS-FLI1, at this time point. In comparison, MTMox32E treatment reduced mRNA levels of both EWS-FLI1 (p = 0.002) and Sp1 (p = 0.04) determined by one-way ANOVA with adjustment for multiple comparisons. However, neither compound reduced mRNA expression of EWS-FLI1 and Sp1 downstream target genes at this experimental time point (Figure S8). However, based on the observed effects and the kinetics of transcription-translation, we anticipate that effects on downstream targets should manifest at different timepoints than what was chosen in our experiments. The effect of MTMox32E on EWS-FLI1 is supported by in vitro analyses, where an effect on either EWS-FL1 or its transcriptional target gene, NR0B1, was observed. Collectively, the data show that MTMox32E offers a statistically significant albeit modest survival advantage at two treatment schedules and that treatment downregulates the expression of EWS-FLI1 which drives Ewing sarcoma malignancy. A more detailed exploration of dose–response relationships at well-tolerated dosing schedules is expected to provide further improvement in efficacy.
Figure 10.
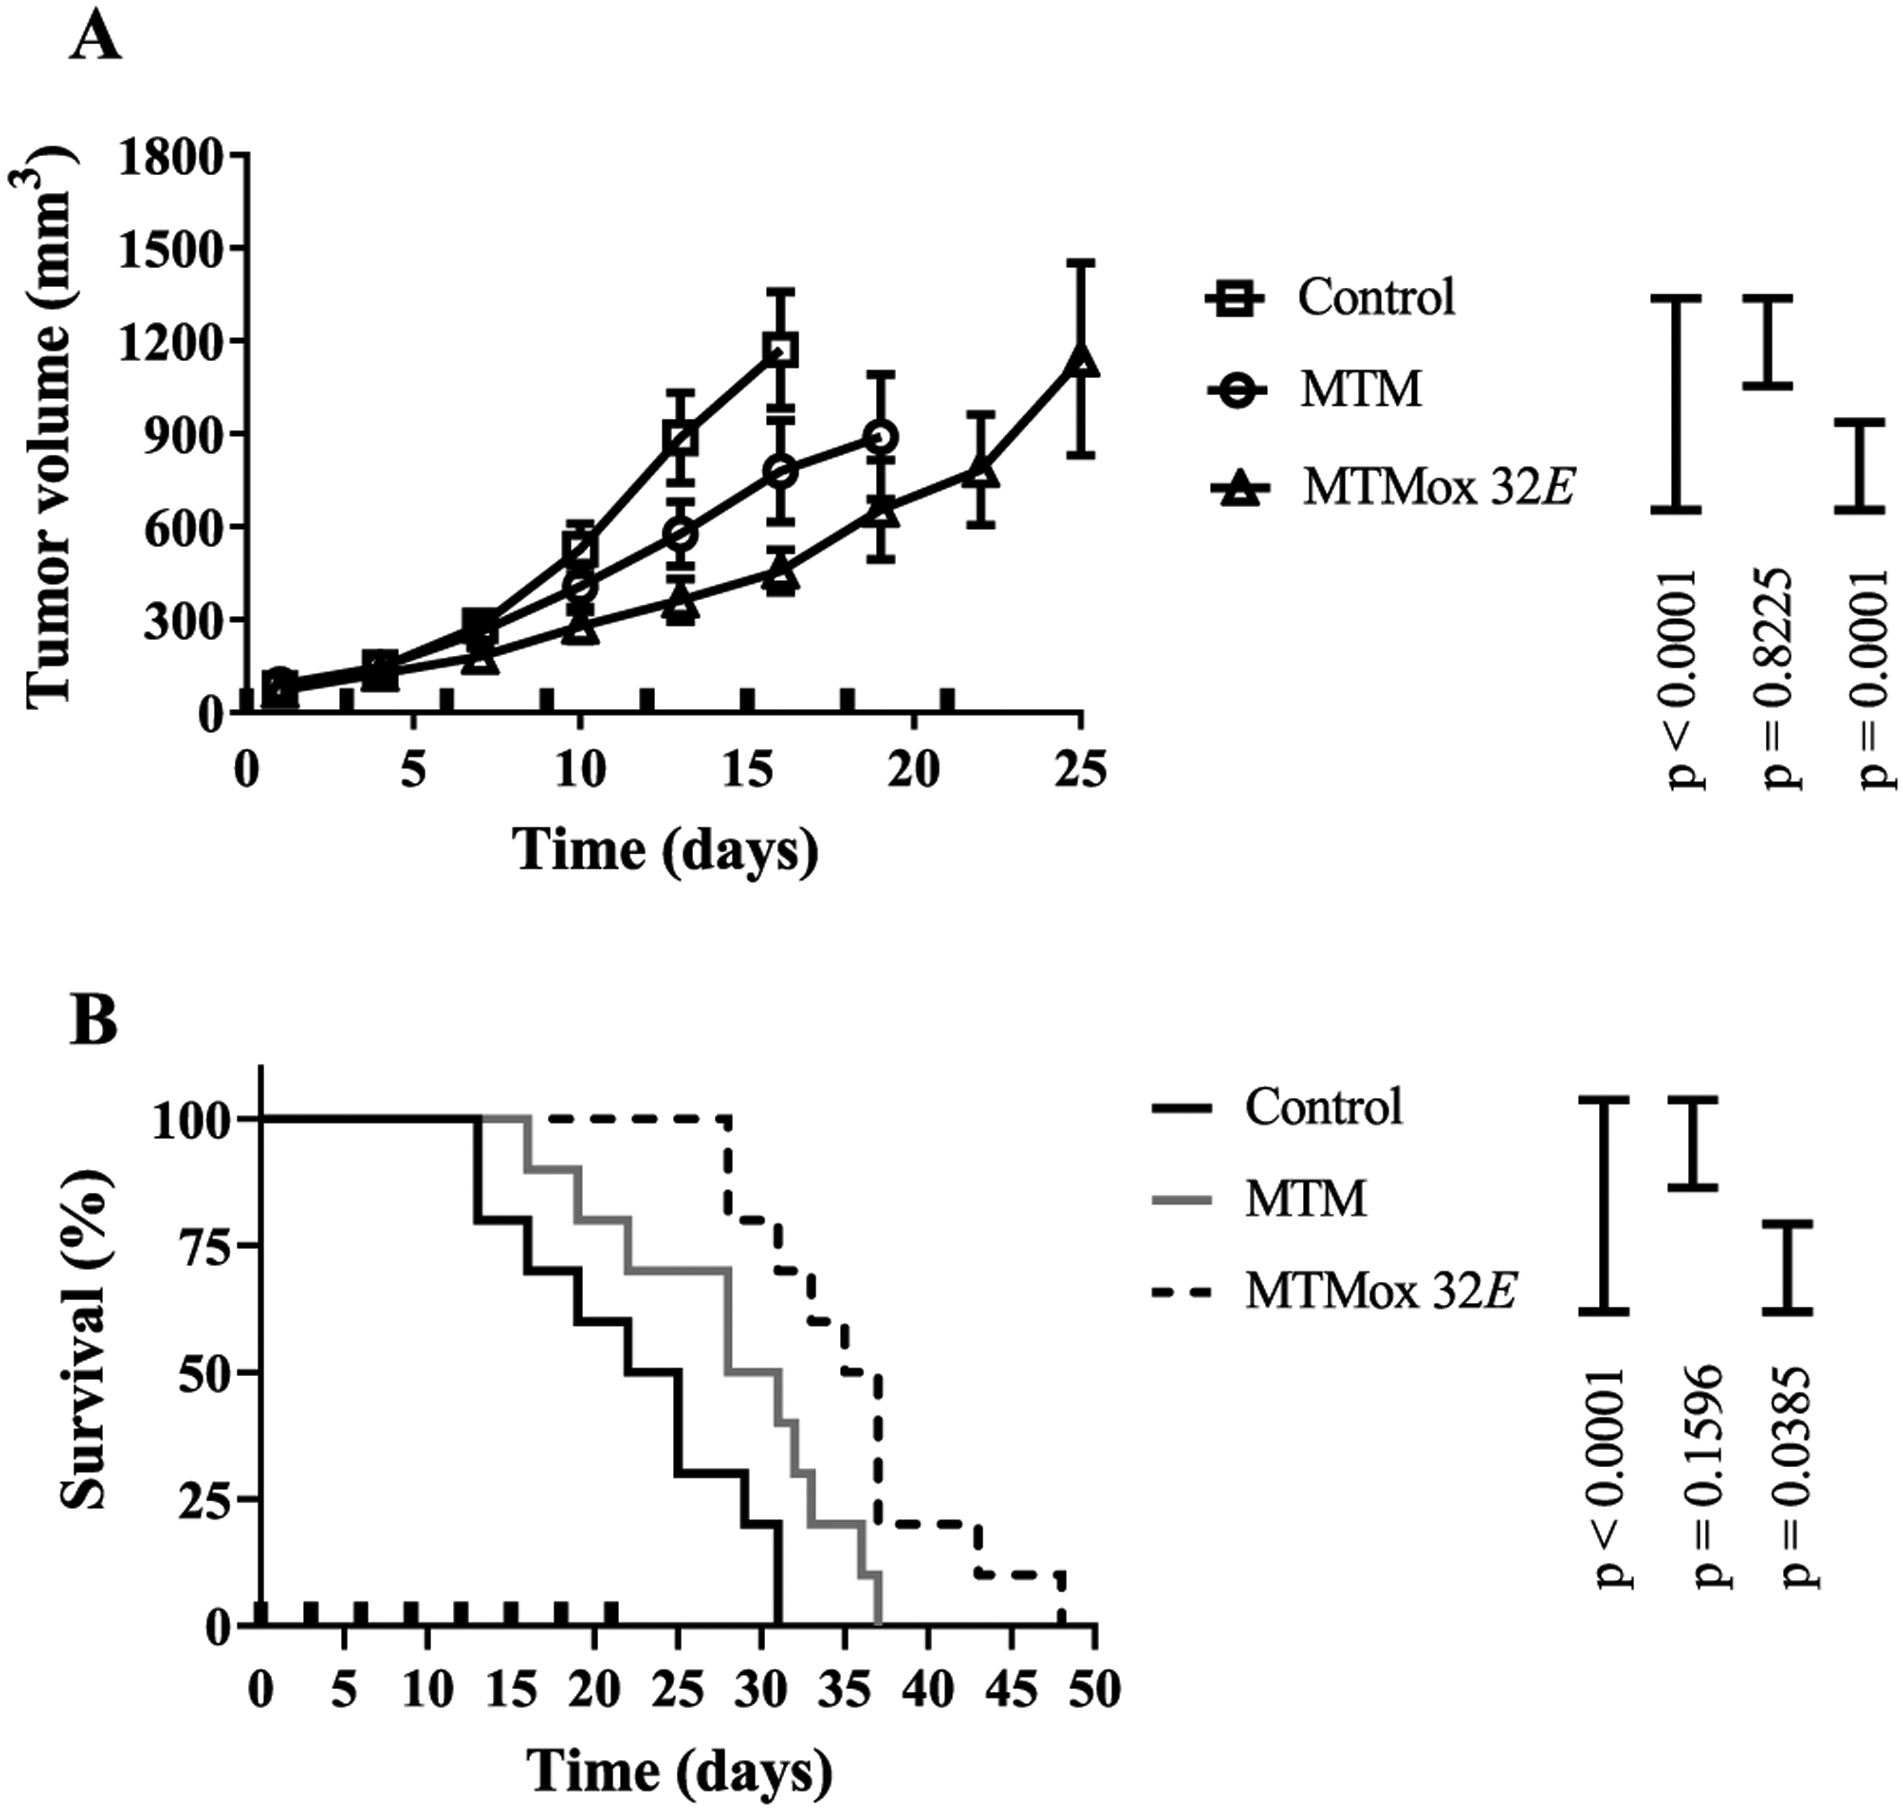
Efficacy in TC32 tumors implanted in athymic nu/nu female mice (n = 10 mice/group). (A) Average tumor volume and (B) survival of mice treated every 3 days for 8 injections (q3dx8) by intravenous bolus doses (bold tick marks). Tumor volumes are plotted until the first animal was removed from a group because of tumor size limit. Differences in tumor volume were assessed 16 days after the initial dose using repeated measures ANOVA (p-values adjusted with the stepdown Holm’s procedure). Survival times were estimated using the Kaplan–Meier curve, and pairwise comparisons were performed using the log-rank test (p-values adjusted using the Holm-Sidak procedure for multiple comparisons).
CONCLUSIONS
In summary, we present a new practical strategy for MTM structure optimization that enables modulation of oncogenic transcription factor selectivity, corresponding ETS fusion-dependent cell line cytotoxicity, pharmacokinetic parameters, in vivo tolerance, and in vivo efficacy. Preliminary SAR studies revealed the SAR trends of MTMox analogues to parallel that of previously reported MTM SA conjugates, suggesting MTMox conjugates as suitable MTM SA surrogates. Within this context, MTMox conjugate production via an efficient one-step oxime conjugation with commercially sourced MTM presents a notable advantage for advancing MTM diversification and selected analogue production capacity. This proof-of-concept study also led to the identification of MTMox32E, an analogue with improved in vitro selectivity for ETS fusion-dependent cancer cell lines and enhanced in vivo properties and single-agent Ewing tumor efficacy compared with the parent drug MTM. The >10-fold increased systemic exposure observed with MTMox32E versus MTM is of particular note and may be because of subtle structural variation. MTM is a weak acid with a pKa of ~536 and its high volume of distribution and high clearance are consistent with this physicochemical property.37 At physiological pH, MTM is likely completely ionized and/or in a dimer form with magnesium. Anionic compounds are typically less protein bound and they are likely to interact with uptake transporters in the liver (e.g., OATP1B1) or efflux transporters in the kidney, which facilitate rapid xenobiotic clearance.38 Given the significant hepatotoxicity observed in patients, we speculate that MTM is a likely liver OATP substrate. In comparison, MTMox32E has increased lipophilicity because of the hydrophobic nature of the Phe–Trp dipeptide and is expected to have higher protein binding. We speculate that this structural modification increases its binding to plasma proteins, which leads to a decrease in the volume of distribution (Table 3) and higher plasma concentrations. Mechanistic studies are ongoing to assess the effect of physicochemical properties to further delineate how structural properties of these analogues affect PK. While other analogues displayed similar lipophilicity and putative protein-binding properties as MTMox32E, the MTMox32E in vitro selectivity, target engagement, and effect on EWS-FLI1 transcriptional targets were additional considerations that led to the selection of MTMox32E for in vivo studies. Cumulatively, these studies suggest the MTMox chemistry platform put forth will enable such important mechanistic studies and potentially facilitate Ewing sarcoma therapeutic lead development.
EXPERIMENTAL SECTION
General Chemistry Methods.
1H (500 MHz) and 13C (100 MHz) NMR spectra were recorded on a Varian Unity Inova 500 MHz instrument (Palo Alto, CA). The chemical shifts were reported in δ (ppm) using the δ 7.26 signal of CDCl3, δ 3.31 signal of CD3OD, and δ 2.50 signal of DMSO-d6 (1H NMR) and the δ 77.16 signal of CDCl3, δ 49.00 signal of CD3OD, and δ 39.52 signal of DMSO-d6 (13C NMR) as internal standards. The following abbreviations were used to explain the multiplicities: s = singlet, d = doublet, t = triplet, q = quartet, m = multiplet. HR-ESI-MS experiments were carried out using AB SCIEX TripleTOF 5600 System with an internal standard (M = 1033.9868) in the negative mode. Analytical LC–MS was performed on an Agilent 1260 infinity II (Gemini 5 μm NX-C18 110 A, 250 × 4.6 mm; A/B 95:5–0:100 linear gradient over 30 min, 0:100 wash for 5 min, 0:100 to 95:5 ramp down for 1 min, 95:5 re-equilibration for 4 min; A = 0.1% aqueous formic acid, B = CH3CN; flow rate 0.5 mL/min) equipped with an Agilent G6125B LC-MSD. Preparative reverse-phase HPLC was performed on a Agilent 1260 infinity II (Gemini 5 μm C18 110 A, 250 × 10 mm; A/B 90:10 for 2 min, 90:10 to 25:75 linear gradient over 23 min, 25:75 to 10:90 linear gradient over 4 min, 10:90 for 5 min, 10:90 to 90:10 linear gradient over 1 min, 90:10 re-equilibration for 5 min; A = 0.025% aqueous TFA, B = CH3CN; flow rate 5 mL/min) equipped with an Agilent G7115A (1260 DAD). All commercially available reagents were used without further purification, purchased from Sigma-Aldrich (St. Louis, MO), TCI America (Portland, OR), Alfa-Aesar (Tewksbury, MA), Enamine (Monmouth, NJ), Chemieliva (Chongqing, China), and UORSY Building Blocks Library (Kyiv, Ukraine). Analytical thin-layer chromatography (TLC) with a fluorescence F254 indicator (TLC; EMD Chemicals Inc., Darmstadt, Germany) was used for routine reaction progress assessment. Silica gel (230–400 mesh) for column chromatography was purchased from SiliCycle (Quebec City, Canada). Purity of compounds screened in preliminary cell culture assays was ≥90%, a subset (40%) of which was ≥95% (Figure S10 and Table S1). Purity of all final compounds advanced to secondary assays and in vivo studies was ≥95% as determined by HPLC.
General Alkoxyamine Precursor Synthetic Strategy (Scheme 1A, 4a–4e).
Rxn 1 (general peptide coupling reaction):
A solution of alkoxyamino acid (1, 1.0 equiv, 1 mmol), amine (2a–2e, 1.1 equiv, 1.1 mmol), EDCI (1.2 equiv, 1.2 mmol), HOBt (1.2 equiv, 1.2 mmol), and Et3N (2.0 equiv, 2.0 mmol) in 10 mL of CH2Cl2 was stirred at room temperature overnight. When the reaction was completed (monitored by TLC), the solvent was removed, and the recovered crude residue was purified by normal-phase column chromatography (3:1–1:1 n-hexane/EtOAc gradient elution) to afford the N-protected alkoxyamine (3a–3e). Rxn 2 (general deprotection reaction): The N-protected alkoxyamine (3a–3e) obtained above was added to 10 mL of CH2Cl2/TFA (7:3, v/v) and stirred at room temperature for 1 h. When the reaction was completed (monitored by TLC), the mixture was evaporated to dryness and the recovered residue dissolved in EtOAc (30 mL) and washed with saturated NaHCO3 solution (30 mL × 1), water (30 mL × 1), and brine (30 mL × 1), and the recovered organics were subsequently dried over Na2SO4. Organics were filtered and evaporated to dryness, and the crude residue was purified by normal-phase column chromatography (2:1–1:2 n-hexane/EtOAc gradient elution) to give the desired products 4a–4e as a white solid (two steps, 47–91% yields).
N-[2-(1H-Indol-3-yl)ethyl]-2-(aminooxy)acetamide (4a).
Starting material 2-(1H-indol-3-yl)ethan-1-amine (176 mg, 1.1 mmol) gave 110 mg (0.47 mmol, two steps, 47% yield) of the desired product as a white solid. 1H NMR (500 MHz, DMSO-d6): δ 10.92 (s, 1H), 8.47 (s, 1H), 7.57 (d, J = 7.8 Hz, 1H), 7.37 (d, J = 8.2 Hz, 1H), 7.20 (s, 1H), 7.14–7.05 (m, 1H), 7.05–6.98 (m, 1H), 4.56 (s, 2H), 3.57 (s, 2H), 3.47–3.40 (m, 2H), 2.89 (t, J = 7.5 Hz, 2H).
Methyl [2-(Aminooxy)acetyl]-l-phenylalaninate (4b).
Methyl l-phenylalaninate (198 mg, 1.1 mmol) gave 209 mg (0.83 mmol, two steps, 83% yield) of the desired product as a white solid. 1H NMR (500 MHz, CD3Cl-d): δ 7.72 (s, 1H), 7.29–7.23 (m, 2H), 7.19 (t, J = 7.7, 1.5 Hz, 3H), 4.81 (td, J = 8.0, 5.9 Hz, 1H), 4.26 (d, J = 6.0 Hz, 2H), 3.67 (s, 3H), 3.18 (dd, J = 13.9, 5.9 Hz, 1H), 3.03 (dd, J = 13.9, 7.9 Hz, 1H).
Methyl [2-(Aminooxy)acetyl]-d-phenylalaninate (4c).
Methyl d-phenylalaninate (198 mg, 1.1 mmol) gave 230 mg (0.91 mmol, two steps, 91% yield) of the desired product as a white solid. 1H NMR (500 MHz, CD3Cl-d): δ 7.61 (s, 1H), 7.29–7.23 (m, 2H), 7.22–7.17 (m, 3H), 4.81 (td, J = 8.0, 5.9 Hz, 1H), 4.25 (d, J = 6.0 Hz, 2H), 3.66 (s, 3H), 3.18 (dd, J = 13.9, 5.9 Hz, 1H), 3.03 (dd, J = 13.9, 7.9 Hz, 1H).
Methyl [2-(Aminooxy)acetyl]-l-tryptophanate (4d).
Methyl l-tryptophanate (240 mg, 1.1 mmol) gave 209 mg (0.78 mmol, two steps, 78% yield) of the desired product as a white solid. 1H NMR (500 MHz, CD3Cl-d): δ 7.92 (s, 1H), 7.57 (d, J = 7.4 Hz, 1H), 7.40 (s, 1H), 7.33 (d, J = 8.1 Hz, 1H), 7.17 (t, J = 8.1 Hz, 1H), 7.12–7.07 (m, 2H), 4.91 (m, 1H), 4.28 (d, J = 5.1 Hz, 2H), 3.66 (s, 3H), 3.41–3.31 (m, 1H), 3.31–3.22 (m, 1H).
Methyl N-[2-(Aminooxy)acetyl]-1-methyl-l-tryptophanate (4e).
Methyl 1-methyl-l-tryptophanate (255 mg, 1.1 mmol) gave 209 mg (0.68 mmol, two steps, 68% yield) of the desired product as a white solid. 1H NMR (500 MHz, CD3Cl-d): δ 7.59–7.53 (s, 1H), 7.26 (d, J = 8.3 Hz, 1H), 7.19 (t, J = 7.6 Hz, 1H), 7.10 (t, J = 7.6 Hz, 1H), 6.96 (s, 1H), 4.89 (m, 1H), 4.28 (s, 2H), 3.72 (s, 3H), 3.65 (s, 3H), 3.37–3.21 (m, 2H).
General Precursor Ester Hydrolysis (Scheme 1A, 4f and 4g).
A solution of 4d or 4e (1.0 equiv, 1 mmol) and LiOH (10.0 equiv, 10.0 mmol) in 20 mL THF/H2O (1:1) was stirred at room temperature overnight. When the reaction was completed (monitored by TLC), EtOAc (50 mL) was added and the mixture was washed with water (30 mL × 1) and brine (30 mL × 1) and dried over Na2SO4. The organic solvent was removed to give the desired products.
[2-(Aminooxy)acetyl]-l-tryptophan (4f).
Methyl [2-(aminooxy)-acetyl]-l-tryptophanate (4d) (291 mg, 1.0 mmol) gave 277 mg (quantitative) of the desired product as a white solid. 1H NMR (500 MHz, methanol-d4): δ 7.54 (d, J = 7.8 Hz, 1H), 7.31 (d, J = 8.1 Hz, 1H), 7.10–7.03 (m, 2H), 6.99 (dd, J = 7.9, 7.0 Hz, 1H), 4.80 (dd, J = 7.8, 5.0 Hz, 1H), 4.49–4.31 (m, 2H), 3.38 (ddt, J = 14.7, 5.0, 0.8 Hz, 1H), 3.20 (ddd, J = 14.7, 7.9, 0.8 Hz, 1H).
N-[2-(Aminooxy)acetyl]-1-methyl-l-tryptophan (4g).
Methyl N-[2-(aminooxy)acetyl]-1-methyl-l-tryptophanate (4e) (305 mg, 1.0 mmol) gave 291 mg (quantitative) of the desired product as a white solid. 1H NMR (500 MHz, CD3Cl-d): δ 7.89 (s, 1H), 7.56–7.49 (m, 1H), 7.23 (d, J = 8.0 Hz, 1H), 7.16 (t, J = 7.0 Hz, 1H), 7.05 (t, J = 7.0 Hz, 1H), 6.93 (s, 1H), 4.88–4.81 (m, 1H), 4.26 (d, J = 4.0 Hz, 2H), 3.62 (s, 1H), 3.36–3.27 (m, 1H), 3.27–3.21 (m, 1H).
General Dipeptide Alkoxyamine Precursor Synthetic Strategy (Scheme 1B, 8a–8g).
Rxn 1 (peptide coupling):
A solution of amino acids [AA1 (1.1 equiv, 1.1 mmol) and AA2 (1.0 equiv, 1.0 mmol)] was reacted following the previously described “general peptide coupling reaction” conditions to afford the desired N-protected dipeptides 5a–5g. Rxn 2 (deprotection): Deprotection of N-protected dipeptide (5a–5g) from above was accomplished following the previously described “general deprotection reaction” to give 6a–6g as white solids (two steps, 55–71% yields). Rxn 3 (peptide coupling): A solution of dipeptide (6a–6g, 1.1 equiv, 1.1 mmol) from above and alkoxyamino acid 1 (1.0 equiv, 1.0 mmol) were reacted following the previously described “general peptide coupling reaction” conditions to afford desired alkoxyamino-coupled dipeptides (7a–7g). Rxn 4 (deprotection): Deprotection of alkoxyamino-coupled dipeptide (7a–7g) from above was accomplished following the previously described “general deprotection reaction” to give the desired final products 8a–8g as white solids (two steps, 51–65% yields).
Methyl [2-(Aminooxy)acetyl]-l-tryptophyl-l-tryptophanate (8a).
Methyl l-tryptophanate (240 mg, 1.1 mmol) and (tert-butoxycarbonyl)-l-tryptophan (304 mg, 1.0 mmol) gave 158 mg (0.33 mmol, 4 steps, 33% yield) of the desired product as a white solid. 1H NMR (500 MHz, CD3Cl-d): δ 8.49 (s, 1H), 8.19 (s, 1H), 7.64 (s, 1H), 7.58 (d, J = 9.2 Hz, 1H), 7.33 (d, J = 9.4 Hz, 1H), 7.28–7.22 (m, 2H), 7.15–7.03 (m, 3H), 6.97 (t, J = 7.8 Hz, 1H), 6.88 (d, J = 1.9 Hz, 1H), 6.71 (d, J = 2.0 Hz, 1H), 6.66 (d, J = 7.6 Hz, 1H), 4.80–4.72 (m, 2H), 4.11 (q, J = 7.2 Hz, 2H), 3.54 (s, 3H), 3.21–3.16 (m, 2H), 3.16–3.10 (m, 2H).
Methyl [2-(Aminooxy)acetyl]-l-tryptophyl-l-phenylalaninate (8b).
Methyl l-phenylalaninate (197 mg, 1.1 mmol) and (tert-butoxycarbonyl)-l-tryptophan (304 mg, 1.0 mmol) gave 123 mg (0.28 mmol, 4 steps, 28% yield) of the desired product as a white solid. 1H NMR (500 MHz, CD3Cl-d): δ 8.27 (s, 1H), 7.65–7.60 (m, 2H), 7.30 (d, J = 8.0 Hz, 1H), 7.19–7.11 (m, 4H), 7.08 (t, J = 7.5 Hz, 1H), 7.02 (d, J = 2.3 Hz, 1H), 6.95–6.90 (m, 2H), 6.51 (d, J = 7.6 Hz, 1H), 4.75–4.67 (m, 2H), 4.23 (s, 2H), 3.58 (s, 3H), 3.28–3.15 (m, 2H), 3.03–2.96 (m, 1H), 2.94–2.87 (m, 1H).
Methyl [2-(Aminooxy)acetyl]-l-tryptophyl-d-phenylalaninate (8c).
Methyl d-phenylalaninate (197 mg, 1.1 mmol) and (tert-butoxycarbonyl)-l-tryptophan (304 mg, 1.0 mmol) gave 140 mg (0.32 mmol, 4 steps, 32% yield) of the desired product as a white solid. 1H NMR (500 MHz, CD3Cl-d): δ 7.73 (d, J = 8.1 Hz, 1H), 7.47 (d, J = 7.7 Hz, 1H), 7.41 (d, J = 7.7 Hz, 1H), 7.22–7.04 (m, 7H), 7.01 (d, J = 8.5 Hz, 2H), 6.79 (s, 1H), 4.74–4.59 (m, 2H), 4.24 (s, 2H), 3.59 (s, 3H), 2.99–2.75 (m, 4H).
Methyl [2-(Aminooxy)acetyl]-l-phenylalanyl-l-tryptophanate (8d).
Methyl l-tryptophanate (240 mg, 1.1 mmol) and (tert-butoxycarbonyl)-l-phenylalanine (265 mg, 1.0 mmol) gave 171 mg (0.39 mmol, 4 steps, 39% yield) of the desired product as a white solid. 1H NMR (500 MHz, methanol-d4): δ 7.50 (d, J = 7.9 Hz, 1H), 7.31 (d, J = 8.1 Hz, 1H), 7.24–7.14 (m, 5H), 7.10–7.03 (m, 2H), 6.99 (t, J = 7.5 Hz, 1H), 4.75–4.65 (m, 2H), 4.53–4.35 (m, 2H), 3.62 (s, 3H), 3.49–3.43 (m, 1H), 3.21–3.14 (m, 1H), 3.13–3.06 (m, 1H), 2.89–2.78 (m, 1H).
Methyl [2-(Aminooxy)acetyl]-l-phenylalanyl-l-phenylalaninate (8e).
Methyl l-phenylalaninate (198 mg, 1.1 mmol) and (tert-butoxycarbonyl)-l-phenylalanine (265 mg, 1.0 mmol) gave 184 mg (0.46 mmol, 4 steps, 46% yield) of the desired product as a white solid. 1H NMR (500 MHz, CD3Cl-d): δ 7.69 (s, 1H), 7.30–7.11 (m, 8H), 7.07–6.99 (m, 2H), 6.65 (d, J = 7.7 Hz, 1H), 4.76 (q, J = 6.7 Hz, 1H), 4.65 (td, J = 8.1, 6.4 Hz, 1H), 4.21 (s, 2H), 3.63 (s, 3H), 3.19 (dd, J = 14.0, 6.4 Hz, 1H), 3.09 (dd, J = 13.9, 5.8 Hz, 1H), 3.02–2.90 (m, 2H).
Methyl [2-(Aminooxy)acetyl]-l-alanyl-l-tryptophanate (8f).
Methyl l-tryptophanate (240 mg, 1.1 mmol) and (tert-butoxycarbonyl)-l-alanine (189 mg, 1.0 mmol) gave 134 mg (0.37 mmol, 4 steps, 37% yield) of the desired product as a white solid. 1H NMR (500 MHz, methanol-d4): δ 7.51 (d, J = 8.0 Hz, 1H), 7.31 (d, J = 8.1 Hz, 1H), 7.11 (s, 1H), 7.06 (t, J = 7.4 Hz, 1H), 6.99 (t, J = 7.4 Hz, 1H), 4.73–4.68 (m, 1H), 4.52 (s, 2H), 4.41 (q, J = 7.0 Hz, 1H), 3.63 (s, 3H), 3.31–3.23 (m, 1H), 3.22–3.15 (m, 1H), 1.33 (d, J = 7.1 Hz, 3H).
Methyl [2-(Aminooxy)acetyl]-l-tryptophyl-l-alaninate (8g).
Methyl l-alaninate (113 mg, 1.1 mmol) and (tert-butoxycarbonyl)-l-tryptophan (304 mg, 1.0 mmol) gave 149 mg (0.41 mmol, 4 steps, 41% yield) of the desired product as a white solid. 1H NMR (500 MHz, CD3Cl-d): δ 8.28 (s, 1H), 7.57 (d, J = 7.9 Hz, 1H), 7.51 (d, J = 7.6 Hz, 1H), 7.30 (d, J = 8.1 Hz, 1H), 7.18–7.11 (m, 1H), 7.10–7.05 (m, 1H), 6.92 (d, J = 7.1 Hz, 1H), 4.77–4.71 (m, 1H), 4.42–4.35 (m, 1H), 4.25 (d, J = 7.2 Hz, 2H), 3.64 (s, 3H), 3.22 (d, J = 6.9 Hz, 2H), 1.24 (d, J = 7.0 Hz, 3H).
General Conjugation Method for MTMox Analogue Synthesis.
Alkoxyamine (2–4 equiv, 20–40 μmol) and TFA (1%, v/v) were added to a stirred solution of MTM (1 equiv, 10 μmol) in dry MeOH (200 μL), and the mixture was stirred in dark overnight at room temperature. The reaction was monitored by analytical LC–MS and, on completion (based on disappearance of MTM), the crude reaction was filtered through a 0.45 μm syringe filter (hydrophobic polytetrafluoroethylene membrane) and then directly purified via preparative HPLC. Collected fractions containing a pure product were combined and lyopholized to give the desired MTMox product. Purity of analogues used for in vitro and in vivo studies is highlighted in Figure S10 and Table S1.
(E)-3-(2′-Hydroxyimino) MTM (MTMox1E).
MTM (11 mg, 10 μmol) and hydroxylamine (1.3 mg, 40 μmol) gave 3.6 mg (3.3 μmol, 33% yield) of the desired productas a yellow solid. Retention time 19.7 min; 1H NMR (500 MHz, methanol-d4): δ 6.79 (s, 1H), 6.66 (s, 1H), 5.21 (d, J = 9.4 Hz, 1H), 5.08 (d, J = 9.6 Hz, 1H), 4.97 (d, J = 9.0 Hz, 1H), 4.69 (d, J = 9.4 Hz, 3H), 4.23 (d, J = 6.6 Hz, 1H), 4.17 (d, J = 2.6 Hz, 1H), 3.87 (d, J = 11.9 Hz, 1H), 3.80–3.59 (m, 6H), 3.58–3.46 (m, 2H), 3.42 (s, 3H), 3.35 (dd, J = 9.2, 6.0 Hz, 2H), 3.05 (q, J = 9.5 Hz, 3H), 2.99–2.86 (m, 4H), 2.81 (t, J = 12.6 Hz, 1H), 2.62 (d, J = 14.4 Hz, 2H), 2.35 (d, J = 10.7 Hz, 1H), 2.22–2.15 (m, 1H), 2.12 (s, 3H), 1.99–1.86 (m, 2H), 1.79 (dq, J = 20.0, 11.6, 8.9 Hz, 2H), 1.65–1.51 (m, 3H), 1.35–1.29 (m, 12H), 1.27–1.23 (m, 9H); HRMS m/z: calcd for C52H76NO24− [M − 1]−, 1098.4763; found, 1098.4752.
(E)-3-(2′-Methoxyimino) MTM (MTMox2E).
MTM (25 mg, 23 μmol) and O-methyl hydroxylamine (2.5 mg, 50 μmol) gave 18.0 mg (16.2 μmol, 71% yield) of the desired product as a yellow solid. Retention time 21.1 min; 1H NMR (500 MHz, methanol-d4): δ 6.91 (s, 1H), 6.77 (s, 1H), 5.32 (d, J = 9.7 Hz, 1H), 5.08 (d, J = 9.7 Hz, 1H), 4.96 (dd, J = 9.7, 2.1 Hz, 1H), 4.79–4.69 (m, 3H), 4.67 (d, J = 9.7 Hz, 1H), 4.49 (d, J = 4.6 Hz, 1H), 4.08–3.99 (m, 1H), 3.94 (s, 3H), 3.86 (ddd, J = 12.0, 4.7, 2.9 Hz, 1H), 3.82–3.72 (m, 3H), 3.72–3.61 (m, 4H), 3.58–3.50 (m, 3H), 3.48–3.39 (m, 4H), 3.37–3.31 (m, 2H), 3.12–2.97 (m, 4H), 2.97–2.87 (m, 3H), 2.74–2.64 (m, 1H), 2.55 (dd, J = 12.1, 4.5 Hz, 1H), 2.43 (d, J = 11.0 Hz, 1H), 2.18 (ddd, J = 12.5, 5.1, 1.9 Hz, 1H), 2.14 (s, 3H), 1.97–1.72 (m, 4H), 1.64–1.51 (m, 3H), 1.35–1.29 (m, 12H), 1.26–1.22 (m, 6H), 1.13 (d, J = 6.5 Hz, 3H); HRMS m/z: calcd for C53H78NO24− [M − 1]−, 1112.4919; found, 1112.4882.
(E)-3-(2′-Ethoxyimino) MTM (MTMox3E).
MTM (25 mg, 23 μmol) and O-ethyl hydroxylamine (3 mg, 50 μmol) gave 15.3 mg (13.6 μmol, 59% yield) of the desired product as a yellow solid. Retention time 21.9 min; 1H NMR (500 MHz, methanol-d4): δ 6.91 (s, 1H), 6.78 (s, 1H), 5.33 (d, J = 9.2 Hz, 1H), 5.08 (d, J = 10.8 Hz, 1H), 4.96 (dd, J = 9.7, 2.1 Hz, 1H), 4.77–4.70 (m, 3H), 4.67 (dd, J = 9.6, 2.1 Hz, 1H), 4.52 (d, J = 4.7 Hz, 1H), 4.25–4.15 (m, 2H), 4.10–4.02 (m, 1H), 3.86 (dt, J = 12.0, 4.0 Hz, 1H), 3.81–3.60 (m, 6H), 3.57–3.50 (m, 2H), 3.43 (s, 3H), 3.37–3.32 (m, 1H), 3.13–2.89 (m, 7H), 2.68 (t, J = 11.7 Hz, 1H), 2.55 (dd, J = 11.1, 5.4 Hz, 1H), 2.43 (dd, J = 11.4, 5.1 Hz, 1H), 2.18 (dd, J = 11.4, 5.4 Hz, 1H), 2.14 (s, 3H), 1.97–1.71 (m, 5H), 1.64–1.52 (m, 3H), 1.35–1.29 (m, 16H), 1.27–1.22 (m, 7H), 1.13 (d, J = 6.5 Hz, 3H); HRMS m/z: calcd for C54H80NO24− [M − 1]−, 1126.5076; found, 1126.5109.
(E)-3-(2′-Allyloxyimino) MTM (MTMox4E).
MTM (25 mg, 23 μmol) and O-allyl hydroxylamine (4 mg, 50 μmol) gave 13.3 mg (11.7 μmol, 51% yield) of the desired product as a yellow solid. Retention time 22.5 min; 1H NMR (500 MHz, methanol-d4): δ 6.91 (s, 1H), 6.79 (s, 1H), 6.09–6.01 (m, 1H), 5.38–5.31 (m, 2H), 5.25 (dd, J = 10.5, 1.6 Hz, 1H), 5.09 (dd, J = 9.7, 2.0 Hz, 1H), 4.97 (dd, J = 9.7, 2.1 Hz, 1H), 4.79 (d, J = 2.3 Hz, 1H), 4.76–4.70 (m, 2H), 4.69–4.64 (m, 3H), 4.56 (d, J = 4.6 Hz, 1H), 4.08 (qd, J = 6.4, 4.5 Hz, 1H), 3.86 (ddd, J = 12.1, 4.8, 2.9 Hz, 1H), 3.83–3.61 (m, 6H), 3.58–3.51 (m, 2H), 3.43 (s, 3H), 3.36–3.32 (m, 1H), 3.27–3.25 (m, 1H), 3.16 (dt, J = 3.3, 1.6 Hz, 1H), 3.11–2.98 (m, 4H), 2.98–2.89 (m, 3H), 2.74–2.65 (m, 1H), 2.55 (ddd, J = 12.6, 5.4, 2.0 Hz, 1H), 2.45 (ddd, J = 12.3, 5.2, 2.1 Hz, 1H), 2.18 (ddd, J = 12.5, 5.1, 2.0 Hz, 1H), 2.14 (s, 3H), 1.97–1.75 (m, 4H), 1.64–1.52 (m, 4H), 1.36–1.29 (m, 14H), 1.26–1.23 (m, 7H), 1.14 (d, J = 6.4 Hz, 3H); HRMS m/z: calcd for C55H80NO24− [M − 1]−, 1138.5076; found, 1138.5042.
(E)-3-[2′-(Carboxymethoxy)imino] MTM (MTMox5E).
MTM (11 mg, 10 μmol) and 2-(aminooxy)acetic acid (2 mg, 20 μmol) gave 3.8 mg (3.3 μmol, 33% yield) of the desired product as a yellow solid. Retention time 20.7 min; 1H NMR (500 MHz, methanol-d4): δ 6.92 (s, 1H), 6.76 (s, 1H), 5.34 (d, J = 9.5 Hz, 1H), 5.08 (d, J = 8.7 Hz, 1H), 4.80–4.64 (m, 5H), 4.46 (d, J = 4.8 Hz, 1H), 4.26–4.19 (m, 1H), 3.86 (d, J = 10.9 Hz, 1H), 3.82–3.63 (m, 5H), 3.59–3.47 (m, 3H), 3.42 (s, 3H), 3.14–3.00 (m, 4H), 2.99–2.89 (m, 3H), 2.68 (t, J = 13.2 Hz, 1H), 2.56 (dd, J = 11.7, 4.7 Hz, 1H), 2.45 (dd, J = 14.0, 4.9 Hz, 1H), 2.21–2.16 (m, 1H), 2.14 (s, 3H), 1.99–1.72 (m, 5H), 1.62–1.54 (m, 4H), 1.36–1.30 (m, 12H), 1.27–1.21 (m, 8H), 1.16 (d, J = 6.5 Hz, 3H); HRMS m/z: calcd for C54H78NO26− [M − 1]−, 1156.4818; found, 1156.4763.
(E)-3-[2′-(Prop-2-yn-1-yloxy)imino] MTM (MTMox6E) and (Z)-3-[2′-(Prop-2-yn-1-yloxy)imino] MTM (MTMox6Z).
MTM (50 mg, 46 μmol) and O-(prop-2-yn-1-yl) hydroxylamine (7 mg, 95 μmol) gave 23.5 mg of 6E (20.7 μmol, 45% yield) and 2.1 mg of 6Z (1.8 μmol, 4% yield) as a yellow solid. 6E: retention time 22.0 min; 1H NMR (500 MHz, methanol-d4): δ 6.90 (s, 1H), 6.77 (s, 1H), 5.34 (d, J = 9.5 Hz, 1H), 5.08 (d, J = 9.4 Hz, 1H), 4.96 (dd, J = 9.7, 2.0 Hz, 1H), 4.83 (d, J = 1.6 Hz, 2H), 4.76 (d, J = 2.6 Hz, 2H), 4.74 (s, 1H), 4.72 (s, 1H), 4.69 (d, J = 5.1 Hz, 1H), 4.66 (s, 1H), 4.53 (d, J = 4.6 Hz, 1H), 4.06 (dd, J = 6.6, 4.8 Hz, 1H), 3.86 (d, J = 12.2 Hz, 1H), 3.81–3.60 (m, 5H), 3.58–3.48 (m, 2H), 3.45 (s, 3H), 3.34 (d, J = 8.0 Hz, 1H), 3.15–2.85 (m, 7H), 2.70 (t, J = 11.8 Hz, 1H), 2.53 (s, 1H), 2.47–2.38 (m, 1H), 2.17 (dd, J = 11.9, 4.9 Hz, 1H), 2.13 (s, 3H), 1.97–1.72 (m, 4H), 1.63–1.51 (m, 3H), 1.37–1.26 (m, 12H), 1.26–1.21 (m, 6H), 1.14 (d, J = 6.5 Hz, 3H); HRMS m/z: calcd for C55H78NO24− [M − 1]−, 1136.4919; found, 1136.4927. 6Z: retention time 21.4 min; 1H NMR (500 MHz, methanol-d4): δ 6.88 (s, 1H), 6.76 (s, 1H), 5.32 (t, J = 9.3 Hz, 1H), 5.09 (t, J = 9.5 Hz, 1H), 4.96 (dd, J = 9.6, 2.1 Hz, 1H), 4.82 (d, J = 2.0 Hz, 1H), 4.77 (d, J = 2.4 Hz, 1H), 4.73–4.70 (m, 1H), 4.67–4.64 (m, 1H), 4.63 (d, J = 2.4 Hz, 1H), 4.58 (d, J = 9.4 Hz, 1H), 4.53 (d, J = 4.7 Hz, 1H), 4.19 (d, J = 6.2 Hz, 1H), 4.13 (p, J = 6.3 Hz, 1H), 4.07 (qd, J = 6.4, 4.5 Hz, 1H), 3.89–3.81 (m, 1H), 3.76–3.62 (m, 5H), 3.57–3.52 (m, 2H), 3.46 (s, 2H), 3.38–3.32 (m, 2H), 3.11–3.02 (m, 3H), 2.97–2.90 (m, 3H), 2.78 (t, J = 2.4 Hz, 1H), 2.52–2.46 (m, 1H), 2.45–2.41 (m, 1H), 2.18 (dd, J = 12.2, 4.9 Hz, 1H), 2.14 (s, 3H), 1.92–1.75 (m, 4H), 1.61–1.54 (m, 3H), 1.35–1.29 (m, 14H), 1.26–1.23 (m, 4H), 1.15 (d, J = 6.5 Hz, 3H); HRMS m/z: calcd for C55H78NO24− [M − 1]−, 1136.4919; found, 1136.4983.
(E)-3-(2′-Isobutoxyimino) MTM (MTMox7E) and (Z)-3-(2′-Isobutoxyimino) MTM (MTMox7Z).
MTM (55 mg, 50 μmol) and O-isobutyl hydroxylamine (18 mg, 0.2 mmol) gave 25.4 mg of 7E (22 μmol, 44% yield) and 4.1 mg of 7Z (35 μmol, 7% yield) as yellow solids. 7E: retention time 23.9 min; 1H NMR (500 MHz, methanol-d4): δ 6.91 (s, 1H), 6.77 (s, 1H), 5.31 (d, J = 9.6 Hz, 1H), 5.08 (d, J = 9.5 Hz, 1H), 4.95 (d, J = 9.6 Hz, 1H), 4.79 (d, J = 9.5 Hz, 1H), 4.74 (d, J = 9.6 Hz, 1H), 4.69 (t, J = 12.4 Hz, 2H), 4.56 (d, J = 4.4 Hz, 1H), 4.08 (q, J = 6.7 Hz, 1H), 3.95 (dd, J = 6.7, 3.5 Hz, 2H), 3.86 (d, J = 11.8 Hz, 1H), 3.80–3.60 (m, 6H), 3.58–3.48 (m, 3H), 3.43 (s, 3H), 3.14–2.88 (m, 7H), 2.70 (t, J = 11.9 Hz, 1H), 2.56 (d, J = 9.3 Hz, 1H), 2.41 (d, J = 10.5 Hz, 1H), 2.22–2.16 (m, 2H), 2.14 (s, 3H), 2.04 (dt, J = 13.3, 6.7 Hz, 1H), 1.97–1.72 (m, 4H), 1.65–1.51 (m, 4H), 1.36–1.28 (m, 12H), 1.26–1.22 (m, 6H), 1.14 (d, J = 6.7 Hz, 3H), 0.97 (d, J = 6.7 Hz, 6H). 13C NMR (100 MHz, methanol-d4): δ 205.7, 160.6, 157.2, 155.8, 145.6, 140.3, 138.2, 125.6, 118.5, 112.2, 110.0, 109.7, 109.1, 102.5, 102.1, 100.3, 99.2, 98.1, 82.0, 81.3, 81.1, 79.1, 78.8, 78.2, 77.6, 77.3, 76.9, 76.5, 73.9, 73.7, 73.5, 73.2, 72.4, 72.2, 72.1, 70.8, 69.3, 58.9, 45.5, 44.3, 41.0, 38.4, 38.2, 29.7, 27.0, 20.1, 19.9, 19.5, 19.0, 18.9, 18.7, 18.4, 17.3, 8.7; HRMS m/z: calcd for C56H84NO24− [M − 1]−, 1154.5389; found, 1154.5427. 7Z: retention time 23.1 min; 1H NMR (500 MHz, methanol-d4): δ 6.86 (s, 1H), 6.74 (s, 1H), 5.31 (d, J = 9.4 Hz, 1H), 5.11 (d, J = 9.6 Hz, 1H), 4.95 (d, J = 9.6 Hz, 1H), 4.94 (s, 1H), 4.71 (d, J = 9.5 Hz, 1H), 4.64 (d, J = 9.4 Hz, 1H), 4.57 (d, J = 9.8 Hz, 1H), 4.19 (d, J = 6.0 Hz, 1H), 4.13 (q, J = 6.0 Hz, 1H), 3.83–3.88 (m, 1H), 3.82 (d, J = 6.6 Hz, 2H), 3.71–3.66 (m, 2H), 3.62 (q, J = 7.2, 6.5 Hz, 1H), 3.58–3.53 (m, 2H), 3.51 (s, 3H), 3.16–2.98 (m, 3H), 2.98–2.88 (m, 3H), 2.59 (t, J = 11.7 Hz, 1H), 2.44 (t, J = 13.4 Hz, 2H), 2.17 (dd, J = 11.9, 4.8 Hz, 1H), 2.13 (s, 3H), 1.96–1.70 (m, 5H), 1.63–1.48 (m, 3H), 1.35–1.22 (m, 20H), 0.99 (d, J = 6.7 Hz, 1H), 0.87 (t, J = 7.3 Hz, 6H). 13C NMR (100 MHz, methanol-d4): δ 202.5, 164.6, 160.8, 159.6, 155.8, 138.8, 136.0, 117.0, 111.0, 108.2, 107.9, 107.7, 101.2, 100.2, 98.9, 98.8, 97.8, 96.7, 81.0, 79.8, 79.7, 77.1, 76.8, 76.7, 76.2, 75.5, 75.3, 75.2, 72.9, 72.5, 72.3, 72.2, 70.9, 70.8, 70.7, 69.4, 68.8, 59.6, 44.1, 43.3, 39.6, 37.1, 36.8, 34.7, 32.0, 28.3, 28.1, 27.7, 26.1, 19.1, 18.5, 17.6, 17.4, 17.3, 17.0, 15.9, 7.3; HRMS m/z: calcd for C56H84NO24− [M − 1]−, 1154.5389; found, 1154.5427.
(E)-3-(2′-tert-Butoxyimino) MTM (MTMox8E) and (Z)-3-(2′-tert-Butoxyimino) MTM (MTMox8Z).
MTM (26 mg, 23 μmol) and O-(tert-butyl)hydroxylamine (5 mg, 50 μmol) gave 10.4 mg of 8E (9 μmol, 39% yield) and 1.2 mg of 8Z (1.2 μmol, 5% yield) as yellow solids. 8E: retention time 24.7 min; 1H NMR (500 MHz, methanol-d4): δ 6.88 (s, 1H), 6.79 (s, 1H), 5.36 (d, J = 9.3 Hz, 1H), 5.07 (d, J = 9.8 Hz, 1H), 4.96 (d, J = 8.7 Hz, 1H), 4.77–4.62 (m, 4H), 4.52 (d, J = 5.4 Hz, 1H), 4.00 (p, J = 6.4 Hz, 1H), 3.89–3.82 (m, 1H), 3.82–3.60 (m, 5H), 3.58–3.49 (m, 2H), 3.41 (s, 3H), 3.36–3.33 (m, 1H), 3.14–3.00 (m, 4H), 2.94 (dt, J = 16.3, 7.9 Hz, 2H), 2.65 (s, 3H), 2.60 (d, J = 11.2 Hz, 1H), 2.56–2.49 (m, 1H), 2.44 (dd, J = 12.3, 5.0 Hz, 1H), 2.21–2.15 (m, 1H), 2.14 (s, 3H), 1.98–1.72 (m, 4H), 1.65–1.48 (m, 4H), 1.38–1.28 (m, 23H), 1.27–1.21 (m, 7H), 1.12 (d, J = 6.5 Hz, 3H); HRMS m/z: calcd for C56H84NO24− [M − 1]−, 1154.5389; found, 1154.5402. 8Z: retention time 23.4 min; 1H NMR (500 MHz, methanol-d4): δ 6.92 (s, 1H), 6.81 (s, 1H), 5.37 (dd, J = 9.7, 2.1 Hz, 1H), 5.09 (dd, J = 9.7, 1.9 Hz, 1H), 4.94 (dd, J = 9.7, 2.1 Hz, 1H), 4.83 (d, J = 5.2 Hz, 1H), 4.72 (dd, J = 9.7, 2.0 Hz, 1H), 4.63 (dd, J = 9.8, 2.3 Hz, 1H), 4.49 (d, J = 8.3 Hz, 1H), 4.19–4.07 (m, 2H), 3.87–3.74 (m, 2H), 3.74–3.58 (m, 4H), 3.58–3.49 (m, 2H), 3.44 (s, 3H), 3.36–3.31 (m, 1H), 3.19–2.98 (m, 4H), 2.98–2.87 (m, 3H), 2.61–2.52 (m, 1H), 2.45 (ddd, J = 12.3, 5.1, 2.1 Hz, 1H), 2.40 (ddd, J = 12.5, 5.3, 1.9 Hz, 1H), 2.18 (ddd, J = 12.5, 5.1, 1.9 Hz, 1H), 2.14 (s, 3H), 1.95–1.70 (m, 4H), 1.63–1.47 (m, 3H), 1.35 (d, J = 6.1 Hz, 3H), 1.33–1.27 (m, 10H), 1.26–1.20 (m, 20H). HRMS m/z: calcd for C56H84NO24− [M − 1]−, 1154.5389; found, 1154.5415.
(E)-3-[2′-(2-Trimethylsilylethoxy)imino] MTM (MTMox9E) and (Z)-3-[2′-(2-Trimethylsilylethoxy)imino] MTM (MTMox9Z).
MTM (11 mg, 10 μmol) and O-(2-trimethylsilylethyl)hydroxylamine (2.5 mg, 20 μmol) gave 5.1 mg of 9E (4.3 μmol, 43% yield) and 0.72 mg of 9Z (0.6 μmol, 5% yield) as yellow solids. 9E: retention time 26.6 min; 1H NMR (500 MHz, methanol-d4): δ 6.91 (s, 1H), 6.78 (s, 1H), 5.34 (d, J = 9.2 Hz, 1H), 5.09 (d, J = 9.2 Hz, 1H), 4.77 (d, J = 4.9 Hz, 1H), 4.73 (d, J = 3.8 Hz, 1H), 4.69 (d, J = 6.4 Hz, 1H), 4.64 (d, J = 16.5 Hz, 1H), 4.54 (d, J = 4.4 Hz, 1H), 4.32–4.14 (m, 2H), 4.11–4.01 (m, 1H), 3.86 (d, J = 11.8 Hz, 1H), 3.82–3.62 (m, 5H), 3.58–3.49 (m, 2H), 3.43 (s, 3H), 3.16–2.88 (m, 7H), 2.70 (t, J = 10.2 Hz, 1H), 2.55 (dd, J = 12.3, 5.2 Hz, 1H), 2.45 (dd, J = 11.2, 4.3 Hz, 1H), 2.17 (s, 1H), 2.14 (s, 3H), 2.00–1.71 (m, 4H), 1.64–1.51 (m, 3H), 1.37–1.29 (m, 12H), 1.27–1.22 (m, 6H), 1.13 (d, J = 6.4 Hz, 3H), 1.09 (t, J = 8.4 Hz, 2H), 0.09 (s, 9H); HRMS m/z: calcd for C57H88NO24Si− [M − 1]−, 1198.5471; found, 1198.5492. 9Z: retention time 25.1 min; 1H NMR (500 MHz, methanol-d4): δ 6.88 (s, 1H), 6.75 (s, 1H), 5.31 (d, J = 9.2 Hz, 1H), 5.06 (d, J = 9.2 Hz, 1H), 4.93 (dd, J = 9.3, 2.2 Hz, 2H), 4.75–4.62 (m, 4H), 4.51 (d, J = 4.5 Hz, 1H), 4.29–4.13 (m, 2H), 4.08–3.98 (m, 1H), 3.87–3.59 (m, 7H), 3.56–3.43 (m, 3H), 3.40 (s, 3H), 3.12–2.85 (m, 7H), 2.67 (s, 1H), 2.51 (s, 1H), 2.42 (dd, J = 11.5, 5.8 Hz, 1H), 2.15 (dd, J = 10.5, 5.2 Hz, 1H), 2.11 (s, 3H), 1.96–1.70 (m, 4H), 1.62–1.49 (m, 3H), 1.34–1.25 (m, 14H), 1.24–1.17 (m, 7H), 1.10 (d, J = 6.4 Hz, 3H), 1.06 (t, J = 8.4 Hz, 2H), 0.06 (s, 9H); HRMS m/z: calcd for C57H88NO24Si− [M − 1]−, 1198.5471; found, 1198.5502.
(E)-3-(2′-Benzyloxyimino) MTM (MTMox10E).
MTM (11 mg, 10 μmol) and O-benzylhydroxylamine (3 mg, 020 μmol) gave 6.5 mg (5.5 μmol, 55% yield) of the desired product as a yellow solid. Retention time 24.0 min; 1H NMR (500 MHz, methanol-d4): δ 7.46–7.31 (m, 5H), 6.77 (s, 1H), 6.76 (s, 1H), 5.35 (d, J = 9.5 Hz, 1H), 5.19 (d, J = 1.7 Hz, 2H), 5.06 (d, J = 9.7 Hz, 1H), 4.96 (d, J = 9.4 Hz, 2H), 4.78–4.68 (m, 4H), 4.67 (d, J = 9.3 Hz, 1H), 4.56 (d, J = 4.8 Hz, 1H), 4.09–3.97 (m, 1H), 3.91–3.76 (m, 2H), 3.76–3.60 (m, 4H), 3.59–3.49 (m, 2H), 3.35 (s, 5H), 3.14–3.06 (m, 2H), 3.03 (d, J = 8.9 Hz, 1H), 2.94 (q, J = 9.1 Hz, 4H), 2.55 (s, 2H), 2.45 (d, J = 13.2 Hz, 1H), 2.18 (dd, J = 12.2, 4.9 Hz, 1H), 2.14 (s, 3H), 1.99–1.71 (m, 4H), 1.64–1.50 (m, 3H), 1.39 (d, J = 6.1 Hz, 3H), 1.33–1.28 (m, 9H), 1.26–1.21 (m, 6H), 1.08 (d, J = 6.5 Hz, 3H); HRMS m/z: calcd for C59H82NO24− [M − 1]−, 1188.5232; found, 1188.5275.
(E)-3-[2′-(4-Methoxybenzyloxy)imino] MTM (MTMox11E) and (Z)-3-[2′-(4-Methoxybenzyloxy)imino] MTM (MTMox11Z).
MTM (50 mg, 46 μmol) and O-(4-methoxybenzyl)hydroxylamine (18 mg, 95 μmol) gave 25.0 mg of 11E (20.5 μmol, 45% yield) and 3.3 mg of 11Z (2.7 μmol, 6% yield) as yellow solids. 11E: retention time 23.8 min; 1H NMR (500 MHz, methanol-d4): δ 7.37 (d, J = 8.3 Hz, 2H), 6.94 (d, J = 8.3 Hz, 2H), 6.78 (s, 1H), 6.75 (s, 1H), 5.34 (d, J = 9.4 Hz, 1H), 5.11 (d, J = 2.4 Hz, 2H), 5.05 (d, J = 9.7 Hz, 1H), 4.96 (d, J = 9.5 Hz, 1H), 4.76–4.68 (m, 3H), 4.66 (d, J = 9.5 Hz, 1H), 4.52 (d, J = 5.0 Hz, 1H), 3.99 (p, J = 6.0 Hz, 1H), 3.85 (d, J = 12.6 Hz, 1H), 3.79 (d, J = 0.9 Hz, 3H), 3.76–3.47 (m, 6H), 3.36 (s, 3H), 3.34 (d, J = 3.0 Hz, 1H), 3.11 (t, J = 8.8 Hz, 1H), 3.02 (t, J = 8.8 Hz, 1H), 2.98–2.86 (m, 4H), 2.53 (d, J = 10.7 Hz, 2H), 2.45 (dd, J = 11.0, 5.1 Hz, 1H), 2.18 (dd, J = 12.2, 5.0 Hz, 1H), 2.14 (s, 3H), 1.98–1.69 (m, 4H), 1.64–1.50 (m, 3H), 1.38 (d, J = 6.0 Hz, 3H), 1.34–1.27 (m, 9H), 1.26–1.20 (m, 6H), 1.06 (d, J = 6.4 Hz, 3H); HRMS m/z: calcd for C60H84NO24− [M − 1]−, 1218.5338; found, 1218.5309. 11Z: retention time 22.7 min; 1H NMR (500 MHz, methanol-d4): δ 7.18 (d, J = 8.3 Hz, 2H), 6.79 (s, 1H), 6.75 (s, 1H), 6.71 (d, J = 8.4 Hz, 2H), 5.34 (d, J = 8.9 Hz, 1H), 5.05 (d, J = 9.3 Hz, 1H), 4.99–4.91 (m, 3H), 4.72 (dd, J = 9.8, 2.1 Hz, 2H), 4.64 (d, J = 9.3 Hz, 1H), 4.47 (d, J = 9.2 Hz, 1H), 4.14 (d, J = 6.1 Hz, 1H), 4.12–4.06 (m, 1H), 3.88–3.82 (m, 1H), 3.82–3.76 (m, 2H), 3.75–3.65 (m, 4H), 3.64–3.58 (m, 4H), 3.57–3.51 (m, 2H), 3.45 (s, 3H), 3.40–3.31 (m, 2H), 3.09 (t, J = 8.9 Hz, 1H), 3.05–2.98 (m, 2H), 2.96 (d, J = 8.9 Hz, 1H), 2.91 (d, J = 9.4 Hz, 1H), 2.87–2.80 (m, 1H), 2.49–2.37 (m, 3H), 1.97–1.72 (m, 5H), 1.61–1.46 (m, 3H), 1.35 (d, J = 6.1 Hz, 3H), 1.32–1.29 (m, 9H), 1.26–1.23 (m, 6H), 1.19 (d, J = 6.2 Hz, 3H); HRMS m/z: calcd for C60H84NO24− [M − 1]−, 1218.5338; found, 1218.5340.
(E)-3-[2′-(4-Nitrobenzyloxy)imino] MTM (MTMox12E).
MTM (25 mg, 23 μmol) and O-(4-nitrobenzyl)hydroxylamine (8 mg, 50 μmol) gave 12.1 mg (9.7 μmol, 41% yield) of the desired product as a yellow solid. Retention time 23.7 min; 1H NMR (500 MHz, methanol-d4): δ 8.32 (d, J = 8.7 Hz, 2H), 7.69 (d, J = 8.7 Hz, 2H), 6.66 (s, 1H), 6.45 (s, 1H), 5.48 (dd, J = 9.7, 2.2 Hz, 1H), 5.30 (s, 2H), 5.03 (dd, J = 9.7, 2.0 Hz, 1H), 4.96 (dd, J = 9.7, 2.1 Hz, 1H), 4.78 (d, J = 1.8 Hz, 1H), 4.74 (dd, J = 9.7, 2.0 Hz, 1H), 4.69–4.62 (m, 2H), 4.55 (d, J = 5.1 Hz, 1H), 4.06 (q, J = 5.1 Hz, 1H), 3.89–3.80 (m, 2H), 3.78–3.60 (m, 5H), 3.59–3.50 (m, 1H), 3.39–3.32 (m, 5H), 3.28–3.24 (m, 1H), 3.11 (t, J = 9.0 Hz, 1H), 3.02 (t, J = 8.9 Hz, 1H), 2.95 (t, J = 9.0 Hz, 1H), 2.91 (d, J = 9.4 Hz, 1H), 2.82–2.70 (m, 1H), 2.68–2.59 (m, 1H), 2.54 (ddd, J = 12.5, 5.2, 2.0 Hz, 1H), 2.51–2.44 (m, 2H), 2.19 (ddd, J = 12.4, 5.1, 2.0 Hz, 1H), 2.13 (s, 3H), 1.96–1.91 (m, 1H), 1.89 (dd, J = 13.7, 2.1 Hz, 1H), 1.86–1.82 (m, 1H), 1.82–1.72 (m, 1H), 1.63–1.52 (m, 3H), 1.37 (d, J = 6.1 Hz, 3H), 1.34–1.27 (m, 10H), 1.26–1.22 (m, 7H), 1.13 (d, J = 6.4 Hz, 3H); HRMS m/z: calcd for C59H81N2O26− [M − 1]−, 1233.5083; found, 1233.5128.
(E)-3-{2′-[2-(1H-Indol-3-yl)ethoxy]imino} MTM (MTMox13E) and (Z)-3-{2′-[2-(1H-Indol-3-yl)ethoxy]imino} MTM (MTMox13Z).
MTM (50 mg, 46 μmol) and O-[2-(1H-indol-3-yl) ethyl]hydroxylamine (20 mg, 0.9 mmol) gave 29.1 mg of 13E (23.4 μmol, 51% yield) and 5.1 mg of 13Z (4.1 μmol, 9% yield) as yellow solids. 13E: retention time 24.2 min; 1H NMR (500 MHz, methanol-d4): δ 7.61 (d, J = 7.9 Hz, 1H), 7.34 (d, J = 8.0 Hz, 1H), 7.14–7.06 (m, 2H), 7.02 (t, J = 7.5 Hz, 1H), 6.87 (s, 1H), 6.71 (s, 1H), 5.24 (d, J = 9.2 Hz, 1H), 5.07 (d, J = 9.6 Hz, 1H), 4.97 (d, J = 9.5 Hz, 1H), 4.78–4.56 (m, 4H), 4.52–4.37 (m, 3H), 4.06–3.95 (m, 1H), 3.84 (m, 1H), 3.76–3.65 (m, 4H), 3.63–3.51 (m, 2H), 3.49–3.41 (m, 4H), 3.17 (t, J = 7.0 Hz, 2H), 3.12–2.86 (m, 6H), 2.69 (t, J = 12.7 Hz, 1H), 2.55 (d, J = 9.7 Hz, 1H), 2.44–2.31 (m, 1H), 2.20–2.08 (m, 4H), 1.97–1.68 (m, 4H), 1.65–1.48 (m, 3H), 1.37–1.27 (m, 12H), 1.27–1.21 (m, 6H), 1.06 (d, J = 6.4 Hz, 3H). 13C NMR (100 MHz, methanol-d4): δ 203.5, 163.6, 159.2, 158.8, 155.2, 138.3, 136.6, 136.4, 127.4, 122.3, 120.9, 118.2, 117.9, 116.6, 111.0, 110.8, 110.4, 108.0, 107.3, 100.8, 100.4, 98.5, 98.5, 97.4, 96.2, 79.7, 79.6, 77.5, 76.6, 76.4, 76.0, 75.8, 75.1, 74.7, 74.1, 72.1, 72.0, 71.8, 70.5, 70.5, 70.4, 70.3, 68.9, 67.9, 57.3, 43.7, 42.8, 39.3, 36.8, 36.4, 31.6, 26.6, 25.8, 25.1, 18.6, 17.4, 17.3, 17.2, 16.7, 15.6, 7.2; HRMS m/z: calcd for C62H85N2O24− [M − 1]−, 1241.5498; found, 1241.5498. 13Z: retention time 22.8 min; 1H NMR (500 MHz, methanol-d4): δ 7.47 (d, J = 7.7 Hz, 1H), 7.22 (d, J = 8.0 Hz, 1H), 7.08 (s, 1H), 7.01–6.86 (m, 2H), 6.54 (s, 1H), 6.47 (s, 1H), 5.20 (d, J = 9.3 Hz, 1H), 5.15–4.95 (m, 6H), 4.74 (d, J = 10.2 Hz, 2H), 4.54 (d, J = 10.0 Hz, 1H), 4.49–4.23 (m, 3H), 4.22–4.07 (m, 2H), 3.88–3.67 (m, 2H), 3.61–3.42 (m, 6H), 3.41–3.34 (m, 2H), 3.23–3.01 (m, 4H), 2.99–2.89 (m, 3H), 2.79–2.68 (m, 1H), 2.66–2.51 (m, 2H), 2.47–2.38 (m, 1H), 2.26–2.07 (m, 4H), 1.95–1.78 (m, 3H), 1.72–1.51 (m, 4H), 1.43–1.23 (m, 18H), 1.22–1.16 (m, 3H); 13C NMR (100 MHz, methanol-d4): δ 202.2, 160.9, 158.6, 155.2, 138.1, 136.4, 135.2, 127.5, 122.2, 120.8, 118.2, 118.1, 116.6, 111.3, 110.7, 110.4, 107.6, 107.3, 100.9, 100.0, 98.5, 98.3, 97.3, 96.4, 79.6, 79.5, 76.7, 76.4, 75.6, 75.1, 74.7, 72.5, 72.2, 72.0, 71.9, 70.6, 70.4, 70.3, 68.9, 68.5, 59.3, 43.8, 43.1, 39.3, 36.9, 36.6, 31.6, 27.4, 25.8, 24.6, 18.9, 18.5, 17.3, 17.2, 17.1, 16.7, 15.5, 7.2; HRMS m/z: calcd for C62H85N2O24− [M − 1]−, 1241.5498; found, 1241.5472.
(E)-3-{2′-[3-(1H-Indol-3-yl)propoxy]imino} MTM (MTMox14E).
MTM (26 mg, 24 μmol) and O-[3-(1H-indol-3-yl)propyl]-hydroxylamine (11 mg, 50 μmol) gave 9.7 mg (7.7 μmol, 32% yield) of the desired product as a yellow solid. Retention time 24.8 min; 1H NMR (500 MHz, methanol-d4): δ 7.56 (d, J = 7.8 Hz, 1H), 7.34 (d, J = 8.3 Hz, 1H), 7.03–7.12 (m, 2H), 6.98 (t, J = 7.1 Hz, 1H), 6.83 (s, 1H), 6.63 (s, 1H), 5.20 (d, J = 9.7 Hz, 1H), 5.06 (d, J = 9.4 Hz, 1H), 4.97 (d, J = 9.7 Hz, 1H), 4.80 (s, 1H), 4.70 (t, J = 8.3 Hz, 2H), 4.57–4.64 (m, 2H), 4.18–4.30 (m, 2H), 4.09–4.17 (m, 1H), 3.80–3.89 (m, 1H), 3.65–3.76 (m, 4H), 3.50–3.64 (m, 2H), 3.22–3.49 (m, 5H), 2.99–3.16 (m, 4H), 2.85–2.99 (m, 4H), 2.64–2.76 (m, 1H), 2.50–2.59 (m, 1H), 2.31–2.43 (m, 1H), 2.03–2.25 (m, 6H), 1.87–1.98 (m, 2H), 1.70–1.86 (m, 2H), 1.51–1.65 (m, 4H), 1.20–1.39 (m, 18H), 1.18 (d, J = 6.2 Hz, 3H); 13C NMR (100 MHz, methanol-d4): δ 203.6, 163.8, 159.2, 159.0, 155.4, 138.4, 136.8, 136.4, 127.4, 121.5, 120.8, 118.1, 118.0, 116.7, 114.4, 110.8, 110.5, 108.1, 107.4, 100.7, 100.4, 98.5, 98.5, 97.5, 96.2, 79.5, 79.4, 77.5, 76.7, 76.4, 75.9, 75.2, 74.8, 73.5, 72.2, 71.9, 71.8, 71.7, 70.6, 70.5, 70.4, 70.3, 69.0, 67.9, 57.3, 43.8, 42.7, 39.3, 36.7, 36.4, 31.7, 30.1, 26.5, 25.8, 21.3, 18.7, 17.3, 17.2, 17.0, 16.7, 15.6, 7.0; HRMS m/z: calcd for C63H87N2O24, [M − 1]−, 1255.5654; found, 1255.5675.
(E)-3-{2′-[4-(1H-Indol-3-yl)butoxy]imino} MTM (MTMox15E).
MTM (26 mg, 24 μmol) and O-[4-(1H-indol-3-yl)butyl]-hydroxylamine (11 mg, 50 μmol) gave 10.9 mg (8.6 μmol, 36% yield) of the desired product as a yellow solid. Retention time 25.4 min; 1H NMR (500 MHz, methanol-d4): δ 7.53 (d, J = 7.4 Hz, 1H), 7.30 (d, J = 8.2 Hz, 1H), 7.06 (t, J = 7.8 Hz, 1H), 7.02 (s, 1H), 6.96 (t, J = 7.1 Hz, 1H), 6.88–6.92 (m, 1H), 6.64–6.69 (m, 1H), 5.03–5.18 (m, 2H), 4.97 (d, J = 9.7 Hz, 1H), 4.61–4.80 (m, 4H), 4.51 (d, J = 4.6 Hz, 1H), 4.12–4.28 (m, 2H), 4.00–4.09 (m, 1H), 3.81–3.90 (m, 1H), 3.43–3.77 (m, 7H), 2.90–3.15 (m, 6H), 2.80–2.89 (m, 2H), 2.60–2.72 (m, 1H), 2.50–2.59 (m, 1H), 2.31–2.43 (m, 1H), 2.08–2.22 (m, 4H), 1.70–1.99 (m, 8H), 1.51–1.65 (m, 4H), 1.20–1.39 (m, 18H), 1.10 (d, J = 6.6 Hz, 3H); 13C NMR (100 MHz, methanol-d4): δ 203.6, 163.8, 159.0, 155.3, 138.4, 136.7, 136.5, 127.4, 121.4, 120.7, 118.0, 118.0, 116.7, 114.9, 110.7, 110.5, 108.1, 107.4, 100.8, 100.4, 98.5, 97.4, 96.2, 79.5, 79.4, 77.5, 76.7, 76.4, 75.9, 75.7, 75.2, 74.7, 73.8, 72.2, 71.8, 70.5, 70.4, 70.3, 69.0, 67.9, 57.2, 43.8, 42.9, 39.3, 36.7, 36.4, 31.6, 29.0, 26.8, 26.5, 25.8, 24.7, 18.6, 17.3, 17.2, 17.0, 16.7, 15.6, 7.0; HRMS m/z: calcd for C64H89N2O24− [M − 1]−, 1269.5811; found, 1269.5851.
(E)-3-{2′-[2-Oxo-2-(phenylamino)ethoxy]imino} MTM (MTMox16E).
MTM (11 mg, 10 μmol) and 2-(aminooxy)-N-phenylacetamide (5 mg, 20 μmol) gave 6.1 mg (4.9 μmol, 49% yield) of the desired product as a yellow solid. Retention time 22.2 min; 1H NMR (500 MHz, methanol-d4): δ 7.69 (dd, J = 8.7, 1.2 Hz, 2H), 7.27 (t, J = 7.4, 1.2 Hz, 2H), 7.15 (t, J = 7.4 Hz, 1H), 6.36 (s, 1H), 6.09 (s, 1H), 5.33 (dd, J = 9.7, 2.1 Hz, 1H), 5.08 (dd, J = 9.7, 1.9 Hz, 1H), 4.97 (dd, J = 9.7, 2.1 Hz, 1H), 4.79–4.76 (m, 3H), 4.75–4.71 (m, 1H), 4.68 (dd, J = 9.7, 2.3 Hz, 1H), 4.56 (d, J = 1.8 Hz, 1H), 4.47 (p, J = 6.5 Hz, 1H), 3.94 (d, J = 7.0 Hz, 1H), 3.90–3.83 (m, 2H), 3.74 (ddd, J = 8.6, 6.9, 4.3 Hz, 1H), 3.72–3.63 (m, 3H), 3.58–3.53 (m, 2H), 3.45 (d, J = 1.6 Hz, 3H), 3.40–3.33 (m, 2H), 3.12 (t, J = 8.9 Hz, 1H), 3.04 (t, J = 8.9 Hz, 1H), 2.93 (ddd, J = 16.8, 10.8, 6.1 Hz, 3H), 2.86–2.78 (m, 1H), 2.58 (ddd, J = 8.5, 4.3, 2.3 Hz, 1H), 2.53–2.49 (m, 1H), 2.20 (ddd, J = 12.5, 5.1, 2.0 Hz, 1H), 2.12 (s, 3H), 1.96–1.77 (m, 4H), 1.62–1.55 (m, 3H), 1.36–1.29 (m, 12H), 1.26–1.23 (m, 6H), 1.21 (d, J = 6.6 Hz, 3H); HRMS m/z: calcd for C60H83N2O25− [M − 1]−, 1231.5290; found, 1231.5260.
(E)-3-{2′-[2-Oxo-2-(pyridin-4-ylamino)ethoxy]imino} MTM (MTMox17E).
MTM (25 mg, 23 μmol) and 2-(aminooxy)-N-(pyridin-4-yl)acetamide (8 mg, 46 μmol) gave 10.5 mg (8.5 μmol, 37% yield) of the desired product as a yellow solid. Retention time 17.1 min; 1H NMR (500 MHz, methanol-d4): δ 8.36 (d, J = 5.2 Hz, 2H), 7.76 (d, J = 5.2 Hz, 2H), 6.30 (s, 1H), 5.91 (s, 1H), 5.45 (dd, J = 9.7, 2.1 Hz, 1H), 5.08 (dd, J = 9.7, 2.0 Hz, 1H), 4.97 (dd, J = 9.7, 2.1 Hz, 1H), 4.82 (s, 2H), 4.78 (dd, J = 9.8, 2.0 Hz, 1H), 4.74 (d, J = 11.6 Hz, 1H), 4.68 (dd, J = 9.9, 2.3 Hz, 1H), 4.56 (s, 1H), 4.49 (p, J = 6.5 Hz, 1H), 4.00–3.94 (m, 1H), 3.91 (d, J = 7.2 Hz, 1H), 3.86 (ddd, J = 12.2, 4.9, 2.9 Hz, 1H), 3.79–3.59 (m, 5H), 3.59–3.50 (m, 1H), 3.44 (s, 3H), 3.39–3.33 (m, 1H), 3.27–3.24 (m, 1H), 3.15 (s, 1H), 3.12 (t, J = 8.9 Hz, 1H), 3.04 (t, J = 8.9 Hz, 1H), 2.98–2.88 (m, 3H), 2.73 (dd, J = 16.5, 3.7 Hz, 1H), 2.61–2.48 (m, 3H), 2.20 (ddd, J = 12.5, 5.1, 2.0 Hz, 1H), 2.12 (s, 3H), 1.99–1.72 (m, 5H), 1.64–1.53 (m, 4H), 1.36 (d, J = 6.1 Hz, 3H), 1.34–1.27 (m, 12H), 1.27–1.23 (m, 7H), 1.22 (d, J = 6.5 Hz, 3H); HRMS m/z: calcd for C59H82N3O25− [M − 1]−, 1232.5243; found, 1232.5293.
(E)-3-{2′-[2-Oxo-2-(pyridin-3-ylamino)ethoxy]imino} MTM (MTMox18E).
MTM (25 mg, 23 μmol) and 2-(aminooxy)-N-(pyridin-3-yl)acetamide (8 mg, 46 μmol) gave 10.9 mg (8.9 μmol, 41% yield) of the desired product as a yellow solid. Retention time 19.2 min; 1H NMR (500 MHz, methanol-d4): δ 9.06 (dd, J = 2.5, 0.7 Hz, 1H), 8.31 (dd, J = 5.0, 1.4 Hz, 1H), 8.27 (dd, J = 8.5, 2.5 Hz, 1H), 7.50 (dd, J = 8.5, 5.1 Hz, 1H), 6.47 (s, 1H), 6.28 (d, J = 1.3 Hz, 1H), 5.36 (dd, J = 9.7, 2.1 Hz, 1H), 5.07 (dd, J = 9.8, 2.0 Hz, 1H), 4.97 (dd, J = 9.7, 2.1 Hz, 1H), 4.76 (dd, J = 9.7, 2.0 Hz, 1H), 4.72 (d, J = 11.4 Hz, 1H), 4.68 (dd, J = 9.8, 2.3 Hz, 1H), 4.61 (d, J = 1.8 Hz, 1H), 4.43 (p, J = 6.5 Hz, 1H), 4.10 (d, J = 6.4 Hz, 1H), 3.92–3.83 (m, 2H), 3.79–3.61 (m, 5H), 3.61–3.51 (m, 2H), 3.44 (s, 3H), 3.39–3.34 (m, 1H), 3.12 (t, J = 8.9 Hz, 1H), 3.04 (t, J = 8.9 Hz, 1H), 3.00–2.90 (m, 3H), 2.90–2.82 (m, 1H), 2.61–2.54 (m, 2H), 2.51 (td, J = 12.3, 4.6 Hz, 1H), 2.20 (dd, J = 12.5, 5.1 Hz, 1H), 2.13 (s, 3H), 1.97–1.75 (m, 4H), 1.66–1.54 (m, 3H), 1.36–1.28 (m, 13H), 1.27–1.21 (m, 10H); HRMS m/z: calcd for C59H82N3O25− [M − 1]−, 1232.5243; found, 1232.5301.
(E)-3-{2′-[2-Oxo-2-(pyrimidin-5-ylamino)ethoxy]imino} MTM (MTMox19E).
MTM (25 mg, 23 μmol) and 2-(aminooxy)-N-(pyrimidin-5-yl)acetamide (8 mg, 46 μmol) gave 10.2 mg (8.3 μmol, 36% yield) of the desired product as a yellow solid. Retention time 20.7 min; 1H NMR (500 MHz, methanol-d4): δ 9.10 (s, 2H), 8.77 (s, 1H), 6.40 (s, 1H), 6.00 (s, 1H), 5.36 (dd, J = 9.8, 2.1 Hz, 1H), 5.04 (dd, J = 9.7, 2.0 Hz, 1H), 4.97 (dd, J = 9.7, 2.1 Hz, 1H), 4.86 (d, J = 3.4 Hz, 2H), 4.77 (dd, J = 9.8, 2.0 Hz, 1H), 4.70–4.64 (m, 2H), 4.56 (d, J = 1.7 Hz, 1H), 4.46 (p, J = 6.5 Hz, 1H), 3.96 (d, J = 7.0 Hz, 1H), 3.92–3.83 (m, 2H), 3.78–3.61 (m, 6H), 3.58–3.51 (m, 1H), 3.45 (s, 3H), 3.40–3.32 (m, 3H), 3.14 (t, J = 8.9 Hz, 1H), 3.04 (t, J = 8.9 Hz, 1H), 2.98–2.86 (m, 3H), 2.73 (dd, J = 16.6, 3.7 Hz, 1H), 2.61–2.55 (m, 1H), 2.52–2.42 (m, 2H), 2.20 (dd, J = 12.5, 2.0 Hz, 1H), 2.09 (s, 3H), 1.97–1.74 (m, 5H), 1.62–1.55 (m, 3H), 1.38 (d, J = 6.1 Hz, 3H), 1.35–1.29 (m, 10H), 1.26–1.20 (m, 10H); HRMS m/z: calcd for C58H81N4O25− [M − 1]−, 1233.5195; found, 1233.5199.
(E)-3-{2′-[2-(Benzylamino)-2-oxoethoxy]imino} MTM (MTMox20E).
MTM (25 mg, 23 μmol) and 2-(aminooxy)-N-benzylacetamide (9 mg, 46 μmol) gave 17.4 mg (14.0 μmol, 61% yield) of the desired product as a yellow solid. Retention time 21.9 min; 1H NMR (500 MHz, methanol-d4): δ 8.53 (t, J = 6.1 Hz, 1H), 7.31 (d, J = 6.8 Hz, 2H), 7.25 (t, J = 7.6 Hz, 2H), 7.17 (t, J = 7.6 Hz, 1H), 6.74 (s, 1H), 6.68 (s, 1H), 5.26 (dd, J = 9.7, 2.1 Hz, 1H), 5.06 (dd, J = 9.7, 2.0 Hz, 1H), 4.97 (dd, J = 9.7, 2.1 Hz, 1H), 4.73–4.63 (m, 7H), 4.57–4.48 (m, 1H), 4.43 (dd, J = 14.9, 5.4 Hz, 1H), 4.31–4.22 (m, 2H), 3.86 (ddd, J = 12.1, 4.8, 2.9 Hz, 1H), 3.78–3.62 (m, 6H), 3.57–3.51 (m, 1H), 3.51–3.44 (m, 1H), 3.36 (s, 3H), 3.35–3.33 (m, 1H), 3.08 (t, J = 8.9 Hz, 1H), 3.03 (t, J = 8.9 Hz, 1H), 2.99–2.90 (m, 4H), 2.57 (dtt, J = 13.9, 5.6, 2.0 Hz, 2H), 2.40 (ddd, J = 12.3, 5.2, 2.1 Hz, 1H), 2.17 (ddd, J = 12.5, 5.1, 2.0 Hz, 1H), 2.13 (s, 3H), 1.94 (ddd, J = 12.2, 4.8, 2.2 Hz, 1H), 1.90 (dd, J = 13.7, 2.1 Hz, 1H), 1.87–1.73 (m, 2H), 1.63–1.53 (m, 3H), 1.36–1.28 (m, 14H), 1.27–1.22 (m, 7H), 1.16 (d, J = 6.2 Hz, 3H); HRMS m/z: calcd for C61H85N2O25− [M − 1]−, 1245.5447; found, 1245.5465.
(E)-3-{2′-[2-Oxo-2-(phenethylamino)ethoxy]imino} MTM (MTMox21E).
MTM (11 mg, 10 μmol) and 2-(aminooxy)-N-phenethylacetamide (5 mg, 20 μmol) gave 7.1 mg (5.6 μmol, 56% yield) of the desired product as a yellow solid. Retention time 22.0 min; 1H NMR (500 MHz, methanol-d4): δ 7.19–7.15 (m, 3H), 7.09 (dd, J = 8.0, 1.6 Hz, 2H), 6.83 (s, 1H), 6.53 (s, 1H), 5.09 (dd, J = 9.8, 2.0 Hz, 1H), 5.00 (dd, J = 9.6, 1.9 Hz, 1H), 4.98–4.95 (m, 1H), 4.74 (dt, J = 10.6, 2.8 Hz, 2H), 4.69–4.66 (m, 1H), 4.65–4.60 (m, 3H), 4.30 (p, J = 6.4 Hz, 1H), 4.12 (d, J = 6.1 Hz, 1H), 3.86 (ddd, J = 12.1, 4.8, 2.9 Hz, 1H), 3.77–3.64 (m, 5H), 3.59–3.46 (m, 3H), 3.43 (s, 3H), 3.37 (dd, J = 9.2, 6.2 Hz, 1H), 3.34 (s, 2H), 3.26 (t, J = 1.6 Hz, 1H), 3.16 (dt, J = 3.3, 1.6 Hz, 1H), 3.07–3.01 (m, 4H), 2.98–2.90 (m, 3H), 2.86–2.71 (m, 3H), 2.60–2.54 (m, 2H), 2.39 (ddd, J = 12.3, 5.3, 2.1 Hz, 1H), 2.18 (ddd, J = 12.5, 5.1, 1.9 Hz, 1H), 2.12 (s, 3H), 1.96–1.87 (m, 3H), 1.81–1.71 (m, 2H), 1.62–1.54 (m, 4H), 1.34–1.27 (m, 12H), 1.26–1.23 (m, 8H), 1.18 (d, J = 6.4 Hz, 3H); HRMS m/z: calcd for C62H87N2O25− [M − 1]−, 1259.5603; found, 1259.5668.
(E)-3-[(2′-(2-{[2-(1H-Indol-3-yl)ethyl]amino)}−2-oxoethoxy)imino] MTM (MTMox22E).
MTM (50 mg, 46 μmol) and N-[2-(1H-indol-3-yl)ethyl]-2-(aminooxy)acetamide (24 mg, 90 μmol) gave 30.0 mg (23.1 μmol, 50% yield) of the desired product as a yellow solid. Retention time 21.8 min; 1H NMR (500 MHz, methanol-d4): δ 8.37 (s, 1H), 7.28 (d, J = 8.0 Hz, 1H), 7.23 (d, J = 8.1 Hz, 1H), 6.96 (t, J = 7.8 Hz, 1H), 6.82 (s, 1H), 6.73 (t, J = 7.5 Hz, 1H), 6.56 (s, 1H), 6.10 (s, 1H), 4.95 (d, J = 9.5 Hz, 1H), 4.90 (d, J = 9.5 Hz, 2H), 4.69–4.44 (m, 7H), 4.28 (t, J = 6.4 Hz, 1H), 4.22 (d, J = 9.9 Hz, 1H), 3.94 (d, J = 6.6 Hz, 1H), 3.73 (d, J = 9.9 Hz, 1H), 3.68–3.39 (m, 7H), 3.38–3.31 (m, 4H), 3.29–3.20 (m, 2H), 3.03–2.71 (m, 10H), 2.58–2.37 (m, 2H), 2.11 (dd, J = 11.8, 4.9 Hz, 2H), 1.95 (s, 3H), 1.85 (d, J = 13.5 Hz, 2H), 1.76–1.58 (m, 2H), 1.57–1.44 (m, 4H), 1.32–1.27 (m, 6H), 1.23–1.14 (m, 14H), 1.11 (d, J = 6.3 Hz, 3H). 13C NMR (100 MHz, methanol-d4): δ 203.4, 171.7, 164.1, 160.8, 159.1, 155.5, 138.4, 136.84, 136.1, 127.5, 122.5, 121.3, 118.6, 118.4, 117.3, 111.9, 111.2, 110.6, 108.2, 107.5, 101.4, 101.1, 99.0, 98.7, 97.8, 96.5, 79.9, 79.5, 78.1, 77.9, 77.1, 76.8, 76.2, 75.5, 74.9, 74.7, 73.0, 72.6, 72.2, 71.8, 71.0, 70.9, 70.8, 70.7, 69.3, 68.6, 57.7, 44.1, 42.9, 40.3, 39.7, 37.2, 36.6, 32.0, 26.7, 26.2, 25.9, 19.3, 18.7, 17.7, 17.6, 17.4, 17.2, 17.1, 16.0, 7.53; HRMS m/z: calcd for C64H88N3O25− [M − 1]−, 1298.5712; found, 1298.5764.
(E)-3-(2′-{2-[(Methyl l-Phenylalaninate)amino]-2-oxoethoxy}-imino) MTM (MTMox23E).
MTM (25 mg, 23 μmol) and methyl [2-(aminooxy)acetyl]-l-phenylalaninate (13 mg, 46 μmol) gave 20.1 mg (15.2 μmol, 66% yield) of the desired product as a yellow solid. Retention time 20.8 min; 1H NMR (500 MHz, methanol-d4): δ 8.32 (d, J = 7.6 Hz, 1H), 7.27–7.20 (m, 2H), 7.19–7.15 (m, 3H), 6.91 (s, 1H), 6.70 (s, 1H), 5.25 (d, J = 9.6 Hz, 1H), 5.07 (d, J = 9.6 Hz, 1H), 4.96 (dd, J = 9.7, 2.0 Hz, 1H), 4.78–4.59 (m, 7H), 4.27–4.17 (m, 2H), 3.86 (d, J = 11.8 Hz, 1H), 3.79–3.60 (m, 7H), 3.56 (s, 3H), 3.54–3.51 (m, 1H), 3.48–3.42 (m, 1H), 3.40 (s, 3H), 3.38–3.32 (m, 2H), 3.19–3.00 (m, 6H), 2.98–2.90 (m, 3H), 2.66–2.52 (m, 2H), 2.43 (d, J = 11.3 Hz, 1H), 2.21–2.12 (m, 4H), 1.96–1.75 (m, 5H), 1.63–1.52 (m, 3H), 1.34–1.28 (m, 12H), 1.26–1.22 (m, 6H), 1.15 (d, J = 5.9 Hz, 3H). 13C NMR (100 MHz, methanol-d4): δ 203.8, 172.0, 171.4, 164.2, 161.5, 159.5, 155.8, 138.9, 136.9, 136.8, 129.3, 129.2, 128.6, 128.5, 127.0, 117.2, 111.0, 108.5, 107.9, 101.1, 100.9, 99.0, 98.8, 97.9, 96.9, 79.9, 79.6, 77.7, 77.4, 77.2, 76.8, 76.3, 75.6, 75.2, 73.8, 72.6, 72.5, 72.3, 71.0, 70.9, 70.7, 69.5, 68.6, 57.8, 54.1, 51.7, 44.2, 42.9, 39.7, 37.6, 37.1, 36.8, 32.1, 26.6, 26.2, 18.8, 17.7, 17.6, 17.5, 17.1, 16.0, 7.4; HRMS m/z: calcd for C64H89N2O27− [M − 1]−, 1317.5658; found, 1317.5725.
(E)-3-(2′-{2-[(Methyl d-Phenylalaninate)amino]-2-oxoethoxy}-imino) MTM (MTMox24E).
MTM (11 mg, 10 μmol) and methyl (2-(aminooxy) acetyl)-d-phenylalaninate (6 mg, 20 μmol) gave 7.1 mg (5.3 μmol, 53% yield) of the desired product as a yellow solid. Retention time 22.5 min; 1H NMR (500 MHz, methanol-d4): δ 7.20–7.15 (m, 3H), 7.08 (dd, J = 7.8, 1.7 Hz, 2H), 6.85 (s, 1H), 6.67 (s, 1H), 5.19 (dd, J = 9.7, 2.1 Hz, 1H), 5.09 (dd, J = 9.7, 2.0 Hz, 1H), 4.96 (dd, J = 9.6, 2.1 Hz, 1H), 4.75–4.70 (m, 3H), 4.70–4.58 (m, 5H), 4.30–4.22 (m, 1H), 4.19 (d, J = 5.8 Hz, 1H), 3.86 (ddd, J = 12.1, 4.9, 2.9 Hz, 1H), 3.80–3.72 (m, 2H), 3.70–3.64 (m, 3H), 3.62 (s, 3H), 3.58–3.53 (m, 1H), 3.48–3.43 (m, 1H), 3.41 (s, 3H), 3.38–3.32 (m, 2H), 3.07–3.02 (m, 4H), 2.99–2.91 (m, 3H), 2.62–2.54 (m, 2H), 2.43 (ddd, J = 12.3, 5.1, 2.0 Hz, 1H), 2.18 (ddd, J = 12.5, 5.1, 2.0 Hz, 1H), 2.14 (s, 3H), 1.97–1.88 (m, 2H), 1.85–1.73 (m, 2H), 1.63–1.53 (m, 4H), 1.31 (dd, J = 11.4, 6.3 Hz, 12H), 1.26–1.23 (m, 6H), 1.16 (d, J = 6.4 Hz, 3H); HRMS m/z: calcd for C64H89N2O27− [M − 1]−, 1317.5658; found, 1317.5677.
(E)-3-(2′-{2-[(Methyl l-Tryptophanate)amino]-2-oxoethoxy}-imino) MTM (MTMox25E).
MTM (18 mg, 16 μmol) and methyl [2-(aminooxy)acetyl]-l-tryptophanate (12 mg, 45 μmol) gave 19.8 mg (14.6 μmol, 91% yield) of the desired product as a yellow solid. Retention time 22.5 min; 1H NMR (500 MHz, methanol-d4): δ 7.44 (d, J = 8.0 Hz, 1H), 7.29 (d, J = 8.2 Hz, 1H), 7.09 (s, 1H), 7.04 (t, J = 7.9 Hz, 1H), 6.94 (s, 1H), 6.91 (t, J = 13.5, 6.0 Hz, 1H), 6.64 (s, 1H), 5.14 (d, J = 8.8 Hz, 1H), 5.08 (d, J = 9.6 Hz, 1H), 4.96 (dd, J = 9.6 Hz, J = 0.9 Hz 1H), 4.76–4.69 (m, 2H), 4.69–4.50 (m, 5H), 4.26–4.13 (m, 2H), 3.90–3.82 (m, 1H), 3.78–3.60 (m, 5H), 3.60–3.42 (m, 5H), 3.41–3.35 (m, 5H), 3.19–3.27 (m, 2H), 3.17–2.87 (m, 6H), 2.69–2.51 (m, 2H), 2.47–2.34 (m, 1H), 2.22–2.10 (m, 4H), 2.00–1.69 (m, 4H), 1.66–1.50 (m, 3H), 1.36–1.27 (m, 12H), 1.28–1.22 (m, 7H), 1.12 (d, J = 6.0 Hz, 3H); 13C NMR (100 MHz, methanol-d4): δ 203.2, 172.0, 170.9, 163.7, 161.0, 159.0, 155.3, 138.4, 136.5, 136.3, 127.2, 123.1, 121.0, 118.4, 117.7, 116.8, 110.9, 110.5, 108.8, 108.0, 107.4, 100.7, 100.5, 98.5, 98.4, 97.4, 96.4, 79.5, 79.3, 77.3, 77.0, 76.7, 76.4, 75.9, 75.1, 74.7, 73.3, 72.3, 72.2, 71.9, 71.8, 70.6, 70.5, 70.4, 70.3, 68.9, 68.1, 57.3, 53.3, 51.3, 43.7, 42.5, 39.2, 36.7, 36.4, 31.6, 27.3, 26.1, 25.8, 18.3, 17.3, 17.2, 17.0, 16.7, 15.5, 7.0; HRMS m/z: calcd for C66H91N3O27Na+ [M + Na]+, 1380.5732; found, 1380.5744.
(E)-3-(2′-{2-[(Methyl N-1-Methyl-l-tryptophanate)amino]-2-oxoethoxy}imino) MTM (MTMox26E).
MTM (25 mg, 23 μmol) and methyl N-[2-(aminooxy)acetyl]-1-methyl-l-tryptophanate (16 mg, 46 μmol) gave 15.5 mg (11.3 μmol, 49% yield) of the desired product as a yellow solid. Retention time 23.0 min; 1H NMR (500 MHz, methanol-d4): δ 8.42 (d, J = 7.5 Hz, 1H), 7.41 (d, J = 7.7 Hz, 1H), 7.25 (d, J = 8.1 Hz, 1H), 7.11 (t, J = 7.5 Hz, 1H), 6.94 (t, J = 7.5 Hz, 1H), 6.74 (s, 1H), 6.71 (s, 1H), 6.40 (s, 1H), 5.08 (d, J = 9.5 Hz, 1H), 4.98 (d, J = 9.3 Hz, 1H), 4.73–4.64 (m, 6H), 4.26 (p, J = 6.1 Hz, 1H), 4.13 (d, J = 6.0 Hz, 1H), 3.85 (d, J = 12.2 Hz, 1H), 3.74–3.50 (m, 18H), 3.39 (s, 3H), 3.17 (d, J = 6.9 Hz, 3H), 3.07–2.90 (m, 8H), 2.65–2.52 (m, 2H), 2.31 (d, J = 10.5 Hz, 1H), 2.18 (d, J = 14.1 Hz, 2H), 2.11 (s, 3H), 1.90 (d, J = 14.5 Hz, 2H), 1.83–1.68 (m, 3H), 1.64–1.51 (m, 4H), 1.35–1.29 (m, 12H), 1.28–1.22 (m, 8H), 1.15 (d, J = 6.3 Hz, 3H); 13C NMR (100 MHz, methanol-d4): δ 203.9, 172.6, 171.6, 164.5, 161.8, 159.5, 155.9, 138.9, 137.5, 136.7, 128.3, 128.3, 121.7, 119.1, 118.8, 117.4, 111.0, 109.5, 108.8, 108.6, 107.9, 101.4, 101.1, 99.2, 98.9, 98.1, 96.7, 80.1, 79.6, 77.9, 77.8, 77.4, 77.0, 76.5, 75.8, 75.3, 74.4, 72.8, 72.5, 72.4, 71.2, 71.0, 70.9, 69.6, 68.7, 57.9, 54.2, 51.9, 44.4, 43.2, 39.9, 37.3, 36.9, 32.3, 31.9, 28.5, 26.8, 26.4, 18.9, 17.9, 17.8, 17.6, 17.4, 16.2, 7.60; HRMS m/z: calcd for C67H92N3O27− [M − 1]−, 1370.5924; found, 1370.5987.
(E)-3-(2′-{2-[(N-1-Methyl-l-tryptophan)amino]-2-oxoethoxy}-imino) MTM (MTMox27E).
MTM (11 mg, 10 μmol) and N-[2-(aminooxy)acetyl]-1-methyl-l-tryptophan (6 mg, 20 μmol) gave 9.2 mg (6.8 μmol, 68% yield) of the desired product as a yellow solid. Retention time 21.9 min; 1H NMR (500 MHz, methanol-d4): δ 7.44 (d, J = 7.9 Hz, 1H), 7.30 (d, J = 8.1 Hz, 1H), 7.09 (s, 1H), 7.05 (t, J = 8.1 Hz, 1H), 6.94–6.88 (m, 2H), 6.60 (s, 1H), 5.12–5.03 (m, 2H), 4.97 (dd, J = 9.7, 2.1 Hz, 1H), 4.83–4.74 (m, 2H), 4.73–4.68 (m, 2H), 4.67–4.61 (m, 4H), 4.41 (d, J = 2.6 Hz, 1H), 4.21 (p, J = 6.2 Hz, 1H), 4.17 (d, J = 5.7 Hz, 1H), 3.87–3.82 (m, 1H), 3.73–3.67 (m, 5H), 3.65–3.59 (m, 1H), 3.59–3.54 (m, 1H), 3.53 (s, 3H), 3.38 (s, 3H), 3.36–3.32 (m, 4H), 3.26–3.17 (m, 2H), 3.13–3.01 (m, 3H), 2.98–2.90 (m, 3H), 2.65–2.52 (m, 2H), 2.44–2.33 (m, 1H), 2.18 (dd, J = 12.5, 5.1 Hz, 1H), 2.13 (s, 3H), 1.96–1.87 (m, 2H), 1.84–1.73 (m, 2H), 1.62–1.53 (m, 3H), 1.34–1.28 (m, 12H), 1.27–1.22 (m, 6H), 1.12 (d, J = 6.3 Hz, 3H); HRMS m/z: calcd for C66H90N3O27− [M − 1]−, 1356.5767; found, 1356.5811.
(E)-3-(2′-{2-[(l-Tryptophan)amino]-2-oxoethoxy}imino) MTM (MTMox28E).
MTM (25 mg, 23 μmol) and [2-(aminooxy)acetyl]-l-tryptophan (5.5 mg, 20 μmol) gave 17.1 mg (12.7 μmol, 55% yield) of the desired product as a yellow solid. Retention time 21.8 min; 1H NMR (500 MHz, methanol-d4): δ 7.97 (d, J = 6.6 Hz, 1H), 7.52 (d, J = 7.9 Hz, 1H), 7.29 (d, J = 8.3 Hz, 1H), 7.12 (s, 1H), 7.04 (t, J = 8.1, Hz, 1H), 6.93 (t, J = 8.0 Hz, 1H), 6.88 (s, 1H), 6.67 (s, 1H), 5.14 (dd, J = 9.6, 2.1 Hz, 1H), 5.05 (dd, J = 9.7, 2.0 Hz, 1H), 4.96 (dd, J = 9.6, 2.1 Hz, 1H), 4.73–4.56 (m, 6H), 4.22 (d, J = 5.4 Hz, 1H), 4.17 (dd, J = 6.4, 5.5 Hz, 1H), 3.84 (dt, J = 12.2, 2.9 Hz, 1H), 3.75–3.65 (m, 4H), 3.65–3.49 (m, 2H), 3.47–3.35 (m, 3H), 3.33 (s, 3H), 3.27–3.21 (m, 1H), 3.12–2.99 (m, 3H), 2.99–2.85 (m, 3H), 2.67–2.51 (m, 2H), 2.43–2.32 (m, 1H), 2.17 (dd, J = 12.7, 5.2 Hz, 1H), 2.12 (s, 3H), 1.97–1.86 (m, 2H), 1.86–1.67 (m, 2H), 1.65–1.50 (m, 3H), 1.35–1.28 (m, 12H), 1.27–1.23 (m, 6H), 1.08 (d, J = 6.3 Hz, 3H); 13C NMR (100 MHz, methanol-d4): δ 204.0, 173.7, 171.4, 164.4, 161.8, 159.7, 156.0, 139.1, 137.1, 137.0, 128.1, 123.7, 121.6, 119.1, 118.5, 117.5, 111.5, 111.1, 109.8, 108.7, 108.1, 101.5, 101.1, 99.2, 99.1, 98.1, 97.0, 80.2, 80.0, 78.0, 77.4, 77.3, 77.0, 76.5, 75.8, 75.4, 73.7, 72.9, 72.8, 72.6, 72.5, 71.2, 71.1, 71.0, 70.9, 69.6, 68.6, 57.9, 53.8, 44.4, 43.2, 39.9, 37.3, 37.0, 32.3, 27.8, 26.8, 26.4, 18.9, 17.9, 17.8, 17.7, 17.3, 16.2, 7.6; HRMS m/z: calcd for C65H88N3O27− [M − 1]−, 1342.5611; found, 1342.5660.
(E)-3-(2′-{2-[(Methyl l-Tryptophyl-l-tryptophanate)amino]-2-oxoethoxy}imino) MTM (MTMox29E).
MTM (25 mg, 23 μmol) and methyl [(2-(aminooxy)acetyl)]-l-tryptophyl-l-tryptophanate (23 mg, 46 μmol) gave 29.5 mg (19.1 μmol, 83% yield) of the desired product as a yellow solid. Retention time 23.7 min; 1H NMR (500 MHz, methanol-d4): δ 8.008–7.99 (m, 2H), 7.54 (d, J = 8.0 Hz, 1H), 7.35 (d, J = 7.9 Hz, 1H), 7.29 (t, J = 8.7 Hz, 2H), 7.10–7.01 (m, 3H), 7.00–6.88 (m, 4H), 6.58 (s, 1H), 5.04 (d, J = 9.6 Hz, 1H), 5.01–4.95 (m, 2H), 4.80–4.72 (m, 1H), 4.71–4.46 (m, 7H), 4.24 (s, 2H), 3.82 (d, J = 12.0 Hz, 1H), 3.74–3.65 (m, 3H), 3.62–3.44 (m, 7H), 3.42–3.34 (m, 4H), 3.27–3.21 (m, 1H), 3.18–2.83 (m, 10H), 2.74–2.50 (m, 2H), 2.28–2.04 (m, 5H), 1.91 (d, J = 13.3 Hz, 2H), 1.83–1.65 (m, 2H), 1.65–1.46 (m, 4H), 1.33–1.24 (m, 18H), 1.16 (d, J = 5.1 Hz, 3H); 13C NMR (100 MHz, methanol-d4): δ 203.2, 171.9, 171.8, 171.6, 171.5, 170.8, 170.7, 163.6, 161.4, 158.8, 155.3, 138.4, 136.4, 136.3, 136.2, 127.4, 127.3, 127.2, 125.2, 123.3, 123.2, 120.9, 118.5, 118.4, 118.0, 117.7, 116.9, 110.9, 110.8, 110.4, 109.1, 108.7, 108.0, 107.3, 100.8, 100.4, 98.5, 98.4, 97.4, 96.0, 79.5, 79.3, 77.2, 77.0, 76.7, 76.4, 75.8, 75.1, 74.7, 73.3, 72.3, 72.1, 71.8, 71.7, 70.6, 70.5, 70.4, 70.3, 68.9, 68.1, 57.4, 53.7, 53.3, 53.2, 51.2, 43.7, 42.3, 39.2, 36.7, 36.3, 31.6, 27.1, 26.2, 25.9, 25.8, 18.4, 17.3, 17.2, 17.0, 16.7, 15.5, 7.0; HRMS m/z: calcd for C77H102N5O28+ [M + 1]+, 1544.6706; found, 1544.6725.
(E)-3-(2′-{2-[(Methyl l-Tryptophyl-l-phenylalaninate)amino]-2-oxoethoxy}imino) MTM (MTMox30E).
MTM (25 mg, 23 μmol) and methyl [2-(aminooxy)acetyl]-l-tryptophyl-l-phenylalaninate (20 mg, 46 μmol) gave 18.3 mg (12.2 μmol, 53% yield) of the desired product as a yellow solid. Retention time 23.3 min; 1H NMR (500 MHz, methanol-d4): δ 8.12 (d, J = 7.7 Hz, 1H), 8.02 (d, J = 7.7 Hz, 1H), 7.52 (d, J = 7.9 Hz, 1H), 7.30 (d, J = 8.1 Hz, 1H), 7.21–7.12 (m, 4H), 7.08–7.04 (m, 2H), 7.03–7.00 (m, 2H), 6.95–6.89 (m, 2H), 6.64 (s, 1H), 5.10–5.01 (m, 2H), 4.96 (dd, J = 9.6, 2.1 Hz, 2H), 4.73 (t, J = 6.6 Hz, 1H), 4.69–4.48 (m, 8H), 4.27–4.19 (m, 2H), 3.83 (dt, J = 12.0, 4.4 Hz, 1H), 3.74–3.64 (m, 4H), 3.64–3.54 (m, 4H), 3.52 (s, 3H), 3.37–3.33 (m, 5H), 3.28–3.23 (m, 1H), 3.16–2.89 (m, 9H), 2.84 (dd, J = 13.7, 7.5 Hz, 1H), 2.64 (t, J = 11.5 Hz, 1H), 2.55 (dd, J = 11.9, 5.1 Hz, 1H), 2.31 (d, J = 10.0 Hz, 1H), 2.21–2.14 (m, 1H), 2.11 (s, 3H), 1.96–1.86 (m, 2H), 1.76 (q, J = 11.5 Hz, 2H), 1.63–1.50 (m, 3H), 1.33–1.23 (m, 18H), 1.15 (d, J = 6.0 Hz, 3H); 13C NMR (100 MHz, methanol-d4): δ 203.4, 171.8, 171.7, 171.6, 171.5, 170.9, 163.9, 161.6, 159.1, 155.6, 138.6, 136.7, 136.5, 129.0, 128.2, 127.6, 126.6, 123.6, 121.1, 118.6, 118.2, 117.1, 111.0, 110.7, 109.3, 108.2, 107.6, 101.0, 100.7, 98.8, 97.6, 96.3, 79.7, 79.4, 77.5, 77.1, 76.9, 76.6, 76.1, 75.3, 74.9, 73.4, 72.5, 72.4, 72.0, 70.8, 70.7, 70.5, 69.2, 68.3, 57.6, 54.1, 54.0, 53.9, 53.8, 51.4, 44.0, 42.7, 39.4, 37.2, 36.9, 36.5, 31.8, 27.9, 26.5, 26.0, 18.6, 17.5, 17.4, 17.2, 16.9, 15.8, 7.2; HRMS m/z: calcd for C75H98N3O29− [M − 1]−, 1503.6451; found, 1503.6487.
(E)-3-(2′-{2-[(Methyl l-Tryptophyl-d-phenylalaninate)amino]-2-oxoethoxy}imino) MTM (MTMox31E).
MTM (25 mg, 23 μmol) and methyl [2-(aminooxy)acetyl]-l-tryptophyl-d-phenylalaninate (20 mg, 46 μmol) gave 19.0 mg (12.7 μmol, 55% yield) of the desired product as a yellow solid. Retention time 23.9 min; 1H NMR (500 MHz, methanol-d4): δ 8.03 (dd, J = 10.2, 7.8 Hz, 2H), 7.51 (dt, J = 7.9, 1.0 Hz, 1H), 7.31 (dt, J = 8.2, 0.9 Hz, 1H), 7.20–7.13 (m, 3H), 7.07 (dt, J = 7.9, 1.0 Hz, 1H), 6.96 (td, J = 7.9, 1.0 Hz, 1H), 6.93–6.89 (m, 3H), 6.87 (s, 1H), 6.66 (s, 1H), 5.10 (dd, J = 9.7, 2.1 Hz, 1H), 5.06 (dd, J = 9.7, 2.0 Hz, 1H), 4.97 (dd, J = 9.6, 2.0 Hz, 1H), 4.77–4.46 (m, 8H), 4.26 (d, J = 5.3 Hz, 1H), 4.23–4.15 (m, 1H), 3.85 (dt, J = 12.2, 2.9 Hz, 1H), 3.74–3.66 (m, 3H), 3.65–3.58 (m, 2H), 3.56 (s, 3H), 3.54–3.48 (m, 1H), 3.38–3.33 (m, 6H), 3.22–3.16 (m, 1H), 3.10–3.00 (m, 4H), 3.00–2.90 (m, 3H), 2.83 (dd, J = 13.8, 6.1 Hz, 1H), 2.71 (dd, J = 13.8, 7.8 Hz, 1H), 2.69–2.62 (m, 1H), 2.55 (dd, J = 12.4, 2.0 Hz, 1H), 2.34 (dd, J = 12.4, 2.1 Hz, 1H), 2.17 (dd, J = 12.5, 1.9 Hz, 1H), 2.13 (s, 3H), 1.96–1.87 (m, 2H), 1.78 (td, J = 12.2, 2.6 Hz, 2H), 1.63–1.51 (m, 3H), 1.34–1.28 (m, 12H), 1.28–1.21 (m, 8H), 1.14 (d, J = 6.5 Hz, 3H); HRMS m/z: calcd for C75H98N3O29− [M − 1]−, 1503.6451; found, 1503.6428.
(E)-3-(2′-{2-[(Methyl l-Phenylalanyl-l-tryptophanate)amino]-2-oxoethoxy}imino) MTM (MTMox32E).
MTM (25 mg, 23 μmol) and methyl [2-(aminooxy)acetyl]-l-phenylalanyl-l-tryptophanate (22 mg, 46 μmol) gave 30.3 mg (20.2 μmol, 88% yield) of the desired product as a yellow solid. Retention time 24.2 min; 1H NMR (500 MHz, methanol-d4): δ 8.23 (d, J = 7.7 Hz, 1H), 8.14 (d, J = 8.1 Hz, 1H), 7.41 (d, J = 7.9 Hz, 1H), 7.29 (d, J = 8.2 Hz, 1H), 7.23–7.16 (m, 5H), 7.08–7.02 (m, 2H), 6.95 (t, J = 7.5 Hz, 1H), 6.90 (s, 1H), 6.64 (s, 1H), 5.05 (t, J = 10.7 Hz, 2H), 4.98 (d, J = 9.6 Hz, 1H), 4.75–4.50 (m, 9H), 4.31–4.24 (m, 2H), 3.85 (d, J = 12.1 Hz, 1H), 3.75–3.67 (m, 3H), 3.63–3.49 (m, 7H), 3.42 (s, 3H), 3.15–2.87 (m, 11H), 2.73–2.52 (m, 2H), 2.27–2.07 (m, 6H), 1.99–1.86 (m, 2H), 1.77 (q, J = 11.9 Hz, 2H), 1.64–1.50 (m, 3H), 1.36–1.22 (m, 18H), 1.19 (d, J = 6.0 Hz, 3H); 13C NMR (100 MHz, methanol-d4): δ 203.3, 171.9, 171.3, 170.7, 163.6, 161.4, 158.8, 155.3, 138.4, 136.6, 136.4, 136.3, 129.0, 128.0, 127.2, 126.3, 123.2, 121.0, 118.4, 117.7, 116.9, 110.9, 110.4, 108.8, 108.0, 107.3, 100.7, 100.4, 98.5, 98.4, 97.4, 96.0, 79.5, 79.4, 77.2, 76.6, 76.4, 75.8, 75.1, 74.7, 73.4, 72.2, 72.1, 71.8, 70.5, 70.4, 70.3, 69.0, 68.1, 57.4, 54.0, 53.1, 53.0, 51.3, 43.8, 42.3, 39.2, 37.6, 36.7, 36.3, 31.6, 27.0, 26.2, 25.7, 18.4, 17.3, 17.2, 17.0, 16.7, 15.5, 7.0; HRMS m/z: calcd for C75H101N4O28 [M + 1]+, 1505.6597; found, 1505.6624.
(E)-3-(2′-{2-[(Methyl l-Phenylalanyl-l-phenylalaninate)amino]-2-oxoethoxy}imino) MTM (MTMox33E).
MTM (13 mg, 12 μmol) and methyl (2-(aminooxy) acetyl)-l-phenylalanyl-l-phenylalaninate (10 mg, 24 μmol) gave 12.6 mg (8.6 μmol, 72% yield) of the desired product as a yellow solid. Retention time 24.3 min; 1H NMR (500 MHz, methanol-d4): δ 8.32 (d, J = 7.8 Hz, 1H), 8.06 (d, J = 8.0 Hz, 1H), 7.26–7.19 (m, 6H), 7.19–7.14 (m, 2H), 7.09 (d, J = 6.8 Hz, 2H), 6.96 (s, 1H), 6.76 (s, 1H), 5.28 (dd, J = 9.7, 2.1 Hz, 1H), 5.08 (dd, J = 9.8, 2.0 Hz, 1H), 4.97 (dd, J = 9.7, 2.1 Hz, 1H), 4.75–4.63 (m, 5H), 4.63–4.51 (m, 3H), 4.28–4.20 (m, 2H), 3.86 (ddd, J = 12.1, 4.9, 2.9 Hz, 1H), 3.79–3.60 (m, 6H), 3.59 (s, 3H), 3.57–3.52 (m, 1H), 3.50–3.44 (m, 1H), 3.39 (s, 3H), 3.36–3.33 (m, 1H), 3.15–3.01 (m, 5H), 3.01–2.84 (m, 6H), 2.71–2.61 (m, 1H), 2.56 (ddd, J = 12.6, 5.3, 2.0 Hz, 1H), 2.41 (ddd, J = 12.3, 5.2, 2.0 Hz, 1H), 2.18 (ddd, J = 12.4, 5.1, 2.0 Hz, 1H), 2.14 (s, 3H), 1.97–1.92 (m, 1H), 1.90 (dd, J = 13.7, 2.1 Hz, 1H), 1.86–1.74 (m, 2H), 1.63–1.52 (m, 3H), 1.35–1.28 (m, 12H), 1.28–1.22 (m, 6H), 1.17 (d, J = 6.4 Hz, 3H); HRMS m/z: calcd for C73H98N3O28− [M − 1]−, 1464.6342; found, 1464.6396.
(E)-3-(2′-{2-[(Methyl l-Alanyl-l-tryptophanate)amino]-2-oxoethoxy}imino) MTM (MTMox34E).
MTM (25 mg, 23 μmol) and methyl [2-(aminooxy)acetyl]-l-alanyl-l-tryptophanate (18 mg, 46 μmol) gave 14.8 mg (10.4 μmol, 45% yield) of the desired product as a yellow solid. Retention time 22.3 min; 1H NMR (500 MHz, methanol-d4): δ 8.17 (dd, J = 9.9, 7.4 Hz, 2H), 7.41 (dq, J = 7.9, 0.9 Hz, 1H), 7.27 (dq, J = 8.2, 0.9 Hz, 1H), 7.08 (s, 1H), 7.05 (t, J = 8.2, 1H), 6.95 (t, J = 8.1, 1H), 6.92 (s, 1H), 6.70 (s, 1H), 5.16 (d, J = 9.5 Hz, 1H), 5.07 (d, J = 8.2 Hz, 1H), 4.97 (dd, J = 10.0, 1.8 Hz, 1H), 4.72–4.58 (m, 7H), 4.50 (p, J = 6.3, 5.8 Hz, 1H), 4.30 (p, J = 6.2 Hz, 1H), 4.24 (d, J = 5.6 Hz, 1H), 3.85 (dt, J = 12.2, 4.1 Hz, 1H), 3.76–3.60 (m, 5H), 3.58 (s, 3H), 3.55–3.50 (m, 1H), 3.44 (s, 3H), 3.42–3.38 (m, 1H), 3.36–3.32 (m, 2H), 3.21–3.07 (m, 3H), 3.06–2.89 (m, 6H), 2.67 (t, J = 12.3 Hz, 1H), 2.56 (dd, J = 11.9, 5.4 Hz, 1H), 2.30 (dd, J = 11.4, 5.1 Hz, 1H), 2.19–2.13 (m, 1H), 2.12 (s, 3H), 1.92 (td, J = 14.1, 3.8 Hz, 2H), 1.83–1.69 (m, 2H), 1.65–1.48 (m, 3H), 1.35–1.29 (m, 13H), 1.26–1.22 (m, 6H), 1.19 (d, J = 6.4 Hz, 3H); HRMS m/z: calcd for C69H95N4O28− [M − 1]−, 1427.6138; found, 1427.6108.
(E)-3-(2′-{2-[(Methyl l-Tryptophyl-l-alaninate)amino]-2-oxoethoxy}imino) MTM (MTMox35E).
MTM (25 mg, 23 μmol) and methyl [2-(aminooxy) acetyl]-l-tryptophyl-l-alaninate (17 mg, 46 μmol) gave 11.8 mg (8.3 μmol, 36% yield) of the desired product as a yellow solid. Retention time 22.2 min; 1H NMR (500 MHz, methanol-d4): δ 8.26 (d, J = 7.0 Hz, 1H), 7.97 (d, J = 7.7 Hz, 1H), 7.56 (dt, J = 7.9, 1.0 Hz, 1H), 7.30 (dt, J = 8.2, 1.0 Hz, 1H), 7.14 (s, 1H), 7.06 (td, J = 8.2, 1.2 Hz, 1H), 6.95 (td, J = 8.0, 1.0 Hz, 1H), 6.91 (d, J = 1.5 Hz, 1H), 6.68 (s, 1H), 5.18 (dd, J = 9.7, 2.2 Hz, 1H), 5.05 (dd, J = 9.7, 2.0 Hz, 1H), 4.96 (dd, J = 9.6, 2.1 Hz, 1H), 4.75 (dd, J = 8.0, 6.3 Hz, 1H), 4.71–4.67 (m, 2H), 4.65–4.61 (m, 2H), 4.59 (s, 1H), 4.56 (s, 1H), 4.26 (d, J = 5.2 Hz, 1H), 4.22–4.15 (m, 2H), 3.84 (dt, J = 12.2, 3.0 Hz, 1H), 3.73–3.65 (m, 5H), 3.62 (dd, J = 6.4, 1.1 Hz, 1H), 3.59 (s, 3H), 3.57–3.51 (m, 2H), 3.42–3.38 (m, 1H), 3.34 (s, 3H), 3.32 (s, 3H), 3.18–3.12 (m, 1H), 3.09–2.99 (m, 4H), 2.97–2.89 (m, 3H), 2.65 (td, J = 11.8, 1.9 Hz, 1H), 2.55 (dd, J = 12.4, 2.0 Hz, 1H), 2.38 (dd, J = 12.4, 2.1 Hz, 1H), 2.17 (dd, J = 12.4, 2.0 Hz, 1H), 2.12 (s, 3H), 1.95–1.87 (m, 2H), 1.78 (qd, J = 12.2, 9.8 Hz, 2H), 1.63–1.51 (m, 4H), 1.33–1.27 (m, 12H), 1.26–1.23 (m, 8H), 1.20 (d, J = 7.3 Hz, 3H), 1.13 (d, J = 6.4 Hz, 3H); HRMS m/z: calcd for C69H95N4O28− [M − 1]−, 1427.6138; found, 1427.6156.
Cell Culture.
The cell line sources and medium preparations are previously described.26 All cell lines were regularly tested for mycoplasma and authenticated by single tandem repeat DNA analyses (ATCC).
Growth Inhibition (GI50, 72 h) Assay and Statistical Analysis.
The 72 h growth inhibition assay and statistical analysis used to evaluate the cytotoxicity of MTMox analogues are previously described.26
Selective Cytotoxicity against ETS Fusion-Dependent Ewing Sarcoma Cell Lines.
The methods used to evaluate selective cytotoxicity of MTMox analogues against Ewing sarcoma cell lines, which express ETS fusion products such as EWS-FLI1, are previously described.26
Luciferase Reporter Assay in TC32 Cells.
The effect of MTMox32E analogue treatment on activation of full-length NR0B1 promoter element, regulated by EWS-FLI1, was compared to the effect on activation of a CMV-regulated promoter element. These assays were conducted in TC32 cells (EWS-FLI1+) transfected with respective reporter vectors as previously described.26 The effect of MTM was also evaluated for comparison.
Target Gene (mRNA) Expressions Determined by qRT-PCR (ΔΔCt).
The effects of MTMox32E treatment on EWS-FLI1 gene expression (mRNA) and its regulated target gene, NR0B1, were evaluated. Similarly, the effects on Sp1 gene expression (mRNA) and its regulated target genes, VEGFA and BCL-2, were also evaluated. TC32 and PC3 cell lines were plated in 6-well plates at a density of 300,000 cells/well. When 75% confluent, ~48–72 h later, cells were washed with Dulbecco’s phosphate-buffered saline (DPBS) and treated with three concentrations of MTMox32E, spanning the determined GI50 (nM). Treatments with MTMox32E included 0, 30, 100, and 300 nM in the TC32 cell line and 0, 100, 300, and 1000 nM in the PC3 cell line. For comparison, cells were also treated with MTM. TC32 cells were treated with 0, 10, 30, and 100 nM of MTM and PC3 cells were treated with 0, 30, 100, and 300 nM of MTM. Cells were treated for 6 h to evaluate relative changes in mRNA expression to GAPDH. After 6 h of treatment, the media was removed, cells were washed with DPBS and collected by trypsin cleavage. RNA was isolated from lysed cells and cDNA was synthesized for analysis by qRT-PCR. The methods and reagents used toward qRT-PCR analysis were previously described in detail.26
Target Protein Expressions Determined by Western Blot.
The effects of MTMox32E treatment on EWS-FLI1 protein expression and its regulated target gene, NR0B1, protein expression were evaluated. Similarly, the effects on Sp1 protein expression and its regulated target gene, VEGFA, protein expression were also evaluated. TC32 and PC3 cells were plated and treated in the exact manner described for target gene (mRNA) expression studies. However, to allow for efficient protein turnover, treatments were conducted for 24 h, as opposed to just 6 h. After 24 h treatment, the medium was removed, and cells were washed with DPBS and immediately placed on ice. Cells were scraped from wells and collected in 1.5 mL tubes on ice. Cell pellets were formed by centrifugation at 1200g for 5 min. The supernatant was discarded, and cell pellets were lysed with 600 μL of RIPA buffer. Lysate protein concentrations were measured using bovine serum albumin (BSA) standards and Pierce colorimetric BCA assay (Thermo Fisher Scientific, Waltham, MA). Lysate (15 μg protein) was heat-denatured at 95 °C for 5 min with β-mercaptoethanol (Thermo Fisher Scientific, Waltham, MA) and loaded into an 8% sodium dodecyl sulfate polyacrylamide gel electrophoresis (SDS-PAGE) gel (Bio-Rad Laboratories, Hercules, CA) with 5× Laemmli loading buffer (Sigma-Aldrich, St. Louis, MO). The SDS-PAGE gel was run by electrophoresis for ~2 h at 110 V in tris-glycine SDS running buffer. Proteins were transferred to nitrocellulose membrane at 60 mA over 21 h at 4 °C. Membranes were blocked with 5% BSA in TBST buffer for 1 h. BSA solution was removed and washed with TBST wash solution 3× for 5 min. Primary antibody, also diluted in 5% BSA, was added to membranes. Membranes were incubated overnight at 4 °C with primary antibody. After incubation, primary antibody was removed, and membranes were washed 3× with TBST wash solution for 5 min. Horseradish peroxidase-conjugated secondary antibody was diluted (1:1000) in 5% BSA solution and added to membranes for a 1 h incubation at room temperature. The secondary antibody was removed, and the membrane was washed 3× with TBST solution for 5 min. Membranes were incubated for 8 min in ECL solution (Bio-Rad Laboratories, Hercules, CA). After 8 min, membranes were dried on paper and imaged using Molecular Imager ChemiDoc XRS (Bio-Rad Laboratories, Hercules, CA), with auto-adjusted exposure times ranging from 0.5 to 7 s. The primary antibodies used are tabulated with a catalog number, stock concentration, working dilution factor, and final concentration in 5% BSA solution (Table S7). GelQuant.NET software, provided by biochemlabsolutions.com, was used to quantitate western blots.
Modeling the DNA-MTMox32E Complex.
The structural model of the DNA-MTMox32E complex was generated based on the crystal structure of MTM SA-Trp in complex with double-stranded DNA AGAGGCCTCT complex (PDB ID 5JVW27) in Coot.39 The bond restraints were generated in the JLigand module40 of the CCP4I suite41 and used in Coot. The MTM core of MTMox32E was superimposed onto the MTM SA-Trp, and the 3-side-chain conformation was manually adjusted in an extended state, followed by structure regularization, while ensuring that the core position remained unchanged.
Pharmacokinetic Studies in Mice.
All animals were obtained as needed from commercial sources and all experimental procedures were conducted following review and approval by the University of Kentucky Institutional Animal Care and Use Committee. Female Swiss Webster mice (n = 9) were administered MTMox32E at 5 mg/kg by intravenous bolus dose, formulated in 15% Kolliphor EL and 85% saline (v/v). Mice were randomized into three groups of three mice, and three whole blood samples were collected per mouse by saphenous bleed (n = 2) and terminal cardiac puncture. Using this design, triplicate samples were collected for nine time points. Collection time points were 5 min, 15 min, 45 min, 1.5 h, 3 h, 6 h, 10 h, 16 h, and 24 h. Pipette tips and needles were primed with heparin for the anticoagulant. Whole blood samples were immediately centrifuged at 3000g for 2 min to rapidly collect plasma. Plasma samples were immediately placed on dry ice and further stored at −80 °C until analysis. Using the bioanalytical methods described by Eckenrode et al., the plasma sample and calibrator extracts were prepared for analysis by HPLC-MS/MS.35 Concentrations (ng/mL) in plasma were determined at each time point. A curve was fit to data points using a compartmental analysis, while a noncompartmental analysis was used to estimate pharmacokinetic parameters, which include area under the plasma concentration curve (AUC), clearance (CL), and volume of distribution (Vd). Phoenix WinNonlin 64 version 8 software was used to model the pharmacokinetic data.
TC32 Cell Line Xenograft in Immunocompromised nu/nu Mice.
TC32 cells were formulated in 1:1 RPMI media (no FBS)/Matrigel on ice and injected subcutaneously into the flank of female immunocompromised athymic nude nu/nu mice at a density of 1.0 × 10⁶ cells per 100 μL. Mice with established tumors, developing 14–28 days post implantation, having a minimum tumor volume of 50 mm3 were randomly assigned to treatment groups (n = 14 mice per group). Mice were treated every 3 days with MTMox32E, MTM, and vehicle at 25, 1, and 0 mg/kg, respectively, by intravenous bolus dose. MTMox32E and MTM were formulated in 5% Kolliphor EL, 2% DMSO, and 93% (v/v) saline for xenograft studies. Tumor volumes were monitored every 3 days, and mice were euthanized once tumors reached 20 mm in length. The average tumor volume among the replicates was plotted, as well as survival plots, using GraphPad Prism 7.03 software. Significance (p value) of treatment on average tumor volume was determined 16 days after the initial dose by one-way ANOVA, multiple comparison statistical test. Significance of treatment on survival was determined using the Log Rank (Holm-Sidak procedure for multiple comparisons) statistical test.
TC32 Cell Line Xenograft Tumor Tissue Collection and Analysis.
Three mice per treatment group were removed from xenograft study after the 6th treatment to evaluate the effects on target transcript (mRNA) and protein expressions in tumor tissues. Tumors were collected 6 h after the 6th treatment. Mice were anesthetized, and tumors were resected using sterilized surgical utensils. Tumors were washed briefly in sterilized PBS, dried, and immediately placed in liquid nitrogen (snap-frozen) for long-term storage at −80 °C. Stored tumor tissue was cut semifrozen and ground with a mortar and pestle over liquid nitrogen. The RLT lysis buffer was then used to extract and isolate total RNA from tissue using the RNeasy kit (Qiagen, Hildin, Germany). The qRT-PCR methods and reagents for analyzing mRNA expression were as previously described.26 Separately, tumor tissue was ground and lysed with RIPA buffer for protein extraction and western blot analysis using standard protocols.
Supplementary Material
ACKNOWLEDGMENTS
This work was supported by National Institutes of Health grants R37 AI52188 (J.S.T.), R01 CA243529 (M.L., J.R., O.V.T.), and T32 DA016176 (Y.Z.), the Center of Biomedical Research Excellence (COBRE) in Pharmaceutical Research and Innovation (CPRI, NIH P20 GM130456), the National Center for Advancing Translational Sciences (UL1TR000117 and UL1TR001998), and the University of Kentucky College of Pharmacy and the Biostatistics and Bioinformatics Shared Resource of the University of Kentucky Markey Cancer Center (P30CA177558). We also thank the College of Pharmacy Analytical Facility for NMR and MS support.
ABBREVIATIONS
- FLI1
friend leukemia integration 1 transcription factor
- ETS
E26 transformation-specific
- ERG
E26-transformation-specific-related gene
- EWS
Ewing sarcoma breakpoint
- TMPRSS2
transmembrane serine protease 2
- Sp1
specificity protein 1
- NR0B1
nuclear receptor subfamily 0, group B, member 1
- BCL-2
B cell lymphoma 2
- VEGFA
vascular endothelial growth factor A
- MTM
mithramycin
- TFA
trifluoroacetic acid
- MTD
maximum tolerated dose
Footnotes
Supporting Information
The Supporting Information is available free of charge at https://pubs.acs.org/doi/10.1021/acs.jmedchem.0c01526.
Experimental procedures, HPLC chromatograms, 1H NMR (for all products), 13C NMR (for selected products), HR-ESI-MS spectra (for all products), molecular formula strings (all final compounds), additional in vitro evaluative data, and additional in vivo evaluative data (PDF)
Protien data bank of the (MTM SA-Trp)2-Zn2+-DNA complex (PDB)
Complete contact information is available at: https://pubs.acs.org/10.1021/acs.jmedchem.0c01526
The authors declare the following competing financial interest(s): The authors report competing interests. JST is a co-founder of Centrose (Madison, WI).
Contributor Information
Yang Liu, Department of Pharmaceutical Sciences, College of Pharmacy and Center for Pharmaceutical Research and Innovation, College of Pharmacy, University of Kentucky, Lexington, Kentucky 40536, United States.
Joseph M. Eckenrode, Department of Pharmaceutical Sciences, College of Pharmacy, University of Kentucky, Lexington, Kentucky 40536, United States
Larissa V. Ponomareva, Department of Pharmaceutical Sciences, College of Pharmacy and Center for Pharmaceutical Research and Innovation, College of Pharmacy, University of Kentucky, Lexington, Kentucky 40536, United States
REFERENCES
- (1).Findlay VJ; LaRue AC; Turner DP; Watson PM; Watson DK Understanding the role of ETS-mediated gene regulation in complex biological processes. Adv. Cancer Res 2013, 119, 1–61. [DOI] [PMC free article] [PubMed] [Google Scholar]
- (2).Sizemore GM; Pitarresi JR; Balakrishnan S; Ostrowski MC The ETS family of oncogenic transcription factors in solid tumours. Nat. Rev. Cancer 2017, 17, 337–351. [DOI] [PubMed] [Google Scholar]
- (3).Esiashvili N; Goodman M; Marcus RB Jr. Changes in incidence and survival of Ewing sarcoma patients over the past 3 decades: Surveillance epidemiology and end results data. J. Pediatr. Hematol. Oncol 2008, 30, 425–430. [DOI] [PubMed] [Google Scholar]
- (4).Gorthi A; Romero JC; Loranc E; Cao L; Lawrence LA; Goodale E; Iniguez AB; Bernard X; Masamsetti VP; Roston S; Lawlor ER; Toretsky JA; Stegmaier K; Lessnick SL; Chen Y; Bishop AJR EWS-FLI1 increases transcription to cause R-loops and block BRCA1 repair in Ewing sarcoma. Nature 2018, 555, 387–391. [DOI] [PMC free article] [PubMed] [Google Scholar]
- (5).Shimizu R; Tanaka M; Tsutsumi S; Aburatani H; Yamazaki Y; Homme M; Kitagawa Y; Nakamura T EWS-FLI1 regulates a transcriptional program in cooperation with Foxq1 in mouse Ewing sarcoma. Cancer Sci. 2018, 109, 2907–2918. [DOI] [PMC free article] [PubMed] [Google Scholar]
- (6).Schwentner R; Papamarkou T; Kauer MO; Stathopoulos V; Yang F; Bilke S; Meltzer PS; Girolami M; Kovar H EWS-FLI1 employs an E2F switch to drive target gene expression. Nucleic Acids Res. 2015, 43, 2780–2789. [DOI] [PMC free article] [PubMed] [Google Scholar]
- (7).Bailly RA; Bosselut R; Zucman J; Cormier F; Delattre O; Roussel M; Thomas G; Ghysdael J DNA-binding and transcriptional activation properties of the EWS-FLI-1 fusion protein resulting from the t(11;22) translocation in Ewing sarcoma. Mol. Cell. Biol 1994, 14, 3230–3241. [DOI] [PMC free article] [PubMed] [Google Scholar]
- (8).Maksimenko A; Malvy C Oncogene-targeted antisense oligonucleotides for the treatment of Ewing sarcoma. Expert Opin. Ther. Targets 2005, 9, 825–830. [DOI] [PubMed] [Google Scholar]
- (9).Prieur A; Tirode F; Cohen P; Delattre O EWS/FLI-1 silencing and gene profiling of Ewing cells reveal downstream oncogenic pathways and a crucial role for repression of insulin-like growth factor binding protein 3. Mol. Cell. Biol 2004, 24, 7275–7283. [DOI] [PMC free article] [PubMed] [Google Scholar]
- (10).Tanaka K; Iwakuma T; Harimaya K; Sato H; Iwamoto Y EWS-Fli1 antisense oligodeoxynucleotide inhibits proliferation of human Ewing’s sarcoma and primitive neuroectodermal tumor cells. J. Clin. Invest 1997, 99, 239–247. [DOI] [PMC free article] [PubMed] [Google Scholar]
- (11).Toretsky JA; Connell Y; Neckers L; Bhat NK Inhibition of EWS-FLI-1 fusion protein with antisense oligodeoxynucleotides. J. Neuro-Oncol 1997, 31, 09–16. [DOI] [PubMed] [Google Scholar]
- (12).Dohjima T; Sook Lee N; Li H; Ohno T; Rossi JJ Small interfering RNAs expressed from a Pol III promoter suppress the EWS/Fli-1 transcript in an Ewing sarcoma cell line. Mol. Ther 2003, 7, 811–816. [DOI] [PubMed] [Google Scholar]
- (13).Chansky HA; Barahmand-Pour F; Mei Q; Kahn-Farooqi W; Zielinska-Kwiatkowska A; Blackburn M; Chansky K; Conrad EU 3rd; Bruckner JD; Greenlee TK; Yang L Targeting of EWS/FLI-1 by RNA interference attenuates the tumor phenotype of Ewing’s sarcoma cells in vitro. J. Orthop. Res 2004, 22, 910–917. [DOI] [PubMed] [Google Scholar]
- (14).Gaspar N; Hawkins DS; Dirksen U; Lewis IJ; Ferrari S; Le Deley M-C; Kovar H; Grimer R; Whelan J; Claude L; Delattre O; Paulussen M; Picci P; Sundby Hall K; van den Berg H; Ladenstein R; Michon J; Hjorth L; Judson I; Luksch R; Bernstein ML; Marec-Bérard P; Brennan B; Craft AW; Womer RB; Juergens H; Oberlin O Ewing Sarcoma: Current management and future approaches through collaboration. J. Clin. Oncol 2015, 33, 3036–3046. [DOI] [PubMed] [Google Scholar]
- (15).Womer RB; West DC; Krailo MD; Dickman PS; Pawel BR; Grier HE; Marcus K; Sailer S; Healey JH; Dormans JP; Weiss AR Randomized controlled trial of interval-compressed chemotherapy for the treatment of localized Ewing sarcoma: A report from the children’s oncology group. J. Clin. Oncol 2012, 30, 4148–4154. [DOI] [PMC free article] [PubMed] [Google Scholar]
- (16).Grohar PJ; Woldemichael GM; Griffin LB; Mendoza A; Chen Q-R; Yeung C; Currier DG; Davis S; Khanna C; Khan J; McMahon JB; Helman LJ Identification of an inhibitor of the EWS-FLI1 oncogenic transcription factor by high-throughput screening. J. Natl. Cancer Inst 2011, 103, 962–978. [DOI] [PMC free article] [PubMed] [Google Scholar]
- (17).Blume SW; Snyder RC; Ray R; Thomas S; Koller CA; Miller DM Mithramycin inhibits SP1 binding and selectively inhibits transcriptional activity of the dihydrofolate reductase gene in vitro and in vivo. J. Clin. Invest 1991, 88, 1613–1621. [DOI] [PMC free article] [PubMed] [Google Scholar]
- (18).Snyder RC; Ray R; Blume S; Miller DM Mithramycin blocks transcriptional initiation of the c-myc P1 and P2 promoters. Biochemistry 1991, 30, 4290–4297. [DOI] [PubMed] [Google Scholar]
- (19).Wang LG; Ferrari AC Mithramycin targets sp1 and the androgen receptor transcription level-potential therapeutic role in advanced prostate cancer. Transl. Oncogenomics 2006, 1, 19–31. [PMC free article] [PubMed] [Google Scholar]
- (20).Grohar PJ; Glod J; Peer CJ; Sissung TM; Arnaldez FI; Long L; Figg WD; Whitcomb P; Helman LJ; Widemann BC A phase I/II trial and pharmacokinetic study of mithramycin in children and adults with refractory Ewing sarcoma and EWS-FLI1 fusion transcript. Cancer Chemother. Pharmacol 2017, 80, 645–652. [DOI] [PMC free article] [PubMed] [Google Scholar]
- (21).Hill GJ 2nd; Sedransk N; Rochlin D; Bisel H; Andrews NC; Fletcher W; Schroeder JM; Wilson WL Mithramycin (NSC 24559) therapy of testicular tumors. Cancer 1972, 30, 900–908. [DOI] [PubMed] [Google Scholar]
- (22).Kennedy BJ; Torkelson JL Long-term follow-up of stage III testicular carcinoma treated with mithramycin (plicamycin). Med. Pediatr. Oncol 1995, 24, 327–328. [DOI] [PubMed] [Google Scholar]
- (23).Osgood CL; Maloney N; Kidd CG; Kitchen-Goosen S; Segars L; Gebregiorgis M; Woldemichael GM; He M; Sankar S; Lessnick SL; Kang M; Smith M; Turner L; Madaj ZB; Winn ME; Núñez L-E; Gonzalez-Sabín J; Helman LJ; Morís F; Grohar PJ Identification of mithramycin analogues with improved targeting of the EWS-FLI1 transcription factor. Clin. Cancer Res 2016, 22, 4105–4118. [DOI] [PMC free article] [PubMed] [Google Scholar]
- (24).Malek A; Núñez L-E; Magistri M; Brambilla L; Jovic S; Carbone GM; Morís F; Catapano CV Modulation of the activity of Sp transcription factors by mithramycin analogues as a new strategy for treatment of metastatic prostate cancer. PLoS One 2012, 7, No. e35130. [DOI] [PMC free article] [PubMed] [Google Scholar]
- (25).Remsing LL; González AM; Nur-e-Alam M; Fernández-Lozano MJ; Braña AF; Rix U; Oliveira MA; Méndez C; Salas JA; Rohr J Mithramycin SK, a novel antitumor drug with improved therapeutic index, mithramycin SA, and demycarosyl-mithramycin SK: three new products generated in the mithramycin producer Streptomyces argillaceus through combinatorial biosynthesis. J. Am. Chem. Soc 2003, 125, 5745–5753. [DOI] [PMC free article] [PubMed] [Google Scholar]
- (26).Mitra P; Eckenrode JM; Mandal A; Jha AK; Salem SM; Leggas M; Rohr J Development of mithramycin analogues with increased selectivity toward ETS transcription factor expressing cancers. J. Med. Chem 2018, 61, 8001–8016. [DOI] [PMC free article] [PubMed] [Google Scholar]
- (27).Hou C; Weidenbach S; Cano KE; Wang Z; Mitra P; Ivanov DN; Rohr J; Tsodikov OV Structures of mithramycin analogues bound to DNA and implications for targeting transcription factor FLI1. Nucleic Acids Res. 2016, 44, 8990–9004. [DOI] [PMC free article] [PubMed] [Google Scholar]
- (28).Tevyashova AN; Zbarsky EN; Balzarini J; Shtil AA; Dezhenkova LG; Bukhman VM; Zbarsky VB; Preobrazhenskaya MN Modification of the antibiotic olivomycin I at the 2’-keto group of the side chain. Novel derivatives, antitumor and topoisomerase I-poisoning activity. J. Antibiot 2009, 62, 37–41. [DOI] [PubMed] [Google Scholar]
- (29).Rouillard M; Girault Y; Decouzon M; Azzaro M 1H NMR utilization of through-space effects: III—configuration of oximes and analogous compounds. Org. Magn. Reson 1983, 21, 357–360. [Google Scholar]
- (30).Anyanwutaku IO; Petroski RJ; Rosazza JPN Oxidative coupling of mithramycin and hydroquinone catalyzed by copper oxidases and benzoquinone. Implications for the mechanism of action of aureolic acid antibiotics. Bioorg. Med. Chem 1994, 2, 543–551. [DOI] [PubMed] [Google Scholar]
- (31).Berger M; Dirksen U; Braeuninger A; Koehler G; Juergens H; Krumbholz M; Metzler M Genomic EWS-FLI1 fusion sequences in Ewing sarcoma resemble breakpoint characteristics of immature lymphoid malignancies. PLoS One 2013, 8, No. e56408. [DOI] [PMC free article] [PubMed] [Google Scholar]
- (32).Scott D; Rohr J; Bae Y Nanoparticulate formulations of mithramycin analogs for enhanced cytotoxicity. Int. J. Nanomed 2011, 6, 2757–2767. [DOI] [PMC free article] [PubMed] [Google Scholar]
- (33).Tomlins SA; Rhodes DR; Perner S; Dhanasekaran SM; Mehra R; Sun X-W; Varambally S; Cao X; Tchinda J; Kuefer R; Lee C; Montie JE; Shah RB; Pienta KJ; Rubin MA; Chinnaiyan AM Recurrent fusion of TMPRSS2 and ETS transcription factor genes in prostate cancer. Science 2005, 310, 644–648. [DOI] [PubMed] [Google Scholar]
- (34).Jafari R; Almqvist H; Axelsson H; Ignatushchenko M; Lundbäck T; Nordlund P; Molina DM The cellular thermal shift assay for evaluating drug target interactions in cells. Nat. Protoc 2014, 9, 2100–2122. [DOI] [PubMed] [Google Scholar]
- (35).Eckenrode JM; Mitra P; Rohr J; Leggas M Bioanalytical method for quantitative determination of mithramycin analogs in mouse plasma by HPLC-QTOF. Biomed. Chromatogr 2019, 33, No. e4544. [DOI] [PubMed] [Google Scholar]
- (36).Cons BMG; Fox KR Interaction of mithramycin with metal ions and DNA. Biochem. Biophys. Res. Commun 1989, 160, 517–524. [DOI] [PubMed] [Google Scholar]
- (37).Smith DA; Beaumont K; Maurer TS; Di L Volume of distribution in drug design. J. Med. Chem 2015, 58, 5691–5698. [DOI] [PubMed] [Google Scholar]
- (38).Ayrton A; Morgan P Role of transport proteins in drug absorption, distribution and excretion. Xenobiotica 2001, 31, 469–497. [DOI] [PubMed] [Google Scholar]
- (39).Emsley P; Cowtan K Coot: Model-building tools for molecular graphics. Acta Crystallogr., Sect. D: Biol. Crystallogr 2004, 60, 2126–2132. [DOI] [PubMed] [Google Scholar]
- (40).Lebedev AA; Young P; Isupov MN; Moroz OV; Vagin AA; Murshudov GN JLigand: A graphical tool for the CCP4 template-restraint library. Acta Crystallogr., Sect. D: Biol. Crystallogr 2012, 68, 431–440. [DOI] [PMC free article] [PubMed] [Google Scholar]
- (41).Collaborative Computational Project, Number 4. The CCP4 suite: Programs for protein crystallography. Acta Crystallogr., Sect. D: Biol. Crystallogr 1994, 50, 760–763. [DOI] [PubMed] [Google Scholar]
Associated Data
This section collects any data citations, data availability statements, or supplementary materials included in this article.