

Abstract
Introduction:
Few societal-level factors are established as risk or protective factors for sexual violence. Traditional gender norms and gender inequality are linked to sexual violence, but much of this research was conducted internationally or is becoming outdated and may not reflect current norms in the U.S. This study expands on previously published research by examining gender inequality’s association with state-level sexual violence.
Methods:
Using state-level prevalence estimates published in the National Intimate Partner and Sexual Violence Survey 2010–2012 State Report and the Gender Inequality Index, Pearson correlations were examined to investigate the relationship between state-level gender inequality and lifetime victimization for various types of sexual violence among U.S. female and male adults. The analysis was conducted in 2019.
Results:
Findings indicate that states with a high degree of gender inequality also report higher prevalence estimates among women for rape using physical force. Gender inequality was also negatively correlated with non-contact unwanted sexual experiences among women and men. In addition, an exploratory analysis of the relationship between individual indicators of gender inequality and violence outcomes suggest that adolescent birth rate, female government representation, and labor force participation demonstrate an association with certain state-level violence outcomes, although patterns were inconsistent.
Conclusions:
Although this study relied on cross-sectional data, collectively, these findings suggest that gender inequality may represent an important societal-level factor associated with SV among women and men. However, this relationship appears complex and requires further research. These findings have potential to inform population-level violence prevention approaches.
INTRODUCTION
Sexual violence (SV) is a highly prevalent public health issue in the U.S. Approximately 25.5 million women and 2.8 million men report a lifetime experience of completed or attempted rape.1 SV is associated with multiple negative health impacts and societal costs,2 with an estimated lifetime economic burden of $3.1 trillion for rape.3 Collectively, this research highlights the importance of identifying risk and protective factors that can inform prevention efforts.
To understand the risk for experiencing or perpetrating violence, the Centers for Disease Control and Prevention utilizes a four-level social-ecological model that highlights the complex interplay between factors at the individual, relationship, community, and societal levels.4 Limited research exists on how broader community- and societal-level factors influence the occurrence of SV with existing evidence focusing largely on individual- and relationship-level factors.5,6 However, prevention efforts that target community- and societal-level risk factors can leverage resources for greater population-level impact.7
At the societal level, feminist theory and research have long emphasized the etiological relationship between gender inequality and patriarchal beliefs and violence against women, positing that these beliefs reinforce the dominant position and power men hold over women and perpetuate male aggression toward women.8,9 Research generally supports a relationship between traditional gender norms and increased risk for violence perpetration, but studies have largely focused on the measurement of individual-level gender-related attitudes and beliefs.5,10–12 A few limited studies have examined gender inequality at the societal level, with findings suggesting a significant positive association with violence against women.13–17 For example, a cross-national test of women’s status in 44 countries found that gender bias in ownership property rights and societal norms accepting violence predicted population prevalence of partner violence.17 Studies focused specifically on high-income countries such as the U.S. have also identified an association between gender inequality and interpersonal violence.13–15 However, existing U.S.-based research relies on outdated data, which may not accurately reflect the current status of women in the U.S. Furthermore, international research may not reflect the U.S. sociopolitical context (e.g., indicators such as gender bias in ownership property rights). Only 2 recent U.S.-based studies examining interpersonal violence outcomes and gender inequality at the societal level were identified. Gressard et al.18 found that higher levels of state-level gender inequality were associated with higher prevalence of physical dating violence victimization among female, but not male, adolescents. Specific indicators of gender inequality (e.g., adolescent birth rate, educational attainment) were also significantly associated with female victimization, suggesting that these may be particularly important indicators of gender inequality as it relates to violence. More recently, Willie and Kershaw19 found that state-level gender inequality was associated with intimate partner violence (IPV) outcomes using a nationally representative sample, particularly psychological IPV victimization among women. Although both studies focused on violence by intimate partners and did not examine SV outcomes more broadly, the significant findings suggest that more research on this topic is warranted.
Utilizing a similar methodology, this study expands on previous research by examining indicators of gender inequality for each state and testing the association with state-level SV prevalence, using point estimates produced based on a large population-based sample of adults in the U.S. Building on previous research gaps, this study examines multiple forms of SV, including rape, sexual coercion, and contact and non-contact unwanted sexual experiences. Given the potential gains in gender equality over time, this study also incorporates the most recent state-level adult SV data available to provide a more-detailed and up-to-date understanding of gender disparities within the U.S. and their association with adult prevalence of SV victimization. The authors predicted that higher levels of gender inequality would be positively correlated with a higher prevalence of state-level SV outcomes, specifically among women. Based on previous research18,19 that suggests certain indicators were particularly associated with IPV victimization, this study also explored the relationship of individual indicators of gender inequality with SV outcomes.
METHODS
Study Sample
Gender inequality was calculated for each U.S. state and analyzed separately for males and females in relation to violence outcome measures. The sample size for each violence outcome equaled the number of individual U.S. states, as this was the unit of analysis (Table 1). Sample sizes varied because some states had statistically unreliable estimates for some victimization measures, particularly for men. For violence outcomes with limited state-level data available (<20 states), analyses could not be conducted (e.g., male rape and sexual coercion).
Table 1.
Prevalence Estimates of NISVS Sexual Violence Victimization
| Men | Women | |||||||
|---|---|---|---|---|---|---|---|---|
| Variable | Maximum weighted % amongst states | Minimum weighted % amongst states | Range | n | Maximum weighted % amongst states | Minimum weighted % amongst states | Range | n |
| Rape – completed or attempted forced penetration | – | – | – | – | 18.7 | 9.7 | 9.0 | 50 |
| Rape – completed alcohol/drug facilitated penetration | – | – | – | – | 15.4 | 4.6 | 10.8 | 46 |
| Sexual coercion | – | – | – | – | 20.0 | 9.1 | 10.9 | 49 |
| Unwanted sexual contact | 23.7 | 7.0 | 16.7 | 49 | 35.3 | 22.1 | 13.2 | 50 |
| Non-contact unwanted sexual experiences | 19.8 | 6.1 | 13.7 | 50 | 42.0 | 23.4 | 18.6 | 50 |
Note: The point estimates for sexual violence were obtained from the National Intimate Partner and Sexual Violence Survey (NISVS): 2010–2012 State Report; – indicates there were not enough reliable estimates reported for this outcome variable, thus analyses were not conducted.
Measures
Data on state-level violence outcomes were point estimates obtained from the National Intimate Partner and Sexual Violence Survey (NISVS) 2010–2012 State Report based on annual population-based surveys that provide lifetime SV prevalence estimates.20 NISVS is an ongoing, nationally representative random-digit-dial telephone survey offering data on the adult U.S. population (aged ≥18 years) using a dual-frame sampling strategy, including landlines and cell phones. It provides lifetime prevalence estimates of SV, stalking, and IPV at the national and state levels. For the years 2010–2012, a total of 41,174 interviews were completed (22,590 women and 18,584 men) and 4,501 were partially completed. Completed interviews were conducted by landline (43.3%) and cell phone (56.7%). Overall weighted response rates across 3 years ranged from 27.5% to 33.6%, with weighted cooperation rates ranging from 80.3% to 83.5%. Additional detail regarding survey methodology can be found in the NISVS 2010–2012 State Report.20 This report used aggregated 2010–2012 NISVS data because the combined data set provides the greatest number of reliable estimates at the state level.
State-level estimates for lifetime experiences of 5 distinct forms of SV are included in NISVS: rape (completed or attempted forced penetration), rape (completed alcohol/drug facilitated penetration), sexual coercion, unwanted sexual contact, and non-contact unwanted sexual experiences. Research indicates that perpetrators of various types of SV demonstrate different risk and protective factors,21–23 including studies demonstrating differences between forcible rape versus drug and alcohol facilitated rape in the type of perpetrator, relationship to victim, and impacts on the victim.24 Therefore, rape by completed or attempted forced penetration and rape by alcohol/drug facilitated penetration were examined separately in this study. The definitions for each SV outcome are included in Appendix Table 1, available online. Specific questions associated with each of these variables are described in the 2010–2012 State Report.20
The UN Development Programme created the Gender Inequality Index (GII) to measure discrimination and loss of achievement owing to gender inequality at the country level.25 The GII includes 3 dimensions: reproductive health, empowerment, and the labor market. Reproductive health is measured by maternal mortality rate and adolescent birth rates; empowerment is measured by the proportion of male and female adults with at least secondary education and the number of parliamentary seats occupied by female adults; and the labor market is measured by labor force participation rate in male and female individuals aged ≥15 years.25 GII scores range from 0.0 to 1.0, with higher scores reflecting greater gender inequality. The UN Development Programme report included scores for 148 countries, including low-, middle-, and high-income countries (including the U.S.).25 To control for time-related variance, GII indicator data in this study used a similar timeframe to that of the NISVS state report (2010–2012). Following a similar method used in previous research,18,19 state-level GII indicators and associated data sources include items described below.
Maternal mortality rate is defined as the number of maternal deaths per 100,000 live births. However, there have been some inconsistencies in reporting and validity, which has resulted in an increase in the maternal mortality rate.26 Specifically, data incompatibilities were created by the delayed state-level adoption of a new U.S. standard death certificate with checkboxes indicating maternal death.26,27 To account for these potential discrepancies, this study modeled the approach in Willie and Kershaw,19 who utilized the Centers for Disease Control and Prevention WONDER database to identify state-level data on maternal deaths that were proximal to pregnancy, childbirth, and the puerperium (ICD 10 O00–O99), and live births.28 An approximate state-level maternal mortality rate was calculated using live births as the denominator and maternal deaths as the numerator. Data from 2008 to 2012 were used to establish reliable estimates for each state, with 3 exceptions (Alaska, Maine, and Vermont). For these states, a threshold value of 10 deaths per 100,000 was used, consistent with sensitivity analyses suggesting that countries reporting <10 deaths per 100,000 were performing at a similar level.29
The adolescent birth rate was measured by the number of births to women aged 15–19 years per 1,000 women, using state-level 2012 data from the National Vital Statistics System.30
Government representation was measured using the percentage of male and female elected legislators in each state during the year 2012 and was calculated using data from a fact sheet created by the Center for American Women and Politics.31
Secondary-level educational attainment was calculated using the 3-year 2010–2012 estimate from the American Community Survey.32 This indicator represents the percentage of men and women aged ≥25 years that report having a high school diploma or higher in each state.
Labor force participation was also calculated using the 3-year 2010–2012 estimate from the American Community Survey to calculate the percentage of non-institutionalized men and women aged 20–64 years who are participating in the civilian labor force in each state.32
Statistical Analysis
The GII scores were calculated using algebraic formulas and methodology outlined in the UN Development Programme report (hdr.undp.org/sites/default/files/hdr_2013_en_technotes.pdf). Pearson correlation coefficients were computed to measure the association between each violence outcome and the GII. To model the relationship between the individual GII indicators and violence outcomes, all GII indicators were included as predictors in an ordinary least squares regression model. In addition to standardized beta coefficients, partial correlation coefficients are reported because a partial correlation removes all other variance in the model, leaving only the variance of the GII indicator and outcome variable.33 Consistent with Gressard and colleagues,18 analyses examining GII indicators utilized the male/female ratio (% of men in each state divided by % of women), instead of the female rate alone, for both educational attainment and labor force participation indicators. This was done to control for the overall rate of those indicators in each state. The analysis was conducted in 2019.
RESULTS
Gender inequality was relatively low across all 50 states, with a mean state-level GII score of 0.23 (SD=0.06), a median of 0.22, and a range from 0.09 to 0.36. The GII scores for individual states are reported in Appendix Table 2, available online. Prevalence estimates of lifetime SV victimization are summarized in Table 1. Bivariate correlations between GII and violence outcomes are reported in Table 2. All the assumptions for calculating bivariate correlations were met. Normality was tested using the Shapiro–Wilk test, with values ranging from 0.944 to 0.991 (none significant at p<0.05). Linearity and heteroscedasticity were tested through visual examination of scatterplots.
Table 2.
Sexual Violence and State-level Gender Inequality Index Bivariate Correlations
| Men | Women | |||
|---|---|---|---|---|
| Variable | r | p-value | r | p-value |
| Rape – completed or attempted forced penetration | – | – | 0.322 | 0.022* |
| Rape – completed alcohol/drug facilitated penetration | – | – | –0.210 | 0.162 |
| Sexual coercion | – | – | 0.000 | 1.000 |
| Unwanted sexual contact | –0.209 | 0.150 | –0.203 | 0.157 |
| Non-contact unwanted sexual experiences | –0.341 | 0.015* | –0.396 | 0.004** |
Note: r=Pearson correlation coefficient;
Boldface indicates statistical significance (*p≤0.05; **p≤0.01);
– indicates that there were not enough reliable estimates reported for this outcome variable, thus a correlation could not be produced. Violence outcome data were obtained from the National Intimate Partner and Sexual Violence Survey (NISVS): 2010–2012 State Report.
Results indicated that state-level GII was correlated with some SV outcomes. Among women, a significant positive correlation was found between GII and completed or attempted rape using force (r =0.322, p<0.05), indicating that states with higher gender inequality have higher prevalence estimates for rape using force. State-level estimates for rape using physical force and GII scores were mapped to provide further descriptive information and illustrate state-by-state variation of both measures (Figure 1). As shown, states with higher GII scores (i.e., greater gender inequality) were observed in the southern, southeastern, and mountain regions of the U.S. States, whereas lower GII scores (i.e., lower gender inequality) were observed in the Pacific west and northeastern regions of the U.S. (Figure 1A). Although statistical testing was not performed on the regional patterns of either measure, higher state-level estimates for rape using physical force were also observed in the southern and mountain regions of the U.S. (Figure 1B).
Figure 1.
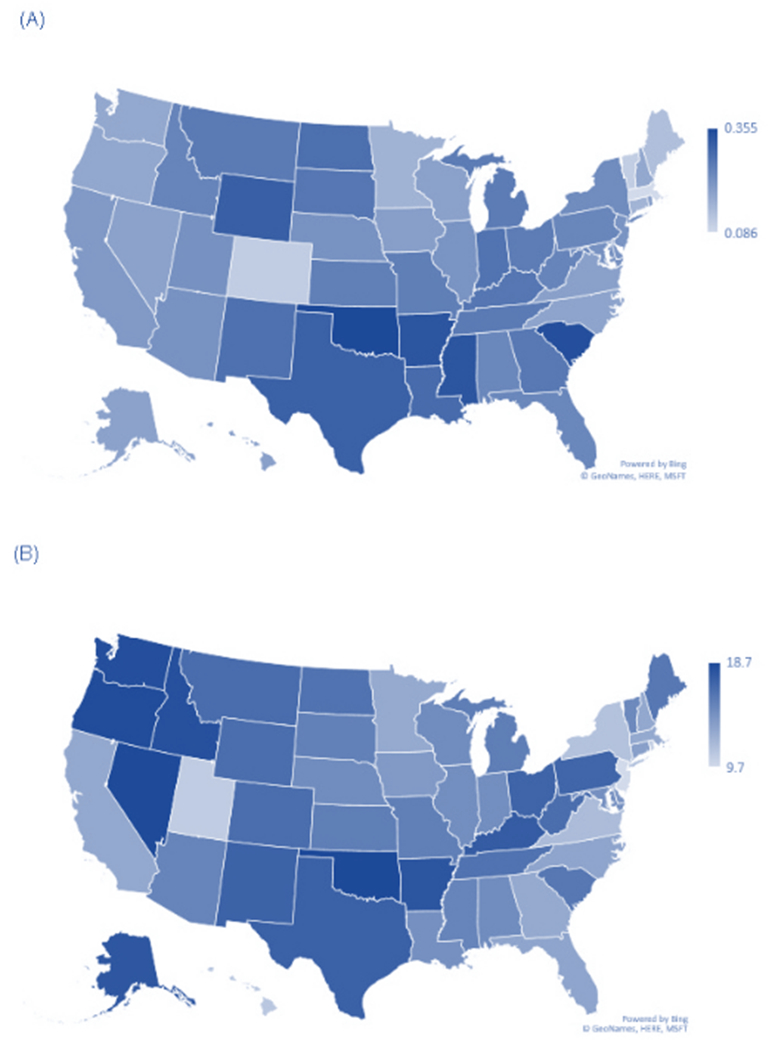
U.S. maps of Gender Inequality Index scores and lifetime prevalence estimates among women for completed or attempted rape using force. (A) Gender Inequality Index scores, by state. (B) Lifetime prevalence estimates among women for completed or attempted rape using force, by state.
Note: No statistical testing was performed on any regional patterns in the state-by-state variation of either measure.
In addition, significant negative correlations were found between GII and non-contact unwanted sexual experiences among both women (r= –0.396, p<0.01) and men (r= –0.341, p<0.05; Table 2). This suggests that states with lower gender inequality had higher prevalence of non-contact unwanted sexual experiences.
To explore the relationship between individual GII indicators and violence outcomes, an ordinary least squares regression was conducted, and multiple partial correlations were calculated between violence outcomes and the state-level data on maternal mortality rate, adolescent birth rate, percentage female government representation, male/female ratios for educational attainment, and male/female ratios for labor force participation (Table 3). Among men, only 1 significant correlation was identified. Specifically, the male/female ratio for labor force participation was positively correlated with non-contact unwanted sexual experiences (r= 0.374, p<0.01). This suggests that states where men participate in the work force at higher rates relative to women report higher prevalence estimates for non-contact SV against men. Among women, female government representation was positively correlated with unwanted sexual contact (r= 0.429, p<0.01) and non-contact unwanted sexual experiences (r= 0.336, p<0.05). Thus, states with higher rates of female political representation demonstrated higher prevalence estimates for these 2 forms of SV. The adolescent birth rate was also positively correlated with completed or attempted rape using physical force (r= 0.518, p<0.001), suggesting that states with higher adolescent birth rates reported higher estimates for forced rape victimization among women.
Table 3.
State-level Gender Inequality Index Indicator Partial Correlations With Sexual Violence Outcomes
| Variable | Maternal mortality rate | Adolescent birth rate | Percent female government representation | Male/female ratio educational attainment | Male/female ratio, labor force participation | ||||||||||
|---|---|---|---|---|---|---|---|---|---|---|---|---|---|---|---|
| β | r | p-value | β | r | p-value | β | r | p-value | β | r | p-value | β | r | p-value | |
| Men | |||||||||||||||
| Rape – completed or attempted forced penetration | – | – | – | – | – | – | – | – | – | – | – | – | – | – | – |
| Rape – completed alcohol/drug facilitated penetration | – | – | – | – | – | – | – | – | – | – | – | – | – | – | – |
| Sexual coercion | – | – | – | – | – | – | – | – | – | – | – | – | – | – | – |
| Unwanted sexual contact | −0.16 | −0.15 | 0.333 | −0.09 | −0.07 | 0.670 | −0.04 | −0.03 | 0.834 | −0.07 | −0.06 | 0.705 | −0.05 | −0.05 | 0.766 |
| Non-contact unwanted sexual experiences | −0.04 | −0.04 | 0.780 | −0.36 | −0.29 | 0.052 | 0.17 | 0.16 | 0.298 | −0.04 | −0.04 | 0.780 | 0.40 | 0.37 | 0.010** |
| Women | |||||||||||||||
| Rape – completed or attempted forced penetration | −0.04 | −0.04 | 0.788 | 0.68 | 0.52 | 0.001*** | 0.14 | 0.13 | 0.376 | 0.10 | 0.10 | 0.502 | −0.14 | −0.15 | 0.326 |
| Rape – completed alcohol/drug facilitated penetration | −0.26 | −0.24 | 0.119 | 0.38 | 0.28 | 0.075 | 0.21 | 0.19 | 0.220 | 0.34 | 0.30 | 0.054 | −0.21 | −0.19 | 0.218 |
| Sexual coercion | 0.12 | 0.11 | 0.481 | 0.09 | 0.07 | 0.667 | 0.17 | 0.14 | 0.351 | 0.19 | 0.17 | 0.278 | 0.05 | 0.04 | 0.784 |
| Unwanted sexual contact | 0.11 | 0.11 | 0.489 | 0.10 | 0.08 | 0.600 | 0.50 | 0.43 | 0.003** | 0.09 | 0.09 | 0.557 | 0.03 | 0.03 | 0.833 |
| Non-contact unwanted sexual experiences | −0.15 | −0.15 | 0.319 | −0.02 | −0.02 | 0.895 | 0.37 | 0.34 | 0.023* | 0.11 | 0.11 | 0.472 | 0.23 | 0.23 | 0.133 |
Note: β=standardized beta coefficient; r=Partial correlation coefficient.
Boldface indicates statistical significance (*p≤0.05; **p≤0.01; ***p≤ 0.001).
– indicates there were not enough reliable estimates reported for this outcome variable, thus a correlation could not be produced. All Gender Inequality Index (GII) indicators were included as predictors in an ordinary least squares regression model. Violence outcome data were obtained from the National Intimate Partner and Sexual Violence Survey (NISVS): 2010–2012 State Report.
DISCUSSION
Overall, the findings suggest mixed results on the association of gender inequality with SV. States with higher gender inequality report higher prevalence estimates among women for completed or attempted rape using physical force. This finding is consistent with past international and U.S.-based research demonstrating an association between gender inequality and violence against women.17–19 However, this study did not identify significant positive correlations with other forms of SV.
Interestingly, lower levels of gender inequality were associated with higher state-level prevalence estimates for non-contact forms of SV (e.g., someone exposing their sexual body parts, harassing the victim in a public place). Although this finding contradicted the original hypothesis, other research highlights the potentially complex relationship between gender equality and violence. For example, Nordic countries demonstrate high levels of gender equality across multiple indicators, but also report high prevalence for violence against women.34 Referred to as the “Nordic paradox,” researchers have theorized that this may reflect a backlash effect as the status of women changes and men lose their traditionally dominant positions in society.34 Longitudinal studies have also shown that as gender equality increases, there are short-term increases in SV rates, but long-term ameliorative effects on SV.14 Consistent with the backlash theory, this study also found that states with a higher percentage of female government representation demonstrated higher prevalence of certain forms of SV.
The finding that men also experience higher prevalence of non-contact SV in states with lower gender inequality is unexpected. However, researchers have theorized that organizational tolerance for sexual harassment and pressure to adhere to sex role stereotypes can perpetuate aggression toward both women and men who do not conform to traditional gender norms.35 Research indicates that both male and female sexual harassment victims most commonly report male perpetrators, with qualitative data highlighting gender nonconformity in men as a target for harassment.36 This study also found that states where men participate in the workforce at higher rates relative to women report higher prevalence estimates for non-contact SV, which is consistent with research suggesting that sexual harassment rates are higher in male-dominated industries and occupations.36 However, more research is needed to better understand how gender inequality and related indicators are associated with SV victimization among men.
Collectively, the findings on state-level SV estimates and their association with female government representation and labor force participation highlight the potentially complex relationship between gender inequality and SV. Additional research is needed to replicate these findings and identify potential underlying mechanisms that could explain these associations. This research could have important prevention implications, as evidence suggests that programs that strengthen leadership and opportunities for women and support improved outcomes in education, employment, and community engagement (including political participation) have been identified as an important approach for preventing SV.37 However, these findings also suggest that prevention efforts focused on increasing gender equality may benefit from closely monitoring and responding to potential backlash effects, including possible increases in certain types of SV.
This research also highlights the importance of examining individual components of gender inequality in relation to SV. In addition to previously described findings on female government representation and labor force participation, adolescent birth rates emerged as having a strong association with lifetime estimates of forced rape among women, a pattern also documented in previous research.18 Studies have shown that teenage mothers are at higher risk for experiencing violence during and after pregnancy.38–41 Consistent with this research, states with high adolescent birth rates reported correspondingly high prevalence of forced rape. These findings suggest a potential point of intervention, as programs and policies to improve adolescent sexual and reproductive health may decrease the risk for both pregnancy and SV.37,42,43 As discussed in Gressard et al.,18 this finding also suggests the importance of reproductive health indicators when measuring gender inequality. These results merit further investigation, but should be carefully considered within the context of study limitations.
Limitations
Of note, this study was unable to statistically control for other state-level confounding factors (e.g., demographic, economic factors) owing to low power and small sample size. This is inevitable when using state-level data to examine the U.S. context. Nevertheless, small samples of this nature are generally insufficient to provide stable estimates that reflect the true magnitude of the relationship. As demonstrated in Figure 1, although patterns are evident between the GII and estimates of forced rape, this association is stronger in some states and regions than others. This highlights the importance of incorporating other state-level contextual factors (e.g., cultural, historical, economic, demographic factors) to understand the relationship between gender inequality and prevalence of SV. Future research would benefit from more comprehensive measurement of state-level factors (e.g., income, age, race/ethnicity) that may contribute to a higher violence victimization prevalence. Furthermore, effect sizes identified in this study were small to moderate in size. It is important to use caution when interpreting the current findings, given the size of the correlations and the need for more information on how gender inequality interacts with other influential factors at the individual and relationship levels. Longitudinal research that can demonstrate a causal relationship between gender inequality and violence is also needed, as this study relied on the use of cross-sectional data. Because this was an exploratory study, the significance level was set at <0.05 to minimize risk for Type II error and to be sensitive to potential relationships worthy of further investigation. However, the number of statistical tests conducted and associated Type I error risk represents a study limitation. Additionally, the GII may be limited in its ability to fully measure gender inequality in the U.S. It bears mentioning that GII scores do not differentiate between high inequalities for women versus men. As women make advances in the areas of educational attainment, government representation, and labor force participation, the GII may need modification to capture ongoing areas of inequality between women and men. Future research may benefit from examining gender inequality using other established measures (e.g., the Gender-Related Development Index or Gender Empowerment Measure),44 as well as exploring innovative ways of measuring gender disparities both internationally and specifically within the U.S. (e.g., pay ratios, female CEOs, women employed in higher education).
Importantly, examining gender inequality at the state level does not allow inference to the impact of gender inequality on violence at the individual level (i.e., ecological fallacy). Previous research demonstrates a relationship between individual-level gender-related attitudes and beliefs and the risk for violence perpetration, whereas the findings in this study suggest more mixed results on the relationship between gender inequality and violence risk at the societal level. However, many individual-level interventions focused on changing attitudes and beliefs have limited to no effect on SV outcomes and short-lived effects on knowledge and attitude changes.45
CONCLUSIONS
Intervening at the societal level creates opportunities to address social, cultural, structural, and environmental influences on the risk for SV,45 often requiring less individual effort and resources for implementation.46 This research improves understanding of the association of gender inequality with SV by building on previous research and providing a more detailed and up-to-date analysis of current gender disparities within the U.S. This study highlights the potential importance of addressing gender inequality as part of a comprehensive strategy for preventing violence.
Supplementary Material
ACKNOWLEDGMENTS
The authors would like to thank Lindsay Gressard and Monica Swahn for their assistance and consultation in calculating the Gender Inequality Index.
The findings and conclusions in this report are those of the authors and do not necessarily represent the official position of the Centers for Disease Control and Prevention.
Footnotes
No financial disclosures were reported by the authors of this paper.
REFERENCES
- 1.Smith SG, Zhang X, Basile KC, et al. The National Intimate Partner and Sexual Violence Survey (NISVS): 2015 Data Brief. Atlanta, GA: National Center for Injury Prevention and Control, CDC; 2018. [Google Scholar]
- 2.Basile KC, Smith SG. Sexual violence victimization of women: prevalence, characteristics, and the role of public health and prevention. Am J Lifestyle Med. 2011;5(5):407–417. 10.1177/1559827611409512. [DOI] [Google Scholar]
- 3.Peterson C, DeGue S, Florence C, Lokey CN. Lifetime economic burden of rape among U.S. adults. Am J Prev Med. 2017;52(6):691–701. 10.1016/j.amepre.2016.11.014. [DOI] [PMC free article] [PubMed] [Google Scholar]
- 4.Dahlberg LL, Krug EG. Violence-a global public health problem In: Krug E, Dahlberg LL, Mercy JA, Zwi AB, Lozano R, eds. World Report on Violence and Health. Geneva, Switzerland: WHO; 2002:1–56. [Google Scholar]
- 5.Tharp AT, DeGue S, Valle LA, Brookmeyer KA, Massetti GM, Matjasko JL. A systematic qualitative review of risk and protective factors for sexual violence perpetration. Trauma Violence Abuse. 2013;14(2):133–167. 10.1177/1524838012470031. [DOI] [PubMed] [Google Scholar]
- 6.Vagi KJ, Rothman EF, Latzman NE, Tharp AT, Hall DM, Breiding MJ. Beyond correlates: a review of risk and protective factors for adolescent dating violence perpetration. J Youth Adolesc. 2013;42(4):633–649. 10.1007/s10964-013-9907-7. [DOI] [PMC free article] [PubMed] [Google Scholar]
- 7.CDC. Preventing multiple forms of violence: a strategic vision for connecting the dots. Atlanta, GA: Division of Violence Prevention, National Center for Injury Prevention and Control, CDC; 2016. www.cdc.gov/violenceprevention/pdf/Strategic_Vision.pdf. Accessed September 3, 2019. [Google Scholar]
- 8.Dobash RE, Dobash R. Violence against wives: A case against the patriarchy. New York, NY: Free Press; 1979. [Google Scholar]
- 9.Heise LL. Violence against women: an integrated, ecological framework. Violence Against Women. 1998;4(3):262–290. 10.1177/1077801298004003002. [DOI] [PubMed] [Google Scholar]
- 10.Reyes HLM, Foshee VA, Niolon PH, Reidy DE, Hall JE. Gender role attitudes and male adolescent dating violence perpetration: normative beliefs as moderators. J Youth Adolesc. 2016;45(2):350–360. 10.1007/s10964-015-0278-0. [DOI] [PMC free article] [PubMed] [Google Scholar]
- 11.Reed E, Silverman JG, Raj A, Decker MR, Miller E. Male perpetration of teen dating violence: associations with neighborhood violence involvement, gender attitudes, and perceived peer and neighborhood norms. J Urban Health. 2011;88(2):226–239. 10.1007/s11524-011-9545-x. [DOI] [PMC free article] [PubMed] [Google Scholar]
- 12.McCauley HL, Tancredi DJ, Silverman JG, et al. Gender-equitable attitudes, bystander behavior, and recent abuse perpetration against heterosexual dating partners of male high school athletes. Am J Public Health. 2013;103(10):1882–1887. 10.2105/ajph.2013.301443. [DOI] [PMC free article] [PubMed] [Google Scholar]
- 13.Baron L, Straus MA. Four theories of rape: a macrosociological analysis. Soc Probl. 1987;34(5):467–489. 10.1525/sp.1987.34.5.03a00060. [DOI] [Google Scholar]
- 14.Whaley RB. The paradoxical relationship between gender inequality and rape: toward a refined theory. Gend Soc. 2001;15(4):531–555. 10.1177/089124301015004003. [DOI] [Google Scholar]
- 15.Yllo K Sexual equality and violence against wives in American states. J Comp Fam Stud. 1983;14(1):67–86. [Google Scholar]
- 16.Yodanis CL. Gender inequality, violence against women, and fear: a cross-national test of the feminist theory of violence against women. J Interpers Violence. 2004;19(6):655–675. 10.1177/0886260504263868. [DOI] [PubMed] [Google Scholar]
- 17.Heise LL, Kotsadam A. Cross-national and multilevel correlates of partner violence: an analysis of data from population-based surveys. Lancet Glob Health. 2015;3(6):e332–e340. 10.1016/s2214-109x(15)00013-3. [DOI] [PubMed] [Google Scholar]
- 18.Gressard LA, Swahn MH, Tharp AT. A first look at gender inequality as a societal risk factor for dating violence. Am J Prev Med. 2015;49(3):448–457. 10.1016/j.amepre.2015.05.017. [DOI] [PMC free article] [PubMed] [Google Scholar]
- 19.Willie TC, Kershaw TS. An ecological analysis of gender inequality and intimate partner violence in the United States. Prev Med. 2019;118:257–263. 10.1016/j.ypmed.2018.10.019. [DOI] [PMC free article] [PubMed] [Google Scholar]
- 20.Smith SG, Chen J, Basile KC, et al. The National Intimate Partner and Sexual Violence Survey (NISVS): 2010–2012 State Report. Atlanta, GA: National Center for Injury Prevention and Control, CDC; 2017. www.cdc.gov/violenceprevention/nisvs/summaryreports.html. [Google Scholar]
- 21.Abbey A, Parkhill MR, Clinton-Sherrod AM, Zawacki T. A comparison of men who committed different types of sexual assault in a community sample. J Interpers Violence. 2007;22(12):1567–1580. 10.1177/0886260507306489. [DOI] [PMC free article] [PubMed] [Google Scholar]
- 22.Zawacki T, Abbey A, Buck PO, McAuslan P, Clinton-Sherrod AM. Perpetrators of alcohol-involved sexual assaults: how do they differ from other sexual assault perpetrators and nonperpetrators? Aggress Behav. 2003;29(4):366–380. 10.1002/ab.10076. [DOI] [PMC free article] [PubMed] [Google Scholar]
- 23.Tyler KA, Hoyt DR, Whitbeck LB. Coercive sexual strategies. Violence Vict. 1998;13(1):47–61. [PubMed] [Google Scholar]
- 24.Kilpatrick DG, Resnick HS, Ruggiero KJ, Conoscenti LM, McCauley J. Drug-facilitated, incapacitated, and forcible rape: a national study. Charleston, SC: National Criminal Justice Reference Service, 2007. [Google Scholar]
- 25.UN Development Program. 2013 Human Development Report: the rise of the South: human progress in a diverse world. New York, NY: UNDP; 2013. http://hdr.undp.org/en/2013-report. Accessed September 20, 2018. [Google Scholar]
- 26.Callaghan WM. Overview of maternal mortality in the United States. Semin Perinatol. 2012;36(1):2–6. 10.1053/j.semperi.2011.09.002. [DOI] [PubMed] [Google Scholar]
- 27.MacDorman MF, Declercq E, Cabral H, Morton C. Is the United States maternal mortality rate increasing? Disentangling trends from measurement issues. Obstet Gynecol. 2016;128(3):447–455. 10.1097/aog.0000000000001556. [DOI] [PMC free article] [PubMed] [Google Scholar]
- 28.CDC, National Center for Health Statistics. Underlying cause of death 1999–2017 on CDC WONDER Online Database, released December 2018. http://wonder.cdc.gov/ucd-icd10.html. Accessed February 21, 2019.
- 29.Gaye A, Klugman J, Kovacevic M, Twigg S, Zambrano E. Measuring key disparities in human development: the Gender Inequality Index UN Development Programme: Human Development Reports Research Paper. http://hdr.undp.org/en/content/measuring-key-disparities-human-development. Published 2010. Accessed September 6, 2019.
- 30.Martin JA, Hamilton BE, Osterman MJK, Curtin SC, Mathews TJ. Births: final data for 2012. Natl Vital Stat Rep. 2013;62(9):1–86. [PubMed] [Google Scholar]
- 31.Center for American Women and Politics. Fact sheet: women in state legislatures 2012. New Brunswick, NJ; 2012. http://cawp.rutgers.edu/sites/default/files/resources/stleg2012.pdf. Accessed September 20, 2018. [Google Scholar]
- 32.U.S. Census Bureau. American Community Survey: American Fact-Finder: 2010–2012, 3-Year Estimates. https://factfinder.census.gov/faces/nav/jsf/pages/index.xhtml. Published 2013. Accessed September 20, 2018.
- 33.Cohen J, Cohen P, West SG, Aiken LS. Applied multiple regression/correlation analysis for the behavioral sciences. 3rd ed. Mahwah, NJ: Lawrence Erlbaum Associates, Inc.; 2003. [Google Scholar]
- 34.Gracia E, Merlo J. Intimate partner violence against women and the Nordic paradox. Soc Sci Med. 2016;157:27–30. 10.1016/j.socscimed.2016.03.040. [DOI] [PubMed] [Google Scholar]
- 35.Stockdale MS, Visio M, Batra L. The sexual harassment of men: evidence for a broader theory of sexual harassment and sex discrimination. Psychol Public Policy Law. 1999;5(3):630–664. 10.1037//1076-8971.5.3.630. [DOI] [Google Scholar]
- 36.McLaughlin H, Uggen C, Blackstone A. Sexual harassment, workplace authority, and the paradox of power. Am Sociol Rev. 2012;77(4):625–647. 10.1177/0003122412451728. [DOI] [PMC free article] [PubMed] [Google Scholar]
- 37.Basile KC, DeGue S, Jones K, et al. STOP SV: a technical package to prevent sexual violence. Atlanta, GA: National Center for Injury Prevention and Control, CDC; 2016. 10.15620/cdc.39126. [DOI] [Google Scholar]
- 38.Gessner BD, Perham-Hester KA. Experience of violence among teenage mothers in Alaska. J Adolesc Health. 1998;22(5):383–388. 10.1016/s1054-139x(97)00257-7. [DOI] [PubMed] [Google Scholar]
- 39.Harrykisson SD, Rickert VI, Wiemann CM. Prevalence and patterns of intimate partner violence among adolescent mothers during the postpartum period. Arch Pediatr Adolesc Med. 2002;156(4):325–330. 10.1001/archpedi.156.4.325. [DOI] [PubMed] [Google Scholar]
- 40.Berenson AB, San Miguel VV, Wilkinson GS. Prevalence of physical and sexual assault in pregnant adolescents. J Adolesc Health. 1992;13(6):466–469. 10.1016/1054-139x(92)90008-y. [DOI] [PubMed] [Google Scholar]
- 41.Parker B, McFarlane J, Soeken K. Abuse during pregnancy: effects on maternal complications and birth weight in adult and teenage women. Obstet Gynecol. 1994;84(3):323–328. [PubMed] [Google Scholar]
- 42.Silverman JG, Raj A, Clements K. Dating violence and associated sexual risk and pregnancy among adolescent girls in the United States. Pediatrics. 2004;114(2):e220–e225. 10.1542/peds.114.2.e220. [DOI] [PubMed] [Google Scholar]
- 43.Lundgren R, Amin A. Addressing intimate partner violence and sexual violence among adolescents: emerging evidence of effectiveness. J Adolesc Health. 2015;56(1 suppl):S42–S50. 10.1016/j.jadohealth.2014.08.012. [DOI] [PubMed] [Google Scholar]
- 44.UN Development Program. Human Development Report 1995. New York, NY: Oxford University Press; 1995. http://hdr.undp.org/en/content/human-development-report-1995. Accessed September 6, 2019. [Google Scholar]
- 45.DeGue S, Hipp TN, Herbst JH. Community-level approaches to prevent sexual violence In Jeglic E, Calkins C, eds., Sexual Violence. Springer; 2016:161–179. 10.1007/978-3-319-44504-5_11. [DOI] [Google Scholar]
- 46.Frieden TR. A framework for public health action: the health impact pyramid. Am J Public Health. 2010;100(4):590–595. 10.2105/ajph.2009.185652. [DOI] [PMC free article] [PubMed] [Google Scholar]
Associated Data
This section collects any data citations, data availability statements, or supplementary materials included in this article.