

Abstract
Objectives. To examine correlates of applying for accreditation among small local health departments (LHDs) in the United States through 2019.
Methods. We used administrative data from the Public Health Accreditation Board (PHAB) and 2013, 2016, and 2019 Profile data from the National Association of County and City Health Officials to examine correlates of applying for PHAB accreditation. We fit a latent class analysis (LCA) to characterize LHDs by service mix and size. We made bivariate comparisons using the t test and Pearson χ2.
Results. By the end of 2019, 126 small LHDs had applied for accreditation (8%). When we compared reasons for not pursuing accreditation, we observed a difference by size for perceptions that standards exceeded LHD capacity (47% for small vs 22% for midsized [P < .001] and 0% for large [P < .001]).
Conclusions. Greater funding support, considering differing standards by LHD size, and recognition that service mix might affect practicality of accreditation are all relevant considerations in attempting to increase uptake of accreditation for small LHDs.
Public Health Implications. Overall, small LHDs represented about 60% of all LHDs that had not yet applied to PHAB.
The Public Health Accreditation Board (PHAB) is the national voluntary accreditation program for public health departments in the United States, including state, tribal, local, and territorial health departments, as well as Army Installation Departments of Public Health. As of June 2020—about 7 years after the first health department was accredited—a total of 296 health departments and 1 centralized public health system were accredited. Among those accredited, 255 were local health departments (LHDs).1
Accreditation is based on a set of standards and measures that were developed through a consensus process. Health departments’ conformity with these standards is assessed by trained peer reviewers.2 An ongoing evaluation has revealed a variety of benefits as reported by accredited health departments relating to quality improvement and performance management, accountability and transparency, and collaboration, among other areas.3–8 Research studies comparing data from health departments engaged in accreditation and those not engaged have reported relationships between pursuit of accreditation and quality improvement and performance management,9 classification of jurisdictions as comprehensive public health systems,10 prevalence of evidence-based decision-making and practices,11,12 and policy involvement.13
However, the rate of accreditation uptake has not been uniform among all health departments. Identified barriers include limited staff time, competing priorities, staff turnover, standards exceeding capacity, and costs.14,15 Several studies have focused on the challenges facing small or rural health departments, which have historically been less likely to pursue accreditation. In addition to the aforementioned challenges, small LHDs point to the many different roles that limited staff may be asked to play and a lack of examples of accreditation documentation relevant to smaller health departments.14,16 Recognizing that smaller health departments are underrepresented among accredited health departments, the PHAB Board of Directors and the Board of Directors of the National Association of County and City Health Officials (NACCHO) formed a Joint Task Force to explore this issue. The Joint Task Force met in 2019 and 2020 to better understand the needs of small LHDs and consider accreditation support and related interventions. This article represents the empirical examination of the Joint Task Force’s interest in further exploring the following: (1) the rates of accreditation uptake among small health departments over time and by budget and staff size, (2) the factors contributing to their decision to not apply, and (3) whether the service mix of small LHDs is associated with likelihood of applying.
METHODS
We analyzed data from NACCHO’s National Profile of Local Health Departments (Profile) study and administrative data collected by PHAB from applicants.17 Primary objectives of the study were to track trends in application among small LHDs, defined in this article as those serving jurisdictions of fewer than 50 000 people, compared with midsized (50 000–499 999 people) and large (≥ 500 000 people) LHDs. In addition, we sought to understand small LHDs’ barriers to accreditation and characterize the heterogeneity among small LHDs in service mix for use in determining if different groups of LHDs differentially applied to PHAB.
NACCHO surveys all LHDs in the United States. We used data from the 2013, 2016, and 2019 Profile studies in this analysis. We captured population data from the Census Bureau for the LHD jurisdictions. We examined LHD staffing, as well as service mix data from the most recently available year as part of an LCA. Otherwise, we used data from Profile respondents from each year when examining trends over time. Overall response rates for the Profile studies were 79% in 2013, 76% in 2016, and 61% in 2019. Response rates for small LHDs were 74%, 71%, and 56% in 2013, 2016, and 2019, respectively. Staffing and spending levels were cleaned and examined for outliers, and descriptive statistics were generated on Profile data.
We merged PHAB data, collected through the application process, by NACCHO identification number. We designated LHDs in analysis if they were applicants from the states of Florida or Ohio. In Florida, the centralized public health system, comprising all 67 LHDs, was accredited, rather than the individual LHDs. In Ohio, a statute required all 113 LHDs to apply for PHAB accreditation by 2018.
We conducted an LCA to examine activity and service mix among LHDs. The LCA constituted classes by characterizing the number and types of activities LHDs conducted as well as the proportion of activities by type. The primary types of activities were clinical, inspection and regulation, and population-based prevention and epidemiology. We grouped activity types in line with existing NACCHO activity domains.18 We examined goodness of fit for 2 to 7 classes using likelihood ratio χ2. We also examined model and fit performance for conceptual delineation, finding the best performance at 3 and 5 classes. For purposes of this article, we selected 5 classes because of greater explanatory power. We conducted the LCA for all available LHDs under the rationale that it is desirable to characterize the service mix across LHDs in the United States to better understand how small LHDs fit into the national picture.
We generated descriptive statistics to examine application trends over time. We made bivariate comparisons for application status for LHD staff size and per-capita expenditures in a given year by using the Student t test. We made bivariate comparisons to identify associations between the reasons for not applying for PHAB accreditation among small LHDs and completion of select accreditation prerequisites, workforce size, or budget size. We calculated application status by latent class and population size. We ran a sensitivity analysis to separate states with state-specific accreditation programs (either voluntary or mandatory), including Illinois, Michigan, Missouri, and North Carolina. We also conducted stratified analyses in the under-50 000 population size to characterize heterogeneity of service provision within the group. We collected data in the Qualtrics Web platform (Qualtrics LLC, Provo, UT), managed and analyzed in Stata version 16.1 (StataCorp LP, College Station, TX), and visualized in Tableau (Tableau Software, Seattle, WA).
RESULTS
By the end of 2019, 455 LHDs had applied for accreditation through PHAB. These included 126 small LHDs, 249 midsized LHDs, and 80 large LHDs (Figure 1). Among small LHDs, this represents an increase from 41 LHDs that had applied by 2013. Overall, by 2019, about 8% of all small LHDs had applied, though most of these were associated with statewide accreditation efforts by the Florida Department of Health (20% of small applicant LHDs) or as part of Ohio’s legislative requirement that all of its LHDs apply for PHAB accreditation by 2018 (44% of small applicant LHDs). Approximately 3% of small LHDs had applied nationwide as of 2019, excluding those in Florida and Ohio (45/1403). Comparatively, 171 (23%) of midsized LHDs and 64 (48%) of large LHDs had applied by 2019, excluding Florida and Ohio.
FIGURE 1—
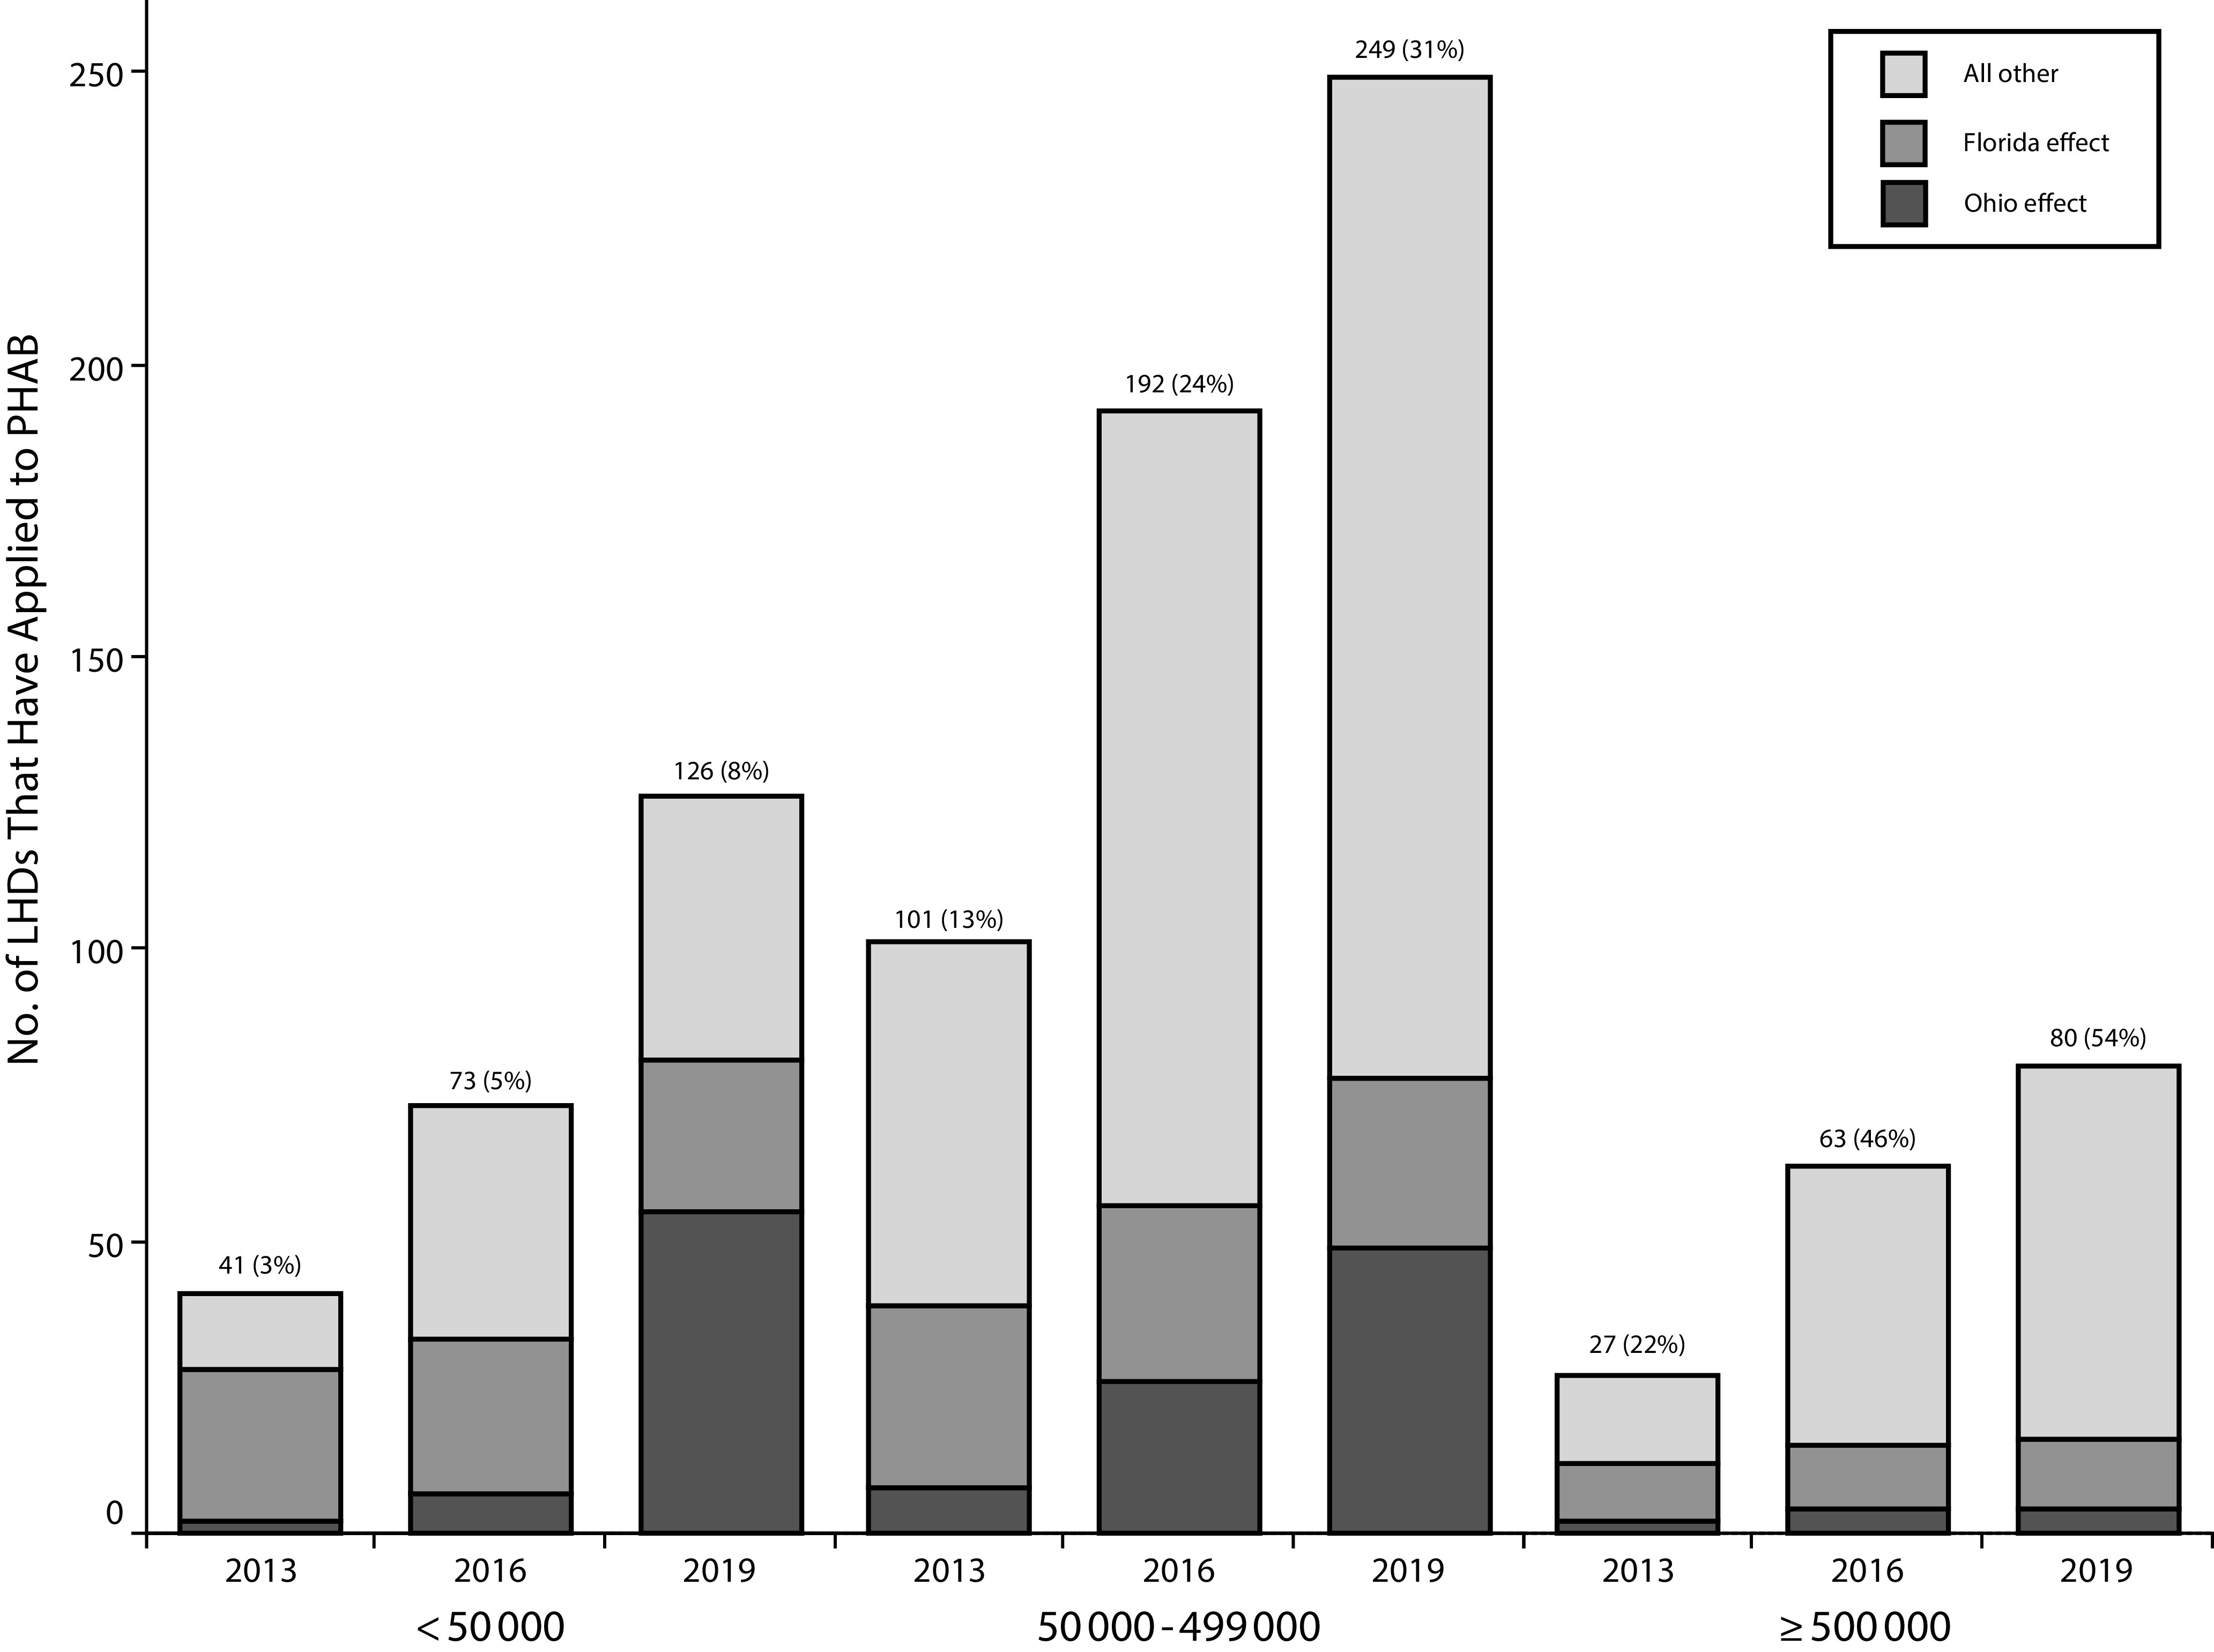
Local Health Department Application Trends to the Public Health Accreditation Board, Cumulative, by Year and Population Size Served: United States, 2013–2019
Note. LHD = local health department; PHAB = Public Health Accreditation Board. LHDs within the states of Ohio and Florida are categorized separately; the former of which has a statute requiring application to PHAB and the latter of which saw all LHDs accredited at the same time as the state department of health. The numbers above the bars indicate the total number of LHDs that had applied to the PHAB, with the percentage of those among all LHDs for that bar in parentheses.
Source. Public Health Accreditation Board application data.
We observed differences in expenditures and staff size between small LHDs that applied to PHAB versus those that had not applied (Figure 2). In 2013, small LHDs that had not applied to PHAB spent a median of $38 per capita, or $630 000 total, while small LHDs that applied spent about $94 per capita or $2.1 million total ($56 per-capita difference in the median, $46 per-capita difference in mean; P < .001). We observed differences in staff size in 2013 as well, with the median staff size for nonapplicants being 11, and 35 for small LHD applicants (24 staff difference on median, 29 on mean; P < .001). These gaps narrowed by 2019, with per-capita spending at $39 for nonapplicants and $66 for applicant small LHDs ($27 difference on median, $22 on mean; P = .001). There was also a difference observed in staff size between small LHD applicants and small LHDs that had not applied to PHAB by 2019 (24 vs 10 staff, 14 staff difference on median, 12 staff difference on mean; P < .001).
FIGURE 2—
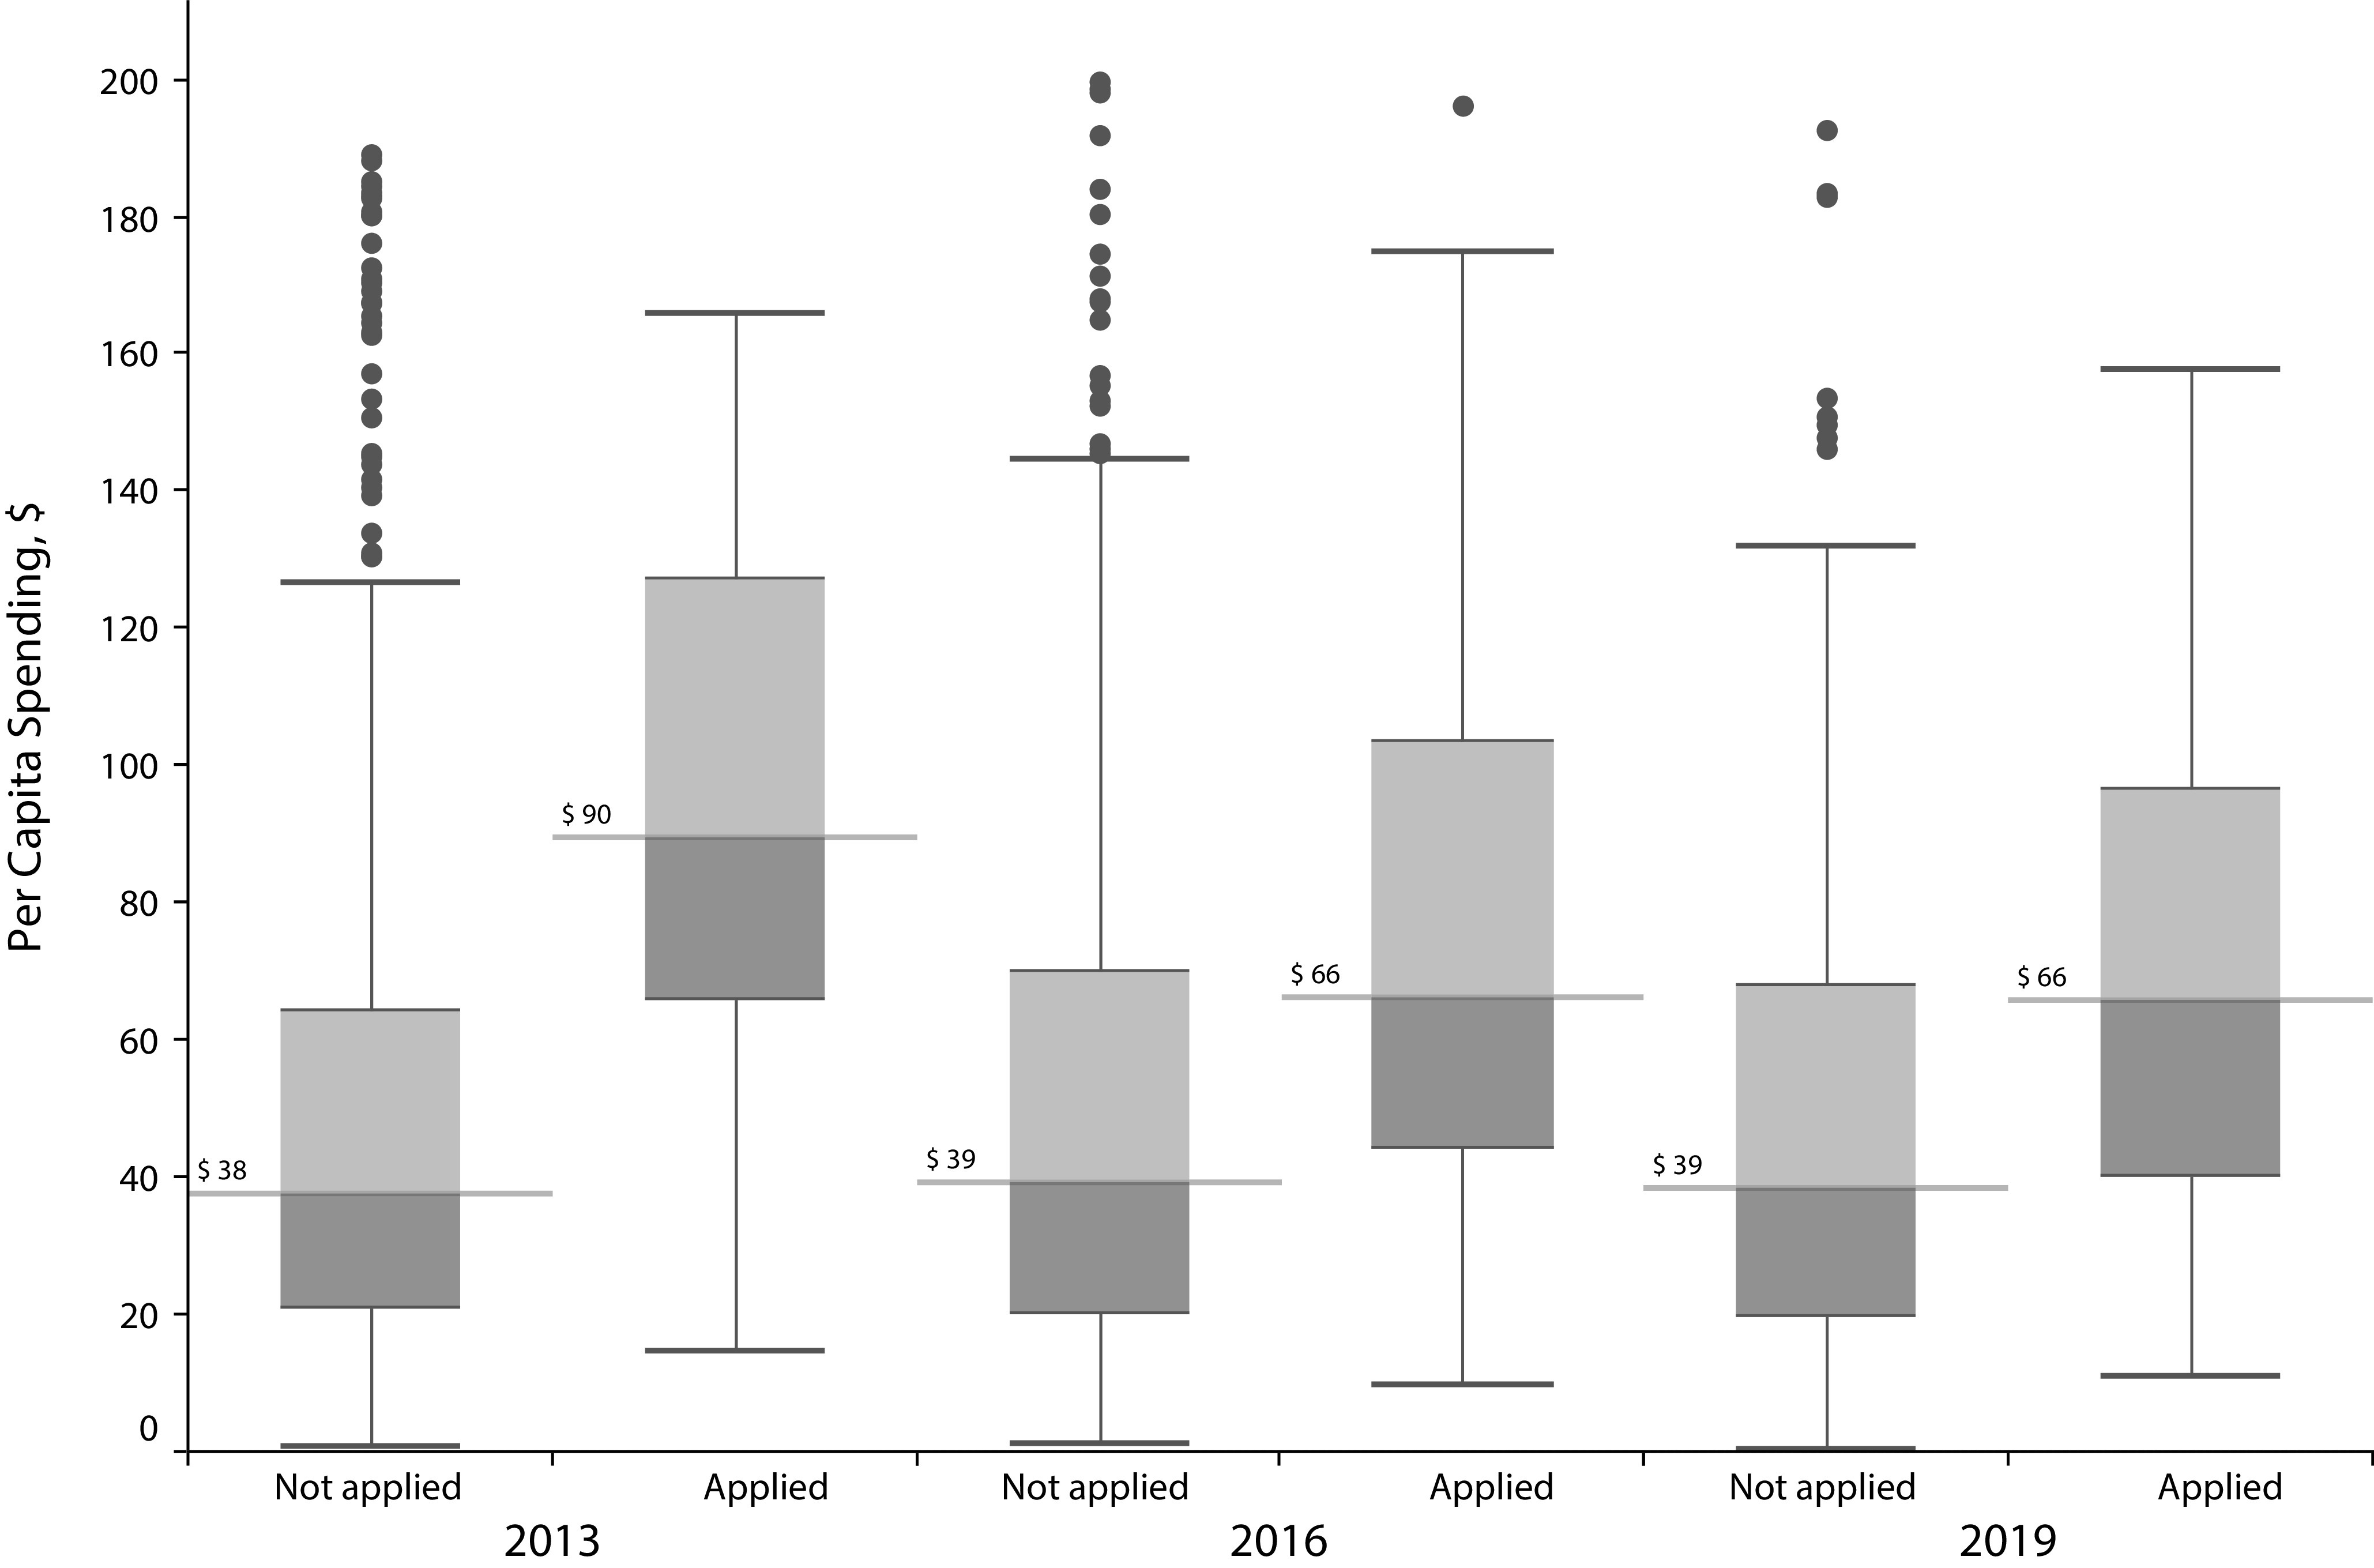
Per-Capita Spending Among Small Local Health Departments, by Public Health Accreditation Board Application Status and Year: United States, 2013–2019
Source. Public Health Accreditation Board and National Association of County and City Health Officials Profile data.
LHDs that had decided not to pursue PHAB accreditation indicated their reasons for not doing so in the 2013 and 2019 Profile studies (Figure 3). In 2013, the top reason for not pursuing accreditation among small LHDs was listed as the application “requiring too much time and effort,” while in 2019, PHAB accreditation fees (56%) and the standards exceeding their capacity (47%) were the most commonly reported barriers.
FIGURE 3—
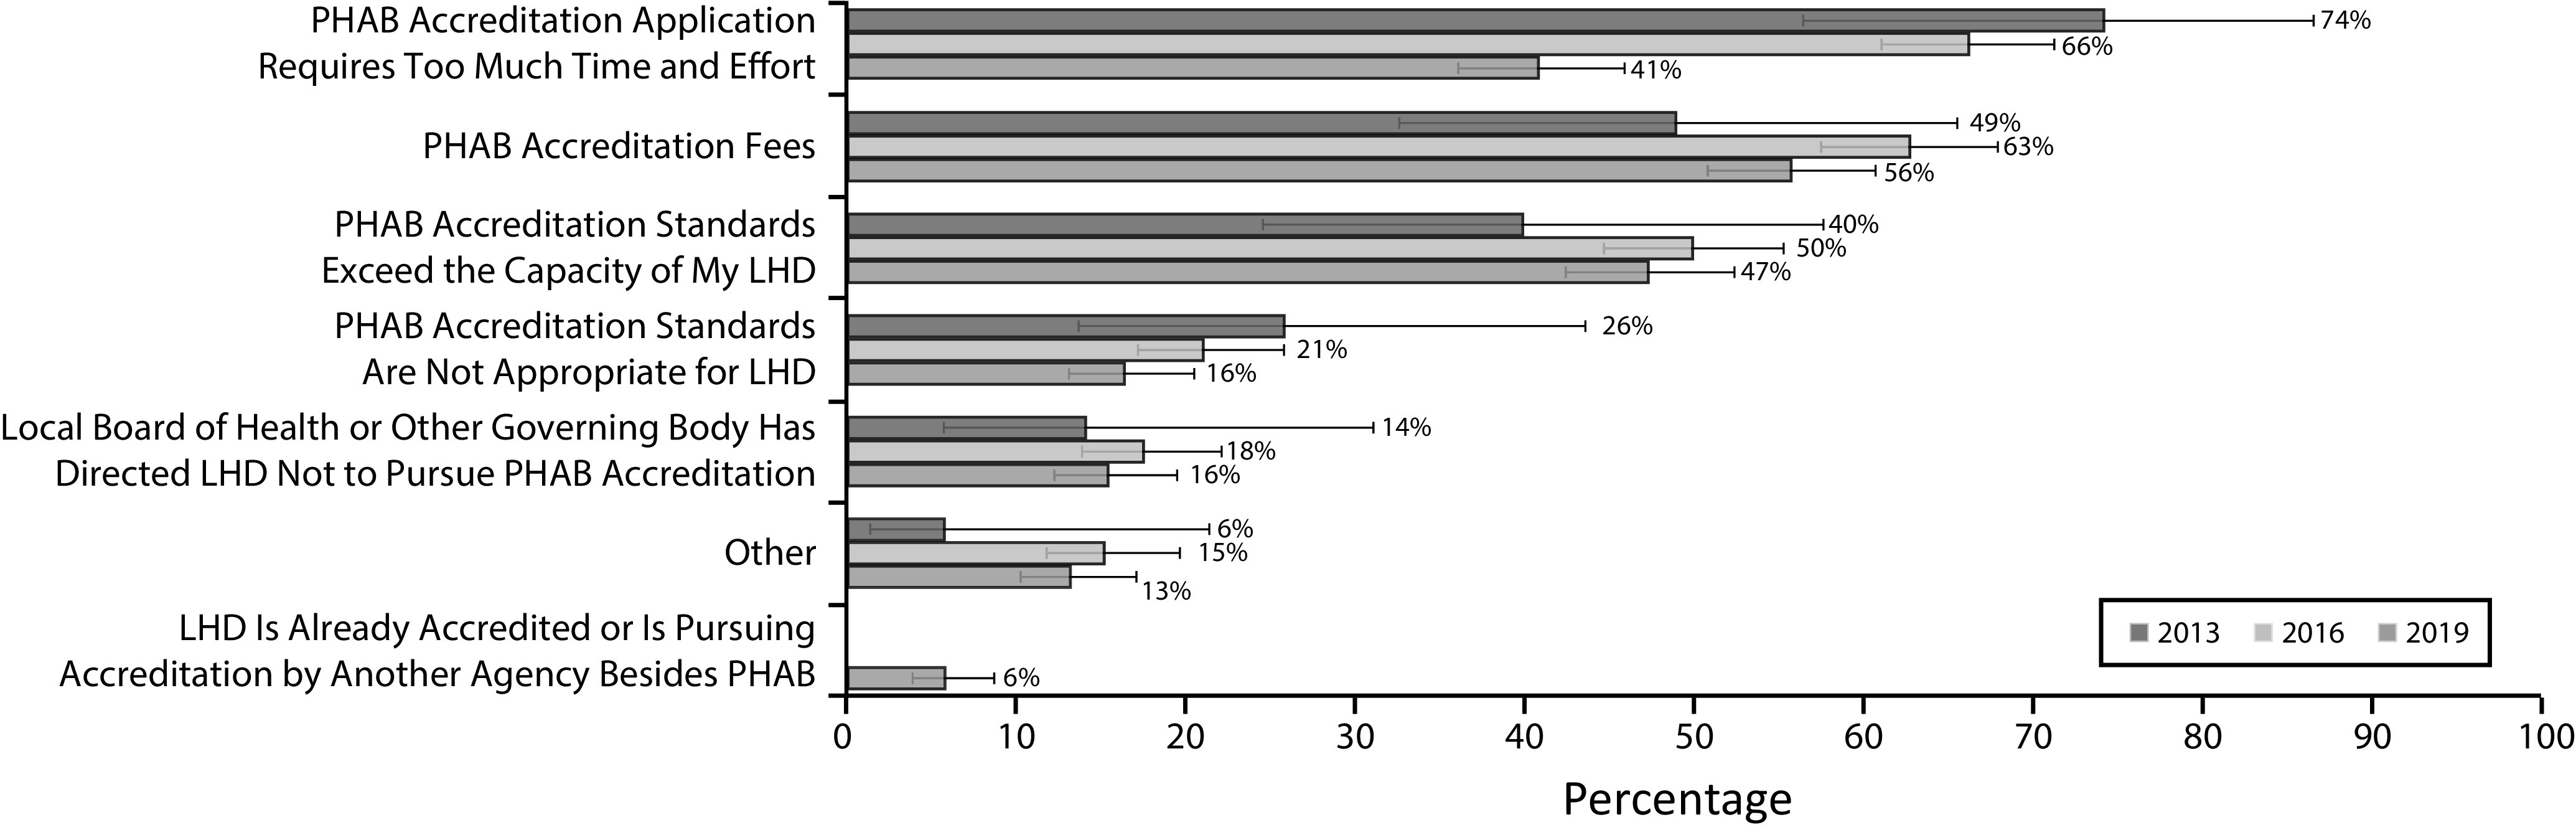
Reasons for Not Pursuing Public Health Accreditation Board Accreditation Among Small Local Health Departments, by Year: United States, 2013–2019
Note. LHD = local health department; PHAB = Public Health Accreditation Board. Error bars represent 95% confidence intervals derived from analysis of design- and nonresponse-adjusted weighted data.
When we compared 2019 reasons for not pursuing accreditation among small LHDs and LHDs of other sizes, there was no significant difference for fees, but we observed a difference for the standards exceeding capacity (47% for small vs 22% for midsized [P < .001] and 0% for large [P < .001]). To apply for accreditation, LHDs must complete a community health assessment, community health improvement plan, and strategic plan within the previous 5 years. In 2019, 72% of small LHDs had completed a community health assessment within 5 years, 64% had completed a community health improvement plan, and 55% had completed a strategic plan. Of these 3 requirements, there was no association between completing a community health assessment or community health improvement plan within 5 years and the standards exceeding capacity as a barrier for small LHDs, but there was a negative association for completing a strategic plan (P = .001). We also examined the size of the LHD workforce and amount of expenditures in relation to this barrier; while the size of the LHD workforce was not associated with capacity barriers, the amount of expenditures had a negative association (P = .008).
We also observed a difference for small LHDs compared with large LHDs for the standards not being appropriate for the LHD (16% for small vs 0% for large; P < .001) as a barrier to PHAB accreditation. Completion of a community health assessment, community health improvement plan, or strategic plan was not associated with this being a barrier among small LHDs. The number of full-time equivalents employed by the LHD was negatively associated with this barrier among small LHDs (P < .001), while the amount of expenditures was not associated.
We conducted an LCA on LHDs to identify potential groups of departments by their activity and service mix (Appendix Figures A–D, available as supplements to the online version of this article at http://www.ajph.org). Using a 5-class analysis, we identified small LHDs that had not applied to PHAB as of 2019. The 5-class model showed significant variation by service mix, with classes 1 and 3 being heavily inspection focused, class 2 being less focused on inspection and regulation, and classes 4 and 5 being a mix of clinical, inspection and regulation, and population-based prevention, with class-5 LHDs providing more activities on average, as well as more maternal and child health services in particular. Class membership was somewhat dependent on geographic region, with class 1 being most heavily concentrated in the Northeast, class 3 in the Northeast and Midwest, class 2 in the Midwest, and classes 4 and 5 spread throughout the lower Midwest and South.
After we excluded LHDs that applied through the Florida integrated public health system accreditation process and Ohio LHDs (given its statute requiring pursuit of PHAB accreditation), we cross-tabulated application status by latent class (Figure 4). None of the small LHDs in class 1 had applied for accreditation as of 2019. Between 2% and 3% had applied in classes 2 through 4, and 9% had applied in class 5. Overall, small LHDs represented 59% of all LHDs that had not yet applied to PHAB. LHDs from states that had state-specific accreditation programs had applied to PHAB at lower rates generally, and no small LHDs from these states had applied to PHAB (Figure D).
FIGURE 4—

Accreditation Uptake by Latent Class and Local Health Department Size: United States, Excluding Florida and Ohio, 2013–2019
Note. Clin. = clinical; ins./reg = inspection and regulation; PHAB = Public Health Accreditation Board; pop. based = population-based prevention and epidemiology.
We conducted sensitivity analyses that examined potential heterogeneity by population sizes of fewer than 50 000 (Figure B and Table A, available as supplements to the online version of this article at http://www.ajph.org); service mix was similar across small LHDs and latent class membership varied (e.g., 7% of LHDs serving < 12 500 people were part of class 5 compared with 12% of LHDs serving 12 500–24 999 people and 67% of LHDs serving 25 000–49 999 people). The proportion of LHDs that had applied to PHAB were similar across small LHDs of all jurisdiction size categories.
DISCUSSION
One of the ultimate outcomes in the PHAB logic model is to “achieve greater equity in public health capacity.”19 Inherent in this goal is that accreditation will help “raise all boats,” rather than continue to advance performance only among health departments that already had greater capacity. In light of this goal, it is important to understand variations in the characteristics of health departments that do and do not pursue accreditation. This study presents information about accreditation application rates of LHDs by size, budget, and staffing from 2013 (shortly after the accreditation program’s launch) and 2019. It also looks at the reasons small LHDs have given for not pursuing accreditation and the intersection between service mix and likelihood of application.
More than 100 small LHDs have applied for accreditation, but there is much work ahead if accreditation is to become more widespread among LHDs serving populations of fewer than 50 000 people. To dig deeper into this disparate pursuit of accreditation, we examined the reasons why LHDs decided not to pursue accreditation. Smaller LHDs were far more likely to indicate that the accreditation standards exceeded capacity or that the standards were not appropriate for their agency. This study also included an LCA to explore how differences in service mix related to likelihood to apply for accreditation. That analysis revealed that small LHDs that provide a mix of services were more likely to pursue accreditation. These LHDs were also more likely to have more staff and expenditures per capita than their small peers. While there were barriers to accreditation that cut across LHDs of varying sizes (e.g., fees), this study focused on the concerns that were particularly salient for small LHDs. Considering that small LHDs were more likely to indicate challenges in having the capacity to meet standards and the findings related to their service mix, there appear to be 3 potential strategies targeted at increasing accreditation uptake among smaller LHDs: bolstering LHD capacity, considering a set of standards that may help health departments on their journey toward accreditation, and focusing on groups of health departments (based, in part, on their service mix) that might be best able to meet accreditation standards.
The first strategy comprises strengthening the capacity of LHDs and could be achieved through several mechanisms including bolstering funding. It is important to acknowledge the chronic underfunding of public health systems in the United States.20 Additional financial resources are needed to allow health departments to hire individuals with the expertise and skills to promote and protect health in their communities. Similar to previous findings,14,21 this analysis indicates that, even among small LHDs, those with larger budgets and staff are more likely to apply. Technical assistance may also be key to helping health departments achieve accreditation standards. For example, health departments that had not conducted a strategic plan were more likely to report that the standards exceeded capacity. Helping smaller health departments meet core requirements like the strategic plan may be part of the approach, and providing detailed examples that are more specific to the small LHD setting may be 1 tool in such a toolkit.16 Finally, it is important to consider alternate arrangements for delivering public health services. This could be through cross-jurisdictional sharing arrangements, whereby health departments enter into agreements to share staff, laboratory, or other capacity.
The second strategy entails consideration of a set of standards and process that might better fit smaller LHD capacities. PHAB is currently exploring whether a product(s) could be developed that would support LHDs on their journey to accreditation. Based on the work of the Joint Task Force of the NACCHO and PHAB boards of directors, PHAB is developing models to test what it might look like to recognize health departments that are able to demonstrate that they meet a set of requirements that are more limited than the complete set of PHAB standards and measures. LHDs would have the option of achieving this recognition and “stopping” there, but could see this as a stepping stone toward accreditation.
The third strategy relates to the findings from the LCA, which may be able to inform which of the smaller LHDs could be the next group to pursue accreditation. It is perhaps not surprising that health departments that provide a greater mix of services are more likely to pursue accreditation as the accreditation standards and measures mirror the 10 Essential Public Health Services framework and therefore call upon health departments to demonstrate a wide array of capacities.
Limitations
There were several limitations to this study. There were potential validity concerns attributable to differential nonresponse by size in the NACCHO data. Response rates to the Profile studies decreased from 2013 to 2019, especially among small LHDs. The approach to conduct the LCA utilized the most-recently reported activity data from LHDs; there is potential for unmeasured changes in service mix among nonrespondent LHDs. In addition, LHDs applying in between Profile study cycles were not counted until the subsequent one in our analyses (e.g., applicants in 2018 would be captured in the 2019 cycle). Finally, there were a number of states with state-specific voluntary or mandatory accreditation that may have also reduced desire to seek accreditation (e.g., Illinois, Michigan, Missouri, North Carolina)—about 6% of responding LHDs in 2019 that were not accredited said it was in part because of another accreditation program.
This is an exploratory study that invites future research. For example, additional data should be collected to gather a more nuanced understanding than the single question in the NACCHO profile about barriers to accreditation among those who have not applied and why that has changed over time. It will also be helpful to understand better the relationship between service mix and accreditation pursuit to develop and evaluate interventions focused on bolstering accreditation among small LHDs.
Conclusions
Through evaluation surveys, accredited health departments report many perceived benefits of accreditation. Research studies are emerging that note differences between accredited and nonaccredited health departments, particularly with regard to quality improvement, evidence-based practice, and being part of a comprehensive public health system. Given these findings, and the benefit to the populace of accreditation,3 it is important to examine why some health departments are more likely to pursue accreditation than others. This study highlights that smaller LHDs are less likely than larger ones to apply for accreditation. Furthermore, it notes disparities among smaller LHDs by indicating that those with more funding and staff are applying at greater rates. Additional support may be needed to ensure that more small LHDs are able to experience the performance improvement benefits of accreditation.
ACKNOWLEDGMENTS
J. P. Leider and V. A. Yeager were compensated by PHAB for this work.
The authors thank the PHAB/NACCHO Joint Task Force on Small Health Department Accreditation and members of the NACCHO Research and Evaluation team (Debra Dekker, Karla Feeser, Shaunna Newton) for their insight and assistance. The authors thank peer reviewers and AJPH editorial staff; their feedback improved the quality of the article.
Note. The information contained in this article reflects the opinions of the authors and does not represent official PHAB policy.
CONFLICTS OF INTEREST
The authors have no financial items to disclose.
HUMAN PARTICIPANT PROTECTION
The project involved secondary data analysis of public health organizations.
Footnotes
See also Cilenti, P. 183.
REFERENCES
- 1.Public Health Accreditation Board. Health Department Accreditation Data Portal. 2020. Available at: https://www.phabdata.org. Accessed July 20, 2020.
- 2.Bender K, Kronstadt J, Wilcox R, Lee TP. Overview of the Public Health Accreditation Board. J Public Health Manag Pract. 2014;20(1):4–6. doi: 10.1097/PHH.0b013e3182a778a0. [DOI] [PubMed] [Google Scholar]
- 3.Public Health Accreditation Board. The value and impact of public health department initial accreditation: a review of quantitative and qualitative data. June 2020. Available at: https://phaboard.org/wp-content/uploads/Value-and-Impact-Final-June2020.pdf. Accessed July 20, 2020.
- 4.Siegfried A, Heffernan M, Kennedy M, Meit M. Quality improvement and performance management benefits of public health accreditation: national evaluation findings. J Public Health Manag Pract. 2018;24(suppl 3):S3–S9. doi: 10.1097/PHH.0000000000000692. [DOI] [PubMed] [Google Scholar]
- 5.Meit M, Siegfried A, Heffernan M, Kennedy M. Assessing outcomes from public health accreditation. Presented to: The Public Health Accreditation Board. April 2020. Available at: https://phaboard.org/wp-content/uploads/NORC_slides-for-web-April-2020.pdf. Accessed June 1, 2020.
- 6.Kronstadt J, Meit M, Siegfried A, Nicolaus T, Bender K, Corso L. Evaluating the impact of national public health department accreditation—United States, 2016. MMWR Morb Mortal Wkly Rep. 2016;65(31):803–806. doi: 10.15585/mmwr.mm6531a3. [DOI] [PubMed] [Google Scholar]
- 7.Kronstadt J, Chime C, Bhattacharya B, Pettenati N. Accredited health department partnerships to improve health: an analysis of community health assessments and improvement plans. J Public Health Manag Pract. 2018;24(suppl 3):S35–S43. doi: 10.1097/PHH.0000000000000735. [DOI] [PubMed] [Google Scholar]
- 8.Kittle A, Liss-Levinson R. State health agencies’ perceptions of the benefits of accreditation. J Public Health Manag Pract. 2018;24(suppl 3):S98–S101. doi: 10.1097/PHH.0000000000000719. [DOI] [PubMed] [Google Scholar]
- 9.Beitsch LM, Kronstadt J, Robin N, Leep C. Has voluntary public health accreditation impacted health department perceptions and activities in quality improvement and performance management? J Public Health Manag Pract. 2018;24(suppl 3):S10–S18. doi: 10.1097/PHH.0000000000000713. [DOI] [PubMed] [Google Scholar]
- 10.Ingram RC, Mays GP, Kussainov N. Changes in local public health system performance before and after attainment of national accreditation standards. J Public Health Manag Pract. 2018;24(suppl 3):S25–S34. doi: 10.1097/PHH.0000000000000766. [DOI] [PubMed] [Google Scholar]
- 11.Allen P, Mazzucca S, Parks RG, Robinson M, Tabak RG, Brownson R. Local health department accreditation is associated with organizational supports for evidence-based decision making. Front Public Health. 2019;7:374. doi: 10.3389/fpubh.2019.00374. [DOI] [PMC free article] [PubMed] [Google Scholar]
- 12.Sreedhara M, Goins KV, Frisard C, Rosal MC, Lemon SC. Stepping up active transportation in community health improvement plans: findings from a national probability survey of local health departments. J Phys Act Health. 2019;16(9):772–779. doi: 10.1123/jpah.2018-0623. [DOI] [PMC free article] [PubMed] [Google Scholar]
- 13.Feng W, Martin EG. Fighting obesity at the local level? An analysis of predictors of local health departments’ policy involvement. Prev Med. 2020;133:106006. doi: 10.1016/j.ypmed.2020.106006. [DOI] [PubMed] [Google Scholar]
- 14.Beatty KE, Erwin PC, Brownson RC, Meit M, Fey J. Public health agency accreditation among rural local health departments: influencers and barriers. J Public Health Manag Pract. 2018;24(1):49–56. doi: 10.1097/PHH.0000000000000509. [DOI] [PubMed] [Google Scholar]
- 15.Shah GH, Leep CJ, Ye J, Sellers K, Liss-Levinson R, Williams KS. Public health agencies’ level of engagement in and perceived barriers to PHAB national voluntary accreditation. J Public Health Manag Pract. 2015;21(2):107–115. doi: 10.1097/PHH.0000000000000117. [DOI] [PubMed] [Google Scholar]
- 16.Yeager VA, Leider J, Saari C, Kronstadt J. Supporting increased local health department accreditation: qualitative insights from accredited small local health departments. J Public Health Manag Pract. 2020 doi: 10.1097/PHH.0000000000001251. epub ahead of print September 9, 2020. [DOI] [PubMed] [Google Scholar]
- 17. National Profile of Local Health Departments, 2019. Washington, DC: National Association of County and City Health Officials; 2020.
- 18.National Association of County and City Health Officials. Profile sections. 2020. Available at: https://www.naccho.org/resources/lhd-research/national-profile-of-local-health-departments. Accessed December 7, 2020.
- 19.Public Health Accreditation Board. Public health agency accreditation system logic model. 2017. Available at: https://phaboard.org/wp-content/uploads/2019/01/Accreditation-LogicModel-201706.pdf. Accessed July 20, 2020.
- 20.Leider JP, Resnick B, McCullough JM, Alfonso YN, Bishai D. Inaccuracy of official estimates of public health spending in the United States, 2000–2018. Am J Public Health. 2020;110(suppl 2):S194–S196. doi: 10.2105/AJPH.2020.305709. [DOI] [PMC free article] [PubMed] [Google Scholar]
- 21.Yeager VA, Ferdinand AO, Beitsch LM, Menachemi N. Local public health department characteristics associated with likelihood to participate in national accreditation. Am J Public Health. 2015;105(8):1653–1659. doi: 10.2105/AJPH.2014.302503. [DOI] [PMC free article] [PubMed] [Google Scholar]