Abstract
The deformation of the mouse astrocytic lamina (AL) and adjacent peripapillary sclera (PPS) was measured in response to elevated intraocular pressure. We subjected explanted mouse eyes to inflation testing, comparing control eyes to those 3 days and 6 weeks after induction of ocular hypertension (OHT) via ocular microbead injection. Laser scanning microscopy was used with second harmonic generation to image the collagenous PPS and two-photon fluorescence to image transgenic fluorescent astrocytes in the AL. Digital volume correlation was applied to calculate strains in the PPS and AL. The specimen-averaged strains were biaxial in the AL and PPS, with greater strain overall in the x- than y-direction in the AL and greater strain in the θ- than the r-direction in the PPS. Strains increased after 3-day OHT, with greater strain overall in the 3-day AL than control AL, and greater circumferential strain in the 3-day PPS than control PPS. In the 6-week OHT eyes, AL and PPS strains were similar overall to controls. This experimental glaucoma model demonstrated a dynamic change in the mechanical behaviour of the AL and PPS over time at the site of neuronal injury and remodelling in glaucoma.
Keywords: glaucoma, optic nerve head, peripapillary sclera, digital volume correlation, mechanical testing, mouse
1. Introduction
Glaucoma is the second leading cause of blindness worldwide [1]. Treatments to lower intraocular pressure (IOP) effectively reduce the loss of vision caused by the death of retinal ganglion cells (RGC) in glaucoma [2]. Experimental animal models of glaucoma in monkey, rat and mouse demonstrate that higher IOP leads to injury to RGC axons at the optic nerve head (ONH) [3–7], as is found in human glaucoma eyes [8]. Raising IOP deforms the ONH and the surrounding peripapillary sclera (PPS). With chronic IOP elevation, i.e. ocular hypertension (OHT), RGC axons die and the connective tissues of the ONH and PPS remodel [9–13]. Thus, the responses of ONH and the surrounding PPS to chronic elevated IOP are important features of glaucomatous optic neuropathy.
The strain response of the ONH to IOP change has been characterized in post-mortem human eyes [14–16] and more recently directly in patient eyes [17–19]. Cell-scale studies of ONH astrocyte responses to mechanical loading have been limited to two-dimensional cell culture [20–23] and more recently three-dimensional cell culture methods have been proposed [24]. Cell culture methods cannot capture the complex in vivo cellular connections of ONH astrocytes to their mechanical environment, and individual cells of the human ONH are currently impossible to visualize in vivo. To address this, we recently established a method to study ONH biomechanical behaviour during inflation testing in a whole-eye explant model using a transgenic mouse with fluorescent astrocytes, such that astrocytes and PPS are closer to their in vivo mechanical environment [25,26]. In the mouse astrocytic lamina (AL), the astrocytes form a planar network surrounding axonal compartments, and the AL is surrounded by a collagenous PPS. There is a minimal connective tissue in the mouse AL. The pattern of the cellular mouse AL is similar to that of the collagenous beams of the human lamina cribrosa, which are covered by astrocytes [27]. The human lamina is 10 to 20 times larger than that of the mouse, and each of the pores through which axons pass is approximately the diameter of the mouse AL. Previously, we reported the feasibility of a method combining digital volume correlation (DVC) with two-photon fluorescence (TPF) and second harmonic generation (SHG) laser scanning microscopy [25,26]. In the present study, we measured the displacement and strain responses of the PPS and AL of explanted mouse eyes in control, 3-day OHT and 6-week OHT in order to investigate in detail the strain response of AL and PPS and dynamic changes with OHT.
2. Methods
2.1. Animal procedures
All experimental procedures were approved and monitored by the Johns Hopkins University School of Medicine Animal Care and Use Committee. Adult mice (5–8 months old), hemizygotes expressing the green fluorescent protein in all astrocytes under control of the glial fibrillary acidic protein promoter (FVB/N-Tg(GFAP-GFP)14Mes, Jackson Laboratories no. 003257, Bar Harbor, ME, USA) were used. For the chronic OHT glaucoma model, one eye was injected with microbeads following an established protocol [28]. Contralateral eyes were uninjected controls. Additionally included in the study were eyes from mice without surgical procedures in either eye, referred to as naïve controls.
IOP was measured, a mean of six readings, using a TonoLab rebound tonometer (Tiolat, Inc., Helsinki, Finland), before microbead injection, immediately after injection, then, 1 day, 3 days and 6 weeks later. For IOP measurements only, animals were anaesthetized using a Rodent Circuit Controller (VetEquip, Inc., Pleasanton, CA, USA) delivering 2.5% of isoflurane in oxygen, 500 cm3 min−1.
Mouse eyes were explanted following euthanasia by an intraperitoneal injection of ketamine–xylazine–acepromazine solution. In this study, we explanted 66 eyes from 48 mice. Then, 19 eyes were excluded, 10 because of improper specimen dissection and 9 because they did not inflate as indicated by the exclusion criteria.
2.2. Inflation testing
Inflation of explanted eyes was performed according to a published protocol [25]. Briefly, the cornea of the intact eye globe was glued to a plastic holder and cannulated into the anterior chamber with a needle connected to a fluid reservoir column. The eye was submerged in phosphate-buffered saline at room temperature throughout the experiment. For each specimen, three images were taken: two images at an IOP of 10 mmHg, the first one for error analysis and one image at 30 mmHg, all after 15 min of equilibration at each IOP. We used a two-photon laser source, an excitation wavelength of 780 nm for PPS images and 895 nm for AL images, attached to a Zeiss laser scanning microscope 710 (Carl Zeiss Microscopy, LLC, Thornwood, NY) with 20x W Plan Apochromat objective, numerical aperture 1.0, collecting z-stacks of 40 to 100 µm spaced every 1 µm for total x- and y-resolution of 0.519 µm pixel−1 for the PPS and 0.415 µm pixel−1 for the AL. For AL images, TPF signal was collected with 500–550 nm band-pass filter. For PPS, both SHG and TPF signals were collected, with 290–410 nm and 470–550 nm multi-band-pass filter. Image post-processing was performed using a deconvolution algorithm (Huygens Essential, Scientific Volume Imaging, The Netherlands) and contrast enhancement histogram equalization using FIJI [29,30].
Nine eyes were excluded due to one of the following criteria: (i) cannula was not in the anterior chamber when it was examined at the end of the experiment; (ii) no ocular pressure change with inflation as measured by Tonolab and (iii) less than 10 µm posterior movement of a landmark within the AL when the pressure was increased from 10 to 30 mmHg. The final sample size was 47 eyes: 8 naïve controls, 15 contralateral controls, 13 three-day OHT, and 11 six-week OHT. PPS data were collected in all 47 eyes, but AL data were obtained in 40 samples: 6 naïve controls, 13 contralateral controls, 11 three-day OHT and 10 six-week OHT. AL sample size was reduced since fluorescence intensity was too low in seven eyes.
2.3. Digital volume correlation
An open-source, fast-iterative DVC algorithm was used [31,32] to compute the displacement field from the post-processed images. The algorithm's distinguishing feature is iterative mapping of both the deformed and undeformed volume and updating of the correlation window size, thus decreasing computation time and capturing displacement gradients more accurately. A maximum of six iterations was used, and at the final iteration, the algorithm computed displacements spaced every 2.08 µm for the PPS and at every 1.66 µm for the AL in x and y, at every 2 µm in z for both tissues.
After removing data points with an image cross-correlation coefficient ≤0.015 in PPS and ≤0.001 in the AL [31], the three displacement components (of vector u) were fitted to a linear function along the z-direction and to fourth-order polynomials in the x- and y-directions. For the PPS, the three displacement components in a 60 × 60 µm2 window were fitted to a plane in the x- and y-directions, i.e. u1(x, y) = ax + by + c. The displacement gradient tensor, , was then used to calculate the Green–Lagrange strain tensor, E = (1/2)(FTF − I), where F = (Δu + I). The maximum and minimum principal strains, Emax and Emin, in the x–y plane were calculated by finding the eigenvalues of the in-plane strain tensor. Maximum shear strain, γmax, in the x–y plane was computed by (1/2) (Emax – Emin).
The uncertainty and accuracy of DVC strains were estimated for every specimen as follows. One of the image volumes at 10 mmHg was artificially warped with an applied strain (Eapplied) to calculate the average absolute error for each strain component, as , where N was the number of points. The affine3d function in MATLAB (The Mathworks, Inc., Natick, Massachusetts) was used to apply stretches of 1.02 in x and y, a stretch of 0.95 in z, and translations by 10 pixels in x and y, and by 3 pixels in z. Points with DVC x or y displacement errors that were greater than ±1 µm of the applied transformation were removed to improve the accuracy of the strain field. The resulting specimen-averaged absolute strain errors are presented in electronic supplementary material, tables S1–S2.
2.4. Strain analysis
The inferior–superior axis of the ONH was identified based on the typical location of inferior blood vessels in all AL and PPS images, as identified by an investigator experienced in mouse optic nerve anatomy. The strain tensor component matrix, E, was then rotated such that x = nasal–temporal axis, and y = inferior–superior axis, with the z-axis unchanged. The geometric centre of the AL was set as the coordinate system origin. The strain tensor components were transformed to cylindrical coordinates, Err, Erθ and Eθθ.
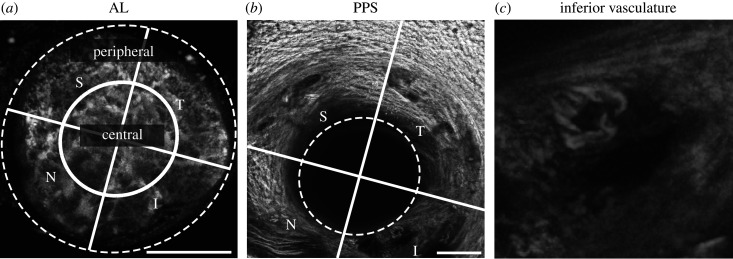
For regional analysis of the AL, an ellipse was drawn at the external limit of AL using FIJI [29]. To divide the AL into central and peripheral regions, an inner ellipse was drawn with major and minor axes half of the external ellipse. The AL and PPS were further divided into specimen-specific quadrants: superior, temporal, inferior and nasal (figure 1).
Figure 1.
Anatomical regions of the AL and PPS. (a) AL, maximum projection of TPF z-stack. An ellipse traces the AL edge (dashed line), replicated in (b). Central and peripheral regions separated by an ellipse (solid line) with radii half of the dashed ellipse. (b) PPS, maximum projection of SHG and TPF z-stack. (c) Inferior blood vessel, 100 × 100 µm2 enlarged from (b). The inferior–superior axis was identified and bisecting lines (solid lines) drawn to divide the AL and PPS into four anatomical quadrants: S, superior; T, temporal; I, inferior; N, nasal. Scale bars = 100 µm.
Sensitivity analysis was used to identify the minimum percentage of DVC correlated points for a region to be included for statistical analysis. Including PPS regions with fewer than 10% correlated points altered the mean and standard deviation of Err. In the PPS, excluding these regions removed 6, 5 and 4 samples from the inferior region of the control, 3-day OHT and 6-day OHT groups, respectively, and two or fewer samples from the remaining regions. In the peripheral AL, this removed two samples from the inferior region of the control group, one sample each from the superior region of the 3-day OHT group and from the inferior region of the 6-week OHT group.
Wilcoxon rank sum (Mann–Whitney U) tests were used to compare IOPs and strain measures in bilaterally naïve (untreated) control eyes (n = 6 AL, n = 8 PPS) to those in contralateral control eyes (n = 13 AL, n = 15 PPS) from mice where the fellow eye was microbead injected. The nine outcome measures in AL and PPS were: Err, Eθθ, Erθ, Exx, Eyy, Exy, Emax, Emin and γmax, and an additional 10th measure, Ezz, in AL. In 19 comparisons, only one reached significance level 0.05, as expected by chance; therefore, the naïve and contralateral control samples were pooled into the control group.
Wilcoxon signed-rank tests were used to test for differences in the IOPs between the microbead injected eyes and the contralateral eyes; between the strain and the respective DVC strain error; the magnitudes between two specimen-averaged strain measures, for example Exx and Eyy, within one region and experimental group. For all other statistical analysis, generalized estimating equation models were used that took into account correlations among strain measurements from a single eye for comparisons within one group or between measurements of strain from the two eyes of a single mouse when comparing OHT and control groups. For each model, the working correlation matrix was assumed to have an exchangeable structure. One model was created for each strain measure to test differences in strain among central AL, peripheral AL or PPS regions or among the experimental groups, with the Tukey–Kramer method used to correct p-values for multiple comparisons. One model was created for each AL strain measure to test for differences within each quadrant between the central and peripheral region, with Bonferroni method used to correct p-values because only four pair-wise comparisons were performed, one for each quadrant. All statistical analyses were performed using SAS v. 9.4 (SAS Institute, Cary, NC) or GraphPad Prism V. 8 (GraphPad Software Inc., La Jolla, California, USA). In all boxplots, the mean is drawn as a solid line, the interquartile range as boxes from the first to the third quartile, and the data spread as whiskers by Tukey's method.
3. Results
3.1. Strain response of the control astrocytic lamina
3.1.1. Specimen-averaged response of the control astrocytic lamina
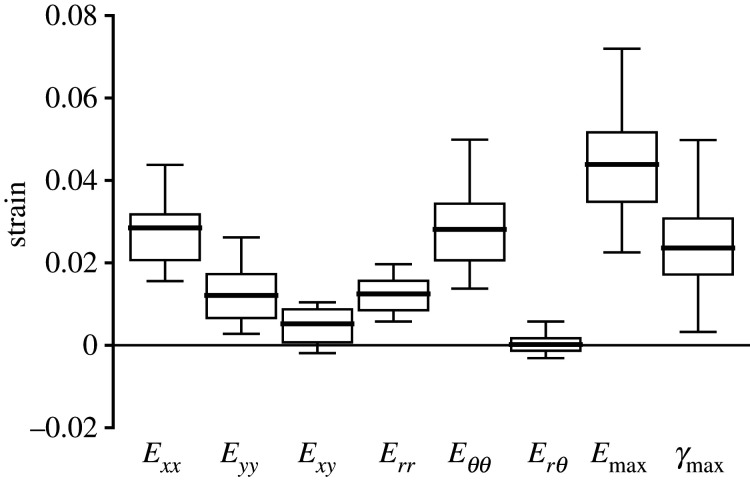
The strain outcomes were averaged over the imaged volume of the AL and compared to each other to determine the strain state under inflation. The overall inflation response of the AL to IOP elevation from 10 to 30 mmHg was mainly biaxial tension, with greater strain in the x- than y-direction and greater strain in the θ- than r-direction (figure 2 and table 1). The Exx (0.0285 ± 0.0098) was 2.4 times the Eyy (0.0121 ± 0.0068) (p < 0.0001), and Eθθ (0.0281 ± 0.0103) was 2.3 times the Err (0.0124 ± 0.0073) (p < 0.0001). Interestingly, similar magnitudes were observed between Exx and Eθθ, and between Eyy and Err. The shear strain components, Exy (0.0052 ± 0.0056) and Erθ (0.0002 ± 0.0029), were significantly smaller than the normal strain components Err, Eθθ, and Exx (p ≤ 0.01). In addition, Erθ was significantly smaller than the respective DVC strain error (0.0026 ± 0.0007; electronic supplementary material, table S1), which suggested that the specimen-averaged Erθ was negligible.
Figure 2.
The in-plane strains for the AL of the control group (n = 19). Box plots showing the interquartile range (first to the third quartile) with Tukey's whiskers and mean (solid line). Exx is greater than Eyy and Eθθ is greater than Err. The maximum principal strain Emax is significantly greater than all normal strain components (Exx, Eyy, Err and Eθθ p < 0.0001).
Table 1.
The specimen-averaged strain components in the AL (n = 19) and PPS (n = 23) for control eyes, showing p-values for the comparison of AL to PPS. All of the normal strain components (Exx, Eyy, Err and Eθθ) and Emax were significantly larger in the AL than PPS (p ≤ 0.0001). Mean ± std. Italics indicate significance level at p < 0.05.
| AL (n = 19) |
PPS (n = 23) |
p-value | |
|---|---|---|---|
| Err | 0.0124 ± 0.0073 | 0.0028 ± 0.0050 | <0.0001 |
| Eθθ | 0.0281 ± 0.0103 | 0.0048 ± 0.0033 | <0.0001 |
| Erθ | 0.0002 ± 0.0029 | 0.0002 ± 0.0021 | 0.90 |
| Exx | 0.0285 ± 0.0098 | 0.0015 ± 0.0039 | <0.0001 |
| Eyy | 0.0121 ± 0.0068 | 0.0060 ± 0.0041 | 0.0001 |
| Exy | 0.0052 ± 0.0056 | −0.0009 ± 0.0020 | <0.0001 |
| Emax | 0.0439 ± 0.0174 | 0.0156 ± 0.0104 | <0.0001 |
| Emin | −0.0033 ± 0.0102 | −0.0081 ± 0.0082 | 0.07 |
| γmax | 0.0236 ± 0.0129 | 0.0119 ± 0.0090 | <0.0001 |
In the plane of the AL, the maximum principal strain, Emax (0.0439 ± 0.0174), was greater than the maximum shear strain, γmax (0.0236 ± 0.0129, p = 0.0003), and greater than all of the in-plane normal strain components (Exx, Eyy, Err and Eθθ; p < 0.0001). The out-of-plane strain component, Ezz (−0.0055 ± 0.0186), was compressive, but within the estimated DVC strain error for Ezz (0.0185 ± 0.0055; electronic supplementary material, table S1).
3.1.2. Regional variation in the strain response of the astrocytic lamina
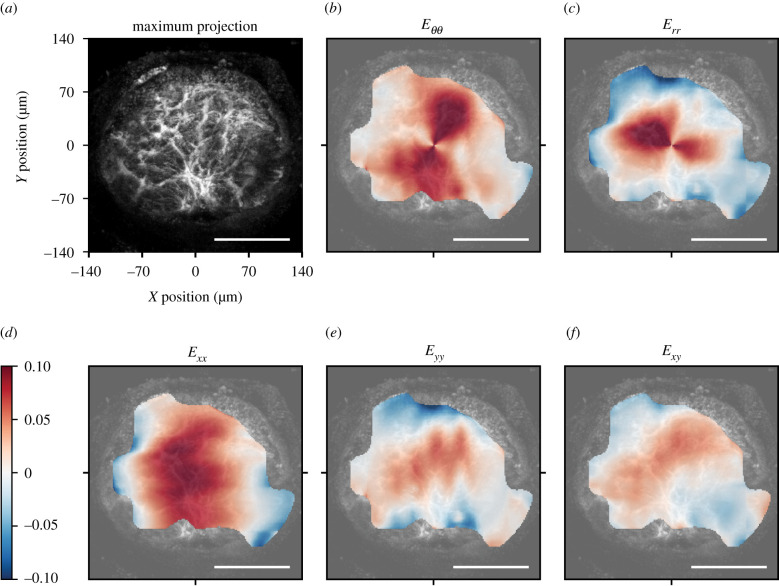
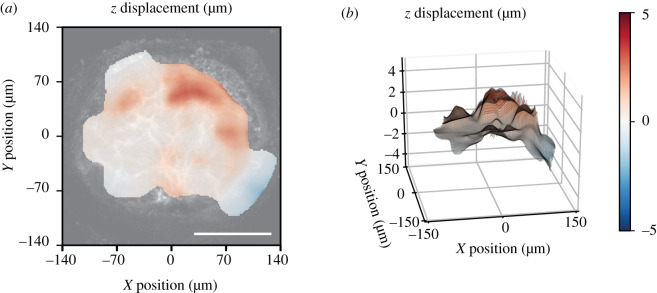
The strain was greatest in the centre and decreased towards the edge of the AL. The strain field was heterogeneous and the normal strain components were mostly tensile, though there were local regions in the peripheral lamina where the normal strain components Exx, Eyy and Err were compressive (figure 3). In some local areas, the magnitude of the shear strain, Exy, was significantly larger than the corresponding DVC strain error and therefore not negligible (figure 3f). The out of plane, z-displacement showed a characteristic bowed shape, in which the z-displacements increased from the periphery to the centre of the AL (figure 4).
Figure 3.
Image of the AL and colour contours of the DVC strain components for a representative control AL. (a) Maximum projection of a 46 µm z-stack oriented with origin (0, 0) at the centre of the AL. In the inferior, AL blood vessels enter the tissue with associated connective tissue. Plotted strains are means of all z-slices. In-plane strains in the cylindrical coordinate system, (b) Eθθ and (c) Err, transformed from the Cartesian coordinate system, (d) Exx, (e) Eyy and (f) Exy. Regional strains vary from compressive (blue) in the peripheral AL to tensile (red) strains in the central AL. The shear strain Exy contains both negative and positive regions. Scale bars = 100 µm.
Figure 4.
Posterior z-displacement of a representative control AL relative to the mean displacement of the AL as (a) a contour map and (b) three-dimensional projection. Positive z-direction is toward the posterior of the optic nerve, away from the retina. The out-of-plane component showed posterior bowing. Scale bar = 100 µm.
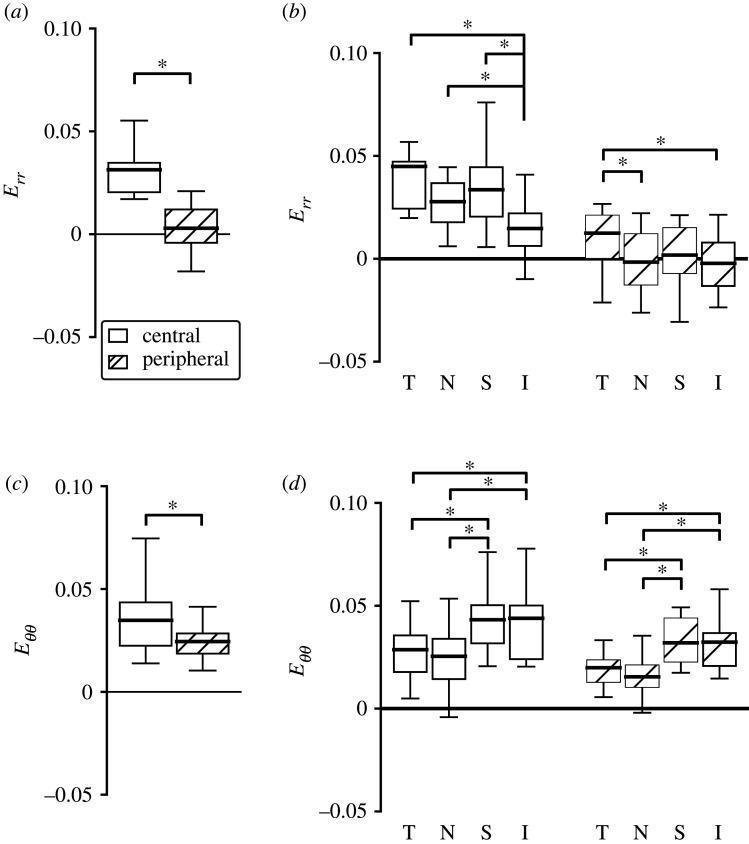
In order to quantify the strain heterogeneity, strains were averaged in the different regions shown in figure 1. The central region of the AL had higher magnitudes of normal strain components (Err, Eθθ, Eyy and Exx), Emax and Emin than the peripheral region (p ≤ 0.0004); the comparison was also significant within each quadrant (table 2 and figure 5a; electronic supplementary material, table S4). The Err, Eθθ, Eyy, Exx, Exy, Emax and Emin also differed among the four central quadrants (p ≤ 0.005) and among the four peripheral quadrants (p ≤ 0.03). In the central and peripheral regions, Exx, Eθθ and Emax were smallest in the nasal quadrant and were of similar magnitudes in the inferior and superior regions (figure 5b; electronic supplementary material, figure S1). Pair-wise comparisons between Exx and Eθθ in the nasal quadrant, where the means were the lowest, and of the inferior and superior quadrants, where the means were the highest, were significant (Exx and Eθθ; p ≤ 0.01 in central and peripheral regions; electronic supplementary material, table S4). By contrast, the mean Err and Eyy in the inferior quadrant were the smallest among the four central and the four peripheral regions. The pair-wise comparisons of Err and Eyy were statistically significant between the central inferior quadrant, where the means were the smallest, and the other three quadrants (p ≤ 0.002; figure 5b and electronic supplementary material, table S4). The mean of Emin was also smaller in the inferior quadrant among the central regions.
Table 2.
Strain components compared between the central and peripheral regions in the control AL (n = 19), p-values comparing strain between four central regions and four peripheral regions. All of the normal strain components (Exx, Eyy, Err and Eθθ), Emax and Emin were significantly larger in the central than peripheral regions (p ≤ 0.0004). Italics indicate significance level at p < 0.05.
| AL strains | central | peripheral | p-value |
|---|---|---|---|
| Err | 0.0313 ± 0.0138 | 0.0029 ± 0.0132 | <0.0001 |
| Eθθ | 0.0348 ± 0.0161 | 0.0245 ± 0.0093 | 0.0004 |
| Erθ | 0.0004 ± 0.0022 | 0.0000 ± 0.0035 | 0.55 |
| Exx | 0.0442 ± 0.0217 | 0.0203 ± 0.0092 | <0.0001 |
| Eyy | 0.0219 ± 0.0124 | 0.0071 ± 0.0092 | <0.0001 |
| Exy | 0.0086 ± 0.0108 | 0.0033 ± 0.0046 | 0.01 |
| Emax | 0.0556 ± 0.0273 | 0.0376 ± 0.0142 | <0.0001 |
| Emin | 0.0105 ± 0.0099 | −0.0102 ± 0.0146 | <0.0001 |
| γmax | 0.0225 ± 0.0147 | 0.0239 ± 0.0123 | 0.28 |
Figure 5.
Regional comparison of the radial strain, Err, and circumferential strain, Eθθ, for AL of control eyes (n = 19 all except peripheral inferior n = 17), where T, temporal; N, nasal; S, superior; I, inferior. The strain components were larger in the central than peripheral regions for both (a) Err (p < 0.0001) and (c) Eθθ (p = 0.0004). The normal strain components varied significantly among the four quadrants in the central (p ≤ 0.0003) and peripheral (p ≤ 0.03) regions. (b) Err was smallest in the inferior quadrant, and (d) Eθθ was smallest in the nasal quadrant among both the central and peripheral regions. *p < 0.05.
3.2. Strain response of the control peripapillary sclera
3.2.1. Specimen-averaged response of the control peripapillary sclera
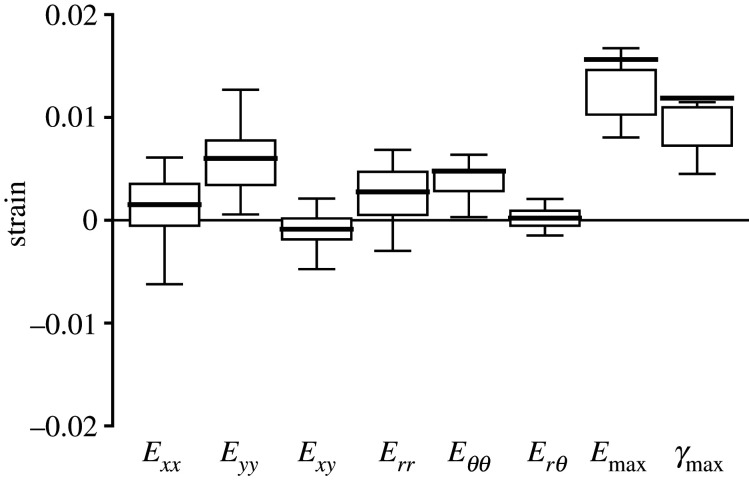
The strain components were averaged across the PPS and compared to each other to determine the strain state that developed with inflation from 10 to 30 mmHg. The deformation of the PPS was mainly biaxial extension, with greater strain in the y- than the x-direction and greater strain in the θ- than the r-direction (figure 6 and table 1).
Figure 6.
The in-plane strains for the PPS of the control group (n = 23). Exx is smaller than Eyy (p = 0.0002). Emax (p < 0.0001) and γmax (p ≤ 0.003) are significantly greater than all normal strain components.
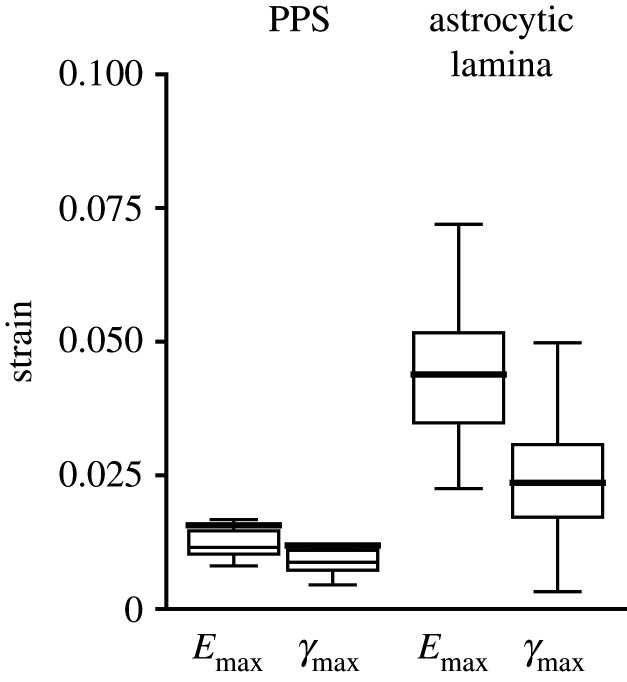
The Eyy (0.0060 ± 0.0041) was four times the Exx (0.0015 ± 0.0039, p = 0.0002), and Eθθ (0.0048 ± 0.0033) was greater than Err (0.0028 ± 0.0050). However, Exx and Err were smaller than their respective estimated DVC strain errors (electronic supplementary material, table S2). The shear strains in the PPS, Exy or Erθ, were significantly smaller than the normal strains (p ≤ 0.02) and also smaller than their respective DVC strain errors. All normal strain components (Exx, Eyy, Err and Eθθ) and the principal components Emax and γmax were significantly smaller in the PPS than in the AL (p ≤ 0.0001; figure 7 and table 1).
Figure 7.
Comparison of principal strains in the PPS (n = 23) and AL (n = 19) of the control group. Emax and γmax in the AL were 2.8 and 2.0 times, respectively, those in the PPS (table 1, p < 0.0001).
3.2.2. Regional variations in the strain response of the control peripapillary sclera
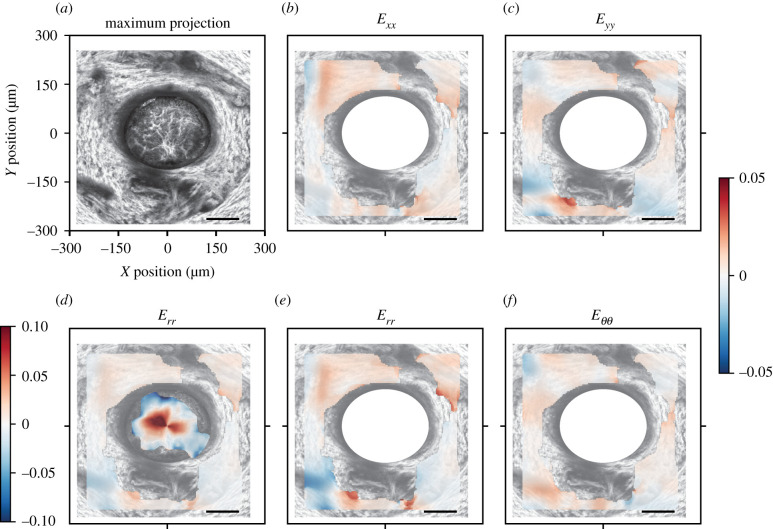
The in-plane strain field was highly heterogeneous with local regions of high tensile and compressive strains, which tended to occur near blood vessels (figure 8). The strain outcomes were averaged across each of the four quadrants (figure 1) and compared statistically to investigate the regional strain variation. The Err, Eθθ, Eyy, Exx, Emax and Emin differed among the four PPS quadrants (each strain component, p ≤ 0.0004).
Figure 8.
Colour contours of the DVC strain components for a representative control PPS. (a) Maximum projection PPS image volume was merged with astrocytic image volume (from figure 3). (d) Combined colour contours of Err show greater local strain in the AL (reproduced figure 3c) than the PPS (copied in e), colour scale [−0.1, 0.1]. For panels with PPS strain alone the colour scale was magnified to [−0.05, 0.05]. The strains plotted are the mean of all z-slices. In-plane strains in the cylindrical coordinate system showing (b) Err and (c) Eθθ, (e) Exx, and (f) Eyy. The strain contours show local regions of tensile (red) and compressive (blue) strain concentrations. PPS regions that appear dark superiorly and inferiorly are blood vessels traversing the PPS. Scale bars = 100 µm.
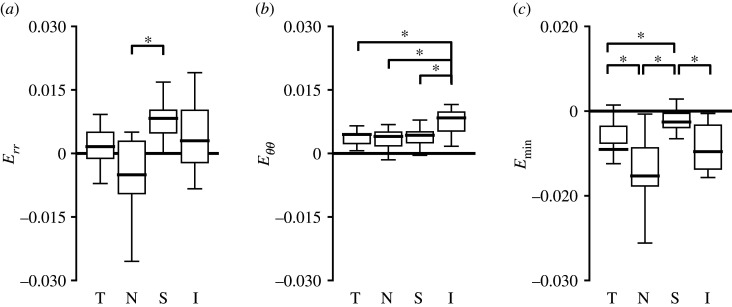
The mean strains were tensile in the superior, inferior and temporal quadrants, but in the nasal quadrant, Exx and Err were compressive. The Err in the nasal quadrant (−0.0050 ± 0.0137) was the lowest among all four quadrants and the highest in the superior quadrant (0.0083 ± 0.0054, p = 0.0002). However, the magnitudes of Err of the temporal and inferior quadrants were smaller than the estimated average absolute DVC strain error for Err. The Eθθ (0.0084 ± 0.0062) and Emax (0.0210 ± 0.0106) in the inferior region were the highest among all four quadrants (p ≤ 0.01 for Eθθ, p ≤ 0.02 for Emax; figure 9 and electronic supplementary material, table S7). The regional variations in Exx and Eyy were similar to Err and Eθθ, respectively, except the superior was similar to inferior in magnitude (electronic supplementary material, figure S2).
Figure 9.
Regional comparison of the radial strain, Err, circumferential strain, Eθθ, and minimum principal strain, Emin, for PPS of control eyes (n = 23, except inferior n = 17). The strain components Err, Eθθ, Eyy (not shown) and principal strains Emax (not shown) and Emin varied significantly between the four quadrants (p ≤ 0.0004; electronic supplementary material, table S7). (a) Err was smallest and compressive in the nasal quadrant, and (b) Eθθ was highest in the inferior quadrant, tensile in all four quadrants. (c) Emin had a similar regional variation as Err. T, temporal; N, nasal; S, superior; I, inferior. *p < 0.05.
3.3. Effect of ocular hypertension on the strain response of the astrocytic lamina
3.3.1. Specimen-averaged response in the astrocytic lamina with ocular hypertension
One day after microbead injection, the mean IOPs of eyes in the two OHT groups (27.3 ± 7.2 mmHg, n = 24) were significantly higher than the IOPs of their contralateral control eyes from the same mice (13.3 ± 5.3 mmHg, n = 24, p < 0.0001). IOPs measured 3 days after microbead injection were significantly higher in 3-day OHT eyes (18.8 ± 6.2 mmHg) than their contralateral eyes (9.4 ± 2.0, p = 0.0005, n = 13). IOPs measured in OHT eyes 6 weeks after microbead injection were not significantly different from their contralateral eyes (electronic supplementary material, table S3).
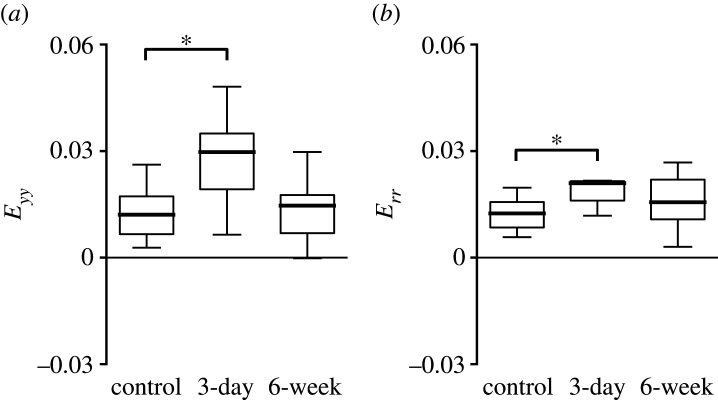
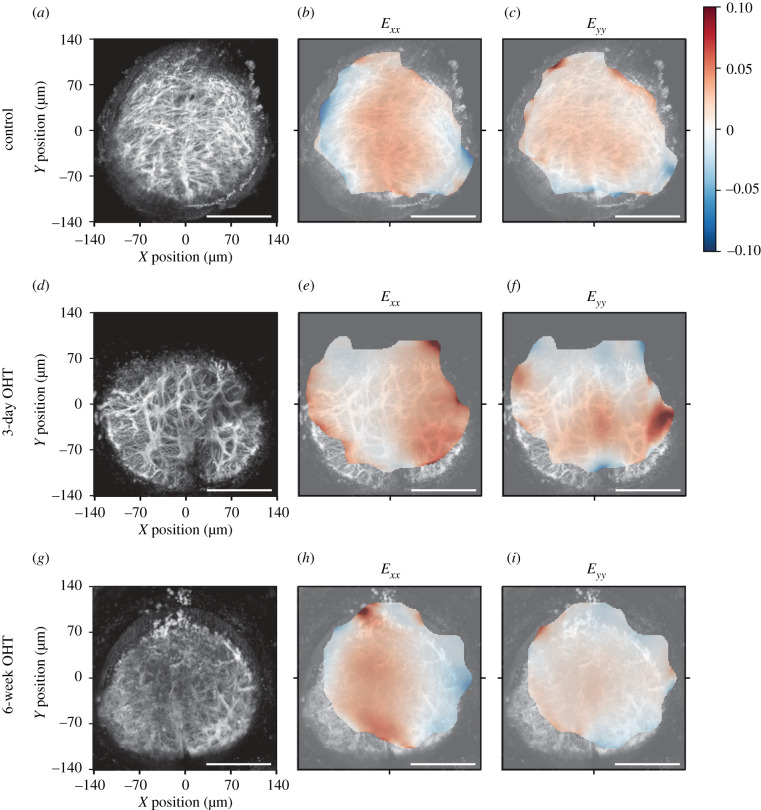
In general, many normal strain components and the principal strain components, Emax and Emin, increased after 3-day OHT, but became similar to controls after 6-week OHT. This pattern was evident in the specimen-averaged strains (figure 10 and table 3), in the strain contours (figure 11) and in the regional comparisons. The specimen-averaged AL strain magnitudes for the 3-day OHT group were higher than for the control. The mean Err in the 3-day OHT group (0.0210 ± 0.0098, n = 11) was 1.7 times that in the control (0.0124 ± 0.0073, p = 0.01, n = 19). Likewise, the Eyy in the 3-day OHT group (0.0297 ± 0.0194) was 2.5 times the mean in the control group (0.0121 ± 0.0068, p = 0.01) and 2.0 times the mean in the 6-week OHT group (0.0146 ± 0.0113, p = 0.85, n = 10). In the control and both OHT groups, the Eθθ mean was nearly twice the mean of Err (p < 0.03). Exx did not differ significantly from Eyy in 3-day OHT, but Exx was significantly larger than Eyy in the control (p < 0.0001) and 6-week OHT (p = 0.04) groups. All principal strain components, Emax, Emin and γmax, tended to be greater in the 3-day group than both the control and 6-week groups, but the comparisons were not statistically significant. None of the strains of the 6-week group was significantly different from the control group.
Figure 10.
Comparison of specimen-averaged strains in the AL between control (n = 19), 3-day OHT (n = 11) and 6-week OHT (n = 10) groups. (a) Eyy was 2.5 greater in the 3-day group than controls (p = 0.01) and 2.0 times greater than 6-week OHT (p = 0.05). (b) Err was 1.7 times greater in 3-day OHT than control (p = 0.01) and 1.3 times greater than 6-week group (p = 0.14). *p < 0.05 compared to control group.
Table 3.
Specimen-averaged strain components in the AL for 3-day OHT (n = 11) and 6-week OHT (n = 10) comparing each statistically to control values and to each other. Eyy and Err were significantly larger in the AL in 3-day OHT than control. Italics indicate significance level at p < 0.05.
| AL strain | 3-day (n = 11) | 3-day versus control p-value | 6-week (n = 10) | 6-week versus control p-value | 3-day versus 6-week p-value |
|---|---|---|---|---|---|
| Err | 0.0210 ± 0.0098 | 0.01 | 0.0156 ± 0.0078 | 0.96 | 0.14 |
| Eθθ | 0.0374 ± 0.0251 | 0.44 | 0.0302 ± 0.0171 | 0.93 | 0.70 |
| Exx | 0.0286 ± 0.0182 | 1.00 | 0.0312 ± 0.0177 | 0.89 | 0.94 |
| Eyy | 0.0297 ± 0.0194 | 0.01 | 0.0146 ± 0.0113 | 0.85 | 0.05 |
| Emax | 0.0572 ± 0.0311 | 0.32 | 0.0493 ± 0.0240 | 0.77 | 0.74 |
| Emin | 0.0011 ± 0.0100 | 0.43 | −0.0035 ± 0.0066 | 0.98 | 0.58 |
| γmax | 0.0281 ± 0.0168 | 0.63 | 0.0264 ± 0.0133 | 0.84 | 0.93 |
Figure 11.
Comparison of strains in three experimental groups. Representative AL image maximum projections: (a–c) control group, (d–f) 3-day OHT group and (g–i) 6-week OHT group. (b,e,h) Exx and (c,f,i) Eyy strain, mean of all z-slices. Origin (0, 0) corresponds to the centre of the AL. There are more locally compressive (blue) Exx areas in the periphery of the control and 6-week OHT than the 3-day Exx (compare b, e, h). Greatest tensile (red) Exx in the centre of the control and 6-week OHT, while in the 3-day OHT the greater tensile strain shifts to the periphery. Eyy is greater centrally in the 3-day OHT group. Scale bars = 100 µm.
3.3.2. Regional strain response in the astrocytic lamina with ocular hypertension
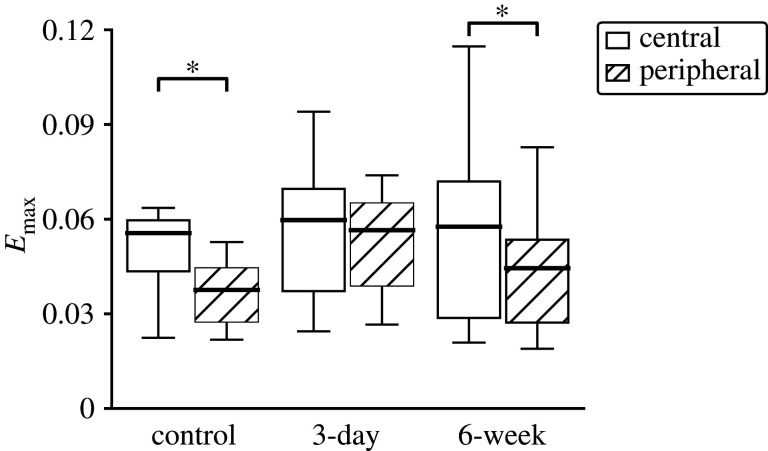
In both OHT groups, the normal strain components (Err, Exx, Eyy, Eθθ) and Emin were significantly greater in the central region than peripheral region across the AL as a whole, as in control eyes (figure 12 and table 4). However, within any one quadrant, the majority of pair-wise comparisons were not statistically different. For example, Eθθ was not statistically different between the central region and peripheral region of the temporal, inferior and superior quadrants, in both OHT groups.
Figure 12.
Central (white) to peripheral (hatched) regional comparison of Emax in three experimental groups. Emax was larger in the central than peripheral region in control and 6-week OHT groups (p < 0.0001 in control, p = 0.44 in 3-day, p = 0.03 in 6-week). *p < 0.05.
Table 4.
Strain components compared between the central and peripheral regions in the 3-day OHT (n = 11) and 6-week OHT (n = 10) AL, p-value comparing strain between four central and four peripheral regions. The normal strain components (Exx, Eyy, Err and Eθθ), Emax and Emin were significantly larger in the central than peripheral region (p ≤ 0.03) except for Emax in 3-day OHT group (p ≤ 0.03). Italics indicate significance level at p < 0.05.
| AL strain | central | peripheral | p-value |
|---|---|---|---|
| 3-day OHT | |||
| Err | 0.0381 ± 0.0254 | 0.0140 ± 0.0117 | 0.004 |
| Eθθ | 0.0433 ± 0.0301 | 0.0352 ± 0.0235 | 0.02 |
| Exx | 0.0425 ± 0.0334 | 0.0230 ± 0.0138 | 0.01 |
| Eyy | 0.0389 ± 0.0247 | 0.0263 ± 0.0191 | 0.004 |
| Emax | 0.0597 ± 0.0336 | 0.0565 ± 0.0307 | 0.44 |
| Emin | 0.0217 ± 0.0234 | −0.0072 ± 0.0148 | 0.001 |
| γmax | 0.0190 ± 0.0093 | 0.0319 ± 0.0205 | 0.002 |
| 6-week OHT | |||
| Err | 0.0339 ± 0.0192 | 0.0057 ± 0.0093 | <0.0001 |
| Eθθ | 0.0375 ± 0.0242 | 0.0261 ± 0.0131 | 0.002 |
| Exx | 0.0467 ± 0.0274 | 0.0228 ± 0.0140 | 0.0001 |
| Eyy | 0.0248 ± 0.0208 | 0.0090 ± 0.0072 | 0.002 |
| Emax | 0.0576 ± 0.0344 | 0.0445 ± 0.0194 | 0.03 |
| Emin | 0.0138 ± 0.0102 | −0.0126 ± 0.0121 | <0.0001 |
| γmax | 0.0219 ± 0.0135 | 0.0285 ± 0.0146 | 0.01 |
In the OHT groups, there were fewer significant differences in the normal strains and in the principal strains Emax and Emin among the four central and among the four peripheral quadrants than there were in controls, leading to a more uniform strain response (electronic supplementary material, tables S4–S6). For example, pair-wise comparisons in controls found that Eyy in the central inferior was smaller than in the other central quadrants (p ≤ 0.002, n = 19) and Eyy in the central superior quadrant was significantly larger than in the central nasal (p = 0.04) and central temporal (p = 0.01) quadrants. By contrast, in 3-day OHT, the Eyy means of three quadrants—temporal, nasal and inferior—were not significantly different from each other and in 6-week OHT none of the four means differed. The Err and Emin did not vary among the four peripheral quadrants in either OHT group, whereas in the control group, all four peripheral quadrants differed from one another in these strains (electronic supplementary material, tables S4–S6). All strains, except for Emin, were tensile in all peripheral quadrants in both OHT groups. However, in controls, Err was compressive in the nasal and inferior peripheral regions and Eyy was compressive in the peripheral inferior region.
The effects of experimental glaucoma on the quadrant strain variation were different for each strain component (figure 13 and electronic supplementary material, tables S4–S6). For example, Exx exhibited a similar pattern of strain magnitude among the four central quadrants for the control, 3-day and 6-week groups. For all three groups, Exx was highest in the inferior, followed by temporal, then superior, and was smallest in the nasal quadrant. However, the central inferior quadrant had the lowest Eyy and Err in the control group, but had the highest Eyy and Err in the 3-day OHT group. Eyy and Err in the inferior quadrant, in both central and peripheral regions, were greater in the 3-day OHT than in the control (p ≤ 0.001).
Figure 13.
Comparison of the variations in (a) Exx and (b) Eyy in the central quadrants for the AL of control (n = 19), 3-day OHT (n = 11) and 6-week OHT (n = 10), where T, temporal; N, nasal; S, superior; I, inferior. Similar quadrant variations were present for Exx and Eθθ (not shown) among the different groups, but Eyy and Err (not shown) tended to be more homogenous between the four quadrants in 3-day OHT and 6-week OHT. *p < 0.05.
3.4. Effect of ocular hypertension on the strain response of the peripapillary sclera
3.4.1. Specimen-averaged response in the peripapillary sclera with ocular hypertension
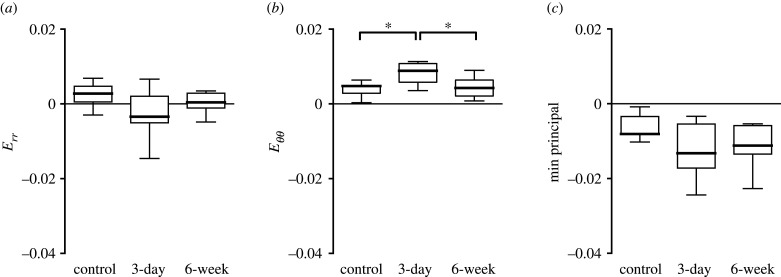
Experimental glaucoma had similar effects on the strain response in the PPS as measured in the AL, with strains greater in the 3-day OHT eyes than in the controls and strains similar between the 6-week OHT eyes and controls (figure 14 and table 5). For example, in 3-day OHT, the mean Eθθ (0.0088 ± 0.0055) was 1.9 times the control group mean (p = 0.02) and 2.1 times the 6-week OHT group mean (0.0042 ± 0.0009, p = 0.83). The strains in the 6-week glaucoma were not statistically different from those in controls. As in controls, in 3-day OHT eyes, Eθθ was greater than Err (p = 0.0002) and Eyy was greater than Exx (p = 0.03). In the 6-week OHT group, Eθθ was not significantly greater than Err (p = 0.11), nor was Eyy significantly greater than Exx (p = 0.05).
Figure 14.
Comparison of specimen-averaged strain among all experimental groups in the PPS. Control (n = 23), 3-day OHT (n = 13) and 6-week OHT (n = 11) eyes. (a) Err in the 3-day OHT group was compressive and 1.3 times that of the control (p = 0.05) and more compressive than the 6-week group (p = 0.38). (b) Eθθ in the 3-day OHT group was 1.9 times that of the control (p = 0.02). (c) Emin in the 3-day OHT group was 1.2 times that of the control (p = 0.05). *p < 0.05.
Table 5.
Specimen-averaged strain components in the PPS for 3-day OHT (n = 13) and 6-week OHT (n = 11), showing p-values for the statistical comparison of both to control and to each other. Err was smaller and Eθθ was significantly larger in the PPS in 3-day OHT than control (italicized p < 0.05).
| PPS strain | 3-day n = 13 | 3-day versus control p-value | 6-week n = 10 | 6-week versus control p-value | 3-day versus 6-week p-value |
|---|---|---|---|---|---|
| Err | −0.0034 ± 0.0025 | 0.05 | 0.0004 ± 0.0052 | 0.38 | 0.38 |
| Eθθ | 0.0088 ± 0.0055 | 0.02 | 0.0042 ± 0.0028 | 0.83 | 0.01 |
| Exx | −0.0011 ± 0.0080 | 0.33 | −0.0004 ± 0.0058 | 0.49 | 0.90 |
| Eyy | 0.0065 ± 0.0056 | 0.64 | 0.0050 ± 0.0045 | 0.84 | 0.27 |
| Emax | 0.0186 ± 0.0086 | 0.45 | 0.0158 ± 0.0096 | 0.93 | 0.32 |
| Emin | −0.0132 ± 0.0109 | 0.05 | −0.0112 ± 0.0074 | 0.65 | 0.42 |
| γmax | 0.0159 ± 0.0094 | 0.15 | 0.0135 ± 0.0081 | 1.00 | 0.31 |
3.4.2. Regional strain response in the peripapillary sclera with ocular hypertension
There were fewer statistically significant differences in the PPS Eθθ, Eyy, Emax, Emin and γmax among the four-quadrant means in the 3-day and 6-week OHT groups than in the control group suggesting a more homogeneous strain response (electronic supplementary material, tables S7–S9). For example, Eθθ was the highest in the inferior quadrant in the control and 3-day OHT groups, but Eθθ was similar among the four quadrants in 6-week OHT. PPS Eθθ in the inferior quadrant was the highest among all four quadrants in the control group (p ≤ 0.01) and higher than the nasal quadrant in the 3-day OHT group (p < 0.01). The Eyy and Err in the superior quadrant were the highest among all four quadrants of the control group, significantly higher than in the nasal (p < 0.0001 for Eyy and p = 0.0002 for Err) and in the temporal (p = 0.02 for Eyy and p = 0.07 for Err). In 3-day OHT, the only statistically significant difference for Err was between the compressive Err in the inferior and the tensile Err in the superior quadrant (p = 0.001; figure 15a). In 6-week OHT, the highly tensile Eyy in the superior quadrant was statistically different only from the temporal quadrant (p < 0.001). The Eyy in the temporal quadrant was greater in the 3-day OHT group than in the control group (p = 0.04).
Figure 15.
Comparison of the quadrant variation in radial strain, Err, and circumferential strain, Eθθ, in the PPS of control (n = 23, except I n = 17), 3-day OHT (T n = 11, N and S n = 12, I n = 8) and 6-week OHT (T and N n = 10, S n = 11, I n = 7) eyes, where T, temporal; N, nasal; S, superior; I = inferior. (a) Err was highest in the superior quadrant for all three groups and was statistically greater than in the nasal quadrant for controls (p = 0.0002), than in the inferior quadrant for 3-day and 6-week OHT (p ≤ 0.03), than in the temporal quadrant in the 6-week OHT (p = 0.001). (b) Eθθ became more homogeneous among the four quadrants for 3-week and 6-week OHT groups. *p < 0.05.
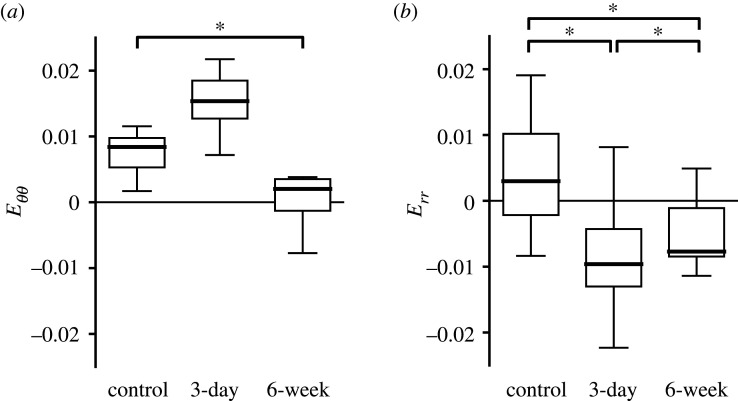
Strains in the inferior quadrant were significantly different among the three experimental groups (figure 16). The Emin and Err in the inferior quadrant in both OHT groups were more compressive than in the control (p ≤ 0.01), most of all in the 3-day OHT group (p ≤ 0.002). Strains in the inferior quadrant of the 3-day OHT group that were significantly different from the controls were greater, γmax (p < 0.0001), Exx (p < 0.0001) and Exy (p < 0.0001), and a smaller Eyy (p = 0.0002).
Figure 16.
Comparison of strain in the PPS inferior quadrant among experimental groups in the PPS. Control (n = 17), 3-day OHT (n = 8) and 6-week OHT (n = 7) eyes. (a) Eθθ in the 3-day OHT group was greater than the control and the 6-week OHT. Eθθ in 6-week OHT was 0.2 times smaller than control (p < 0.0001). (b) Err in the 3-day OHT group was compressive and −3.2 times smaller than the control and −2.6 times smaller than the 6-week OHT group (p < 0.0001). 6-week OHT group was −2.6 times smaller than the control group (p < 0.0001). *p < 0.05.
4. Discussion
The AL strain responses to inflation of explanted mouse eyes from 10 to 30 mmHg in the present study are similar in order of magnitude, but half of the values from our two previous studies of mouse explants in a different mouse type [25,26]. Mice of different genetic backgrounds have different eye sizes and scleral strain responses [28,33–35] which may affect ONH mechanics [36]. Remodelling responses and axonal loss can present differently in mice of different genetic backgrounds [28,33,34]. The current and the previous two studies found biaxial tension in the AL with greater strain in the x- than the y-direction and greater strain in the centre than the periphery of the AL [25,26]. The strain magnitudes in mouse AL are 50% greater than Eθθ and smaller than Err measurements of post-mortem human lamina cribrosa [14], greater than measurements of post-mortem ONH [37], and between 1/3 and 2 times the optical coherence tomographic estimates of ONH strain in patients [17–19]. PPS strain magnitudes here were an order of magnitude smaller than measurements in mouse sclera farther from the AL [38,39]. Generally, studies suggest greater strains in the sclera farther from the AL than at the PPS–lamina junction [16,40], where the PPS is both thicker than the mid-sclera and more circumferentially aligned in the outer than the inner surface in rodent and primate eyes [41–43].
In-plane normal strains were more tensile in the central AL than in the periphery, where they were less tensile and even locally compressive. The AL displaced posteriorly, most of all in the centre. This behaviour is similar to that of a thin circular elastic plate bending due to pressure applied to one of its surfaces. If a circular plate is clamped on its perimeter, as the AL may be by the stiff PPS, then it would exhibit compression posteriorly at the edge and tension in the centre. The assumption of a stiffer PPS than the AL is supported by strain measurements herein and by the tissues' load-bearing components, predominantly collagen fibres in the PPS and astrocytic processes in the AL [44,45]. The astrocytic processes align predominantly in-plane across the AL and can span the entirety of the AL [46–49]. The AL periphery has denser astrocytic processes, thicker filamentous cytoarchitecture and transcellular contacts through their basement membranes with the PPS [49,50]. This morphology could make the AL stiffer peripherally, resulting in locally smaller tensile strain.
The quadrant strain variation in the inferior AL and PPS was consistent with the structure of the mouse AL. A large vascular stalk enters inferiorly to the AL [7,51]. The stalk interrupts the structure of circumferentially aligned collagen fibres of the PPS [42] and may result in a stiffer and altered anisotropic behaviour. Finite-element simulations using individual histomorphometric reconstructions of the rat posterior pole tissues estimated greater strain concentrations in the inferior and superior poles of the AL [52,53]. Similarly, we measured the inferior quadrant in the PPS had the greatest Eθθ and Emax. There were strain concentrations in the PPS adjacent to vascular lumens, see figure 8a, which could be relieved or exacerbated when the lumens are loaded by pressurized blood flow. The deformation of the traversing blood vessels on the PPS mechanics was not accounted for, since DVC could not measure their displacement, and vascular pressure is not maintained in eye explants.
The regional connective tissue structure of the human lamina cribrosa is less dense in its superior and inferior poles [54] and measured strains in post-mortem eyes confirm greater strains, particularly inferiorly [14,30]. Axons passing through these polar areas are lost preferentially in human glaucoma, linking biomechanical behaviour and pathological loss of neurons. The pattern of astrocytes in mouse AL generally mimics that of the human lamina cribrosa, but lacks regional differences in process density. Likewise, there are minimal differences in axon loss by region in experimental mouse glaucoma [34].
After 3-day OHT, both Err and Eyy in AL were significantly greater than in control. Furthermore, the strain differences within four quadrants between the central and peripheral regions were small and not statistically significant. The inferior AL quadrant had the lowest Err and Eyy of all four quadrants in controls, but these strain components became the highest in the 3-day OHT group. Multiple mechanisms of AL remodelling reported in the literature may lead to increased compliance, greater expansion and greater bending of the AL, and thus may explain our strain findings. One such mechanism may be an astrocytic reorganization, reported in the rat AL after OHT, with the most reorganization of processes in the inferior quadrant [55]. We found that the inferior quadrant experienced the greatest change in strain response. In rat and mouse AL, astrocyte processes reoriented from perpendicular to more parallel to the z-axis [49,55,56]. These structural alterations and thinner intermediate filament cytoarchitecture in the centre of the AL in 3-day OHT [49] can lead to greater compliance of AL.
Our strain findings can also be explained by the separation of anchoring peripheral astrocyte processes at their basement membrane in the AL–PPS border shown by transmission electron microscopy of 3-day OHT in mouse and early OHT in rat [47,50]. The reduction of contact between AL and PPS can alter the boundary constraints on the AL and lead to increased strain. For example, a circular thin plate under bending would have greater tensile strain if pinned (reduced boundary constraint) on its circular edge than if clamped. Midgett et al. [14] also suspected bending of the human lamina, since greater posterior bowing of the lamina correlated with greater compressive PPS Err, and with smaller tensile Eθθ. We also found more compressive PPS Err in the 3-day OHT than in the control group, but more tensile PPS Eθθ in the 3-day OHT. The AL enlarges in 3-day OHT [25,49], which may directly result in greater tensile strain in the central region of the AL, since a larger circular thin plate experiences greater bending.
After 6-week OHT, global strain magnitudes in the AL were similar to those in controls and PPS strains trended towards decrease, but overall were not statistically different. This suggests that the biomechanical behaviour of the AL returned to baseline concurrent or following the return of the IOP to control level six weeks after microbead injection. Furthermore, the compressive Err and greater Eθθ in the PPS in the 3-day OHT group were likely due to the reversible changes in the AL, rather than any significant connective tissue remodelling in the PPS. Late in experimental glaucoma of the rat [12] and the mouse [50,56], AL astrocytic processes returned to their control morphology and re-established junctions with the AL basement membrane at the PPS. Nevertheless, in parallel experiments with the same mouse genotype as here, we demonstrated the loss of 66.3% axons 6 weeks after comparable OHT [50]. At this timepoint, not only is there significant axonal loss, but astrocytes in the AL proliferated and formed new extracellular matrix [50,57,58]. Replacement or disorganization of the original astrocytic network may decrease the heterogeneity in the strain fields of the AL. Indeed, Err and Eyy were similar among the four central and peripheral quadrants. The impact of PPS and mid-scleral remodelling was not apparent on the specimen-averaged strain response with the present methodology, despite structural and mechanical changes in these tissues documented in the mouse after chronic OHT [33,39,42,58–60]. Computational modelling is needed to further analyse this and prior inflation studies of the AL, PPS and mid-posterior sclera to understand how the mechanosensitive changes in the cellular AL stimulate the remodelling of the connective tissue of the PPS and how scleral alterations in turn change the behaviour of the AL.
Contrary to the findings of this report, our previous pilot study [25] showed a stiffer pressure-strain response in x in the AL and a stiffer perimeter strain response in the PPS of a 3-day OHT mouse model. Our prior work used mice of a different genotype and had a smaller sample size of six OHT and seven control eyes. Some OHT eyes herein also exhibited low strains, for example, eight of eleven 3-day OHT eyes had lower Exx than the control mean Exx. An increase in the strain response is not generally observed in human glaucoma eyes, where the ONH of eyes with mild damage exhibited a stiffer pressure-strain response [61–63]. However, more compliant behaviour may occur too early in the pathogenesis of glaucoma to be observed in human patients. A similar phenomenon was measured in experimental glaucoma models in monkeys by Burgoyne et al. [64–68]. The studies showed a more compliant ONH response one to two weeks after induction of OHT in monkey eyes. Thirteen to eighteen weeks later, the response of ONH is no longer hypercompliant but stiffer. However, further studies are needed to confirm and track the early biomechanical changes measured in this study in mouse models of glaucoma.
There were several limitations to the present study that should be considered. The use of explanted eyes retains the normal architecture within which astrocytes reside, but excludes relevant applied loads and boundary conditions—optic nerve sheath tethering, optic nerve tissue pressure posterior to the AL, blood pressure and extraocular muscle tension. Some strains, AL Erθ, PPS Err and Exy, and both AL and PPS Ezz, were within the DVC estimated strain error despite exceeding the image correlation coefficient threshold. PPS and AL image edges contained uncorrelated areas, especially in the peripheral AL. Advancements in microscopic imaging resolution and speed will improve image correlation and reduce the strain error in the future. The spatial resolution was lower and scanning speed was slower in the z-direction, which increased the strain error of all strain components, since the strain tensor is calculated from displacements in all three dimensions. The dense collagen fibre network of the PPS and its blood vessels limit imaging depth; thus, there was poorer correlation for z-displacement calculation. The PPS images captured a 531 × 531 µm2 field of view of the PPS–AL junction. While stresses and deformation of the PPS near the AL are critically important to AL mechanics [36], a thinner, more elongated or more compliant mid-sclera can increase IOP-induced stresses applied to the PPS and AL. The curved posterior surface of the PPS and the limitation of manual alignment of the specimen resulted in unequal visualization of the four quadrants. In order to maintain astrocyte viability in the eye explant during image acquisition, we were unable to include more than one IOP incremental increase during inflation testing. Protein integrity is impaired more during fixation of inflation-tested tissue compared to in situ tissue fixation and thus was not optimal for subsequent investigation of astrocyte process alignment, cytoskeletal properties and axonal loss by high-resolution microscopy.
5. Conclusion
We measured the strain responses of the AL and the PPS by ex vivo inflation testing combined with microscopy and DVC. We compared the strain response of these tissues before and after chronic OHT via microbead injection. The strain response was biaxial in both tissues, and the strain was significantly more tensile in the centre than the periphery of the AL. The AL of eyes exposed to 3 days of OHT exhibited a greater strain response compared to the control eyes. Six weeks after microbead injection the magnitude of the strain response of the AL was similar to the control group. Remodelling of the astrocyte network in itself can significantly increase the mechanical stimuli in the ONH. Future work should consider the evolution of both the astrocyte network and collagenous beams in the human ONH in glaucoma.
Supplementary Material
Supplementary Material
Acknowledgements
The authors thank Cathy Nguyen for training resource guides, Dan Midgett for sharing strain calculation methods and DVC implementation codes, and Mary Ellen Pease for nonlinear optics microscopy expertize. DVC analysis was performed using the Maryland Advanced Research Computing Center (MARCC).
Ethics
All experimental procedures were approved and monitored by the Johns Hopkins University School of Medicine Animal Care and Use Committee (no. MO18M423). Methods are described in the text.
Data accessibility
Data are provided as electronic supplementary material.
Authors' contributions
T.D.N. and H.Q. conceived the study. E.C.L. conducted mouse surgical procedures and coordinated the study. A.K. involved in inflation testing, data analysis and original manuscript draft. J.L.J. involved in statistical analysis. A.K., E.C.L., H.Q. and T.D.N. involved in critical manuscript revision. All authors participated in the preparation of the manuscript for publication.
Competing interests
We declare we have no competing interests.
Funding
This work was supported by National Institutes of Health grant nos. EY 02120 (H.Q.), EY 01765, T32EY007143 (A.K.) and NSF Award 1727104 (T.D.N), and unrestricted support from donors to the Glaucoma Center of Excellence.
References
- 1.Tham YC, Li X, Wong TY, Quigley HA, Aung T, Cheng CY. 2014. Global prevalence of glaucoma and projections of glaucoma burden through 2040: a systematic review and meta-analysis. Ophthalmology 121, 2081–2090. ( 10.1016/j.ophtha.2014.05.013) [DOI] [PubMed] [Google Scholar]
- 2.Heijl A, Leske MC, Bengtsson B, Hyman L, Bengtsson B, Hussein M, Parrish RK. 2003. Reduction of intraocular pressure and glaucoma progression. Evidence-Based Eye Care 4, 137–139. ( 10.1097/00132578-200307000-00009) [DOI] [Google Scholar]
- 3.Quigley HA, Addicks EM. 1980. Chronic experimental glaucoma in primates II. Effect of extended intraocular pressure elevation on optic nerve head and axonal transport. Invest. Ophthalmol. Vis. Sci. 19, 137–152. [PubMed] [Google Scholar]
- 4.Pease ME, McKinnon SJ, Quigley HA, Kerrigan-Baumrind LA, Zack DJ. 2000. Obstructed axonal transport of BDNF and its receptor TrkB in experimental glaucoma. Invest. Ophthalmol. Vis. Sci. 41, 764–774. [PubMed] [Google Scholar]
- 5.Cone FE, Gelman SE, Son JL, Pease ME, Quigley HA. 2010. Differential susceptibility to experimental glaucoma among 3 mouse strains using bead and viscoelastic injection. Exp. Eye Res. 91, 415–424. ( 10.1016/j.exer.2010.06.018) [DOI] [PMC free article] [PubMed] [Google Scholar]
- 6.Tehrani S, Davis L, Cepurna WO, Delf RK, Lozano DC, Choe TE, Johnson EC, Morrison JC. 2019. Optic nerve head astrocytes display axon-dependent and independent reactivity in response to acutely elevated intraocular pressure. Investig. Ophthalmol. Vis. Sci. 60, 312–321. ( 10.1167/iovs.18-25447) [DOI] [PMC free article] [PubMed] [Google Scholar]
- 7.Morrison JC, Moore CG, Deppmeier LMH, Gold BG, Meshul CK, Johnson EC. 1997. A rat model of chronic pressure-induced optic nerve damage. Exp. Eye Res. 64, 85–96. ( 10.1006/exer.1996.0184) [DOI] [PubMed] [Google Scholar]
- 8.Quigley HA, Addicks EM, Green WR, Maumenee AE. 1981. Optic nerve damage in human glaucoma: II. The site of injury and susceptibility to damage. Arch. Ophthalmol. 99, 635–649. ( 10.1001/archopht.1981.03930010635009) [DOI] [PubMed] [Google Scholar]
- 9.Varela HJ, Hernandez MR. 1997. Astrocyte responses in human optic nerve head with primary open-angle glaucoma. J. Glaucoma 6, 303–313. ( 10.1097/00061198-199710000-00007) [DOI] [PubMed] [Google Scholar]
- 10.Furuyoshi N, Furuyoshi M, May CA, Hayreh SS, Alm A, Lütjen-Drecoll E. 2000. Vascular and glial changes in the retrolaminar optic nerve in glaucomatous monkey eyes. Ophthalmologica 214, 24–32. ( 10.1159/000027470) [DOI] [PubMed] [Google Scholar]
- 11.Quigley HA, Green WR. 1979. The histology of human glaucoma cupping and optic nerve damage: clinicopathologic correlation in 21 eyes. Ophthalmology 86, 1803–1827. ( 10.1016/S0161-6420(79)35338-6) [DOI] [PubMed] [Google Scholar]
- 12.Johnson EC, Deppmeier LMH, Wentzien SKF, Hsu I, Morrison JC. 2000. Chronology of optic nerve head and retinal responses to elevated intraocular pressure. Investig. Ophthalmol. Vis. Sci. 41, 431–442. [PubMed] [Google Scholar]
- 13.Morrison JC. 1990. Optic nerve head extracellular matrix in primary optic atrophy and experimental glaucoma. Arch. Ophthalmol. 108, 1020 ( 10.1001/archopht.1990.01070090122053) [DOI] [PubMed] [Google Scholar]
- 14.Midgett DE, Jefferys JL, Quigley HA, Nguyen TD. 2020. The inflation response of the human lamina cribrosa and sclera: analysis of deformation and interaction. Acta Biomater. 106, 225–241. ( 10.1016/j.actbio.2020.01.049) [DOI] [PMC free article] [PubMed] [Google Scholar]
- 15.Tamimi EA, Pyne JD, Muli DK, Axman KF, Howerton SJ, Davis MR, Girkin CA, Vande Geest JP. 2017. Racioethnic differences in human posterior scleral and optic nerve stump deformation. Investig. Ophthalmol. Vis. Sci. 58, 4235–4246. ( 10.1167/iovs.17-22141) [DOI] [PMC free article] [PubMed] [Google Scholar]
- 16.Coudrillier B, Boote C, Quigley HA, Nguyen TD. 2013. Scleral anisotropy and its effects on the mechanical response of the optic nerve head. Biomech. Model. Mechanobiol. 12, 941–963. ( 10.1007/s10237-012-0455-y) [DOI] [PMC free article] [PubMed] [Google Scholar]
- 17.Midgett DE, Quigley HA, Nguyen TD. 2019. In vivo characterization of the deformation of the human optic nerve head using optical coherence tomography and digital volume correlation. Acta Biomater. 96, 385–399. ( 10.1016/j.actbio.2019.06.050) [DOI] [PMC free article] [PubMed] [Google Scholar]
- 18.Beotra MR, Wang X, Tun TA, Zhang L, Baskaran M, Aung T, Strouthidis NG, Girard MJA. 2018. In vivo three-dimensional lamina cribrosa strains in healthy, ocular hypertensive, and glaucoma eyes following acute intraocular pressure elevation. Investig. Opthalmol. Vis. Sci. 59, 260–272. ( 10.1167/iovs.17-21982) [DOI] [PubMed] [Google Scholar]
- 19.Girard MJA, et al. 2016. In vivo 3-dimensional strain mapping of the optic nerve head following intraocular pressure lowering by trabeculectomy. Ophthalmology 123, 1190–1200. ( 10.1016/j.ophtha.2016.02.008) [DOI] [PubMed] [Google Scholar]
- 20.Rosario Hernandez M, Pena JDO, Selvidge JA, Salvador-Silva M, Yang P. 2000. Hydrostatic pressure stimulates synthesis of elastin in cultured optic nerve head astrocytes. Glia 32, 122–136. () [DOI] [PubMed] [Google Scholar]
- 21.Kirwan RP, Fenerty CH, Crean J, Wordinger RJ, Clark AF, O'Brien CJ. 2005. Influence of cyclical mechanical strain on extracellular matrix gene expression in human lamina cribrosa cells in vitro. Mol. Vis. 11, 798–810. ( 10.1016/s0021-9290(06)84552-5) [DOI] [PubMed] [Google Scholar]
- 22.Quill B, Docherty NG, Clark AF, O'Brien CJ. 2011. The effect of graded cyclic stretching on extracellular matrix-related gene expression profiles in cultured primary human lamina cribrosa cells. Investig. Ophthalmol. Vis. Sci. 52, 1908–1915. ( 10.1167/iovs.10-5467) [DOI] [PubMed] [Google Scholar]
- 23.Rogers RS, Dharsee M, Ackloo S, Sivak JM, Flanagan JG. 2012. Proteomics analyses of human optic nerve head astrocytes following biomechanical strain. Mol. Cell. Proteomics 11, 1–18. ( 10.1074/mcp.M111.012302) [DOI] [PMC free article] [PubMed] [Google Scholar]
- 24.Mulvihill JJE, Raykin J, Snider EJ, Schildmeyer LA, Zaman I, Platt MO, Kelly DJ, Ethier CR. 2018. Development of a platform for studying 3d astrocyte mechanobiology: compression of astrocytes in collagen gels. Ann. Biomed. Eng. 46, 365–374. ( 10.1007/s10439-017-1967-5) [DOI] [PubMed] [Google Scholar]
- 25.Nguyen C, Midgett D, Kimball EC, Steinhart MR, Nguyen TD, Pease ME, Oglesby EN, Jefferys JL, Quigley HA. 2017. Measuring deformation in the mouse optic nerve head and peripapillary sclera. Investig. Ophthalmol. Vis. Sci. 58, 721–733. ( 10.1167/iovs.16-20620) [DOI] [PMC free article] [PubMed] [Google Scholar]
- 26.Nguyen C, Midgett D, Kimball E, Jefferys J, Nguyen TD, Schaub J, Pease M, Quigley H. 2018. Age-related changes in quantitative strain of mouse astrocytic lamina cribrosa and peripapillary sclera using confocal microscopy in an explant model. Investig. Ophthalmol. Vis. Sci. 59, 5157–5166. ( 10.1167/iovs.18-25111) [DOI] [PMC free article] [PubMed] [Google Scholar]
- 27.Ye H, Hernandez MR. 1995. Heterogeneity of astrocytes in human optic nerve head. J. Comp. Neurol. 362, 441–452. ( 10.1002/cne.903620402) [DOI] [PubMed] [Google Scholar]
- 28.Cone FE, Steinhart MR, Oglesby EN, Kalesnykas G, Pease ME, Quigley HA. 2012. The effects of anesthesia, mouse strain and age on intraocular pressure and an improved murine model of experimental glaucoma. Exp. Eye Res. 99, 27–35. ( 10.1016/j.exer.2012.04.006) [DOI] [PMC free article] [PubMed] [Google Scholar]
- 29.Schindelin J, et al. 2012. Fiji: an open-source platform for biological-image analysis. Nat. Methods 9, 676–682. ( 10.1038/nmeth.2019) [DOI] [PMC free article] [PubMed] [Google Scholar]
- 30.Midgett DE, Pease ME, Jefferys JL, Patel M, Franck C, Quigley HA, Nguyen TD. 2017. The pressure-induced deformation response of the human lamina cribrosa: analysis of regional variations. Acta Biomater. 53, 123–139. ( 10.1016/j.actbio.2016.12.054) [DOI] [PMC free article] [PubMed] [Google Scholar]
- 31.Bar-Kochba E, Toyjanova J, Andrews E, Kim KS, Franck C. 2015. A fast iterative digital volume correlation algorithm for large deformations. Exp. Mech. 55, 261–274. ( 10.1007/s11340-014-9874-2) [DOI] [Google Scholar]
- 32.Bar-Kochba E, Toyjanova J, Andrews E, Kim K-S, Franck C. 2019. A fast iterative digital volume correlation algorithm for large deformations Github Repos. (https://github.com/FranckLab/FIDVC)
- 33.Pease ME, Oglesby EN, Cone-Kimball E, Jefferys JL, Steinhart MR, Kim AJ, Hanes J, Quigley HA. 2014. Scleral permeability varies by mouse strain and is decreased by chronic experimental glaucoma. Investig. Ophthalmol. Vis. Sci. 55, 2564–2573. ( 10.1167/iovs.13-13327) [DOI] [PMC free article] [PubMed] [Google Scholar]
- 34.Schaub JA, Kimball EC, Steinhart MR, Nguyen C, Pease ME, Oglesby EN, Jefferys JL, Quigley HA. 2017. Regional retinal ganglion cell axon loss in a murine glaucoma model. Investig. Ophthalmol. Vis. Sci. 58, 2765–2773. ( 10.1167/iovs.17-21761) [DOI] [PMC free article] [PubMed] [Google Scholar]
- 35.Steinhart MR, Cone FE, Nguyen C, Nguyen TD, Pease ME, Puk O, Graw J, Oglesby EN, Quigley HA. 2012. Mice with an induced mutation in collagen 8A2 develop larger eyes and are resistant to retinal ganglion cell damage in an experimental glaucoma model. Mol. Vis. 18, 1093–1106. [PMC free article] [PubMed] [Google Scholar]
- 36.Sigal IA, Flanagan JG, Ethier CR. 2005. Factors influencing optic nerve head biomechanics. Investig. Opthalmology Vis. Sci. 46, 4189–4199. ( 10.1167/iovs.05-0541) [DOI] [PubMed] [Google Scholar]
- 37.Ma Y, Pavlatos E, Clayson K, Pan X, Kwok S, Sandwisch T, Liu J. 2019. Mechanical deformation of human optic nerve head and peripapillary tissue in response to acute IOP elevation. Investig. Ophthalmol. Vis. Sci. 60, 913–920. ( 10.1167/iovs.18-26071) [DOI] [PMC free article] [PubMed] [Google Scholar]
- 38.Myers KM, Cone FE, Quigley HA, Gelman S, Pease ME, Nguyen TD. 2010. The in vitro inflation response of mouse sclera. Exp. Eye Res. 91, 866–875. ( 10.1016/j.exer.2010.09.009) [DOI] [PMC free article] [PubMed] [Google Scholar]
- 39.Nguyen C, Cone FE, Nguyen TD, Coudrillier B, Pease ME, Steinhart MR, Oglesby EN, Jefferys JL, Quigley HA. 2013. Studies of scleral biomechanical behavior related to susceptibility for retinal ganglion cell loss in experimental mouse glaucoma. Investig. Ophthalmol. Vis. Sci. 54, 1767–1780. ( 10.1167/iovs.12-10952) [DOI] [PMC free article] [PubMed] [Google Scholar]
- 40.Coudrillier B, Tian J, Alexander S, Myers KM, Quigley HA, Nguyen TD. 2012. Biomechanics of the human posterior sclera: age- and glaucoma-related changes measured using inflation testing. Investig. Ophthalmol. Vis. Sci. 53, 1714–1728. ( 10.1167/iovs.11-8009) [DOI] [PMC free article] [PubMed] [Google Scholar]
- 41.Pijanka JK, Spang MT, Sorensen T, Liu J, Nguyen TD, Quigley HA, Boote C. 2015. Depth-dependent changes in collagen organization in the human peripapillary sclera. PLoS ONE 10, e0118648 ( 10.1371/journal.pone.0118648) [DOI] [PMC free article] [PubMed] [Google Scholar]
- 42.Pijanka JK, Kimball EC, Pease ME, Abass A, Sorensen T, Nguyen TD, Quigley HA, Boote C. 2014. Changes in scleral collagen organization in murine chronic experimental glaucoma. Invest. Ophthalmol. Vis. Sci. 55, 6554–6564. ( 10.1167/iovs.14-15047) [DOI] [PMC free article] [PubMed] [Google Scholar]
- 43.Girard MJA, Dahlmann-Noor A, Rayapureddi S, Bechara JA, Bertin BME, Jones H, Albon J, Khaw PT, Ethier CR. 2011. Quantitative mapping of scleral fiber orientation in normal rat eyes. Invest. Ophthalmol. Vis. Sci. 52, 9684–9693. ( 10.1167/iovs.11-7894) [DOI] [PubMed] [Google Scholar]
- 44.Quigley HA, Dorman-Pease ME, Brown AE. 1991. Quantitative study of collagen and elastin of the optic nerve head and sclera in human and experimental monkey glaucoma. Curr. Eye Res. 10, 877–888. ( 10.3109/02713689109013884) [DOI] [PubMed] [Google Scholar]
- 45.Gelman S, Cone FE, Pease ME, Nguyen TD, Myers K, Quigley HA. 2010. The presence and distribution of elastin in the posterior and retrobulbar regions of the mouse eye. Exp. Eye Res. 90, 210–215. ( 10.1016/j.exer.2009.10.007) [DOI] [PMC free article] [PubMed] [Google Scholar]
- 46.May CA, Lütjen-Drecoll E. 2002. Morphology of the murine optic nerve. Investig. Ophthalmol. Vis. Sci. 43, 2206–2212. [PubMed] [Google Scholar]
- 47.Dai C, Khaw PT, Yin ZQ, Li D, Raisman G, Li Y. 2012. Structural basis of glaucoma: the fortified astrocytes of the optic nerve head are the target of raised intraocular pressure. Glia 60, 13–28. ( 10.1002/glia.21242) [DOI] [PubMed] [Google Scholar]
- 48.Sun D, Lye-Barthel M, Masland RH, Jakobs TC. 2009. The morphology and spatial arrangement of astrocytes in the optic nerve head of the mouse. J. Comp. Neurol. 516, 1–19. ( 10.1002/cne.22058) [DOI] [PMC free article] [PubMed] [Google Scholar]
- 49.Ling YTT, Pease ME, Jefferys JL, Kimball EC, Quigley HA, Nguyen TD. 2020. Pressure-induced changes in astrocyte GFAP, actin, and nuclear morphology in mouse optic nerve. Investig. Opthalmology Vis. Sci. 61, 14 ( 10.1167/iovs.61.11.14) [DOI] [PMC free article] [PubMed] [Google Scholar]
- 50.Quillen S, Schaub J, Quigley H, Pease M, Korneva A, Kimball E. 2020. Astrocyte responses to experimental glaucoma in mouse optic nerve head. PLoS ONE 15, e0238104 ( 10.1371/journal.pone.0238104) [DOI] [PMC free article] [PubMed] [Google Scholar]
- 51.Sugiyama K, Bin GZ, Kawase C, Yamamoto T, Kitazawa Y. 1999. Optic nerve and peripapillary choroidal microvasculature of the rat eye. Investig. Ophthalmol. Vis. Sci. 40, 3084–3090. [PubMed] [Google Scholar]
- 52.Schwaner SA. 2019. Finite element modeling of optic nerve head biomechanics in a rat model of glaucoma. Georgia Institute of Technology. See https://smartech.gatech.edu/handle/1853/62268.
- 53.Schwaner SA, Feola AJ, Ethier CR. 2020. Factors affecting optic nerve head biomechanics in a rat model of glaucoma. J. R. Soc. Interface 17, 20190695 ( 10.1098/rsif.2019.0695) [DOI] [PMC free article] [PubMed] [Google Scholar]
- 54.Quigley HA, Addicks EM. 1981. Regional differences in the structure of the lamina cribrosa and their relation to glaucomatous optic nerve damage. Arch. Ophthalmol. 99, 137–143. ( 10.1001/archopht.1981.03930010139020) [DOI] [PubMed] [Google Scholar]
- 55.Tehrani S, et al. 2016. Astrocyte structural and molecular response to elevated intraocular pressure occurs rapidly and precedes axonal tubulin rearrangement within the optic nerve head in a rat model. PLoS ONE 11, e0167364 ( 10.1371/journal.pone.0167364) [DOI] [PMC free article] [PubMed] [Google Scholar]
- 56.Sun D, Moore S, Jakobs TC. 2017. Optic nerve astrocyte reactivity protects function in experimental glaucoma and other nerve injuries. J. Exp. Med. 214, 1411–1430. ( 10.1084/jem.20160412) [DOI] [PMC free article] [PubMed] [Google Scholar]
- 57.Johnson EC, Morrison JC, Farrell S, Deppmeier L, Moore CG, McGinty MR. 1996. The effect of chronically elevated intraocular pressure on the rat optic nerve head extracellular matrix. Exp. Eye Res. 62, 663–674. ( 10.1006/exer.1996.0077) [DOI] [PubMed] [Google Scholar]
- 58.Johnson EC, Jia L, Cepurna WO, Doser TA, Morrison JC. 2007. Global changes in optic nerve head gene expression after exposure to elevated intraocular pressure in a rat glaucoma model. Investig. Ophthalmol. Vis. Sci. 48, 3161–3177. ( 10.1167/iovs.06-1282) [DOI] [PMC free article] [PubMed] [Google Scholar]
- 59.Cone-Kimball E, Nguyen C, Oglesby EN, Pease ME, Steinhart MR, Quigley HA. 2013. Scleral structural alterations associated with chronic experimental intraocular pressure elevation in mice. Mol. Vis. 19, 2023–2039. [PMC free article] [PubMed] [Google Scholar]
- 60.Oglesby EN, Tezel G, Cone-Kimball E, Steinhart MR, Jefferys J, Pease ME, Quigley HA. 2016. Scleral fibroblast response to experimental glaucoma in mice. Mol. Vis. 22, 82–99. [PMC free article] [PubMed] [Google Scholar]
- 61.Midgett D, Liu B, Ling YTT, Jefferys JL, Quigley HA, Nguyen TD. 2020. The effects of glaucoma on the pressure-induced strain response of the human lamina cribrosa. Investig. Ophthalmol. Vis. Sci. 61, 41 ( 10.1167/iovs.61.4.41) [DOI] [PMC free article] [PubMed] [Google Scholar]
- 62.Zeimer RC, Ogura Y. 1989. The relation between glaucomatous damage and optic nerve head mechanical compliance. Arch. Ophthalmol. 107, 1232–1234. ( 10.1001/archopht.1989.01070020298042) [DOI] [PubMed] [Google Scholar]
- 63.Quigley H, Arora K, Idrees S, Solano F, Bedrood S, Lee C, Jefferys J, Nguyen TD. 2017. Biomechanical responses of lamina cribrosa to intraocular pressure change assessed by optical coherence tomography in glaucoma eyes. Investig. Ophthalmol. Vis. Sci. 58, 2566–2577. ( 10.1167/iovs.16-21321) [DOI] [PubMed] [Google Scholar]
- 64.Burgoyne CF, Quigley HA, Thompson HW, Vitale S, Varma R. 1995. Early changes in optic disc compliance and surface position in experimental glaucoma. Ophthalmology 102, 1800–1809. ( 10.1016/S0161-6420(95)30791-9) [DOI] [PubMed] [Google Scholar]
- 65.Bellezza AJ, Rintalan CJ, Thompson HW, Downs JC, Hart RT, Burgoyne CF. 2003. Deformation of the lamina cribrosa and anterior scleral canal wall in early experimental glaucoma. Investig. Ophthalmol. Vis. Sci. 44, 623–637. ( 10.1167/iovs.01-1282) [DOI] [PubMed] [Google Scholar]
- 66.Yang H, Ren R, Lockwood H, Williams G, Libertiaux V, Downs C, Gardiner SK, Burgoyne CF. 2015. The connective tissue components of optic nerve head cupping in monkey experimental glaucoma part 1: global change. Investig. Ophthalmol. Vis. Sci. 56, 7661–7678. ( 10.1167/iovs.15-17624) [DOI] [PMC free article] [PubMed] [Google Scholar]
- 67.Girard MJA, Suh J-KF, Bottlang M, Burgoyne CF, Downs JC. 2011. Biomechanical changes in the sclera of monkey eyes exposed to chronic IOP elevations. Invest. Ophthalmol. Vis. Sci. 52, 5656–5669. ( 10.1167/iovs.10-6927) [DOI] [PMC free article] [PubMed] [Google Scholar]
- 68.Ivers KM, Yang H, Gardiner SK, Qin L, Reyes L, Fortune B, Burgoyne CF. 2016. In vivo detection of laminar and peripapillary scleral hypercompliance in early monkey experimental glaucoma. Investig. Ophthalmol. Vis. Sci. 57, OCT388–OCT403. ( 10.1167/iovs.15-18666) [DOI] [PMC free article] [PubMed] [Google Scholar]
Associated Data
This section collects any data citations, data availability statements, or supplementary materials included in this article.
Data Citations
- Bar-Kochba E, Toyjanova J, Andrews E, Kim K-S, Franck C. 2019. A fast iterative digital volume correlation algorithm for large deformations Github Repos. (https://github.com/FranckLab/FIDVC)
Supplementary Materials
Data Availability Statement
Data are provided as electronic supplementary material.


