Abstract
Tuberculosis (TB) remains one of the major health problems in modern times with a high mortality rate. While efforts are being made to make early diagnosis accessible and more reliable in high burden TB countries, digital chest radiography has become a popular source for this purpose. However, the screening process requires expert radiologists which may be a potential barrier in developing countries. A fully automatic computer-aided diagnosis system can reduce the need of trained personnel for early diagnosis of TB using chest X-ray images. In this paper, we have proposed a novel TB detection technique that combines hand-crafted features with deep features (convolutional neural network-based) through Ensemble Learning. Handcrafted features were extracted via Gabor Filter and deep features were extracted via pre-trained deep learning models. Two publicly available datasets namely (i) Montgomery and (ii) Shenzhen were used to evaluate the proposed system. The proposed methodology was validated with a k-fold cross-validation scheme. The area under receiver operating characteristics curves of 0.99 and 0.97 were achieved for Shenzhen and Montgomery datasets respectively which shows the superiority of the proposed scheme.
Keywords: Computer aided diagnosis, Convolutional neural network, Ensemble learning, Tuberculosis
Introduction
Tuberculosis (TB) is a health disorder caused by Mycobacterium tuberculosis. According to World Health Organization (WHO), almost 10 million people were diagnosed with TB in 2018, out of which 1.45 million died (including 0.25 million with HIV) [1]. TB, along with HIV are among the deadliest diseases of the current century. TB spreads through sneezing or coughing of a person having active form of TB. The most prevalent TB regions are Africa and Southeast Asia mainly due to limited resources and relatively high poverty rates. Pakistan, India, Bangladesh and China are among the high burden TB countries [2]. Early diagnosis is very crucial in combatting TB effectively. The death rate due to TB can be reduced significantly through early diagnosis. However, the lack of medical facilities in under-developed countries makes the task of early detection quite difficult.
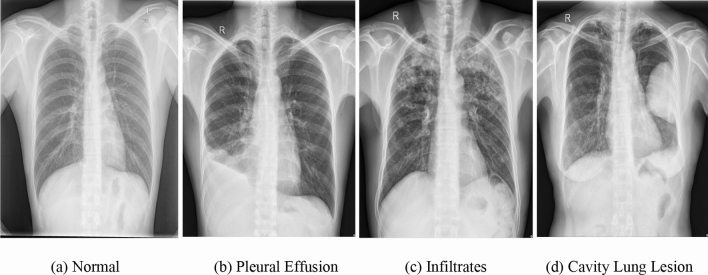
Despite of the fact, that TB’s cure rate through antibiotics is quite high, it has a high mortality rate which reflects that either the TB cases remain undetected or they are detected at an advanced stage. Sputum Smear Microscopy [3] and chest X-ray (CXR) are the most common ways for TB detection. CXR has higher sensitivity than verbal screening for identifying pulmonary TB [3]. However, CXR despite being an effective method for TB detection also has some challenges. TB diagnosis through CXR requires expert personnel for CXR image interpretation. TB causes different manifestations on the lungs. Common TB manifestations include infiltrates, consolidation and cavitation [4]. Figure 1 shows sample CXR images with different TB manifestations.
Fig. 1.
Sample CXR images where (a) shows a normal CXR and (b)–(d) show different manifestations of TB. (a) Normal, (b) pleural effusion, (c) infiltrates, (d) cavity lung lesion
TB affects the shape and texture of lung in a chest radiograph image. The job of a qualified radiologist is to determine the disease within CXR accurately. Unfortunately, there aren’t enough radiologists available especially in high burden TB countries [5]. Computer aided diagnosis (CAD) is a step forward for initial screening of TB. Through CAD, TB can be detected automatically in CXR. It will help in decreasing death rate especially in resource limited areas by reducing the need of qualified radiologist [6].
A typical CAD system for TB detection consists of three stages, namely (i) lung field segmentation, (ii) feature extraction, and (iii) classification. Lung segmentation in CXRs is often carried out as a pre-processing step to extract the region of interest (ROI). These ROIs are normally required for further analysis and can be susceptible to abnormalities. For example, clavicle segmentation can play a key role in the early diagnosis because TB and many other lung diseases most commonly manifest in lung apex [7]. Furthermore, segmentation can help region-based processing, such as contrast enhancement and bone suppression [8].
Once the segmentation is done, the next step is to extract the visual features that effectively represent these ROIs. Several texture features [e.g., wavelets, local binary pattern (LBP)], shape features (e.g., ellipticity, circularity), and a combination of both are employed to characterize these lung regions [9–11]. Further, various classifiers such as Support Vector Machine (SVM), Neural Network (NN), Random Forest (RF) and Bayesian network (BN) are explored in Refs. [10, 12] to classify CXR as normal or abnormal.
Since the emergence of deep learning (DL) algorithms and their promising results for various medical applications, significant progress has been made in developing DL systems [13–21] to detect pulmonary TB and other lung abnormalities. Among all DL algorithms, deep convolutional neural network (DCNN), a type of supervised machine learning algorithm, has emerged as an attractive technique for TB surveillance and detection [19]. DCNN consists of multiple convolution layers, pooling layers and fully-connected layers. Each layer is connected to the previous layer via kernels that have a predefined, fixed-size receptive field. The weights are shared within each layer to reduce the complexity and computation. Convolutional neural network (CNN) model often employs a large dataset to learn the parameters and extracts the global and local features that are more discriminative in the image. In contrast to handcrafted features, CNN model does not require domain-specific knowledge and has strong feature representation ability. AlexNet was the first CNN model used in Ref. [21] for CXR TB classification. In addition, features extracted through pre-trained CNN can be fine-tuned to fit on a different dataset, referred to as transfer learning. Transferring the learned parameters from a larger dataset is quite effective in comparison to training the CNN from scratch, especially with limited datasets [22]. To this end, we briefly review the related work in the following, highlighting the challenges which have motivated our work in this paper.
Han et al. [23] proposed an automatic recognition system for cavity imaging sign in lung computed tomography (CT). Fusion of hand-crafted and deep features was made and hybrid resampling was used. Multi-feature fusion worked better than any single feature class and achieved high sensitivity as compared to the rest. Ma et al. [24] proposed a multi-level similarity technique for the retrieval of common lung disease signs in lung CT scans. The similarity measurement was characterized into low, mid and high levels of scale. The final similarity score was obtained from the weighted sum of each level.
Wang et al. [25] proposed thoracic diseases’ classification scheme based on regularized deep neural network. The proposed network was named as Thorax-Net which composed of an attention and a classification branch. The output diagnosis was obtained through Thorax-Net by means of an average of the two branches. Thorax-Net achieved higher area under curve (AUC) values as compared to other deep learning models. Based on the observation that TB infected CXRs reveals deformed thoracic edge maps, Santosh et al. [26] proposed a TB screening system based on deformed thoracic edge maps. They implemented five ROI localization methods to find the best performing model.
Govindarajan et al. [27] proposed a TB classification scheme using ‘Speeded Up Robust Feature’ (SURF) descriptor and ‘Bag of Features’ approach. Distance regularized level set was used to segment the lung field and Multilayer perceptron was used to classify normal and TB infected images. Vajda et al. [10] proposed optimal feature selection from a wide variety of lung region features. Lung segmentation was performed to keep the focus of feature extraction on lung region. Three different subsets were made from initial pool of features. Each feature set consisted of different types of features like shape, edge, intensity, sharpness and gradient. The feature set consisting of shape, texture and edge descriptors performed best at classifying TB infected or normal CXR images.
Lopes et al. [28] proposed transfer learning approach in which pre-trained model weights were used with some fine tuning at final layers. CNN architectures deployed in the proposed scheme were GoogleNet [29], ResNet [30] and VggNet [31]. The study conducted three different experiments. In 1st experiment, input images were fed directly to the neural network by downsizing the image to fit respective CNNs. Image downsizing may result in loss of some important information, so input images were divided into smaller parts referred as bags of features in 2nd experiment. In 3rd experiment, the output of all three CNN architectures were combined through Ensemble Learning. Deep CNN has high computational cost which makes them difficult to be deployed in mobile devices. Pasa et al. [32] proposed an efficient CNN model having five convolutional layers followed by average pooling layers and a softmax layer. The size, complexity and computational cost was reduced while preserving the accuracy of the model.
Generally, deep learning models are tested on the same dataset on which the model is being trained, so there is every possibility that the model may become biased for a specific dataset. To address this problem, Das et al. [33] proposed a cross-population train/test model to measure the performance of a deep learning classifier. In cross-population train/test, the model’s training and test datasets have different sources.
In a nutshell, several efforts have been made to make a fully automatic TB CAD system. Earlier, research was limited to hand-crafted features but recently the focus has shifted towards deep learnig models. However, low accuracy of the reported systems is still an unresolved issue. The primary reason of the low accuracy of reported ssytems is the diverse TB’s manifestations on a chest radiograph image. All these different types of manifestations impose a challenge on CAD based systems. To cope with these different types of manifestations, a robust system is needed that can truly identify and differentiate between TB and non-TB manifestations.
In this paper, we have proposed a fully automatic CAD system for the effective detection of TB. We have used different pre-trained CNN architectures and supervised learning to predict TB in CXR images. Performance comparison of deployed CNN architectures has been made. Next, we have experimented with the Gabor filter and evaluated its performance on TB detection. Finally, we have used Ensemble Learning to combine the individual classifier outputs and their results have been reported. Our proposed method achieves better result as compared to present schemes. Further, the proposed methodology works without lung segmentation and requires minimum pre-processing. The main contributions of this work are summarized below:
A fully automatic computer aided TB detection scheme using CXR images is proposed which can be deployed for initial screening purposes.
A performance analysis has been made of notable pre-trained CNN architectures for an effective detection.
A fusion of hand-crafted features with deep features is made and Ensemble Learning is deployed to improve the detection performance.
A detailed comparison has been made with state of the art techniques for TB detection.
The rest of the paper is structured as follows: the following section presents the methodology opted in the proposed method. Experimental results are presented in “Results” section followed by “Discussion”. Finally, the paper is summarized and concluded with future directions in “Conclusion” section.
Methodology
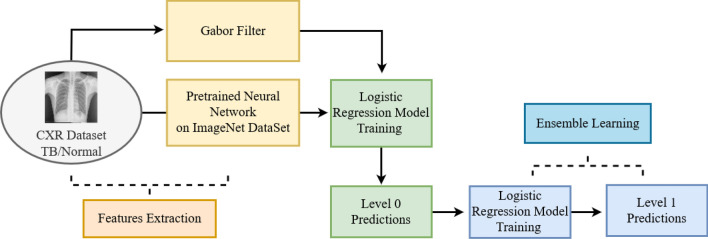
The proposed methodology consists of a series of steps including preprocessing, feature extraction and classification using supervised learning. We have conducted three separate studies to implement our methodology. In 1st study, we evaluated the performance of different CNN architectures as feature extractor. In 2nd study, we used Gabor filter as a feature extractor. In 3rd study, individual outputs from the preceding two studies were combined to obtain a single output through Ensemble Learning. The detail of each step is presented in the following section.
Pre-processing
Each CNN architecture has a specific input image size. To meet input requirements of each CNN, images from TB dataset were normalized. Table 1 presents the required input image size for different CNN architectures. In Montgomery dataset, the image size is 4892 × 4020 pixels while the average image size for Shenzhen dataset is 3000 × 3000 pixels. To meet the requirement of each CNN, resizing of input images were done to fit the individual size of each CNN’s architecture. The Gabor filter used in our 2nd study is computationally expensive to implement. To reduce the computation time, input images were down-sampled to 300 × 300 pixels for Gabor filter based feature extraction.
Table 1.
Input image sizes of different CNN architectures
Feature extraction
Feature extraction through CNN
In 1st study, we used different pre-trained CNN architectures as feature extractor for TB classification. A total of seven CNN architectures were used to extract different features from each input image. All CNN models were pre-trained with ImageNet [38] dataset. The feature vector was extracted just before final classification layer for each CNN architecture. The extracted feature vector was then used to train a logistic regression based model and a separate set of predictions were made for each CNN architecture. Table 1 shows the CNN used in our study and their respective input image sizes.
Feature extraction through Gabor filter
In 2nd study, we used Gabor filter as a feature extractor. Gabor filter is widely deployed for image texture analysis as it detects different frequency elements within an image. Two-dimensional Gabor filter [39] can be defined as
| 1 |
where
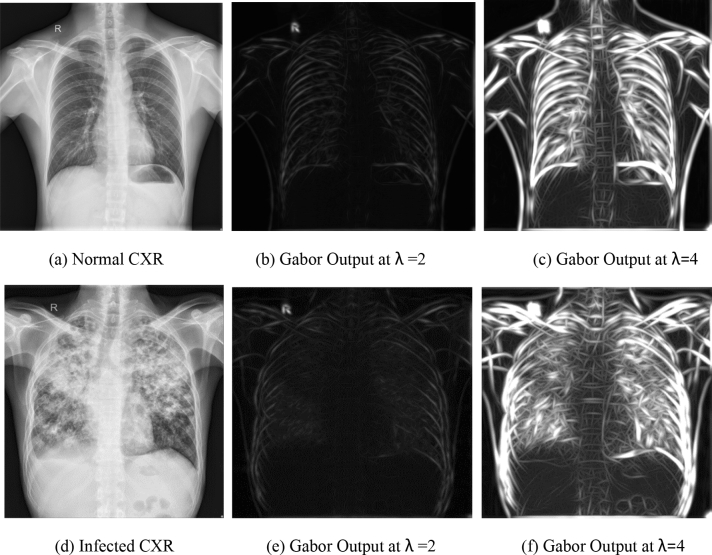
where mx and my represents the center of respective field in image coordinates and σx, σy represent the standard deviation of respective field. λ represents the wavelength of sinusoid. γ represents the orientation and Ψ represents the phase offset. For certain abnormalities like infiltrates, TB infected CXR images contain more frequency elements than a normal CXR image. So, Gabor filter was applied to the input image with two different values of wavelength (λ), i.e. λ = 2 and λ = 4 with orientation varying from 0 to 360.
For Gabor filter, input image was down-sampled to 300 × 300 pixels. The result is two different images showing the presence of certain frequency elements in the input image. For each input CXR image, there are different levels of abnormalities. In certain images, the abnormalities are clear enough to be detected at low value of wavelength while for some other images, larger value of wavelength works better. Figure 2 shows Gabor filter output for normal and infected input CXR images. Figure 2b, e shows Gabor filter output image at λ = 2 while Fig. 2c, f shows Gabor filter output image at λ = 4.
Fig. 2.
Gabor filter ouput on sample CXR images. (a) Normal CXR, (b) Gabor output at λ = 2, (c) Gabor output at λ = 4, (d) infected CXR, (e) Gabor output at λ = 2, (f) Gabor output at λ = 4
Classification
Features extracted through each CNN architecture and Gabor filter were then used to train Logistic Regression classifier. The performance of each feature extractor is evaluated based on the individual classifier output. The block diagram of our proposed method is shown in Fig. 3. All seven CNN architectures and two Gabor filter configurations yielded a total of nine independent predictions that we referred in the block diagram as ‘level 0’ predictions. For each feature set, outputs were obtained in terms of probabilities. In 3rd study, the individual outputs were combined to obtain a single output with better accuracy through Ensemble Learning. Logistic regression was used as an ensemble learning classifier. The classifier was trained for all nine ‘levels 0’ predictions and final output is referred as ‘level 1’ predictions.
Fig. 3.
Block diagram of the proposed method
The proposed methodology was evaluated on both Montgomery and Shenzhen datasets. The details of these datasets are presented in next section. The training time of logistic regression model for an individual feature set depends on the number of parameters within each feature set, varying from a few seconds to a few minutes for a midrange personal computer (PC).
Results
The proposed system is evaluated on publicly available two datasets namely (i) Montgomery and (ii) Shenzhen [40]. These datasets are provided by the U.S. National Library of Medicine (NLM), National Institutes of Health (NIH). Montgomery dataset contains 138 marked images, in which there are 80 normal CXR images and 58 images have TB manifestations. Whereas, Shenzhen dataset has a total of 662 CXR images consisting of 326 normal and 336 TB infected images. Clinical readings are provided for each image in the datasets which include patient’s sex, age and the TB diagnostic report, i.e., TB infected or normal. In addition, lung region masks are provided for both left and right lungs for Montgomery dataset. The datasets are available online to download in “PNG” and “DICOM” format on request. A diagnostic report for each image given in the dataset is taken as a reference standard to validate each image’s output. For Montgomery dataset, the results were validated using 6-fold cross-validation scheme and for Shenzhen dataset, results were validated with 10-fold cross-validation scheme. The performance of the proposed system was measured using standard performance metrics namely Accuracy and Area under the receiver operating characteristic (ROC) curve (AUC). Through ROC, the results can be visualized under various levels of a threshold. The accuracy of the system, true positive rate (TPR) and false positive rate (FPR) can be defined as:
| 2 |
| 3 |
| 4 |
where TP, TN, FP, and FN denote true positive, negative and false positive and negative labels respectively. In 1st study, we evaluated the performance of pre-trained CNN architectures on both datasets. With CNN trained on a larger dataset, a wide range of features from training set are expected to be covered. However, downsizing the input image imposes a bad effect on performance of the system as some important features may get excluded during down-sampling. On the other hand, computational cost of the system would increase enormously by keeping the size unchanged.
In 1st study, a total of seven CNN architectures were evaluated as feature extractors for TB detection. It is noteworthy that the selected architectures have different number of parameters. In addition, the value of a feature extracted from a specific CNN may vary with respect to other architecture. Hence, the performance of each CNN as feature extractor is not uniform. Among individual CNN feature extractors, ‘Inception v3’ achieved relatively high accuracy of 86.23% and MobileNet achieved AUC of 0.93 for Montgomery dataset. ResNet50 and Xception architectures achieved minimum performance among all seven architectures for Shenzhen dataset. Same pattern is observed for Montgomery dataset with ResNet50 and Xception achieving minimum performance while Xception having a little edge over ResNet50 architecture. In contrast to Montgomery dataset, the best performing classifier for Shenzhen dataset is Vgg16 instead of Inceptionv3 with 87.60% accuracy. In terms of AUC, MobileNet achieved maximum performance for Shenzhen dataset as well. Based on the results, it can be seen that MobileNet outperforms other CNN architectures deployed in the study. In summary, some CNN architectures performed better than the other architectures for individual datasets, however, there is no certain trend of increased accuracy with the increase in number of parameters within a feature set.
In 2nd study, we evaluated the performance of Gabor filter based features. It is observed that TB affected CXR images exhibit deformed pattern as compared to normal CXR images. To find out, how well Gabor filter can detect these deformed patterns, we used Gabor filter as a feature extractor. We also experimented with two different values of wavelength to check the effectiveness of change in value on detection. The extracted feature set was used to train the Logistic Regression classifier. For Montgomery dataset, we achieved an accuracy of 83.33% and AUC of 0.89 at λ = 2. While for λ = 4, an accuracy of 86.96% and AUC of 0.93 was achieved. For Shenzhen dataset, an accuracy of 80.67% and AUC of 0.85 were achieved with λ = 2, while for λ = 4, we achieved an accuracy of 79.46% and AUC of 0.86. In comparison to the 1st study, relatively low accuracy was achieved in the 2nd study, which reflects that Gabor filter cannot cover all manifestations of TB. Using Gabor filter, we can analyze change in the texture of an image. However, some abnormalities like lung nodule may or may not be quite obvious to get detected by this filter. For Montgomery dataset, with an increase in Gabor filter’s wavelength, accuracy of the system increased, however for Shenzhen, the change is not quite significant.
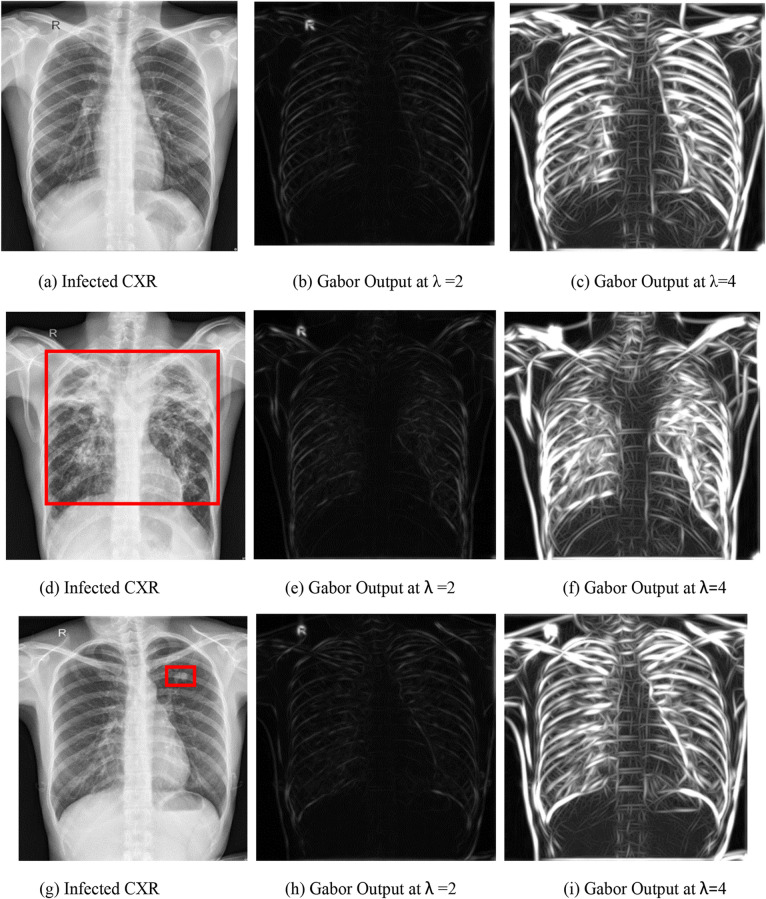
Figure 4 shows sample TB infected CXR and their Gabor filter output images. Figure 4a, g show the presence of lung nodule in CXR while Fig. 4d shows the presence of infiltrates. It can be seen that Gabor output for respective input CXR does not visibly change in the presence of minor abnormality i.e. lung nodule. It is evident from Fig. 4c, i that minor manifestations while using Gabor filter may be missed out. However, for infiltrates, Gabor output produced a sharp change in image texture. In summary, the performance of Gabor filter as a feature extractor is not consistent to infer a certain trend.
Fig. 4.
Gabor output for TB infected CXR images. (a) Infected CXR, (b) Gabor output at λ = 2, (c) Gabor output at λ = 4, (d) infected CXR, (e) Gabor output at λ = 2, (f) Gabor output at λ = 4, (g) Infected CXR, (h) Gabor output at λ = 2, and (i) Gabor output at λ = 4
Ensemble Learning can be defined as a process in which several classifiers are created and combined to improve the overall classification performance. In Ensemble learning, the output of each classifier for each input image is used to train a new classifier to achieve better accuracy. Ensemble classifier tends to increase the accuracy by reducing the variance in predictions. For TB detection, due to large number of manifestations, it is not suggested to depend on a single feature set.
It is observed that diverse features usually result in increased classification performance. In 3rd study, we evaluated the ensemble based combination of features for TB detection. In contrast to our previous two studies, the Ensemble Learning based 3rd study achieved better results. The best working classifier is the ensemble of all nine individual models. For Montgomery dataset, the maximum accuracy achieved is 93.47%, and AUC is 0.97 and for Shenzhen dataset, the maximum accuracy achieved is 90.6% and AUC is 0.94. The detailed results for each study using Montgomery and Shenzhen datasets are presented in Tables 2 and 3 respectively. Bold values indicate best achieved result among all mentioned results in that table for specific dataset.
Table 2.
Classification results for Montgomery dataset
| Ensemble | Inception v3 | InceptionResnetv2 | Vgg16 | Vgg19 | MobileNet | ResNet50 | Xception | Gabor (λ = 2) | Gabor (λ = 4) | |
|---|---|---|---|---|---|---|---|---|---|---|
| Accuracy (%) | 93.47 | 86.23 | 82.60 | 81.88 | 82.60 | 83.33 | 73.91 | 75.36 | 83.33 | 86.96 |
| AUC | 0.97 | 0.90 | 0.90 | 0.89 | 0.92 | 0.93 | 0.79 | 0.84 | 0.89 | 0.93 |
Table 3.
Classification results for Shenzhen dataset using Logistic Regression as level 0 classifier
| Ensemble | Inception v3 | InceptionResnetv2 | Vgg16 | Vgg19 | MobileNet | ResNet50 | Xception | Gabor (λ = 2) | Gabor (λ = 4) | |
|---|---|---|---|---|---|---|---|---|---|---|
| Accuracy (%) | 90.60 | 87.31 | 86.24 | 87.60 | 83.99 | 87.30 | 80.67 | 83.36 | 80.67 | 79.46 |
| AUC | 0.94 | 0.93 | 0.93 | 0.93 | 0.90 | 0.94 | 0.86 | 0.91 | 0.85 | 0.86 |
Discussion
From Table 3, it is evident that our best performing method on Montgomery dataset i.e. ensemble observes a slight dip in its performance when evaluated on a relatively larger Shenzhen dataset. Though, this dip in the performance is mainly due to the diversity of the dataset. However, we further experimented with a slight change in our architecture to address this issue. For Shenzhen dataset, we replaced the logistic regression-based classifier with CNN based classifier for ‘level 0’ predictions while ‘level 1’ predictor classifier was unchanged. CNN architecture used for ‘level 0’ predictions consisted of two fully connected layers. To avoid overfitting, ReLu activation was used with dropout. We evaluated this system again on Shenzhen dataset and have presented the results in Table 4 which clearly shows quite significant improvement in the results. The ROC curves and performance comparison for Shenzhen dataset presented in the following section is based on this revised model. From these results, it can be concluded that Logistic Regression classifier works better for smaller dataset while CNN classifier works better for relatively larger datasets. ROCs curves have been drawn to visualize the individual classifier’s performance. Figure 5 shows the ROCs curves of different classifiers for Montgomery dataset. It can be seen that MobileNet outperforms the other classifiers in terms of AUC while ResNet50 shows the lowest performance for both datasets. Figure 6 shows the ROC curves of different individual classifiers for Shenzhen dataset. It can also be seen from Tables 2, 3 and 4 that Ensemble of Gabor filter and CNN based features produced better results as compared to individual classifiers.
Table 4.
Classification results for Shenzhen dataset using CNN as level 0 classifier
| Ensemble | Inception v3 | InceptionResnetv2 | Vgg16 | Vgg19 | MobileNet | ResNet50 | Xception | Gabor (λ = 2) | Gabor (λ = 4) | |
|---|---|---|---|---|---|---|---|---|---|---|
| Accuracy (%) | 97.59 | 89.88 | 89.12 | 83.98 | 83.37 | 91.85 | 79.44 | 86.56 | 85.04 | 85.03 |
| AUC | 0.99 | 0.92 | 0.92 | 0.86 | 0.86 | 0.94 | 0.81 | 0.89 | 0.87 | 0.87 |
Fig. 5.
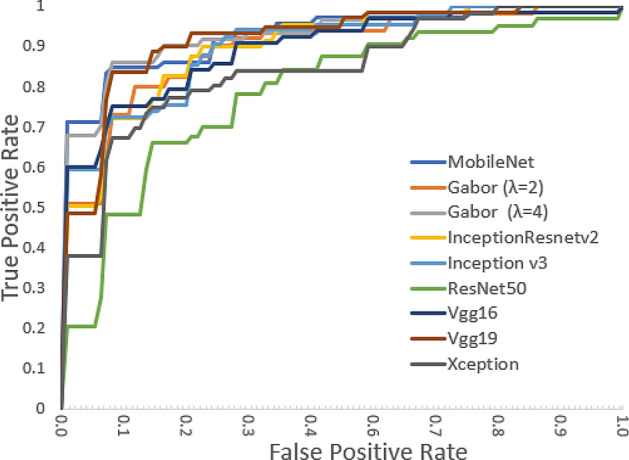
ROC curves of different classifiers for Montgomery dataset
Fig. 6.
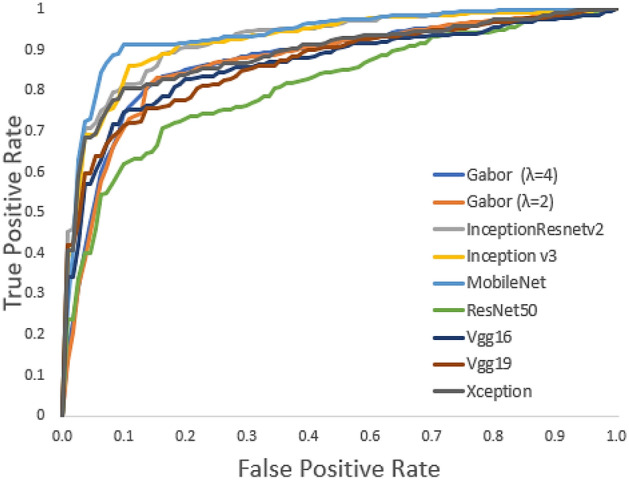
ROC curves of different classifiers for Shenzhen dataset
As TB-infected CXR contains different kind of manifestations, a wide range of features are better suited to detect different TB manifestations. Therefore, we used Ensemble to combine the individual classifiers to form a more robust and accurate classifier. Transfer learning efficiently transfers the knowledge learned from a larger dataset. Our proposed methodology shows significant improvement in standard performance metrics on both datasets in comparison to the present approaches which reflects the superiority of our scheme. The Ensemble combined various features to take all manifestations into account for accurate TB detection. Gabor Filter based hand-crafted features produce better results when combined with deep CNN features which also reflects the importance of appropriate feature selection for accurate detection. Importance of hand-crafted features can also be verified from the fact that all CNN architectures have not produced the uniform results. A performance comparison based on the standard performance metrics with the pertinent schemes reported in literature is presented in Table 5. It can be seen that our proposed scheme outperforms other techniques which shows the superiority of our proposed scheme. The ROC curves of best performing method, ‘Ensemble Learning’ for Shenzhen and Montgomery datasets have been drawn in Fig. 7 which reflects the performance of proposed scheme.
Table 5.
Performance comparison of different CAD systems
| CAD System | Year | Dataset | Extracted features | Classifier | Accuracy (%) | AUC |
|---|---|---|---|---|---|---|
| Santosh et al. [26] | 2016 |
Montgomery dataset (MC), Shenzhen dataset (SZ) |
Thoracic edge map encoding | Neural network |
79.23 (MC) 86.36 (SZ) |
0.88 (MC) 0.93 (SZ) |
| Lopes et al. [28] | 2017 |
MC dataset, SZ dataset |
CNN (GoogleNet, ResNet and VggNet ) transfer learning | SVM |
82.6 (MC) 84.7 (SZ) |
0.926 (MC) 0.926 (SZ) |
| Santosh et al. [12] | 2018 |
MC dataset, SZ dataset, Indian (IN) dataset |
Texture, Shape, Edge, Symmetry |
Bayesian network, Neural network, Random forest (RF) |
83 (MC) 86 (IN) 91 (SZ) |
0.90 (MC) 0.94 (IN) 0.96 (SZ) |
| Vajda et al. [10] | 2018 |
MC dataset, SZ dataset |
Set A: IH, GM, SD, CD, HOG, LBP Set B: Color, intensity, edge, shape, texture Set C: Eccentricity, centroid, bounding box, orientation, extent, size |
Neural network |
78.3 (MC) 95.57 (SZ) |
0.87 (MC) 0.99 (SZ) |
| Rajaraman et al. [41] | 2018 |
SZ MC Kenya (K) India (I) |
Ensemble (pretrained CNNs, HOG, GIST, SURF) | SVM, logistic regression |
0.934 (SZ) 0.875 (MC) 0.776 (K) 0.960 (I) |
0.991 (SZ) 0.962 (MC) 0.826 (K) 0.965 (I) |
| Pasa et al. [32] | 2019 |
MC dataset, SZ dataset, Combined (MC and SZ) dataset, Belarus dataset |
Custom CNN |
79 (MC) 84.4 (SZ) 86.2 (combined) |
0.811 (MC) 0.90 (SZ) 0.925 (combined) |
|
| Govindarajan et al. [27] | 2019 | MC dataset |
Bag of features (BoF) approach with speeded-up Robust feature (SURF) descriptor |
Multilayer perceptron | 87.8 | 0.94 |
| Kyung et al. [42] | 2020 |
Chest X-ray 14 dataset (for training/validation), MC dataset (for testing), SZ dataset (for Testing), Johns Hopkins Hospital dataset (JHH) (for testing) |
ResNet-50 (transfer learning) | CNN |
0.91 (SZ) 0.87 (JHH) |
|
| Sahlol et al. [43] | 2020 |
SZ dataset dataset 2 |
MobileNet, Feature selection by AEO |
CNN |
90.2 (SZ) 94.1 (dataset 2) |
|
| Proposed method | 2020 |
MC dataset, SZ dataset |
Ensemble (pre trained CNN, Gabor filter) | Logistic regression, CNN |
93.47 (MC) 97.59 (SZ) |
0.97 (MC) 0.99 (SZ) |
Abbreviations: Intensity Histogram (IH), Gradient Magnitude Histogram (GM), Shape Descriptor Histogram (SD), Curvature Descriptor Histogram (CD), Histogram of Oriented Gradient (HOG), Local Binary Pattern (LBP), First order statistical feature (FOSF), Gray level co-occurrence matrix (GLCM) features, Artiicial Ecosystem-based Optimization (AEO)
Fig. 7.
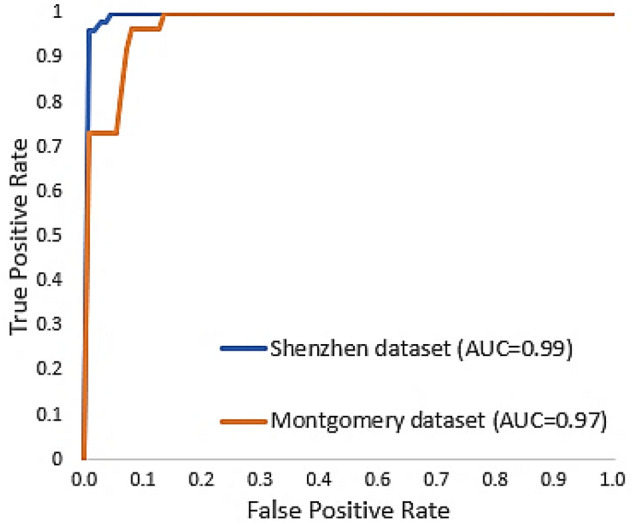
ROC curves of ensemble learning
Conclusion
TB reflects different kinds of manifestation on a CXR. A hybrid technique that take into account all TB manifestations needs to be adopted for achieving high accuracy. In this paper, we have proposed an improved methodology for TB detection through chest CXR images by combining hand-crafted features with deep CNN features. The proposed methodology achieved significant improvement in results. The Ensemble worked better than individual classifiers. Experimental results showed that the proposed methodology can be successfully deployed as a mass screening tool for CXR based TB diagnosis.
Future work
Medical datasets are often limited and lacks the inclusion of all manifestations which is one of the main bottlenecks to deploy the computer aided systems in real time scenarios. The proposed work can be extended by evaluating on a larger datasets and by using data augmentation for better accuracy and robustness. In addition, some other hand-crafted features can also be added to form an optimal feature set which will improve the detection performance. To avoid the biasness of classifier, a cross population strategy can also be adopted. In this scheme, a classifier will be trained on one dataset and will be tested on a different dataset. The proposed methodology can also be extended to detect COVID-19 using COVID CXR dataset.
Funding
Partial financial support was received by First Author from University of Engineering & Technology Taxila, Pakistan in form of Scholarship and Tuition Fee waiver during this research.
Compliance with ethical standards
Conflict of interest
The authors declare that they have no conflict of interest.
Ethical approval
All procedures performed in studies involving human participants were in accordance with the ethical standards of the institutional and/or national research committee and with the 1964 Helsinki declaration and its later amendments or comparable ethical standards.
Footnotes
Publisher’s Note
Springer Nature remains neutral with regard to jurisdictional claims in published maps and institutional affiliations.
References
- 1.World Health Organization (2019) WHO TB Report. https://apps.who.int/iris/bitstream/handle/10665/329368/9789241565714-eng.pdf. Accessed 7 Oct 2020
- 2.World Health Organization (2019) Country profiles for 30 high TB burden countries. https://www.who.int/tb/publications/global_report/tb19_Report_country_profiles_15October2019.pdf. Accessed 7 Oct 2020
- 3.Parsons LM, Somoskövi Á, Gutierrez C, Lee E, Paramasivan CN, Abimiku A, Spector S, Roscigno G, Nkengasong J. Laboratory diagnosis of tuberculosis in resource-poor countries: challenges and opportunities. Clin Microbiol Rev. 2011;24:314–350. doi: 10.1128/CMR.00059-10. [DOI] [PMC free article] [PubMed] [Google Scholar]
- 4.Roy M, Ellis S. Radiological diagnosis and follow-up of pulmonary tuberculosis. Postgrad Med J. 2010;86:663–674. doi: 10.1136/pgmj.2009.084418. [DOI] [PubMed] [Google Scholar]
- 5.Van’t Hoog AH, Meme HK, Van Deutekom H, Mithika AM, Olunga C, Onyino F, Borgdorff MW. High sensitivity of chest radiograph reading by clinical officers in a tuberculosis prevalence survey. Int J Tuberc Lung Dis. 2011;15:1308–1314. doi: 10.5588/ijtld.11.0004. [DOI] [PubMed] [Google Scholar]
- 6.Hooda R, Mittal A, Sofat S. Tuberculosis detection from chest radiographs: a comprehensive survey on computer-aided diagnosis techniques. Curr Med Imaging Rev. 2017;14:506–520. doi: 10.2174/1573405613666171115154119. [DOI] [Google Scholar]
- 7.Van Ginneken B, Katsuragawa S, Ter Haar Romeny BM, Doi K, Viergever MA. Automatic detection of abnormalities in chest radiographs using local texture analysis. IEEE Trans Med Imaging. 2002;21:139–149. doi: 10.1109/42.993132. [DOI] [PubMed] [Google Scholar]
- 8.Chen S, Suzuki K. Bone suppression in chest radiographs by means of anatomically specific multiple massive-training ANNs combined with total variation minimization smoothing and consistency processing. Comput Intell Biomed Imaging. 2014;9781461472:211–235. doi: 10.1007/978-1-4614-7245-2_9. [DOI] [PubMed] [Google Scholar]
- 9.Karargyris A, Siegelman J, Tzortzis D, Jaeger S, Candemir S, Xue Z, Santosh KC, Vajda S, Antani S, Folio L, Thoma GR. Combination of texture and shape features to detect pulmonary abnormalities in digital chest X-rays. Int J Comput Assist Radiol Surg. 2016;11:99–106. doi: 10.1007/s11548-015-1242-x. [DOI] [PubMed] [Google Scholar]
- 10.Vajda S, Karargyris A, Jaeger S, Santosh KC, Candemir S, Xue Z, Antani S, Thoma G. Feature selection for automatic tuberculosis screening in frontal chest radiographs. J Med Syst. 2018;42:146. doi: 10.1007/s10916-018-0991-9. [DOI] [PubMed] [Google Scholar]
- 11.Qin C, Yao D, Shi Y, Song Z. Computer-aided detection in chest radiography based on artificial intelligence: A survey. Biomed Eng Online. 2018;17:1–23. doi: 10.1186/s12938-018-0544-y. [DOI] [PMC free article] [PubMed] [Google Scholar]
- 12.Santosh KC, Antani S. Automated chest x-ray screening: can lung region symmetry help detect pulmonary abnormalities? IEEE Trans Med Imaging. 2018;37:1168–1177. doi: 10.1109/TMI.2017.2775636. [DOI] [PubMed] [Google Scholar]
- 13.Becker AS, Blüthgen C, Van Phi VD, Sekaggya-Wiltshire C, Castelnuovo B, Kambugu A, Fehr J, Frauenfelder T. Detection of tuberculosis patterns in digital photographs of chest X-ray images using deep learning: feasibility study. Int J Tuberc Lung Dis. 2018;22:328–335. doi: 10.5588/ijtld.17.0520. [DOI] [PubMed] [Google Scholar]
- 14.Lakhani P, Sundaram B. Deep learning at chest radiography: automated classification of pulmonary tuberculosis by using convolutional neural networks. Radiology. 2017;284:574–582. doi: 10.1148/radiol.2017162326. [DOI] [PubMed] [Google Scholar]
- 15.Cao Y, Liu C, Liu B, Brunette MJ, Zhang N, Sun T, Zhang P, Peinado J, Garavito ES, Garcia LL, Curioso WH (2016) Improving tuberculosis diagnostics using deep learning and mobile health technologies among resource-poor and marginalized communities. Proceedings of the 2016 IEEE 1st international conference on Connected Health: Applications, Systems and Engineering Technologies (CHASE 2016), pp 274–281. 10.1109/CHASE.2016.18
- 16.Singh R, Kalra MK, Nitiwarangkul C, Patti JA, Homayounieh F, Padole A, Rao P, Putha P, Muse VV, Sharma A, Digumarthy SR. Deep learning in chest radiography: detection of findings and presence of change. PLoS One. 2018;13:1–12. doi: 10.1371/journal.pone.0204155. [DOI] [PMC free article] [PubMed] [Google Scholar]
- 17.Yadav O, Passi K, Jain CK (2019) Using deep learning to classify x-ray images of potential tuberculosis patients. Proceedings of the 2018 IEEE international conference on Biomedical and Bioinformatics (BIBM 2018), pp 2368–2375. 10.1109/BIBM.2018.8621525
- 18.Liu C, Cao Y, Alcantara M, Liu B, Brunette M, Peinado J, Curioso W (2017) TX-CNN: detecting tuberculosis in chest X-ray images using convolutional neural network. In: 2017 IEEE international conference on image processing (ICIP) (pp. 2314–2318). IEEE
- 19.Karnkawinpong T, Limpiyakorn Y (2018) Chest X-ray analysis of tuberculosis by convolutional neural networks with affine transforms. ACM international conference proceedings series, pp 90–93. 10.1145/3297156.3297251
- 20.Sathitratanacheewin S, Pongpirul K (2018) Deep learning for automated classification of tuberculosis-related chest x-ray: dataset specificity limits diagnostic performance generalizability. arXiv preprint arXiv:1811.07985 [DOI] [PMC free article] [PubMed]
- 21.Hwang S, Kim H-E, Jeong J, Kim H-J (2016) A novel approach for tuberculosis screening based on deep convolutional neural networks. In: Tourassi GD, Armato SG (eds) Medical imaging 2016: computer-aided diagnosis. SPIE, p 97852W
- 22.Pan SJ, Yang Q. A survey on transfer learning. IEEE Trans Knowl Data Eng. 2010;22:1345–1359. doi: 10.1109/TKDE.2009.191. [DOI] [Google Scholar]
- 23.Han G, Liu X, Zhang H, Zheng G, Soomro NQ, Wang M, Liu W. Hybrid resampling and multi-feature fusion for automatic recognition of cavity imaging sign in lung CT. Futur Gener Comput Syst. 2019;99:558–570. doi: 10.1016/j.future.2019.05.009. [DOI] [Google Scholar]
- 24.Ma L, Liu X, Fei B. A multi-level similarity measure for the retrieval of the common CT imaging signs of lung diseases. Med Biol Eng Comput. 2020;58:1015–1029. doi: 10.1007/s11517-020-02146-4. [DOI] [PMC free article] [PubMed] [Google Scholar]
- 25.Wang H, Jia H, Lu L, Xia Y. Thorax-net: an attention regularized deep neural network for classification of thoracic diseases on chest radiography. IEEE J Biomed Health Inf. 2020;24:475–485. doi: 10.1109/JBHI.2019.2928369. [DOI] [PubMed] [Google Scholar]
- 26.Santosh KC, Vajda S, Antani S, Thoma GR. Edge map analysis in chest X-rays for automatic pulmonary abnormality screening. Int J Comput Assist Radiol Surg. 2016;11:1637–1646. doi: 10.1007/s11548-016-1359-6. [DOI] [PubMed] [Google Scholar]
- 27.Govindarajan S, Swaminathan R. Analysis of tuberculosis in chest radiographs for computerized diagnosis using bag of keypoint features. J Med Syst. 2019;43:11–13. doi: 10.1007/s10916-019-1222-8. [DOI] [PubMed] [Google Scholar]
- 28.Lopes UK, Valiati JF. Pre-trained convolutional neural networks as feature extractors for tuberculosis detection. Comput Biol Med. 2017;89:135–143. doi: 10.1016/j.compbiomed.2017.08.001. [DOI] [PubMed] [Google Scholar]
- 29.Szegedy C, Liu W, Jia Y, Sermanet P, Reed S, Anguelov D, Erhan D, Vanhoucke V, Rabinovich A (2015) Going deeper with convolutions. IEEE conference on Computer Vision and Pattern Recognition (CVPR)
- 30.He K, Zhang X, Ren S, Sun J (2016) Deep residual learning for image recognition. Proceedings of the IEEE computer society con-ference on Computer Vision and Pattern Recognition, December 2016, pp 770–778. 10.1109/CVPR.2016.90
- 31.Simonyan K, Andrew Z (2015) Very deep convolutional networks for large-scale image recognition. 3rd international conference on Learning Representations, ICLR 2015—Conference Track Proceedings, pp 1–14
- 32.Pasa F, Golkov V, Pfeiffer F, Cremers D, Pfeiffer D. Efficient deep network architectures for fast chest x-ray tuberculosis screening and visualization. Sci Rep. 2019;9:2–10. doi: 10.1038/s41598-019-42557-4. [DOI] [PMC free article] [PubMed] [Google Scholar]
- 33.Das D, Santosh KC, Pal U (2020) Cross-population train/test deep learning model: abnormality screening in chest x-rays. Proceedings—IEEE Symposium on Computer-Based Medical Systems, July 2020, pp 514–519. 10.1109/CBMS49503.2020.00103
- 34.Szegedy C, Vanhoucke V, Ioffe S, Shlens J, Wojna Z (2016) Rethinking the inception architecture for computer vision. Proceedings of the IEEE computer society conference on Computer Vision and Pattern Recognition, Decemember 2016, pp 2818–2826. 10.1109/CVPR.2016.308
- 35.Szegedy C, Ioffe S, Vanhoucke V, Alemi AA (2017) Inception-v4, inception-ResNet and the impact of residual connections on learning. 31st AAAI Conference on Artificial Intelligence. AAAI 2017 4278–4284
- 36.Howard AG, Zhu M, Chen B, Kalenichenko D, Wang W, Weyand T, Andreetto M, Adam H (2017) MobileNets: efficient convolutional neural networks for mobile vision applications arXiv preprint arXiv:1704.04861
- 37.Francois C (2017) Xception: deep learning with depthwise separable convolutions. IEEE conference on Computer Vision and Pattern Recognition (CVPR)
- 38.Fei-Fei L, Deng J, Li K (2010) ImageNet: constructing a large-scale image database. J Vis 9:1037–1037. 10.1167/9.8.1037
- 39.Xie J, Jiang Y, Tsui HT (2005) Segmentation of kidney from ultrasound images based on texture and shape priors. IEEE Trans Med Imaging 24:45–57. 10.1109/TMI.2004.837792 [DOI] [PubMed]
- 40.Jaeger S, Candemir S, Antani S, Wáng Y-XJ LP-X, Thoma G (2014) Two public chest X-ray datasets for computer-aided screen-ing of pulmonary diseases. Quantum Imaging Med Surg 4:475. 10.3978/j.issn.2223-4292.2014.11.20 [DOI] [PMC free article] [PubMed]
- 41.Rajaraman S, Candemir S, Xue Z, Alderson PO, Kohli M, Abuya J, Thoma GR, Antani S (2018) A novel stacked generalization of models for improved TB detection in chest radiographs. 2018 40th annual international conference of the IEEE Engineering Medicine and Biology Society, pp 718–721. 10.1148/radiol.2017162326 [DOI] [PubMed]
- 42.Kyung Kim T, Yi PH, Hager GD, Ting Lin C. Refining dataset curation methods for deep learning-based automated tuberculosis screening. J Thorac Dis. 2020;12:5078–5085. doi: 10.21037/jtd.2019.08.34. [DOI] [PMC free article] [PubMed] [Google Scholar]
- 43.Sahlol AT, Elaziz MA, Jamal AT, Damaševičius R, Hassan OF. A novel method for detection of tuberculosis in chest radiographs using artificial ecosystem-based optimisation of deep neural network features. Symmetry (Basel) 2020;12:1146. doi: 10.3390/sym12071146. [DOI] [Google Scholar]


