

Abstract
Aims
The dilated cardiomyopathy (DCM) phenotype is the result of combined genetic and acquired triggers. Until now, clinical decision-making in DCM has mainly been based on ejection fraction (EF) and NYHA classification, not considering the DCM heterogenicity. The present study aimed to identify patient subgroups by phenotypic clustering integrating aetiologies, comorbidities, and cardiac function along cardiac transcript levels, to unveil pathophysiological differences between DCM subgroups.
Methods and results
We included 795 consecutive DCM patients from the Maastricht Cardiomyopathy Registry who underwent in-depth phenotyping, comprising extensive clinical data on aetiology and comorbodities, imaging and endomyocardial biopsies. Four mutually exclusive and clinically distinct phenogroups (PG) were identified based upon unsupervised hierarchical clustering of principal components: [PG1] mild systolic dysfunction, [PG2] auto-immune, [PG3] genetic and arrhythmias, and [PG4] severe systolic dysfunction. RNA-sequencing of cardiac samples (n = 91) revealed a distinct underlying molecular profile per PG: pro-inflammatory (PG2, auto-immune), pro-fibrotic (PG3; arrhythmia), and metabolic (PG4, low EF) gene expression. Furthermore, event-free survival differed among the four phenogroups, also when corrected for well-known clinical predictors. Decision tree modelling identified four clinical parameters (auto-immune disease, EF, atrial fibrillation, and kidney function) by which every DCM patient from two independent DCM cohorts could be placed in one of the four phenogroups with corresponding outcome (n = 789; Spain, n = 352 and Italy, n = 437), showing a feasible applicability of the phenogrouping.
Conclusion
The present study identified four different DCM phenogroups associated with significant differences in clinical presentation, underlying molecular profiles and outcome, paving the way for a more personalized treatment approach.

Keywords: Machine learning, Clustering, Dilated cardiomyopathy, Pathophysiology
Graphical Abstract
See page 175 for the editorial comment on this article (doi: 10.1093/eurheartj/ehaa869)
Introduction
Non-ischaemic, non-valvular, dilated cardiomyopathy (DCM) represents a heterogeneous group of patients, as it results from a variety of genetic and acquired triggers.1 , 2 The heterogeneity makes it difficult to classify DCM with great precision to guide clinical decision-making. Until now, clinical decision-making in DCM has mainly been based on ejection fraction (EF) and NYHA classification,3 , 4 which does not recapitulate the complexity of the interactions with comorbidities and underlying aetiologies in the development and progression of DCM.5 , 6 Therapeutic modalities and outcome may differ pending on the underlying aetiologies.7 , 8 Overall, only 40–50% of DCM patients show left ventricular reverse remodelling (LVRR) after 12–24 months of optimal heart failure therapy.9 , 10 Classification which integrates the aetiological heterogeneity with cardiac function and comorbidities, may better reflect the biological differences between patients, and may allow guidance for a more targeted therapy.10 In an ideal situation, patients with corresponding pathophysiology would be classified together, creating more homogeneous patient populations.
Phenomapping based upon unsupervised clustering of clinical data may help to create homogeneous DCM subgroups, called phenogroups.11 Machine learning aids in detecting patterns between variables which explain the heterogeneity in a dataset.12 The methodology has previously helped to create clinically valid phenogroups in heart failure with preserved and reduced EF.11 , 13 So far, studies applying machine learning to create phenogroups in patients with DCM are missing.
The goal of this study is (i) to identify patterns in clinical data and cluster patients based on phenotypic similarities; (ii) to study their underlying molecular profiles and possible pathomechanisms by performing RNA-sequencing on cardiac biopsies of patients from each phenogroup; and (iii) to create a clinical classifier based on the generated patients clusters and test its applicability in external DCM cohorts (Figure 1).
Figure 1.

Summary of the aims and study design including data processing steps, survival analysis, and application.
Methods
Study population and clinical information
The DCM diagnosis was defined according to the World Health Organization criteria and the latest ESC proposal.14 , 15 Enrolled patients presented with a left ventricular (LV) EF <50% at baseline echocardiographic evaluation in the absence of any of the following conditions: obstruction >50% of a major coronary artery branch [at coronary angiography (CAG)], pericardial diseases, congenital heart diseases, cor pulmonale, and active myocarditis. Patients, when not contraindicated, received guideline-directed medical therapy titrated to the maximal tolerated dose as well as device therapy (ICD and CRT-D implantation) according to the latest ESC guidelines.4 Three European DCM cohorts were analysed. The study was performed according to the declaration of Helsinki and approved by all the local Institutional Review Boards. All patients gave written informed consent.
Index cohort
The index cohort was derived from the prospective Maastricht Cardiomyopathy Registry of the Maastricht University Medical Center (MUMC, Maastricht, The Netherlands) between 2012 and 2019. As part of the diagnostic protocol, all patients received genetic counselling and DNA testing using a 47 DCM-associated gene panel (Supplementary material online, Table S1), and underwent a physical examination, blood sampling, 12-lead electrocardiogram, 24-h Holter monitoring, a complete echocardiographic and Doppler evaluation, and CAG at baseline. See the Supplementary material online, Methods for a detailed overview of the in/exclusion criteria, definitions of non-genetic disease modifiers and performed genetic analysis. Endomyocardial biopsies (EMB) and cardiovascular magnetic resonance imaging were performed if patient consented and was able to undergo these procedures. Table 1 demonstrates the phenotypic domains covering all of the collected clinical variables.
Table 1.
Phenotype domains and corresponding clinical variables
| Phenotypic domain | Clinical variables |
|---|---|
| Demographics | Agea, gendera |
| Disease modifiers | Genetic mutation, genetic group,a familial disease,a toxic trigger,a auto-immune disease,a cardiac inflammation,a significant viral load,a electrical trigger |
| Physical characteristics | NYHA≥III,a hypertension,a body mass index,a diabetes,a heart rate,a systolic blood pressure,a diastolic blood pressure |
| Echocardiography | LV ejection fraction, LV end-diastolic diameter index, LV end-systolic diameter, left atrial volume index, LV mass index, E/A ratio, E/e’ ratio, posterior wall thickness, intraventricular septum thickness |
| Laboratory | NT-pro B-type natriuretic peptide,a high-sensitive troponin T, creatinine,a soluble interleukin-2 receptor, neopterin, cardiac auto-antibodies, c-reactive protein,a aspartate transaminase,a alanine transaminasea |
| ECG/Holter | Atrial fibrillation,a non-sustained ventricular tachycardia,a left bundle branch block,a out of hospital cardiac arrest,a atrioventricular blocka |
| Cardiovascular magnetic resonance | LV mass index,a LV end-diastolic volume index,a LV end-systolic volume index, LV stroke volume index, LV ejection fraction,a late gadolinium enhancementa |
| Endomyocardial biopsy | Collagen volume fraction |
LV, left ventricular; NYHA, New York Heart Association classification of severity of Heart Failure.
Clinical variables used in the model-based clustering.
Application cohorts
The cohort from Italy was derived from the prospective Heart Muscle Disease Registry of Trieste Registry.16 Patients were enrolled between 2006 and 2019. All patients underwent physical examination, blood sampling, 12-lead electrocardiogram, 24-h ECG Holter monitoring, a complete echocardiographic and Doppler evaluation at baseline and during structured, systematic follow-up.6 Genetic testing was performed using a 23 DCM-associated gene panel. In order to exclude ischaemic heart disease, a CAG was systematically performed in patients ≥35 years, with cardiovascular risk factors and/or without familial history for DCM.
The cohort from Madrid included DCM patients followed in the Hospital Puerta de Hierrós Inherited Cardiac Diseases Unit from 2004–19.17 All patients underwent a physical examination, blood sampling, genetic testing, a 12-lead electrocardiogram, echocardiogram, and systematic follow-up.
Follow-up
The median follow-up time of the Maastricht cohort was 53 months (interquartile range 28–98 months), 85 months (interquartile range 34–145 months) for Madrid and 40 months (interquartile range 13–77 months) for Trieste. Information about the occurrence of adverse events at follow-up was retrieved from the hospital medical records, the Personal Records Database, and/or telephone contact with the patient or their general practitioners in the three cohorts. We collected information regarding the following composite outcome measures: (i) death due to cardiovascular (CV) disease (heart failure or thrombo-embolic events), (ii) heart transplantation (Htx), (iii) LV assist device (LVAD) implantation, and (iv) life-threatening arrhythmias (LTA) defined as non-fatal ventricular fibrillation (with or without ICD shock), and/or sustained ventricular tachycardia treated with appropriate ICD shock. The combined endpoint is defined as the first occurrence of at least one of the above-mentioned adverse events: CV-related death, Htx, LVAD implantation, or an LTA.
Data processing
Figure 1 shows the study aims and design including all data processing steps, performed statistical analysis and application. The detailed description of these steps and used methods can be found in the Supplementary material online, Methods. Table 1 includes all 47 clinical parameters which were measured in the DCM patients, see Supplementary material online, Table S2 for an overview of the variable selection process. All 47 variables were used for data imputation using proximity from Random Forest for mixed-type data. Cardiovascular magnetic resonance parameters were imputed based on their equivalent echocardiographic parameters (Supplementary material online, Figure S1). The correlation matrix among variables is comparable between the imputed and non-imputed data, depicting high similarity (Supplementary material online, Figure S2). Fourteen variables with more than 25% missing data in the unimputed raw data were excluded from further analysis (Supplementary material online, Figure S3). Only late gadolinium enhancement (LGE) was kept in the analysis despite 29.8% of missing data, due to the established clinical importance of this variable.18 Five variables were excluded due to redundancy (Supplementary material online, Methods, Table S2). This left 28 variables for the clustering analysis.
Phenotypic clustering
We used optCluster (v1.3.0) to determine the stability and validity of various clustering methods to help determine the optimal clustering method (Supplementary material online, Methods). Phenotypic clusters were defined based on 28 clinical parameters without high multicollinearity using unsupervised hierarchical clustering of principal components (HCPC) approach, in which principle components of the clinical data were obtained with Factor Analysis for Mixed Data (FAMD), ensuring the balance of the influence between continuous and categorical variables. The optimal number of clusters was determined based on the gain in within-inertia (inside group variance) and using the Nbclust package (Supplementary material online, Figure S4). The over- or underrepresentation of character variables in each cluster were analysed by v-test based on the hypergeometric distribution. The clustering was performed with FactoMineR package v1.41 in R. The patient groups identified with the unsupervised clustering method were used as input for the decision tree modelling to identify the key parameters able to distinguish the created groups. Meaning that the decision tree modelling creates a classifier which can be applied on external cohorts, which is based on the unsupervised clustering. For this, conditional interference tree methods were used, a recursive binary partitioning with less overfitting and variable selection problems using the party package v1.3-3 in R. A detailed description of the used methods can be found in the Supplementary material online, Methods. The Jaccard similarity index was calculated using the clusteval package to estimate the robustness between the unsupervised and supervised clustering.
RNA-sequencing
RNA was isolated from cardiac biopsies from DCM patients and checked for quality and integrity. The mRNA-sequencing library was generated using TruSeq mRNA sample preparation kit (Illumina) and sequenced on the NextSeq 500 (Illumina). Molecular pathway analysis was performed using gene enrichment in Kyoto Encyclopaedia of Genes and Genomes (KEGG) pathways. The RNA-sequencing steps and bioinformatical analysis are described in more detail in the Supplementary material online, Methods.
Statistical analysis
The link between clinical variables and the created clusters was analysed by ANOVA for numeric and χ2-test for categorical variables. The over- or underrepresentation of a variable within a cluster was analysed by v-test within the HCPC function, based on the hypergeometric distribution. A P-value < 0.05 was considered as statistically significant.
For outcome analyses, we used unadjusted and multivariable-adjusted Cox proportional hazards models to determine the independent association between patient groups and outcome, after testing the proportional hazards assumption. Primary outcome was the combined endpoint of CV death, Htx, LVAD implantation, and/or an LTA. Covariates included in the adjusted analysis included variables known to be predictive of outcomes in DCM such as NT-proBNP, EF, creatinine, heart rate, NYHA class, hypertension, LGE, atrial fibrillation (AF), age, and gender. Model discrimination (c-statistics comparison using DeLong test), calibration (likelihood ratio test), and reclassification [(continuous) net reclassification index (NRI), and integrated discrimination index (IDI)] were evaluated for the clinical predictors with and without phenogrouping. Kaplan–Meier survival curves were estimated, and differences between groups were assessed by the log-rank test, using time at diagnosis as time zero. Calculations were done using SPSS version 23.0 (SPSS Inc., Chicago, IL, USA).
Results
Comparison of clinical characteristics among phenogroups
Figure 1 summarizes the data processing of the clinical variables, selecting 28 variables as input for the cluster analysis (Table 1, Supplementary material online, Table S2). Four was the minimal number of clusters which could accurately reflect the phenotypic variation in the index cohort (Supplementary material online, Figure S4). Twenty-seven of the 28 clinical input variables had a contribution in defining the patient clusters. Only the cardiac viral load in EMBs did not contribute (Figure 2, Supplementary material online, Table S2). This led to the identification of four phenogroups with significant differences in their clinical characteristics (Table 2, Figure 2).
Figure 2.

Four mutually exclusive phenogroups as determined by hierarchical clustering of principal component using phenotypical information as input. The most distinct clinical characteristics are listed per phenogroup. Variables with an asterisk are key parameters to distinguish the phenogroups, as selected by supervised decision tree modelling (A). Characteristic plots of the four proposed phenogroups including their most representative clinical variables. The over- or underrepresentation of a variable within a cluster was analysed by v-test within the hierarchical clustering of principal component function, based on the hypergeometric distribution. A positive value indicates overrepresentation of this variable in the applicable phenogroup, a negative value indicates underrepresentation of the corresponding variable (B).
Table 2.
Clinical characteristics stratified by phenogroup
| Clinical Characteristic | Group 1—mild systolic dysfunction | Group 2—auto-immune | Group 3—cardiac arrhythmias | Group 4—severe systolic dysfunction |
|---|---|---|---|---|
| (n = 331) | (n = 83) | (n = 165) | (n = 216) | |
| Age, year | 50.5 ± 13.1 | 52.5 ± 13.8 | 57.9 ± 11.5 | 56.3 ± 11.4 |
| Female, n (%) | 150 (45) | 49 (59) | 20 (12) | 77 (36) |
| Disease modifiers, n (%) | ||||
| Genetic mutation | 45 (14) | 9 (11) | 94 (57) | 27 (13) |
| TTNtv | 14 (4) | 6 (7) | 43 (26) | 9 (4) |
| LMNA | 0 (0) | 1 (1) | 20 (12) | 1 (0) |
| Other | 30 (9) | 1 (1) | 24 (15) | 17 (8) |
| Multiple | 1 (0) | 1 (1) | 7 (4) | 0 (0) |
| Familial disease | 59 (18) | 15 (20) | 78 (41) | 48 (23) |
| Toxic trigger | 31 (9) | 7 (8) | 9 (5) | 36 (17) |
| Auto-immune disease | 7 (2) | 57 (69) | 2 (1) | 3 (1) |
| Cardiac inflammation | 50 (15) | 16 (19) | 20 (12) | 44 (20) |
| Significant viral load | 31 (9) | 11 (13) | 15 (9) | 25 (12) |
| Electrical trigger | 137 (41) | 12 (14) | 73 (44) | 99 (46) |
| NYHA functional class ≥III, n (%) | 33 (10) | 26 (31) | 49 (30) | 114 (53) |
| Hypertension, n (%) | 117 (35) | 36 (43) | 72 (44) | 72 (33) |
| Body mass index, kg/m2 | 26.8 ± 5.2 | 24.4 ± 5.1 | 28.3 ± 4.4 | 26.4 ± 4.7 |
| Diabetes mellitus, n (%) | 22 (7) | 14 (17) | 21 (13) | 29 (13) |
| Heart rate, b.p.m. | 72.3 ± 14.6 | 80.1 ± 18.1 | 73.3 ± 16.6 | 77.7 ± 17.2 |
| Systolic blood pressure, mm Hg | 134.6 ± 19.5 | 136.9 ± 26.3 | 135.8 ± 19.6 | 128 ± 19.6 |
| Diastolic blood pressure, mm Hg | 78.6 ± 12 | 79.9 ± 13.7 | 80.3 ± 12.6 | 78.4 ± 12.5 |
| Echocardiography | ||||
| LV ejection fraction, % | 37.6 ± 8.6 | 33.4 ± 10.2 | 32.7 ± 9.7 | 21.8 ± 7.2 |
| LV EDD index, mm/m2 | 29 ± 3.7 | 30.9 ± 5.3 | 28.9 ± 3.8 | 34.7 ± 5.2 |
| LV ESD, mm | 45 ± 7.3 | 46 ± 9.5 | 49 ± 8.9 | 60 ± 8.8 |
| LA volume index, mL/m2 | 39.2 ± 13.8 | 43.6 ± 16.8 | 53.2 ± 16.5 | 50.3 ± 19.1 |
| LV mass index, g/m2 | 95.4 ± 22.9 | 108.1 ± 32 | 107 ± 25 | 140.2 ± 36 |
| E/A ratio | 1.1 ± 0.5 | 1.1 ± 0.5 | 1.4 ± 0.9 | 1.2 ± 0.8 |
| E/eʹ ratio | 7.5 ± 2.7 | 11.6 ± 5.2 | 10.8 ± 5.1 | 13.1 ± 4.3 |
| Posterior WT, mm | 8.6 ± 1.3 | 9.1 ± 1.8 | 9.1 ± 1.6 | 9.4 ± 1.6 |
| Intraventricular ST, mm | 8.7 ± 1.5 | 9.1 ± 2.2 | 9.6 ± 2 | 9.2 ± 1.7 |
| Laboratory data | ||||
| NT-proBNP, pmol/L | 16 [7–42] | 102 [39–520] | 94 [39–230] | 60 [19–229] |
| Hs-Troponin T, ng/L | 8 [4–12] | 19 [9–48] | 18 [10–32] | 17 [10–36] |
| Creatinine, µmol/L | 83 [73–94] | 113 [87–149] | 103 [89–120] | 97 [84–113] |
| sIL-2R elevation, n (%) [488] | 39 (19) | 38 (60) | 17 (20) | 40 (29) |
| Neopterin elevation, n (%) [485] | 46 (22) | 38 (62) | 29 (35) | 52 (39) |
| Cardiac auto-antibodies, n (%) [505] | 4 (2) | 8 (12) | 4 (4) | 5 (4) |
| C-reactive protein, mg/L | 2 [1–5] | 5 [2–11] | 2 [1–5] | 3 [1–11] |
| ASAT, U/L | 23 [19–28] | 24 [19–28] | 28 [22–36] | 26 [21–33] |
| ALAT, U/L | 24 [19–34] | 20 [15–27] | 32 [24–42] | 27 [19–40] |
| ECG/Holter, n (%) | ||||
| Atrial fibrillation | 43 (13) | 17 (20) | 100 (61) | 31 (14) |
| Non-sustained VT | 49 (15) | 16 (19) | 103 (62) | 60 (28) |
| Left bundle branch block | 94 (28) | 8 (10) | 40 (24) | 83 (38) |
| Atrioventricular block | 26 (8) | 7 (8) | 42 (25) | 21 (10) |
| Out of hospital cardiac arrest | 12 (4) | 2 (2) | 24 (15) | 13 (6) |
| Cardiovascular MR (n = 558) | ||||
| LV mass index, g/m2 | 62.7 ± 15.4 | 66.8 ± 24.3 | 66.4 ± 14.8 | 94.2 ± 27.4 |
| LV EDV index, mL/m2 | 110.1 ± 24.6 | 113.5 ± 31 | 115.1 ± 28.8 | 178.1 ± 52.5 |
| LV ESV index, mL/m2 | 63.4 ± 21 | 73.8 ± 31.5 | 75.1 ± 27.4 | 138.7 ± 51.6 |
| LV stroke volume index, mL/m2 | 46.8 ± 11 | 40.1 ± 11 | 40.3 ± 12.5 | 39 ± 12.8 |
| LV ejection fraction, % | 42.9 ± 8.8 | 37.4 ± 12.5 | 36.1 ± 11.1 | 22.8 ± 8.2 |
| Late gadolinium enhancement, n (%) | 41 (17) | 33 (52) | 68 (59) | 42 (29) |
| Endomyocardial biopsy | ||||
| Collagen volume fraction, %/area | 4.7 [2–7] | 6 [3–10] | 6 [3–11] | 6.2 [3–10] |
Categorical variables are presented as counts and percentages; continuous variables are presented as mean ± SD; and right-skewed variables are presented as median (25th–75th percentile).
ALAT, alanine transaminase; ASAT, aspartate transaminase; EDD, end-diastolic diameter; EDV, end-diastolic volume; ESD, end-systolic diameter; ESV, end-systolic volume.; LA, left atrial; LMNA, lamin A/C; LV, left ventricular; MR, magnetic resonance; NYHA, New York Heart Association; sIL-2R, soluble interleukin-2 receptor; ST, septum thickness; TTNtv, truncating titin variants; VT, ventricular tachycardia; WT, wall thickness.
Phenogroup 1 (PG1; n = 331; 42%) had a moderate reduction in left ventricular ejection fraction (LVEF; 43% ± 9%) and overall smallest cardiac dimensions, lower NT-proBNP [16 (7–42) pmol/L] and NYHA class I and II (90%) compared with the other patients. Phenogroup 4 (PG4; n = 216; 27%) appears to be the opposite pole of severity, consisting of patients with a low LVEF (23% ± 8%), and the largest cardiac dimensions. More than half of the patients in this subgroup had NYHA III or IV (53%).
Patients in phenogroup 2 (PG2) and 3 (PG3) more reflect the aetiological diversity, irrespective of cardiac function and clinical presentation. Patients in PG2 (n = 83; 10%) consisted primarily of patients with an auto-immune disease (69%), females (59%), and chronic kidney disease [creatinine: 113 (87–149) µmol/L]. In contrast, PG3 (n = 165; 21%) consisted mainly of males (88%) with a high prevalence of cardiac arrhythmias [mainly AF (61%) and NSVT (62%)], pathogenic gene variants (57%), and LGE at MRI (59%). Two-third of the gene variants were pathogenic TTNtv and LMNA variants (Table 2).
RNA-sequencing of cardiac biopsies to unravel underlying pathophysiology
To gain better insight into the cardiac pathophysiological differences between the phenogroups, genome-wide transcriptome analysis (RNA-sequencing of EMB) was performed in a sub-cohort of patients with available spare biopsies for RNA-sequencing (n = 91, distribution phenogroups 1–4 = 21/9/35/26). All phenogroups had a distinct transcriptomic signature separating them from the other groups (Figure 3A). PG4 (low EF) had large differences in gene expression, as reflected by the number of differentially expressed genes and strong separation (Figure 3B). Subsequent gene set enrichment analysis with KEGG terms revealed unique expression of molecular pathways per phenogroup (Figure 3C, Table 3). Overall, cardiac metabolism was the strongest differentially expressed biological pathway in PG4 [reflecting (i) a decrease in fatty acid pathways and an increase in pathways involved in glycolytic substrate usage; and (ii) an increase in purine and pyrimidine metabolism reflecting DNA replication], PG2 (auto-immune) had a pro-inflammatory gene profile (NFĸB- and TNF-signalling) and PG3 (arrhythmia) was the most pro-fibrotic (focal adhesion and extracellular matrix remodelling).
Figure 3.

Analysis of RNA-sequencing data of endomyocardial biopsies from dilated cardiomyopathy patients. Principal component analysis (PCA) of RNA-sequencing data divided on phenogroup (PG). Principal component 1 shows strong division of PG4 and the others (A). Venn diagram of the number of significant differentially expressed genes in the comparison between two corresponding PG (FDR < 0.01 + fold change >1.5) (B). Significantly enriched Kyoto Encyclopaedia of Genes and Genomes pathways (P-value < 0.05) in the comparison between the PG (Table 4) (C).
Table 3.
Molecular Kyoto Encyclopaedia of Genes and Genomes pathway analysis in RNA-seq data from endomyocardial biopsies of DCM patients stratified per phenogroup
| Top enriched KEGG pathways (functional annotation clustering) | Number of genes a | P-value b | Top enriched KEGG pathway (functional annotation chart) | Number of genes a | P-value b |
|---|---|---|---|---|---|
| Phenogroup 2 vs. Phenogroup 1 | |||||
| NF-kappa B signalling pathway ↑ | 12 | 7.5E−6 | NF-kappa B signalling pathway ↑ | 12 | 7.5E−6 |
| RIG-I-like receptor signalling pathway ↑ | 7 | 7.0E−3 | |||
| Glutathione metabolism ↑ | 4 | 3.4E−2 | |||
| Phenogroup 3 vs. Phenogroup 1 | |||||
| ECM-receptor interaction ↑ | 7 | 7.9E−2 | Focal adhesion ↑ | 12 | 4.3E−3 |
| Focal adhesion ↑ | 12 | 4.3E−3 | |||
| PI3K-Akt signalling pathway ↑ | 10 | 9.8E−2 | |||
| Phenogroup 4 vs. Phenogroup 1 | |||||
| DNA replication ↑ | 19 | 1.3E−7 | Metabolic pathways ↑ | 201 | 4.1E−4 |
| Dilated cardiomyopathy ↑ | 16 | 1.4E−2 | |||
| Fatty acid metabolism ↓ | 7 | 1.8E−1 | |||
| Phenogroup 2 vs. phenogroup 3 | |||||
| RIG-I-like receptor signalling pathway ↑ | 5 | 2.1E−2 | TNF-signalling pathway ↑ | 17 | 5.0E−7 |
| T-cell receptor signalling ↑ | 8 | 3.9E−2 | |||
| B-cell receptor signalling ↑ | 5 | 7.0E−2 | |||
| Phenogroup 4 vs. phenogroup 2 | |||||
| cGMP-PKG signalling pathway ↑ | 29 | 5.3E−3 | Metabolic pathways ↑ | 188 | 5.2E−3 |
| DNA replication ↑ | 10 | 3.7E−2 | |||
| Dilated cardiomyopathy ↑ | 15 | 6.7E−2 | |||
| Phenogroup 4 vs. phenogroup 3 | |||||
| DNA replication ↑ | 16 | 9.2E−5 | Metabolic pathways ↑ | 200 | 5.3E−2 |
| PI3K-Akt signalling pathway ↑ | 11 | 4.6E−2 | |||
| Focal adhesion ↓ | 15 | 6.5E−2 |
The arrow indicates the direction of the pathway (up- or down-regulation) in the cardiac RNA-sequencing data from the underlined phenogroup compared with the phenogroup in direct comparison.
KEGG, Kyoto Encyclopaedia of Genes and Genomes.
Number of significant differentially expressed genes between datasets which are represented in the specific pathway.
A P-value < 0.05 indicates a significant enrichment of the corresponding pathway in the comparison.
Association of phenogroups with outcome
We tested whether the four different phenogroups were associated with the combined outcome measure as defined by CV death, Htx, LVAD implantation or the occurrence of an LTA. PG1 (mrEF) has the lowest, and PG3 (arrhythmia) the highest risk for an adverse event (1.1 vs. 6.5 events per 100 patient-years; P < 0.001; Figure 4, Table 4). Both PG2 (auto-immune) and PG4 (low EF) shared a high-risk profile with 4.2 events per 100 patient-years. PG3 (arrhythmia) remained a high-risk subgroup, even after correction of well-established prognostic factors (Table 4). The addition of phenogroup information improved the outcome prediction beyond the clinical predictors (c-statistic 0.63–0.734, P = 0.006; likelihood ratio test P < 0.001; IDI 6%, P < 0.001; NRI 20%, P = 0.026; Supplementary material online, Table S3). Overall, the prognosis of PG2, 3 and 4 were comparable (Figure 4), reflecting the influence of aetiological fraction (Group 2: auto-immune disease Group 3: genetics) on prognosis irrespective of cardiac function (Group 4). Patients classified in PG3 (arrhythmia) had specifically an increased risk for LTAs compared with the other phenogroups (4.1 events per 100 patient-years; Table 4 ).
Figure 4.
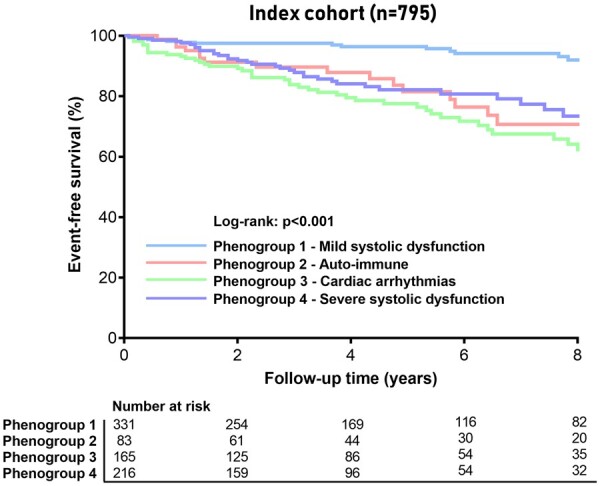
Event-free survival stratified by phenogroup. Kaplan–Meier curves for the combined outcome of life-threatening arrhythmias, cardiovascular death, heart transplantation, or left ventricular assist device implantation stratified by phenogroup.
Table 4.
Association of phenogroups with adverse outcomes on cox proportional hazards analysis
| Group 1—mild systolic dysfunction | Group 2—auto- immune disease | Group 3—cardiac arrhythmias | Group 4—severe systolic dysfunction | P-value | |
|---|---|---|---|---|---|
| (n = 331) | (n = 83) | (n = 165) | (n = 216) | ||
| Outcome, n (events/100 patient-years) | |||||
| Life-threatening arrhythmias | 13 (0.7) | 9 (2.1) | 35 (4.1) | 20 (1.9) | <0.001 |
| CV Death/Htx/LVAD | 6 (0.3) | 14 (2.9) | 28 (2.8) | 26 (2.4) | <0.001 |
| Combined Endpoint | 19 (1.1) | 19 (4.2) | 54 (6.5) | 42 (4.2) | <0.001 |
| Unadjusted HR (95% CI) | |||||
| Life-threatening arrhythmias | 1.0 | 2.9 (1.2–6.7)* | 5.5 (2.9–10.4)‡ | 2.4 (1.2–4.9)* | … |
| CV Death/Htx/LVAD | 1.0 | 9.0 (3.4–23.3)‡ | 8.7 (3.6–21)‡ | 7.4 (3.1–18.1)‡ | … |
| Combined Endpoint | 1.0 | 4.0 (2.1–7.5)‡ | 6.0 (3.6–10.1)‡ | 3.9 (2.3–6.7)‡ | … |
| Adjusted HR (95% CI) | |||||
| Life-threatening arrhythmias | 1.0 | 1.8 (0.5–5.6) | 5.3 (2.1–13.5)‡ | 1.1 (0.7–6.4) | … |
| CV Death/Htx/LVAD | 1.0 | 7.5 (1.4–39.3)* | 9.2 (1.9–44.7)† | 4.9 (0.9–27.6) | … |
| Combined Endpoint | 1.0 | 2.3 (0.9–5.7) | 5.1 (2.3–11.2)‡ | 2.6 (1.1–6.2)* | … |
Adjusted analysis include the phenogroups + NT-proBNP + age + gender + ejection fraction + creatinine + heart rate + NYHA class + hypertension + late gadolinium enhancement + atrial fibrillation.
CI, confidence interval; CV, cardiovascular; HR, hazard ratio; Htx, heart transplantation; LVAD, left ventricular assist device.
P < 0.05; † P < 0.01; ‡ P < 0.001.
52.5% of the patients showed LVRR after 12 months of guideline-directed medical therapy (Supplementary material online, Table S4). Patients in PG4 (low EF) had the highest rate of LVRR (61%) compared with PG1-3 (48%, 49%, and 50%, respectively). Although patients in PG2-4 had similar or a higher rate of LVRR compared with PG1 (mrEF), they still had a higher event rate, which could be partly explained by differences in disease mechanism.
Supervised decision tree modelling to enhance clinical utility
We applied supervised decision tree modelling with the phenogroups from the clustering as input, to create a classifier consisting of only a few clinical variables which can still place a patient in their corresponding phenogroup. A low number of variables in such classifier will increase the likelihood that it can be applied in other DCM patient cohorts, instead of the extensive dataset which was needed to identify the phenogroups. The presence of an auto-immune disease, LVEF, AF, and creatinine were selected as the most important variables characteristic for these phenogroups with a combined accuracy of 71% (Figure 5, Supplementary material online, Figure S5, Table S5). However, placing patients in PG2 (auto-immune) had an accuracy of 95%, mostly by the presence of an auto-immune disease (Supplementary material online, Table S5). The decision tree has the most difficulty in recognizing patients from PG3 (arrhythmia), mainly due to the placement is completely independent of LVEF (nodes 5 and 9 in Supplementary material online, Figure S5; accuracy of 80% Supplementary material online, Table S5).
Figure 5.

A simplified adaptation of the decision tree model shows the clinical parameters which are the core of the phenogroups. The black box indicates that the model cannot accurately place the patient in one of the four phenogroups (see Supplementary material online, Figure S5 for exact accuracy).
Application of the phenomapping analysis
To test the clinical utility of the supervised model, we applied the classifier derived from the clustering method on an external, independent DCM cohort gathered from a Spanish and Italian registry (Supplementary material online, Table S6). The decision tree was able to successfully match every patient in one of the four phenogroups (Supplementary material online, Table S6). The phenogroups were associated with event-free survival in the application cohort, resembling the overall outcome in the index registry (P < 0.001; Figures 4 and 6; Supplementary material online, Figure S6): PG1 (mrEF) was associated with the lowest event rate, PG3 (arrhythmia) had the worst outcome, and PG2 (auto-immune) and PG4 (low EF) were the intermediate-risk groups. The application shows the feasibility of clinical utility and validity of the created phenogroups.
Figure 6.
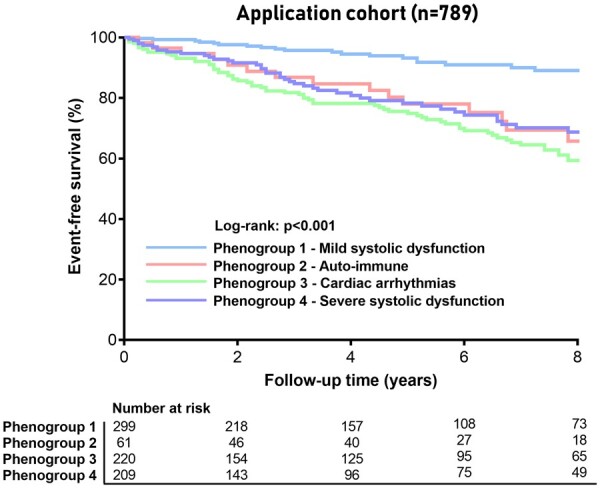
Event-free survival stratified by phenogroup as determined by the supervised decision tree model. Kaplan–Meier curves for the combined outcome of life-threatening arrhythmias, cardiovascular death, heart transplantation, or left ventricular assist device implantation stratified by phenogroup in the application cohort (Madrid and Trieste).
Discussion
We identified four distinct phenogroups with unique clinical characteristics, reflecting the integration of cardiac function, comorbidities, and underlying aetiology. Each phenogroup had a distinct cardiac transcriptomic profile, which could pave the way to a more targeted and personalized treatment approach (Take home figure).
Take home figure.
This study identified four phenotypic clusters based on patterns in clinical data which had a unique underlying molecular profile identified by RNA-sequencing on cardiac biopsies of patients from each phenogroup. A classifier derived from the initial clustering could be succesfully applied on an external cohort placing every DCM patient in a specific phenogroup.
Identified phenogroups in a heterogeneous dilated cardiomyopathy dataset
The four mutually exclusive phenogroups integrated a broad range of clinical variables: (i) younger patients with mild systolic dysfunction, small cardiac dimensions, and relatively few symptoms; (ii) young females with a clinical history of auto-immune disease with cardiac and renal involvement; (iii) males with a genetic mutation and prevalent ventricular and supraventricular arrhythmias; and (iv) patients with severe systolic dysfunction, large cardiac dimensions, moderate diastolic dysfunction, and pronounced symptoms. All phenogroups had a distinct cardiac transcriptomic signature, characterizing differences in underlying molecular pathology. This confirms that the generated phenogroups are more homogeneous patient subgroups who could share a common pathophysiology compared with patients in other phenogroups. Supervised decision tree modelling identified four parameters that are sufficient to adequately cluster patients in these subgroups: EF (PG1 and 4), auto-immune disease and creatinine (PG2), and AF (PG3). We could successfully apply this decision tree on an external application cohort placing every patient in one the four phenogroups.
Clinical validity of created phenogroups
The present study puts forward an approach of DCM patient classification based on the integration of extensive, but well-accessible diagnostic tools. A recent post-hoc analysis of the POSEIDON-DCM trial revealed a genetic aetiology in a large percentage of non-responders.19 This illustrates the heterogenicity of DCM and the difficulty to recognize all clinical variables influencing the clinical course of a patient. The variety of underlying disease mechanisms in DCM could be an important reason for the variation in treatment efficacy in clinical trials.1 , 19 The identification of valid DCM patient subgroups with distinct underlying molecular profiles may therefore help to better guide future DCM clinical trials.
PG1 (mrEF) and PG4 (low EF) represent two opposites of DCM severity, which is mainly reflected in their LVEF. PG4 (low EF) had a distinct transcriptomic profile, reflecting a cardiac metabolic shift away from fatty acid metabolism towards glycolytic substrate usage, which is characteristic for an increasing heart failure severity as the heart has to metabolically adapt to the increased cardiac energy demand.20 , 21 Furthermore, purine and pyrimidine metabolism was increased, which was in line with the increased DNA replication pathways, which is also a hallmark of heart failure. PG2 (auto-immune) and PG3 (arrhythmia) are distinct disease subgroups independent of LVEF. Cardiac involvement in patients with an auto-immune disease (PG2) was associated with a high-risk profile (PG2). As one would expect, pro-inflammatory pathways predominated in the auto-immune PG2, and this PG could therefore benefit from additional immunomodulatory therapy as suggested in the position statement of the ESC.22
Patients in PG3 are characterized by cardiac arrhythmias, pathogenic gene variants, and increased cardiac fibrosis. Patients in PG3 had the highest risk profile, with a five times higher risk for LTAs compared with DCM patients in PG1 even after adjustment for well-known clinical predictors such as LVEF and LGE. The close interaction between arrhythmias, fibrosis, and gene variants created difficulties for the decision tree to pick one variable that could place patients in PG3. Expanding genotype-phenotype knowledge (i.e. unveiling the association and disease expression of specific gene variants with AF) could be valuable input to finetune PG3 and enhance the decision tree accuracy. Finding the gene variant which causes the electrical disturbance may help to provide more targeted therapy in otherwise heart failure (HF)-therapy resistant patients in the future. This is exemplified in DCM patients with a pathogenic lamin A/C (LMNA) variant, in which hyperactivation of the p38α signalling pathway plays a central pathophysiological role.23 ARRY-797, an oral, selective p38 inhibitor is currently under investigation in DCM patients with an LMNA variant in a randomized, double-blind, placebo-controlled phase 3 trial (NCT03439514). It is not unexpected that this PG had the highest prevalence of LMNA and TTN variants along with NSVTs, both known risk factors for LTA.5 , 24 This could indicate that patients in this specific phenogroup could benefit the most from prophylactic ICD therapy before advanced LV dysfunction as is currently only implemented in the guidelines for LMNA, shedding new light on the outcome of the DANISH trial.4 , 25
Future directions of dilated cardiomyopathy patient care
The main aim of this study was to find patterns in clinical data which represent patient groups who share a similar pathophysiology. This finding precedes potential therapeutic implications which deserve further investigation: (i) response to currently used HF medication per PG and (ii) targeted therapy aimed at the underlying pathomechanism of the specific PG. In-depth analysis of transcriptomic data per phenogroup and additional functional studies are next steps to elucidate specific molecular targets for treatment.
Although we focused on clinical utility, the effect on clinical decision-making remains elusive. We acknowledge that the current approach is a major departure from the classical studies, but it is a first attempt to a more personalized approach of the DCM patient in everyday clinical practice. Application of patient clustering as a tool to guide clinical decision-making should be further explored in prospective studies. Besides a refined DCM clustering and ensuing targeted therapies, an additional goal would be the development of a comprehensive DCM risk score for sudden cardiac death and LTA, as already available for hypertrophic cardiomyopathy.26
Limitations and perspectives
In this study, we chose for an unsupervised approach with hierarchical k-means clustering of principal components to look in an unbiased way for underlying clinical patterns. The HCPC method allows us to use principal components instead of individual variables and maximize robustness by an additional k-means consolidation step, which can be used for FAMD. This is a different strategy from model-based clustering methods, which are semi-supervised and more appropriate to improve prognostic assessment. The analysis of the registries is of a retrospective nature, although patients are included prospectively. The results and clinical implications of this study need therefore to be validated in a prospective manner, not only for predicting outcome, but also for its more value in predicting the response to existing or novel HF therapies.
The definition of systemic immune-mediated diseases (based on the recent position statement of the ESC22) includes a broad spectrum of immune-mediated diseases with diverse implication in cardiac disease development. Larger registries studying this specific immune-mediated subset of DCM patients are needed to be able to look at the specific immune-mediated diseases and their impact on long-term outcome.
Conclusions
The present study identified four different DCM phenogroups associated with significant differences in clinical presentation, underlying molecular profiles and outcome, paving the way for a more personalized treatment approach.
Data availability
The data that support the findings of this study are available from the corresponding author on reasonable request.
Supplementary material
Supplementary material is available at European Heart Journal online.
Funding
The research leading to these results has received funding from the European Union Commission’s Seventh Framework programme under grant agreement N° 305507 (HOMAGE). This manuscript has also been possible thanks to the support of the ERA-Net-CVD project MacroERA, 01KL1706, and IMI2-CARDIATEAM (N° 821508). We acknowledge the support from the Netherlands Cardiovascular Research Initiative, an initiative with support of the Dutch Heart Foundation, CVON2016-Early HFPEF, 2015-10, CVON She-PREDICTS, grant 2017-21, CVON Arena-PRIME, 2017-18. Furthermore, we acknowledge the support of the Belgian FWO G091018N and FWO G0B5930N to S.R.B.H.
Conflict of interest: none declared.
Supplementary Material
Contributor Information
Job A J Verdonschot, Department of Cardiology, Cardiovascular Research Institute (CARIM), Maastricht University Medical Center, PO Box 5800, 6202 AZ Maastricht, The Netherlands; Department of Clinical Genetics, Maastricht University Medical Center, Maastricht, The Netherlands.
Marco Merlo, Cardiovascular Department, Azienda Sanitaria Universitaria Giuliano Isontina (ASUGI), University of Trieste, Italy.
Fernando Dominguez, Department of Cardiology, Hospital Universitario Puerta de Hierro, Madrid, Spain; Centro de Investigación Biomédica en Red Enfermedades in Cardiovascular Diseases (CIBERCV), Madrid, Spain.
Ping Wang, Department of Clinical Genetics, Maastricht University Medical Center, Maastricht, The Netherlands.
Michiel T H M Henkens, Department of Cardiology, Cardiovascular Research Institute (CARIM), Maastricht University Medical Center, PO Box 5800, 6202 AZ Maastricht, The Netherlands.
Michiel E Adriaens, Maastricht Centre for Systems Biology, Maastricht University, Maastricht, The Netherlands.
Mark R Hazebroek, Department of Cardiology, Cardiovascular Research Institute (CARIM), Maastricht University Medical Center, PO Box 5800, 6202 AZ Maastricht, The Netherlands.
Marco Masè, Cardiovascular Department, Azienda Sanitaria Universitaria Giuliano Isontina (ASUGI), University of Trieste, Italy.
Luis E Escobar, Department of Cardiology, Hospital Universitario Puerta de Hierro, Madrid, Spain; Centro de Investigación Biomédica en Red Enfermedades in Cardiovascular Diseases (CIBERCV), Madrid, Spain.
Rafael Cobas-Paz, Department of Cardiology, Hospital Universitario Puerta de Hierro, Madrid, Spain; Centro de Investigación Biomédica en Red Enfermedades in Cardiovascular Diseases (CIBERCV), Madrid, Spain.
Kasper W J Derks, Department of Clinical Genetics, Maastricht University Medical Center, Maastricht, The Netherlands.
Arthur van den Wijngaard, Department of Clinical Genetics, Maastricht University Medical Center, Maastricht, The Netherlands.
Ingrid P C Krapels, Department of Clinical Genetics, Maastricht University Medical Center, Maastricht, The Netherlands.
Han G Brunner, Department of Clinical Genetics, Maastricht University Medical Center, Maastricht, The Netherlands; Department of Human Genetics, Donders Institute for Brain, Cognition and Behavior, Radboud University Medical Center, Nijmegen; GROW Institute for Developmental Biology and Cancer, Maastricht University Medical Centre, Maastricht, The Netherlands.
Gianfranco Sinagra, Cardiovascular Department, Azienda Sanitaria Universitaria Giuliano Isontina (ASUGI), University of Trieste, Italy.
Pablo Garcia-Pavia, Department of Cardiology, Hospital Universitario Puerta de Hierro, Madrid, Spain; Centro de Investigación Biomédica en Red Enfermedades in Cardiovascular Diseases (CIBERCV), Madrid, Spain; Universidad Francisco de Vitoria (UFV), Pozuelo de Alarcon, Spain.
Stephane R B Heymans, Department of Cardiology, Cardiovascular Research Institute (CARIM), Maastricht University Medical Center, PO Box 5800, 6202 AZ Maastricht, The Netherlands; Department of Cardiovascular Sciences, Centre for Molecular and Vascular Biology, KU Leuven, Belgium; The Netherlands Heart Institute, Nl-HI, Utrecht, The Netherlands.
References
- 1. Verdonschot JAJ, Hazebroek MR, Ware JS, Prasad SK, Heymans SRB. Role of targeted therapy in dilated cardiomyopathy: the challenging road toward a personalized approach. J Am Heart Assoc 2019;8:e012514. [DOI] [PMC free article] [PubMed] [Google Scholar]
- 2. Sinagra G, Elliott PM, Merlo M. Dilated cardiomyopathy: so many cardiomyopathies! Eur Heart J 2019;doi: 10.1093/eurheartj/ehz908. [DOI] [PubMed] [Google Scholar]
- 3. Priori SG, Blomström-Lundqvist C, Mazzanti A, Blom N, Borggrefe M, Camm J, Elliott PM, Fitzsimons D, Hatala R, Hindricks G, Kirchhof P, Kjeldsen K, Kuck K-H, Hernandez-Madrid A, Nikolaou N, Norekvål TM, Spaulding C, Van Veldhuisen DJ. 2015 ESC Guidelines for the management of patients with ventricular arrhythmias and the prevention of sudden cardiac death: the Task Force for the Management of Patients with Ventricular Arrhythmias and the Prevention of Sudden Cardiac Death of the European Society of Cardiology (ESC). Endorsed by: Association for European Paediatric and Congenital Cardiology (AEPC). Eur Heart J 2015;36:2793–2867. [DOI] [PubMed] [Google Scholar]
- 4. Ponikowski P, Voors AA, Anker SD, Bueno H, Cleland JG, Coats AJ, Falk V, Gonzalez-Juanatey JR, Harjola VP, Jankowska EA, Jessup M, Linde C, Nihoyannopoulos P, Parissis JT, Pieske B, Riley JP, Rosano GM, Ruilope LM, Ruschitzka F, Rutten FH, van der Meer P; ESC Scientific Document Group. 2016 ESC Guidelines for the diagnosis and treatment of acute and chronic heart failure: the Task Force for the diagnosis and treatment of acute and chronic heart failure of the European Society of Cardiology (ESC) Developed with the special contribution of the Heart Failure Association (HFA) of the ESC. Eur Heart J 2016;37:2129–2200. [DOI] [PubMed] [Google Scholar]
- 5. Verdonschot JAJ, Hazebroek MR, Derks KWJ, Barandiaran Aizpurua A, Merken JJ, Wang P, Bierau J, van den Wijngaard A, Schalla SM, Abdul Hamid MA, van Bilsen M, van Empel VPM, Knackstedt C, Brunner-La Rocca HP, Brunner HG, Krapels IPC, Heymans SRB. Titin cardiomyopathy leads to altered mitochondrial energetics, increased fibrosis and long-term life-threatening arrhythmias. Eur Heart J 2018;39:864–873. [DOI] [PubMed] [Google Scholar]
- 6. Gigli M, Merlo M, Graw SL, Barbati G, Rowland TJ, Slavov DB, Stolfo D, Haywood ME, Dal Ferro M, Altinier A, Ramani F, Brun F, Cocciolo A, Puggia I, Morea G, McKenna WJ, La Rosa FG, Taylor MRG, Sinagra G, Mestroni L. Genetic risk of arrhythmic phenotypes in patients with dilated cardiomyopathy. J Am Coll Cardiol 2019;74:1480–1490. [DOI] [PMC free article] [PubMed] [Google Scholar]
- 7. Merlo M, Cannata A, Gobbo M, Stolfo D, Elliott PM, Sinagra G. Evolving concepts in dilated cardiomyopathy. Eur J Heart Fail 2018;20:228–239. [DOI] [PubMed] [Google Scholar]
- 8. Dal Ferro M, Stolfo D, Altinier A, Gigli M, Perrieri M, Ramani F, Barbati G, Pivetta A, Brun F, Monserrat L, Giacca M, Mestroni L, Merlo M, Sinagra G. Association between mutation status and left ventricular reverse remodelling in dilated cardiomyopathy. Heart 2017;103:1704–1710. [DOI] [PubMed] [Google Scholar]
- 9. Merlo M, Pyxaras SA, Pinamonti B, Barbati G, Di Lenarda A, Sinagra G. Prevalence and prognostic significance of left ventricular reverse remodeling in dilated cardiomyopathy receiving tailored medical treatment. J Am Coll Cardiol 2011;57:1468–1476. [DOI] [PubMed] [Google Scholar]
- 10. Verdonschot JAJ, Hazebroek MR, Wang P, Sanders-van Wijk S, Merken JJ, Adriaansen YA, van den Wijngaard A, Krapels IPC, Brunner-La Rocca HP, Brunner HG, Heymans SRB. Clinical phenotype and genotype associations with improvement in left ventricular function in dilated cardiomyopathy. Circ Heart Fail 2018;11:e005220. [DOI] [PubMed] [Google Scholar]
- 11. Shah SJ, Katz DH, Selvaraj S, Burke MA, Yancy CW, Gheorghiade M, Bonow RO, Huang CC, Deo RC. Phenomapping for novel classification of heart failure with preserved ejection fraction. Circulation 2015;131:269–279. [DOI] [PMC free article] [PubMed] [Google Scholar]
- 12. Hinton GE, Salakhutdinov RR. Reducing the dimensionality of data with neural networks. Science 2006;313:504–507. [DOI] [PubMed] [Google Scholar]
- 13. Tromp J, Ouwerkerk W, Demissei BG, Anker SD, Cleland JG, Dickstein K, Filippatos G, van der Harst P, Hillege HL, Lang CC, Metra M, Ng LL, Ponikowski P, Samani NJ, van Veldhuisen DJ, Zannad F, Zwinderman AH, Voors AA, van der Meer P. Novel endotypes in heart failure: effects on guideline-directed medical therapy. Eur Heart J 2018;39:4269–4276. [DOI] [PubMed] [Google Scholar]
- 14. Richardson P, McKenna W, Bristow M, Maisch B, Mautner B, O'Connell J, Olsen E, Thiene G, Goodwin J, Gyarfas I, Martin I, Nordet P. Report of the 1995 World Health Organization/International Society and Federation of Cardiology Task Force on the definition and classification of cardiomyopathies. Circulation 1996;93:841–842. [DOI] [PubMed] [Google Scholar]
- 15. Pinto YM, Elliott PM, Arbustini E, Adler Y, Anastasakis A, Bohm M, Duboc D, Gimeno J, de Groote P, Imazio M, Heymans S, Klingel K, Komajda M, Limongelli G, Linhart A, Mogensen J, Moon J, Pieper PG, Seferovic PM, Schueler S, Zamorano JL, Caforio AL, Charron P. Proposal for a revised definition of dilated cardiomyopathy, hypokinetic non-dilated cardiomyopathy, and its implications for clinical practice: a position statement of the ESC working group on myocardial and pericardial diseases. Eur Heart J 2016;37:1850–1858. [DOI] [PubMed] [Google Scholar]
- 16. Merlo M, Pivetta A, Pinamonti B, Stolfo D, Zecchin M, Barbati G, Di Lenarda A, Sinagra G. Long-term prognostic impact of therapeutic strategies in patients with idiopathic dilated cardiomyopathy: changing mortality over the last 30 years. Eur J Heart Fail 2014;16:317–324. [DOI] [PubMed] [Google Scholar]
- 17. Ware JS, Amor-Salamanca A, Tayal U, Govind R, Serrano I, Salazar-Mendiguchía J, García-Pinilla JM, Pascual-Figal DA, Nuñez J, Guzzo-Merello G, Gonzalez-Vioque E, Bardaji A, Manito N, López-Garrido MA, Padron-Barthe L, Edwards E, Whiffin N, Walsh R, Buchan RJ, Midwinter W, Wilk A, Prasad S, Pantazis A, Baski J, O’Regan DP, Alonso-Pulpon L, Cook SA, Lara-Pezzi E, Barton PJ, Garcia-Pavia P. Genetic etiology for alcohol-induced cardiac toxicity. J Am Coll Cardiol 2018;71:2293–2302. [DOI] [PMC free article] [PubMed] [Google Scholar]
- 18. Becker MAJ, Cornel JH, van de Ven PM, van Rossum AC, Allaart CP, Germans T. The prognostic value of late gadolinium-enhanced cardiac magnetic resonance imaging in nonischemic dilated cardiomyopathy: a review and meta-analysis. JACC Cardiovasc Imaging 2018;11:1274–1284. [DOI] [PubMed] [Google Scholar]
- 19. Rieger AC, Myerburg RJ, Florea V, Tompkins BA, Natsumeda M, Premer C, Khan A, Schulman IH, Vidro-Casiano M, DiFede DL, Heldman AW, Mitrani R, Hare JM. Genetic determinants of responsiveness to mesenchymal stem cell injections in non-ischemic dilated cardiomyopathy. EBioMedicine 2019;48:377–385. [DOI] [PMC free article] [PubMed] [Google Scholar]
- 20. Cheng ML, Wang CH, Shiao MS, Liu MH, Huang YY, Huang CY, Mao CT, Lin JF, Ho HY, Yang NI. Metabolic disturbances identified in plasma are associated with outcomes in patients with heart failure: diagnostic and prognostic value of metabolomics. J Am Coll Cardiol 2015;65:1509–1520. [DOI] [PubMed] [Google Scholar]
- 21. Verdonschot JAJ, Wang P, Van Bilsen M, Hazebroek MR, Merken JJ, Vanhoutte EK, Henkens M, Van Den Wijngaard A, Glatz JFC, Krapels IPC, Brunner HG, Heymans SRB, Bierau J. Metabolic profiling associates with disease severity in nonischemic dilated cardiomyopathy. J Card Fail 2020;26:212–222. [DOI] [PubMed] [Google Scholar]
- 22. Caforio ALP, Adler Y, Agostini C, Allanore Y, Anastasakis A, Arad M, Böhm M, Charron P, Elliott PM, Eriksson U, Felix SB, Garcia-Pavia P, Hachulla E, Heymans S, Imazio M, Klingel K, Marcolongo R, Cerinic MM, Pantazis A, Plein S, Poli V, Rigopoulos A, Seferovic P, Shoenfeld Y, Zamorano JL, Linhart A. Diagnosis and management of myocardial involvement in systemic immune-mediated diseases: a position statement of the European Society of Cardiology Working Group on Myocardial and Pericardial Disease. Eur Heart J 2017;38:2649–2662. [DOI] [PubMed] [Google Scholar]
- 23. Muchir A, Wu W, Choi JC, Iwata S, Morrow J, Homma S, Worman HJ. Abnormal p38alpha mitogen-activated protein kinase signaling in dilated cardiomyopathy caused by lamin A/C gene mutation. Hum Mol Genet 2012;21:4325–4333. [DOI] [PMC free article] [PubMed] [Google Scholar]
- 24. Hasselberg NE, Haland TF, Saberniak J, Brekke PH, Berge KE, Leren TP, Edvardsen T, Haugaa KH. Lamin A/C cardiomyopathy: young onset, high penetrance, and frequent need for heart transplantation. Eur Heart J 2018;39:853–860. [DOI] [PMC free article] [PubMed] [Google Scholar]
- 25. Kober L, Thune JJ, Nielsen JC, Haarbo J, Videbaek L, Korup E, Jensen G, Hildebrandt P, Steffensen FH, Bruun NE, Eiskjaer H, Brandes A, Thogersen AM, Gustafsson F, Egstrup K, Videbaek R, Hassager C, Svendsen JH, Hofsten DE, Torp-Pedersen C, Pehrson S; DANISH Investigators. Defibrillator implantation in patients with nonischemic systolic heart failure. N Engl J Med 2016;375:1221–1230. [DOI] [PubMed] [Google Scholar]
- 26. O'Mahony C, Jichi F, Pavlou M, Monserrat L, Anastasakis A, Rapezzi C, Biagini E, Gimeno JR, Limongelli G, McKenna WJ, Omar RZ, Elliott PM, for the Hypertrophic Cardiomyopathy Outcomes Investigators. A novel clinical risk prediction model for sudden cardiac death in hypertrophic cardiomyopathy (HCM risk-SCD). Eur Heart J 2014;35:2010–2020. [DOI] [PubMed] [Google Scholar]
Associated Data
This section collects any data citations, data availability statements, or supplementary materials included in this article.
Supplementary Materials
Data Availability Statement
The data that support the findings of this study are available from the corresponding author on reasonable request.