

Abstract
Rasgulla was developed using different levels of coconut sap and sucrose in cooking and soaking syrups by incorporating defatted soy flour in chhana (heat acid coagulated dairy product) ballsmade from milk (4% fat). Six different levels of sucrose and coconut sap were used: (1) 100:0 (SR); (2) 80:20 (SCR1), (3) 60:40 (SCR2), (4) 40:60 (SCR3), (5) 80:20 (SCR4) and (6) 0:100 (SCR5). Complete replacement of sucrose by coconut sap was not possible due to degradation of physico-chemical properties of it by direct heat treatment at higher temperatures. Low sucroseand high protein content rasgulla with overall acceptable quality can be developed by 20:80 ratio of sucrose to coconut sap syrup.
Keywords: Defatted soy flour, Sucrose, Coconut sap, Protein, Rasgulla, Overall acceptability
Introduction
India is the largest milk producer and accounts for nearly 21.29% of world milk production (National Dairy Development Board (NDDB), 2017). Export of Indian dairy products was 1,13,721.70 million tons to the world whose value is Rs. 2422.85 crores (345.71 USD) during the year 2018–19 (Agricultural and Processed Food Products Export Development Authority, Ministry of Commerce and Industry, Government of India). The principle fundamental limitation of milk i.e., perishable nature, is overcome by producing value added products from milk. Traditional Indian dairy products consumed in the country, account for over 90% of all the dairy products (Aneja et al. 2002). Moreover, 50–55% of the milk produced is converted to indigenous milk products such as rasgulla, chhana, yogurt etc. (Aneja et al. 2002; Kumar et al. 2005). Rasgulla is most popular in regions of South Asia, manufactured from Chhana (coagulated milk precipitate by heat and acid treatment) balls. A proportion of 100 g of rasgulla contains 186 kcal in which carbohydrates comprise 153 kcal, fats account for 17 kcal and proteins make up the remaining 16 kcal. Rasgulla is a sucrose heavy dessert since it is boiled and served in sucrose syrup.
India ranked first in diabetic patients (8.7%) according to World Health Organization (2015) and approximately 64.67% of the world’s population is obese. Major reason of obesity and diabetes is intake of high percentage of carbohydrate diet. Use of alternative natural sweetener can help the people who want to enjoy the sweet taste by avoiding use of sucrose, which may also manage the risks of diabetes, and cardiovascular disease (Arora et al. 2006; Kroger et al. 2006). Hence, rasgulla production using alternative natural sweeteners is a need for health conscious consumers. To make rasgulla more nutritive, protein and dietary fiber content should be increased and sucrose content should be minimized.
Among natural alternative sweeteners, Coconut sap, released from the tapped the flower bud stem of a coconut tree is a versatile sweetener used in value added products such as coconut sucrose, candies, juices etc. Coconut sap contained sucrose, glucose and fructose as well as other nutrients such as minerals, vitamins, antioxidants and phytochemicals (Hebbar et al. 2015). Coconut sap has been considered as low glycemic index sweetener (Hebbar et al. 2015).
Some research has been carried out in order to develop more nutritious and healthy Rasgulla formulations. Rasgulla has been prepared by adding different levels of soy milk to cow’s milk to increase protein content in a research (Chanda 1999). Chavan et al. (2014) made an attempt to prepare diabetic rasgulla using sorbitol and aspartame. Garg et al. (2014) prepared herbal rasgulla with mucilage to make it more nutritional. Kaur and Goswami (2018) developed diabetic rasgulla using stevia along with sucrose.
The objective of the present study was to evaluate the possibility of development of rasgulla using defatted soy flour, sucrose and coconut sap. The physico-chemical and sensory properties of rasgulla were also evaluated.
Materials and methods
Fresh cow milk was brought from local area of Indian Institute of TechnologyKharagpur and milk fat was standardized to 4% and chhana quality was analyzed. Milk fat was measured by Gerber method and pH was determined by digital pH meter (Model L1-120, Elico Private Ltd., Hyderabad, India). Maida (nutritional information given by manufacturers: 8.2% protein, 1.7% dietary fiber and 78% total carbohydrates), lime and sucrose were purchased from technology market, IIT Kharagpur and defatted soy flour (nutritional information given by manufacturers: 51% protein, 18% dietary fiber and 34% total carbohydrates) was purchased from Khyati Foods Pvt. Ltd., Bhopal, MP, India. Fresh coconut sap, Kalparasa was collected from Kalyani, West Bengal, India. Coconut sap obtained from coconut tree by CPCRI technology is known as Kalparasa (Hebbar et al. 2015).
Preparation of samples
Rasgulla was prepared by traditional method from milk (4% fat, 8.60% (± 0.56) solid not fat (SNF) and 6.60 pH). Milk was boiled and then cooled to 72 °C. Freshly prepared hot citric acid (1% w/v and 72 °C) was added slowly to milk for coagulation. The milk and coagulant mixture was stirred slowly till appearance of greenish yellow color of whey. The mixture was left to settle for 10 min. The coagulated mass was collected in a muslin cloth by dripping the whey and washed under running tap water for 1–2 min. Obtained chhana (50–56% moisture content, 22–23% fat and 17.5–18.6% protein) was kneaded with Maida (finely milled without any bran, refined, and bleached)or defatted soy flour (25 g/kg of chhana). Chhana dough was then cut into pieces each of about 10 g. Each piece was molded into round balls in palms of hand with no cracks on surface.
Six samples of rasgullas were developed by incorporating defatted soy flour and by changing the levels of coconut sap and sucrose along with control sample. Cooking and soaking syrup were prepared separately for all samples and formulation of treatments was done as shown in Table 1. For CR, cooking and soaking syrup concentrations were 50ºBrix and 40ºBrix respectively.
Table 1.
Formulations of rasgulla treatment
| Ingredients | Treatments | ||||||
|---|---|---|---|---|---|---|---|
| CR | SR | SCR1 | SCR2 | SCR3 | SCR4 | SCR5 | |
| Chhana (g) | 100 | 100 | 100 | 100 | 100 | 100 | 100 |
| Maida (g) | 2.5 | 0 | 0 | 0 | 0 | 0 | 0 |
| Defatted soy flour (g) | 0 | 2.5 | 2.5 | 2.5 | 2.5 | 2.5 | 2.5 |
| Sucrose (%)* | 100 | 100 | 80 | 60 | 40 | 20 | 0 |
| Coconut sap* (%) | 0 | 0 | 20 | 40 | 60 | 80 | 100 |
*Sucrose and coconut sap in percentages show the concentration of each in cooking and soaking syrups
Coconut sap concentration was taken according to same degree of Brix as syrup made by coconut sucrose taking same weight ratio to sucrose. Proximate composition of coconut sap was determined by standard methods (AOAC 2000). Samples were soaked at 4 °C in soaking syrup and analysis was done after 8 h of soaking.
Proximate analysis of samples
Proximate composition (moisture, fat, protein, sucrose, and ash) of rasgulla samples were analyzed as per the method is given in ISI: 4079 (1967) and dietary fiber of rasgulla samples was analyzed by Official Methods of Analysis of AOAC International (2003), (AOAC 985.29).
pH and acidity measurements of syrups
A digital pH meter was used to measure the pH value of syrup. The acidity of syrup was measured by the procedure given in ISI: 4079 (1967). 20 mL of filtered syrup of each treatment was titrated against 0.1 N NaOH solution using phenolphthalein as indicator. The acidity of syrup expressed in terms of mL of 0.1 N NaOH per 100 mL of syrup.
Color measurements
A Hunter Lab color measurement system, (Hunter Associates Laboratory Inc., Reston, Va., USA) was used to measure color intensity in Rasgulla samples and procedure was followed by Kaur and Goswami (2018). Color was expressed in terms of ‘L’ (0 = black, 100 = white), ‘a’ (‘−’ = green, ‘+’ = red) and ‘b’ (‘−’ = blue, ‘+’ = yellow) values. All results are indicated as mean value ± standard deviation. Whitening index of samples was calculated by Eq. (1) as given below:
| 1 |
Textural properties measurement
Textural analysis of samples was determined by Stable microsystem TA × T2i Texture analyzer with load cell (25 kg), chart speed (30 mm/min) and cross head speed (30 mm/min). Sampling was done according to procedure given by ISI (1967). Hardness, cohesiveness, gumminess, springiness and chewiness were calculated for each treatment.
Sensory evaluation
Sensory test of samples was performed by 15 panelists (all experts from IIT Kharagpur, India). Standard sensory procedures were followed. Samples quality attributes were taste, flavor, mouthfeel (includes texture), color and overall acceptability as per 9 point Hedonic scale (Piggott 1984). To determine the acceptability of product fuzzy logic was applied (Jaya and Das 2003). Similarity values for samples and quality attributes were calculated along with their ranking of acceptance.
Statistical analysis
The statistical analysis of proximate composition, pH, acidity, and the color was performed by one-way variance analysis (n = 3) with the help of IBM SPSS statistics software. The critical difference to calculate the statistical significance between treatments was determined as mentioned by Gacula and Singh (1984) and values are given in mean ± standard deviation (SD). The mean differences were determined by using the Duncan test (p ≤ 0.05).
Results and discussion
Concentration of coconut sap was measured by pocket refractometer (ATAGO PAL-3). Coconut sap contained 83.93% moisture content, 12.39% sucrose, 1.8% ash, 1.13% protein content and 6.6 pH value at concentration of 16.27 º Brix for cooking syrup. The concentration of coconut sap was 12.36 ºBrix for soaking syrup and composition of coconut sap was 87.34% moisture content, 10.12% sucrose, 1.6% ash, 1.04% protein content and 6.8 pH value for soaking syrup.
Proximate composition of samples
The proximate composition of all treatments is shown in Table 2. Sample with SCR5 treatment couldn’t develop due to high degradation of coconut sap. The moisture and sucrose content of rasgulla decreased and fat, protein and dietary fiber content increased as the concentration of coconut sapincreased in syrups, but the values were in range as defined by Bureau of Indian Standards in ISI: 4079. An increment in fat content of rasgulla might be due to less loss of fat in syrup during cooking assucrose content in syrup decreased. Studies showed that sucrose rises the boiling temperature of syrup. So, as the ratio of sucrose to coconut sap decreased in syrup, rise in boiling point decreased and loss of fat in syrup from rasgulla sample decreased. No significant difference (p > 0.05) was observed in moisture, fat and sucrose content of CR and SR. Protein content increased in SR and SCR samples prepared by the addition of defatted soy flour in chhana balls and protein content of rasgulla prepared in syrups having coconut sap showed decrement that might occur due to fat increment. Sucrose content decreased significantly as coconut sap concentration increased, Purnomo and Mufida (2004) reported that sucrose content in coconut sapis less. Dietary fiber percentage increased due to incorporation of defatted soy flour and coconut sap. But there was no significant difference (p > 0.05) in other treatments (SCR1, SCR2, SCR3, and SCR4). However, incorporating defatted soy flour to chhana can give high protein and dietary fiber to rasgulla and coconut sap can decrease a large amount of sucrose from rasgulla.
Table 2.
Proximate composition of rasgulla samples and pH and acidity of syrup
| Treatment | MC (%) | Fat (%) | Protein (%) | Sucrose (%) | Ash (%) | Dietary fiber (%) | pH | Acidity (ml of 0.1 N NaOH/100 ml of syrup) |
|---|---|---|---|---|---|---|---|---|
| CR | 52.20 ± 0.07a | 5.62 ± 0.17a | 6.82 ± 0.13a | 38.55 ± 0.38a | 1.06 ± 0.06a | 0.37 ± 0.04a | 5.71 ± 0.19a | 4.21 ± 0.11a |
| SR | 52.16 ± 0.13a | 5.60 ± 0.12a | 12.43 ± 0.35b | 38.11 ± 0.12a | 1.55 ± 0.10b | 3.06 ± 0.09b | 5.75 ± 0.17a | 4.18 ± 0.11a |
| SCR1 | 51.06 ± 0.10a | 5.68 ± 0.12a | 12.31 ± 0.25b | 32.11 ± 0.26a | 1.45 ± 0.11b | 3.26 ± 0.10b | 5.63 ± 0.06a | 4.24 ± 0.06a |
| SCR2 | 50.67 ± 0.14b | 5.71 ± 0.16b | 11.93 ± 0.36c | 26.02 ± 0.14b | 1.52 ± 0.09b | 3.66 ± 0.15c | 5.02 ± 0.09b | 4.73 ± 0.05b |
| SCR3 | 50.02 ± 0.30b | 5.86 ± 0.16b | 11.37 ± 0.11d | 20.63 ± 0.30c | 1.56 ± 0.06b | 3.95 ± 0.12d | 4.91 ± 0.08c | 5.32 ± 0.06c |
| SCR4 | 49.93 ± 0.25b | 6.12 ± 0.17c | 11.03 ± 0.22d | 16.71 ± 0.25d | 1.61 ± 0.05b | 4.19 ± 0.14e | 4.82 ± 0.07e | 5.99 ± 0.09e |
All values are given in mean ± SD where n = 3
a−eValues with the same superscript within the same column are not significantly different (p > 0.05)
pH and acidity value of syrups
It can be seen from Table 2 that pH of samples decreased and acidity increased as coconut sap concentration increased and that might be due to the fermentation of coconut sap (Shetty et al. 2017). Atputharajah et al. (1986) observed similar results while processing of coconut palm sap. But there was not a significant difference (p > 0.05) observed in between treatments CR and SR.
Color parameters
Color values of all treatments are shown in Table 3. In CR and SR treatments L and a values did not show any significant difference (p > 0.05). L value for treatments increased as coconut sap concentration in syrups increased. Negative ‘a’ value of samples indicated some greenish tint presence in samples and ‘a’ value increased as coconut sap increased in syrup. Yellowness ‘b’ value increased as coconut sap concentration increased in syrups. No significant difference (p > 0.05) was observed in SCR2, SCR3, and SCR4 treatments.
Table 3.
Color values andtextural parameters of rasgulla samples at 4 °C
| Treatment | Color Values | Textural Parameters | ||||||
|---|---|---|---|---|---|---|---|---|
| L | a | b | Hardness (N) | Cohesiveness | Gumminess (N) | Springiness (mm) | Chewiness (N-mm) | |
| CR | 67.23 ± 0.21a | − 0.8 ± 0.02a | 12.27 ± 0.10a | 1.32 ± 0.13a | 0.80 ± 0.03a | 1.06 ± 0.10a | 0.96 ± 0.05a | 1.01 ± 0.15a |
| SR | 67.1 ± 0.13a | − 0.78 ± 0.05a | 13.89 ± 0.07b | 1.36 ± 0.10a | 0.82 ± 0.03a | 1.12 ± 0.12a | 0.98 ± 0.05a | 1.10 ± 0.15a,b |
| SCR1 | 68.20 ± 0.15b | − 0.62 ± 0.05b | 12.58 ± 0.06a | 1.43 ± 0.09b | 0.85 ± 0.02b | 1.22 ± 0.08b | 0.93 ± 0.04b | 1.13 ± 0.10b |
| SCR2 | 69.28 ± 0.07c | − 0.5 ± 0.04c | 12.84 ± 0.11a,b | 1.49 ± 0.11b,c | 0.87 ± 0.04b | 1.30 ± 0.08c | 0.89 ± 0.03c | 1.15 ± 0.06b |
| SCR3 | 71.61 ± 0.10d | − 0.43 ± 0.04d | 13.51 ± 0.05b | 1.51 ± 0.06c | 0.90 ± 0.04c | 1.36 ± 0.06d | 0.87 ± 0.03c,d | 1.18 ± 0.09b.c |
| SCR4 | 72.05 ± 0.07e | − 0.38 ± 0.06e | 14.01 ± 0.04b | 1.53 ± 0.04c | 0.92 ± 0.06c | 1.41 ± 0.05e | 0.85 ± 0.04d | 1.20 ± 0.11c |
Whitening index of rasgulla samples is shown in Fig. 1, it can be seen that WI increased as coconut sap concentration increased in syrups due to decrease of sucrose content in samples. But WI of SR was lower than CR that showed the presence of defatted soy flour in the sample, because adding defatted soy flour decreased the’ L’ value due to color of flour so WI decreased. Kaur and Goswami (2018) found similar trend of whitening index while using defatted soy flour with different proportion stevia and sucrose in cooking and soaking syrup.
Fig. 1.
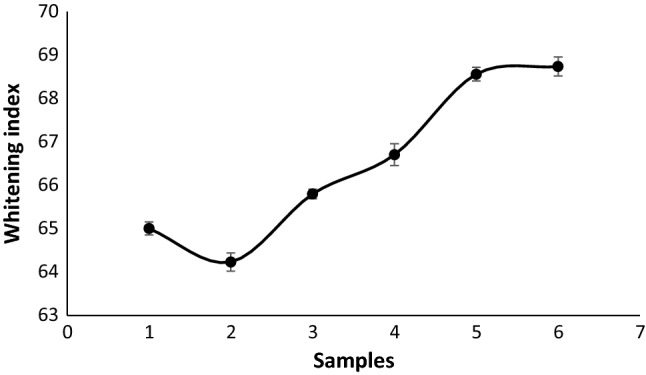
Whitening index of samples
Textural properties measurement
Textural parameters are shown in Table 3 for all treatments. Hardness of CR didn’t differ significantly from SR and differed significantly (p ≤ 0.05) from all other treatments. Hardness of rasgulla samples slightly increased as coconut sap concentration in syrup increased that may be due to less moisture content in samples. No significant difference was observed in hardness of SCR1, SCR2 SCR3 and SCR4. An increase in cohesiveness and decrease in springiness was observed as coconut sap concentration increased, might be due to slight increase in fat content of samples. Gumminess and chewiness were calculated from hardness, cohesiveness and springiness. Chewiness of samples increased as coconut sap concentration increased and chewiness of CR was significantly different (p ≤ 0.05) from SR and SCR samples that might be due to less moisture, high fat and protein content of rasgulla (Chavan et al. 2014).
Sensory evaluation
Similarity values for all samples were calculated from the 9 point hedonic scale data given by the panelists. It can be seen from Table 4 that for all samples highest similarity values were obtained under the scale factor “satisfactory”. The ranking value among the samples was determined by giving the first rank to the highest value of “satisfactory” factor. Ranking in Table 4 indicated that SR sample was most liked by the panelist and SCR4 was least.
Table 4.
Similarity values of rasgulla samples and their ranking
| Scale factors | CR | SR | SCR1 | SCR2 | SCR3 | SCR4 |
|---|---|---|---|---|---|---|
| Not satisfactory, F1 | 0.0148 | 0.002 | 0.152 | 0.126 | 0.132 | 0.435 |
| Fair, F2 | 0.3 | 0.236 | 0.213 | 0.405 | 0.787 | 0.599 |
| Satisfactory,F3 | 0.907 | 0.922 | 0.912 | 0.696 | 0.428 | 0.213 |
| Good, F4 | 0.593 | 0.767 | 0.603 | 0.137 | 0.123 | 0.071 |
| Very good, F5 | 0 | 0.152 | 0.131 | 0.107 | 0.09 | 0 |
| Excellent, F6 | 0 | 0 | 0 | 0 | 0 | 0 |
| Ranking | III | I | II | IV | V | VI |
To find out the order of importance of quality attribute among all, the ranking of quality attributes of the rasgullas was determined by calculating the similarity values. Table 5 showed that mouthfeel and taste of rasgulla were the “highly important” and similarity value was found highest for mouthfeel, so mouth feel and taste ranked first and second respectively. The color of samples was “necessary” and it ranked last accordingly.
Table 5.
Similarity values of quality attributes of rasgulla samples and their ranking
| Scale factors | Color | Flavor | Taste | Mouthfeel | Overall acceptability |
|---|---|---|---|---|---|
| Not at all necessary | 0.032 | 0 | 0 | 0 | 0 |
| Somewhat necessary | 0.519 | 0 | 0 | 0 | 0 |
| Necessary | 0.986 | 0.141 | 0.063 | 0 | 0.279 |
| Important | 0.419 | 0.812 | 0.614 | 0.91 | 0.924 |
| Highly important | 0.02 | 0.68 | 0.909 | 0.917 | 0.86 |
| Extremely important | 0 | 0.0918 | 0.226 | 0.525 | 0.06 |
| Ranking | V | IV | II | I | III |
Conclusion
Total replacement of sucrose by coconut sap was not possible due to degradation of coconut sap while cooking. Large decrement in sucrose content and increment in dietary fiber of the product as coconut sap increased in syrup, so the product can be eaten by diabetic and health conscious people. Acidity of syrup increased as coconut sap increased due to fermentation quality of coconut sap. Whitening index of rasgulla increased as coconut sap content increased in syrups. Hardness and chewiness of samples increased as coconut sap increased due to less moisture and high protein and dietary fiber content. Sensory evaluation showed that all samples were satisfactory and ranking order for acceptance of product was SR > SCR1 > CR > SCR2 > SCR3 > SCR4. Mouthfeel and taste of rasgulla were highly important quality attributes. So, rasgulla prepared by adding defatted soy flour and cooking and soaking in coconut sap syrup along with sucrose proportion gives a nutritional and organoleptically acceptable product and SCR1 formulation was more preferred.
Acknowledgements
The present study was carried in the laboratories of Department of Agricultural and Food Engineering, Indian Institute of Technology Kharagpur, with the support of Head of Department.
Abbreviations
- CR
Control rasgulla
- SR
Rasgulla prepared using defatted soy flour
- SCR
Rasgulla prepared using defatted soy flour and coconut sap
Compliance with ethical standards
Conflict of interest
The authors declare that they do not have any conflict of interest.
Ethical approval
This study does not involve any human or animal testing.
Footnotes
Publisher's Note
Springer Nature remains neutral with regard to jurisdictional claims in published maps and institutional affiliations.
References
- Aneja RP, Mathur BN, Chandan RC, Banerjee AK. Technology of Indian milk products. Delhi: A Dairy India Publication; 2002. [Google Scholar]
- AOAC International (2000) Association of official analytical chemists. Official methods of analysis of AOAC international, 17 ed., Maryland
- AOAC International (2003) Total dietary fiber in foods, enzymatic-Gravimetric method. Official Methods of Analysis of AOAC International, 17 ed. 985.29. William Horwitz ed. Gaithersburg
- Arora S, Sharma V, Sharma GS, Wadhwa BK. High potency sweeteners for formulating new dairy product. Indian Dairyman. 2006;58:39–45. [Google Scholar]
- Atputharajah JD, Widanapathirana S, Samarajeewa U. Microbiology and biochemistry of natural fermentation of coconut palm sap. Food Microbiol. 1986;3(4):273–280. doi: 10.1016/0740-0020(86)90009-2. [DOI] [Google Scholar]
- Chanda T (1999) Manufacture of rossogolla from cow-milk chhana with addition of different level of soy-milk chhana, M. S. Thesis, Department of Dairy Science Bangladesh Agricultural University, Mymensingh
- Chavan RS, Prajapati PS, Chavan SR, Jana A. Technology for the manufacture of diabetic rosogolla. Crit Rev Food Sci Nutr. 2014;54(7):863–868. doi: 10.1080/10408398.2011.614362. [DOI] [PubMed] [Google Scholar]
- Gacula MC, Singh J. Statistical methods in food and consumer research. Orlando: Academic Press Inc; 1984. pp. 105–114. [Google Scholar]
- Garg P, Raghav PK, Sharma RK, Jasuja ND, Sharma R. Development of mucilaginous spongy dessert—a herbal rassogolla prepared from cow milk. Int J Sci Res Publ. 2014;41:5. [Google Scholar]
- Hebbar KB, Arivalagan M, Manikantan MR, Mathew AC, Thamban C, Thomas GV, Chowdappa P. Coconut inflorescence sap and its value addition as sucrose—collection techniques, yield, properties and market perspective. Curr Sci. 2015;109(8):1–7. doi: 10.18520/cs/v109/i8/1411-1417. [DOI] [Google Scholar]
- Indian Standards Institution . Specification for canned rosogolla (ISI: 4079) ManakBhavan, New Delhi: Indian Standards Institution; 1967. [Google Scholar]
- Jaya S, Das H. Sensory evaluation of mango drinks using fuzzy logic. J Sens Stud. 2003;18:163–176. doi: 10.1111/j.1745-459X.2003.tb00382.x. [DOI] [Google Scholar]
- Kaur G, Goswami TK. Effect of defatted soy flour and concentration of stevia on physico-chemical and sensory characteristics of rasgulla. Asian J Dairy Food Res. 2018;37(3):187–191. [Google Scholar]
- Kroger M, Meister Kand Kava R. Low-calorie sweeteners and other sucrose substitutes: a review of the safety issue. Compr Rev Food Sci Food Saf. 2006;5:35–47. doi: 10.1111/j.1541-4337.2006.tb00081.x. [DOI] [Google Scholar]
- Kumar J, Gupta VK, Patil GR. Studies on improvement of Chhana production using ultrafiltration process. Indian J Dairy Sci. 2005;50:162–168. [Google Scholar]
- NDDB . Statistical database. Anand: National Dairy Development Board; 2017. [Google Scholar]
- Piggott JR. Sensory analysis of foods. New York: Elsevier Applied Science Publishers; 1984. pp. 157–161. [Google Scholar]
- Purnomo Hand Mufida LH. Sucrose components of fresh sap and sap syrup of coconut. ASEAN Food J. 2004;13(3):159–163. [Google Scholar]
- Shetty P, D’Souza A, Poojari S, Narayana J, Rajeeva P. Study of fermentation kinetics of palm sap from cocosnucifera. Int J Appl Sci Biotechnol. 2017;5(3):375–381. doi: 10.3126/ijasbt.v5i3.18297. [DOI] [Google Scholar]
- World Health Organization (WHO) Diabetes country profiles. Geneva: World Health Organization; 2015. [Google Scholar]