Abstract
Lung adenocarcinoma (LUAD) is characterized by high infiltration and rapid growth. The function of the stem cell population is to control and maintain cell regeneration. Therefore, it is necessary to study the prognostic value of stem cell-related genes in LUAD. Signature genes were screened out from 166 stem cell-related genes according to the least absolute shrinkage operator (LASSO) and subsequently multivariate Cox regression analysis, and then established risk model. Immune infiltration and nomogram model were used to evaluate the clinical efficacy of signature. A signature consisting of 10 genes was used to dichotomize the LUAD patients into two groups (cutoff, 1.314), and then validated in GSE20319 and GSE42127. There was a significant correlation between signature and clinical characteristics. Patients with high-risk had a shorter overall survival. Furthermore, significant differences were found in multiple immune cells between the high-risk group and low-risk group. A high correlation was also reflected between signature and immune infiltration. What’s more, the signature could effectively predict the efficacy of chemotherapy in patients with LUAD, and a nomogram based on signature might accurately predict the prognosis of patients with LUAD. The signature-based of stem cell-related genes might be contributed to predicting prognosis of patients with LUAD.
Subject terms: Cancer, Immunology, Stem cells
Background
Lung adenocarcinoma refers to a malignant tumor originating from lung epithelial tissue, which is a type of non-small cell lung cancer. In recent years, the incidence rate has gradually increased. In addition, due to the limitations of diagnosis and treatment, the mortality rate of LUAD ranks first in malignant tumors1. Tumor stem cells refer to cells that have self-renewal ability and can produce heterogeneous tumor cells, which play a significant role in tumor survival, proliferation, metastasis, and recurrence2,3. The ability of tumor stem cells to move and migrate makes tumor cells migration possible, at the same time, cancer stem cells can stay dormant for a long time and have a variety of drug-resistant molecules, but are not sensitive to external physical and chemical factors that kill tumor cells, which leads to the result that tumors often relapse after conventional cancer treatment eliminates most common tumor cells4,5. So, genes related to stem cells should also have these characteristics.
The treatment plan and survival period of patients with LUAD are affected by many factors, but the TNM stage of tissue cells may be one of the vital factors in determining the treatment plan and estimating prognosis. TNM stage is based on anatomy and is a description of the cumulative range of tumors. However, it should be emphasized that the TNM stage also has shortcomings including the uneven source of case data and the relatively complicated stage of N. With the gradual development of diagnosis and treatment technology, we found that molecular markers have a greater prognosis for patients. Studying the genetic functions and pathways of LUAD could contribute to establishing prognostic markers and therapeutic targets, which could accurately and comprehensively predict the prognosis of LUAD6. Therefore, the idea, which constructed signature through cancer stem cell-related genes provides a new direction for the diagnosis and treatment of LUAD and the regulatory mechanism of stem cell-related genes still requires further digging.
In this research, we constructed a signature of 10 genes as a prognostic target for lung adenocarcinoma. Meanwhile, we analyzed the types of immune cells in LUAD, given that multiple pathways in the gene enrichment analysis are related to immunity, to understand the connection between stem cell-related genes and the immune microenvironment.
Materials and methods
Data acquisition and selection
The RNA-sequencing and clinical traits information of LUAD were obtained from The Cancer Genome Atlas (TCGA) database (https://portal.gdc.cancer.gov) and Gene Expression Omnibus (GEO) database (https://www.ncbi.nlm.gov/geo/) that were served as training cohort and validation cohort, respectively. Both data sets were whole-genome sequencing, and the sequenced data included tumor cells and non-tumor cells. This study mainly focused on cancer stem cells rather than normal stem cells. Cancer stem cells are cells in tumors that have the ability to self-renew and produce heterogeneous tumors and are part of tumor cells. Therefore, the sequencing data of both data sets contained the data of cancer stem cells. The FPKM (Fragment Per Kilobase per Million) data with level 3 from the TCGA database was used in this study. After classification and regularization, there were 497 tumor samples in the TCGA database. At the same time, when merging clinical information, missing and incomplete samples were deleted. Besides, 166 tumor stem cell-related genes were downloaded from the cancerSEA database7 to prepare for further signature construction. GSE30219 was conducted by GPL570 (Affymetrix Human Genome U133 Plus 2.0 Array)8. GSE42127 was conducted by GPL6884 (Illumina HumanWG-6 v3.0 expression bead chip)9.
Signature construction and verification
It was worth emphasizing that the RStudio was an indispensable key tool for us to construct and verify a signature next. The signature was established by a two-step method, the first step was least absolute shrinkage operator (LASSO) Cox regression, using the “glmnet” package (versions 3.0.1), and the second step was multivariate Cox regression, using the “survival” package (versions 3.1.8). Patients were divided into low-risk and high-risk groups based on the cutoff of risk score, which was calculated by formula as follows: HR 1 × gene 1 expression + HR 2 × gene 2 expression … + HR n × gene n expression10. In the TCGA and GEO cohorts, the risk curve was drawn to describe further the relationship between the patients' risk value and survival states and protein expression, the Kaplan–Meier curve and ROC curve were used to verify the reliability of the signature11.
Gene set enrichment analysis (GSEA)
GSEA is a method used to evaluate the distribution trend of genes in the gene list sorted by phenotype correlation and to understand gene positioning, function, and biological significance. The GSEA (https://www.gsea-msigdb.org/gsea/downloads.jsp) analysis method used a predefined gene set, usually from functional annotations or the results of previous experiments, to rank the genes according to the degree of differential expression in the two types of samples, and then checked whether the preset gene set was at the top of the ranking list or bottom enrichment. We presented the GO term and the KEGG pathway of the signature which was constructed by stem cell-related genes to further analyze its possible biological functions12. The number of permutations was set to 1000, and our selection criteria are closely related to a nominal P-value (p < 0.05).
Immune infiltration analysis
TIMER database, providing six types of immune cell infiltration and using RNA-Seq expression profiling data to detect immune cell infiltration in tumor tissue, was used to appraise potential links between risk grouping and tumor-infiltrating immune cells (TIICs). Deconvolution is a newly released statistical method that allows TIMER to infer the incidence of TICC from gene expression profiles. CIBERSORT (http://cistrome.shinyappes), a deconvolution algorithm, can estimate the cell composition of complex tissues based on standardized gene expression data, and the method can be used to analyze specific cell types. With CIBERSORT, we can visualize the composition of immune cells in tumor samples of LUAD, and standard annotation files established gene expression datasets. P-value (p < 0.05) was a significant criterion to determine the type of immune cells affected by grouping13.
Analysis of therapeutic efficacy and mRNA expression-based stemness index (mRNAsi)
Some patients from TCGA recorded the results of the evaluation of the efficacy after the first treatment of radiotherapy and chemotherapy, which also provided a direction for us to verify the reliability of the signature in terms of efficacy. According to Response Evaluation Criteria in Solid Tumors (RECIST) and risk score, this part of patients was classified to compare whether there were differences between different therapeutic effects14. In recent years, literature has proposed the concept of mRNA expression-based stemness index (mRNAsi), which was calculated by a predictive model with an OCLR algorithm based on pluripotent stem cell samples from the Progenitor Cell Biology Consortium dataset (https://bioinformaticfmrp.github.io/PanCanStem_Web/). Specifically, the Spearman correlation algorithm (RNA expression data) contributed to the stem index model to score LUAD samples in the TCGA dataset. The stem indices were then mapped to the [0, 1] range by using a linear transformation that subtracted the minimum and divide by the maximum. The index is closer to 1, which indicated that the cell differentiation was worse, and the characteristic of stem-cell related genes was stronger. We merged mRNAsi into our signature to compare whether there was a difference between low- and high- risk groups15.
Clinical correlation analysis
Univariate and multivariate Cox regression analyses were used to determine independent predictors of OS in LUAD. The predictive value of signature and other clinical factors were evaluated by the area under the ROC curve. Besides, we have developed a nomogram containing risk scores and clinical information to transform the prognostic value of the signature into clinical use. The nomogram was internally validated using bootstraps with 1000 resamples. The nomogram was composed of independent prognostic factors that were previously screened out, using the “rms” package (version 5.1.4). Each factor was assigned a weight according to its influence on the prognosis. According to the weight of each factor, the corresponding score was obtained to predict the patient’s 1, 3, 5-year survival rate. The higher the score, the worse the prognosis.
Result
Construction of Signature in TCGA
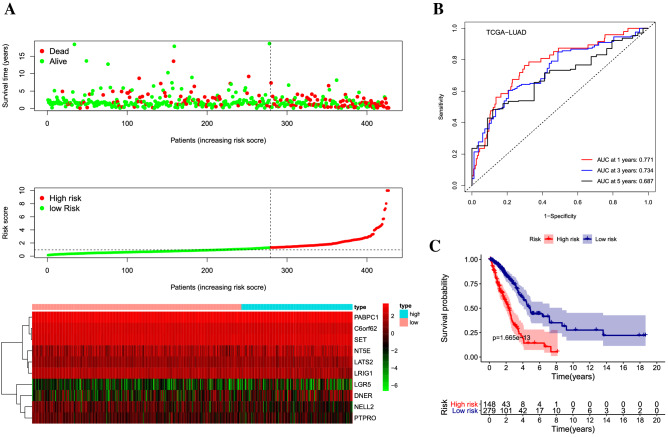
All cancer stem cell-related genes were downloaded from CancerSEA (http://biocc.hrbmu.edu.cn/CancerSEA/home.jsp). Nineteen stem cell-related genes associated with OS (p < 0.05) were measured as predictive stem cell-related genes for LASSO analysis (Supplementary Information 1–2). Through multivariate COX regression, we select ten stem cell-related genes to construct a robust signature for LUAD (Tables 1, 2). The calculation formula of the risk score is as follows: risk score = 0.578 × expression C6orf62 + 1.24 × expression DNER + 0.737 × expression NELL2 + 1.404 × expression LATS2 + 1.202 × expression LGR5 + 0.676 × expression PTPRO + 0.718 × expression LRIG1 + 1.306 × expression PABPC1 + 1.126 × expression NT5E + 1.458 × expression SET. In the calculation, the mRNA expression value (FPKM) was used to calculate the risk score. According to the cutoff (1.314) of risk scores, patients in TCGA were divided into low-risk group and high-risk group16. The risk curve can clearly show the relationship between survival status, survival time, and expression of stem cell-related genes and risk score17 (Fig. 1A). The area under the ROC curve for 1, 3, 5-year were 0.771, 0.734, 0.687 (Fig. 1B). In ROC analysis, the survival status of the same patients at 1, 3, and 5 years is inconsistent, which also leads to their inconsistency in AUC at one, three, and five years. In fact, AUC may not necessarily decline with increasing time, but may also increase. Herein, our study shows that AUC decreases gradually with increasing time. The survival analysis suggested that the overall survival rate of the low-risk group was higher than that of the high-risk group (P < 0.001). The 5-year survival rate of the low-risk group was close to 50%, while the 5-year survival rate of the high-risk group was only 20% (Fig. 1C).
Table 1.
ENSEMBL/Entrez gene ID.
| ID | EntrezID |
|---|---|
| C6orf62 | 81,688 |
| DNER | 92,737 |
| NELL2 | 4753 |
| LATS2 | 26,524 |
| LGR5 | 8549 |
| PTPRO | 5800 |
| LRIG1 | 26,018 |
| PABPC1 | 26,986 |
| NT5E | 4907 |
| SET | 6418 |
Table 2.
Independent factors in the signature.
| ID | coef | HR | HR.95L | HR.95H | P value |
|---|---|---|---|---|---|
| C6orf62 | − 0.73221 | 0.480847 | 0.312891 | 0.738959 | 0.000838 |
| DNER | 0.195561 | 1.215993 | 1.073065 | 1.377959 | 0.002174 |
| NELL2 | − 0.34583 | 0.707635 | 0.533484 | 0.938635 | 0.016425 |
| LATS2 | 0.38125 | 1.464113 | 1.100657 | 1.947588 | 0.008826 |
| LGR5 | 0.251941 | 1.28652 | 1.076618 | 1.537345 | 0.005566 |
| PTPRO | − 0.44697 | 0.639564 | 0.430824 | 0.94944 | 0.026599 |
| LRIG1 | − 0.26479 | 0.767366 | 0.633265 | 0.929864 | 0.006893 |
| PABPC1 | 0.246554 | 1.279608 | 0.983828 | 1.664311 | 0.066004 |
| NT5E | 0.132706 | 1.141914 | 1.006795 | 1.295166 | 0.038888 |
| SET | 0.414622 | 1.513798 | 1.03377 | 2.216727 | 0.033119 |
Figure 1.
Construction of signature. (A) The risk curve in the TCGA cohort displayed the patients’ risk score, survival time, and status, and expression of stem cell-related genes. The scales represented the expression level of each gene in each sample, which was established based on z-score transformed expression data. (B) ROC curve illustrated the risk prediction of the signature for 1, 3, and 5-year in the TCGA cohort. (C) Kaplan–Meier survival revealed the overall survival among different risk stratification groups.
Validation of the signature in GEO
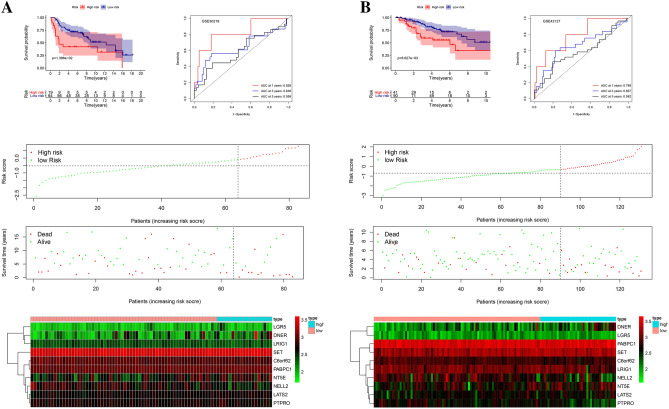
To further verify the feasibility of the gene signature, we verified through the GEO database. In GSE20319 and GSE42127, the relationship between survival status, survival time, and the expression of the stem cell-related genes and risk score was consistent with the conclusion in TCGA. In GSE30219, the cut-offs value of the risk score between the high and low-risk group was − 0.085, the area under the ROC curve was 0.826, 0.638, and 0.599 in 1, 3, and 5-year survival rates, respectively. One of the more worthwhile was that in GSE42127, the cut-offs value of the risk score between the high and low-risk group was -0.316, the area under the ROC curve was 0.788, 0.657, and 0.582. Besides, The survival analysis in GSE30219 and GSE42127 revealed that the overall survival rate of the low-risk group was significantly better than that of the high-risk group (p < 0.05). This series of external verification fully demonstrated the feasibility and accuracy of our signature18 (Fig. 2).
Figure 2.
Validation of the signature in GEO. (A) Kaplan–Meier survival, ROC curve, and risk plot were used to verify the signature in the GSE30219. (B) Kaplan–Meier survival, ROC curve, and risk plot were used to validate the signature in the GSE42127.
Subgroup analysis
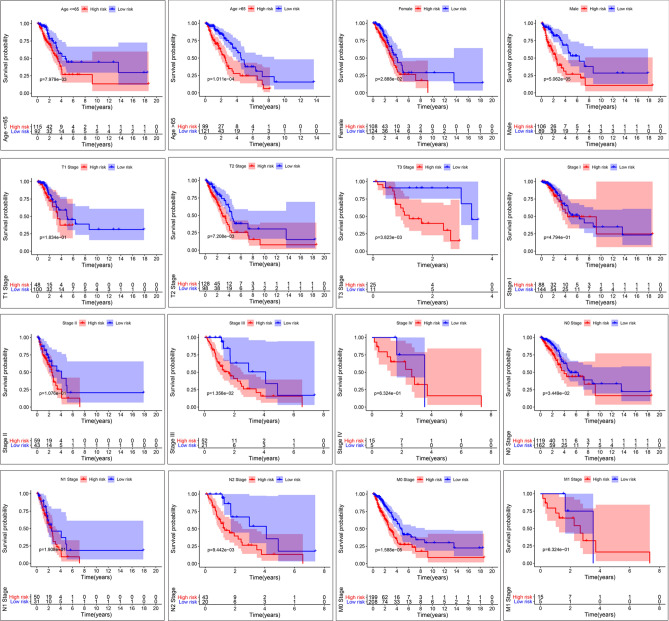
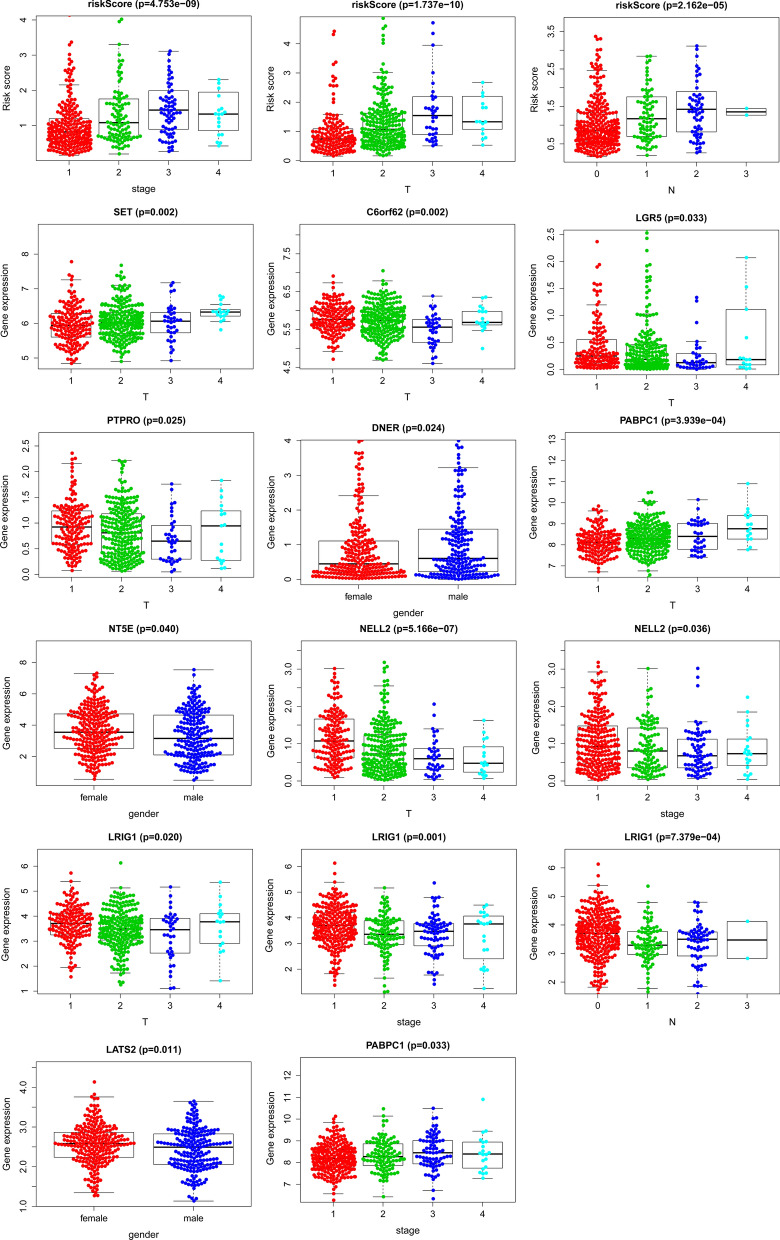
We conducted a subgroup analysis to clarify the link between subgroups and risk grouping. The clinicopathologic features of LUAD patients in TCGA datasets were shown in Table 3. A further conclusion was drawn that all subgroups except N3 could identify high-risk and low-risk groups. In N3, there were only two patients, both of which belonged to the high-risk group. And in most subgroups, high- and low-risk groups had significant differences, such as age < = 65, age > 65, female, male, stage III, T2, T3, N0, N2, and M0 (p < 0.05) (Fig. 3). P-value less than 0.05 was our criterion to judge whether it was meaningful19 (Fig. 4).
Table 3.
Clinical information.
| Clinical features | Category | Number(n = 427) | No. (%) |
|---|---|---|---|
| Age | |||
| < = 65 | 207 | 48.48% | |
| > 65 | 220 | 51.52% | |
| Gender | |||
| Female | 232 | 54.33% | |
| Male | 195 | 45.67% | |
| Stage | |||
| Stage I | 232 | 54.33% | |
| Stage II | 102 | 23.88% | |
| Stage III | 73 | 17.10% | |
| Stage IV | 20 | 4.69% | |
| T Stage | |||
| T1 | 148 | 34.66% | |
| T2 | 226 | 52.93% | |
| T3 | 36 | 8.43% | |
| T4 | 17 | 3.98% | |
| N Stage | |||
| N0 | 281 | 65.81% | |
| N1 | 81 | 18.97% | |
| N2 | 63 | 14.75% | |
| N3 | 2 | 0.47% | |
| M Stage | |||
| M0 | 407 | 95.31% | |
| M1 | 20 | 4.69% | |
| Survival status | |||
| Dead | 147 | 34.43% | |
| Alive | 280 | 65.57% | |
Figure 3.
Subgroup analysis. Kaplan–Meier survival illustrated the overall survival of subgroups, which was stratified by age ≤ 65, age > 65, gender, and TNM stage.
Figure 4.
Subgroup analysis. The box plot showed the relationship among stem cell-related genes in the signature and each clinical subgroup.
Gene set enrichment analysis
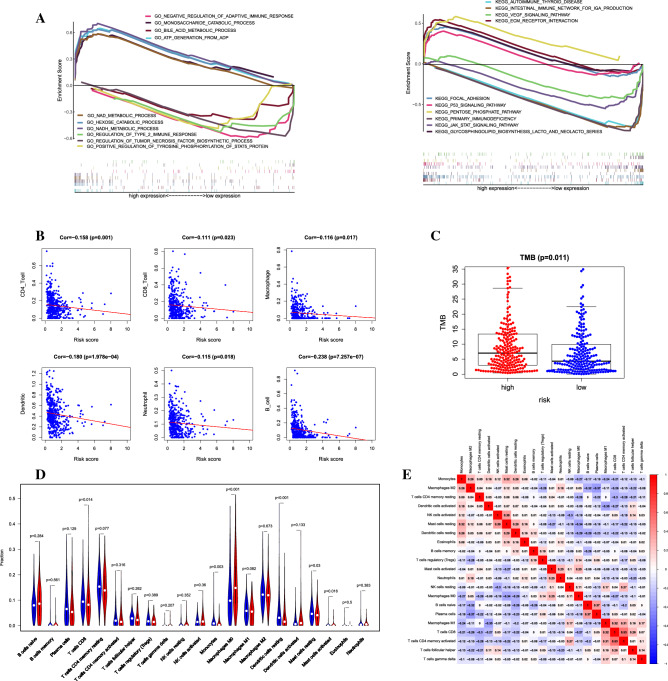
The biological characteristics of the signature were confirmed by the analysis of the GO term and KEGG pathway. In GO term annotation, five categories were positively associated with the low-risk group, which were hexose catabolic process, NADH metabolic process, monosaccharide catabolic process, ATP generation from ADP, and NAD metabolic process. At the same time, five categories were negatively related to the low-risk group, which were negative regulation of adaptive immune response, regulation of tumor necrosis factor biosynthetic process, bile acid metabolic process, positive regulation of tyrosine phosphorylation of STAT5 protein, and regulation of type 2 immune response. In the KEGG pathways, five pathways were positively associated with the low-risk group, such as ECM receptor interaction, focal adhesion, glycosphingogolipid biosynthesis latco, and neolatco series, pentose phosphate pathway, and p53 signaling pathway. While five pathways were negatively related to the low-risk group, like JAK start signaling pathway, primary immunodeficiency, VEGF signaling pathway, and intestinal immune network for IGA production20 (Fig. 5A).
Figure 5.
Gene Set Enrichment Analysis and Immune infiltration analysis. (A) GO term and KEGG pathway showed five positive correlation groups and five negative correlation groups, respectively. (B) TIMER indicated the correlations among the six immune cells and signature. (C) Difference analysis of TMB in high-risk and low-risk groups. (D) Composition of 21 kinds of immune cells in high-risk and low-risk groups. (E) Correlation heat map of 21 immune cells in LUAD.
Immune infiltration analysis
TIMER database, which provides six types of immune cell infiltration, uses RNA-Seq expression profiling data to detect immune cell infiltration in tumor tissue. The signature showed a negative correlation with the levels of B cells, CD4 T cells, CD8 T cells, Dendritic cells, Macrophages, and neutrophil cells (p < 0.05) (Fig. 5B). Tumor mutation burden (TMB) is defined as the total number of somatic gene coding errors, gene insertion, or deletion errors detected per million bases. TMB was obtained according to the above calculation method based on the varscan.maf file provided in the TCGA database. According to the calculated mutation burden value, we found that it had significant differences in the low-risk and high-risk groups (Fig. 5C). These situations revealed that our signature was indeed related to immune cells. In addition, we characterize the cellular composition of the tumor-infiltrating immune cells through the CIBERSORT method. Compared with the high-risk group, CD8 T cells, monocytes, resting dendritic cells, and resting mast cells had higher expressions (p< 0.05), while M0 macrophage had lower expression (p< 0.001) (Fig. 5D). CD4 memory activated T cells and CD8 T cells had the highest positive correlation (R = 0.53), which implied that there was a mutual effect between them. While plasma and M2 Macrophages had the highest negative correlation (R = − 0.37) that suggested they were antagonistic to each other21 (Fig. 5E).
Therapeutic efficacy analysis
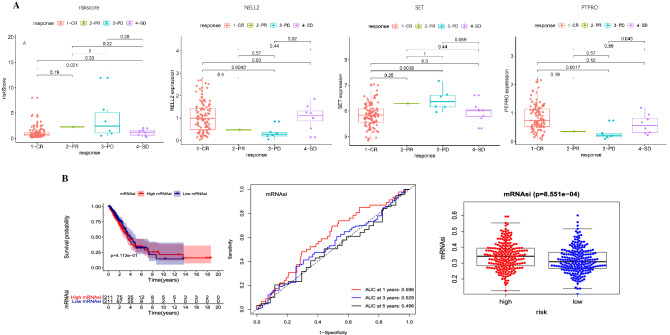
Some patients in the TCGA database recorded the results of the first assessment of the efficacy of radiotherapy and chemotherapy. This part of the result was obtained from the cbioportal database. Among them, 126 patients recorded the results of the first treatment after radiotherapy and chemotherapy. At the same time, we tracked the evaluation of efficacy, 111 cases were complete response (CR), only one case was the partial response (PR), eight cases were stable disease (SD), and seven cases were progressive disease (PD). The three genes of the signature had significant differences in the efficacy of the different drug (p < 0.05). We integrated this aspect into our research to evaluate our signature from multiple perspectives. By calculating the relationship between the signature and the efficacy of radiotherapy and chemotherapy, the predictive power of the signature could be calculated22,23 (Fig. 6A).
Figure 6.
Analysis of therapeutic efficacy and correlation analysis of stem cell index. (A) Box plot suggests the links between the p-value of the difference between any two groups. (B) Kaplan–Meier survival, ROC curve, and box plot were used to demonstrate the risk prediction of signature-based on the stem cell index.
Relationship between signature and mRNAsi
There were already clear articles that calculated the mRNAsi of 1174 genes. We matched the known mRNAsi with the samples and divided our patients into two groups by the median value of mRNAsi (high-mRNAsi group and low-mRNAsi group)24. It was found that mRNAsi could not effectively distinguish high- and low-mRNAsi in LUAD and the area under the ROC curve still had a certain gap compared with our signature. However, the mRNAsi of the high-risk group in our signature was also significantly higher than that of the low-risk group (P < 0.01). This also verified that our signature was stem cell characteristic25,26 (Fig. 6B).
Clinical correlation analysis
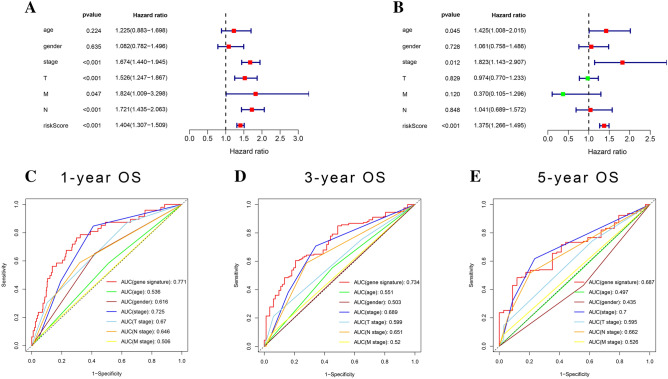
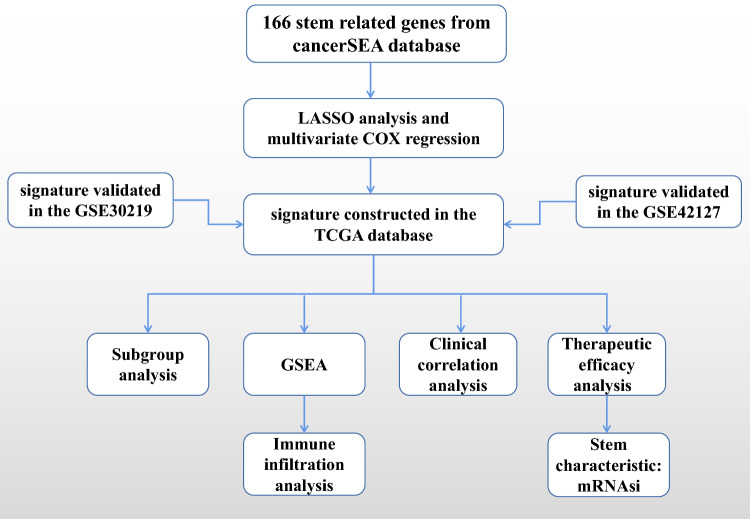
The univariate Cox regression showed factors related to prognosis like a stage, T, M, N, and risk score (p < 0.05), while multivariate Cox regression showed that only stage and risk score were significant independent risk factors of LUAD. Compared with other clinical factors, the area under the ROC curve of the signature in each period was the largest, which implied that compared with other clinical factors, the predictive ability of the gene signature we constructed was optimal (Fig. 7A,B). The areas under the ROC curve for 1-year, 3-year, and 5-year OS were 0.771, 0.734, and 0.687, which implied that our signature had excellent predictive power27,28 (Fig. 7C–E). We constructed a nomogram that could predict 1, 3 and 5-year OS by signature and other clinical factors. The 1, 3 and 5-year OS probability calibration curves showed that the OS predicted by nomogram was in good agreement with the actual OS of LUAD patients. The ROC curve in the nomogram showed that the 1, 3 and 5-year forecast values were 0.805, 0.773, and 0.76529 (Fig. 8). The workflow of our study was shown in Fig. 9, which was used to display our thought and process of our study.
Figure 7.
Clinical relevance. (A,B) Univariate and Multivariate Cox regression analysis of clinical factors related to overall survival in the TCGA cohort. (C–E) ROC curve demonstrated the risk prediction compared with other clinical factors in the TCGA cohort.
Figure 8.
Construction of nomogram. The nomogram contained age, stage, signature containing ten stem cell-related genes. The x-axis of the calibration chart was the predicted recurrence probability result, and the y-axis was the actual recurrence probability. ROC analysis detected the accuracy of prediction and inspection.
Figure 9.
Flow chart. The flow chart was drawn to show the thought and process of our research.
Discussion
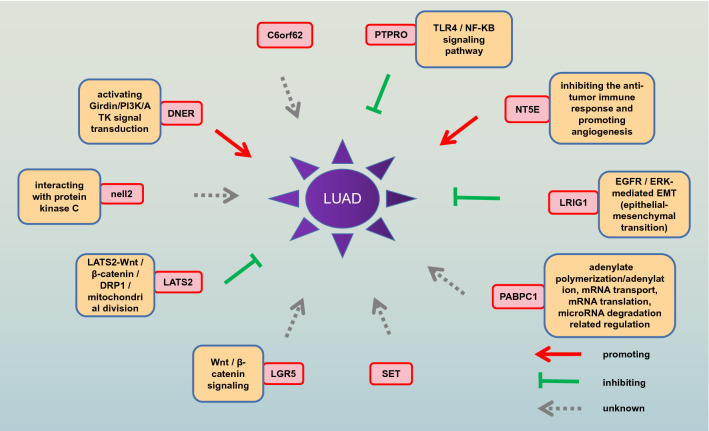
Despite the dramatic progress in diagnosis and treatment, the prognosis of advanced lung adenocarcinoma is still unsatisfactory. With the development of clinical management of lung cancer, some prognostic factors are well characterized, such as age, grade, and TNM grade. Cancer stem cells refer to cells that have self-renewal capacity and can produce heterogeneous tumor cells, which play a significant role in tumor survival, proliferation, metastasis, and recurrence. Cancer stem cells or tumor-initiating cells are considered to be the main drivers of disease progression and treatment resistance across various cancer types. Therefore, stem cell-related genes that were used to construct our signature also had these characteristics. This was why we considered using these genes to build a signature to facilitate the prediction and precise treatment of lung cancer. The research on the mechanism of stem cell-related genes has been pervasive, but there is no experiment to build these stem cell-related genes into a signature. DNER is a neuron-specific transmembrane protein with extracellular EGF-like repeat sequences, which promotes the metastasis and proliferation of cancer cells by activating Girdin/PI3K/ATK signal transduction30–32. NELL2s is a rich glycoprotein that contains EGF-like domains in nerve tissues, which interact with protein kinase C and has multiple physiological functions. Hypermethylation of promoter silences NELL2 and affects the progression of renal cell carcinoma33–35. LATS2, as a potential tumor suppressor, is a significant mediator of the apoptosis response pathway. LATS2-Wnt/β-catenin/DRP1/mitochondrial division is identified as a signaling pathway that promotes cancer cell death36,37. LGR5 is a promising marker of intestinal stem cells and cancer stem cells. Intestinal stem cell marker LGR5 is a receptor for R-spongin, and its role is to enhance Wnt signaling in hyperplastic crypts. Wnt pathway plays a significant key in ISC self-renewal by inducing RSPO receptor LGR5 expression. An abnormal increase in LGR5 expression may represent one of the most common molecular changes in some human cancers, resulting in long-term enhancement of canonical Wnt/β-catenin signaling38–40. PTPRO is a tumor suppressor and is abnormally expressed in various malignant tumors. PTPRO causes ulcerative colitis through TLR4/NF-KB signaling pathway and plays a role in liver fibrosis by affecting PDGF signaling in HSC activation. It is noteworthy that PTPRO is a new candidate gene for emphysema with severe obstruction41,42. LRIG1, a transmembrane protein, has a tumor-suppressive effect, and its expression is down-regulated in a variety of cancers. It can antagonize epidermal growth factor receptor signaling in epithelial tissues and inhibit cell invasion, migration, VM (angiogenesis simulation) by regulating EGFR / ERK-mediated EMT (epithelial-mesenchymal transition)43,44. PABPC1 can combine with adenylate-rich sequences in mRNA under the action of high affinity, which plays an important role in post-transcriptional regulation of genes and is also involved in many metabolic pathways of mRNA, including adenylate polymerization/adenylation, mRNA transport, mRNA translation, microRNA degradation related regulation45. NT5E is a ubiquitously expressed glycosylphatidylinositol-fixed glycoprotein, which can convert extracellular adenosine 5′-monophosphate to adenosine, and promote tumor development by inhibiting the anti-tumor immune response and promoting angiogenesis46,47. A schematic gram was used to display that the genes in the signature how to guide the progression of LUAD (Fig. 10). As far as AUC is concerned, the signature-based on ten stem cell-related genes is indeed a strong complement to TNM staging, but this conclusion needs further verification with multi-center and larger samples.
Figure 10.
Schematic diagram. The schematic diagram was drawn to reflect the genes in the signature how to guide the progression of LUAD. The red arrow represented promoting the progression of LUAD, the green arrow represented inhibiting the progression of LUAD, and the gray arrow represented the impact on LUAD not yet.
GSEA proved that the constructed signature did involve related cancer pathways. P53 is a tumor suppressor protein that regulates the expression of various genes, including apoptosis, growth inhibition, differentiation, inhibition of cell cycle progression, and accelerated DNA repair, genotoxicity, and senescence after cellular stress. Like all other tumor suppressors, the P53 gene normally slows or monitors cell division. The JAK/STAT signaling pathway is involved in numerous significant biological processes such as cell differentiation, proliferation, migration, apoptosis, survival, and immune regulation. Besides, the JAK/STAT signaling pathway also participates in the drug treatment of anemia, thrombocytopenia, neutropenia, and antiviral. With immune infiltration analysis, we found that the signature regulates the immunity of lung adenocarcinoma through CD4 T cell, which can interfere with the immune response of the immune system to the tumor, participate in the immune escape of the tumor, induce the immune tolerance of the tumor, and promote the occurrence and development of the tumor.
Conclusion
In conclusion, the signature could effectively predict the efficacy of chemotherapy in patients with LUAD, and a nomogram based on signature might accurately predict the prognosis of patients with LUAD. The signature-based on stem cell-related genes might be contributed to predicting the prognosis of patients with LUAD. Further research should be devoted to the functional analysis of our research results and verification in clinical trials.
Supplementary Information
Abbreviations
- LUAD
Lung adenocarcinoma
- LASSO
Least absolute shrinkage operator
- ROC
Receiver operating characteristic
- AUC
Area under the curve
- TIIC
Tumor-infiltrating immune cell
- TCGA
The cancer genome atlas
- GEO
Gene expression omnibus
- RECIST
Response evaluation criteria in solid tumors
- CR
Complete response
- PR
Partial response
- SD
Stable disease
- PD
Progressive disease
- mRNAsi
MRNA stemness indice
- OS
Overall survival
- GO
Gene ontology
- KEGG
Kyoto encyclopedia of genes and genomes
- GSEA
Gene set enrichment analysis
Author contributions
Z.H. wrote the manuscript text and put forword the idea of the article. Z.H., M.S.S., H.Z., and J.W. contributed to completing the picture modification. H.-J.Z. and J.–H.S. completed the revision and review of the article.
Funding
All figures were drawn by R Studio software. This article was supported by Nantong Key Laboratory of Translational Medicine in Cardiothoracic Diseases, Affiliated Hospital of Nantong University, and Department of Cardiothoracic Surgery, Affiliated Hospital of Nantong University.
Data availability
All data were from TCGA and GEO, which are publicly available. Data and code available.
Competing interests
The authors declare no competing interests.
Footnotes
Publisher's note
Springer Nature remains neutral with regard to jurisdictional claims in published maps and institutional affiliations.
These authors contributed equally: Zhanghao Huang and Muqi Shi.
Contributor Information
Hai-Jian Zhang, Email: hjzhang@ntu.edu.cn.
Jia -Hai Shi, Email: sjh@ntu.edu.cn.
Supplementary Information
The online version contains supplementary material available at 10.1038/s41598-020-80453-4.
References
- 1.Mezquita L, Jové M, Nadal E, Kfoury M, Morán T, Ricordel C, et al. High prevalence of somatic oncogenic driver alterations in patients with NSCLC and Li-Fraumeni syndrome. J. Thorac. Oncol. 2020;15:1232–1239. doi: 10.1016/j.jtho.2020.03.005. [DOI] [PubMed] [Google Scholar]
- 2.Jiang J, Yu C, Guo X, Zhang H, Tian S, Cai K, et al. G Protein-coupled receptor GPR87 promotes the expansion of PDA stem cells through activating JAK2/STAT3. Mol. Ther. Oncolytics. 2020;17:384–393. doi: 10.1016/j.omto.2020.01.006. [DOI] [PMC free article] [PubMed] [Google Scholar]
- 3.Zhang C, Huang S, Zhuang H, Ruan S, Zhou Z, Huang K, et al. YTHDF2 promotes the liver cancer stem cell phenotype and cancer metastasis by regulating OCT4 expression via m6A RNA methylation. Oncogene. 2020;39:4507–4518. doi: 10.1038/s41388-020-1303-7. [DOI] [PubMed] [Google Scholar]
- 4.Mansour FA, Mazrou A, Mohanna F, AIwan M, Ghebeh H. PD-L1 is overexpressed on breast cancer stem cells through notch3/mTOR axis. Oncoimmunology. 2020;9:17292–172929. doi: 10.1080/2162402X.2020.1729299. [DOI] [PMC free article] [PubMed] [Google Scholar]
- 5.Satirapod C, Wang N, MacDonald JA, Sun M, Woods D, Tilly JL. Estrogen regulation of germline stem cell differentiation as a mechanism contributing to female reproductive aging. Aging. 2020;12:7313–7333. doi: 10.18632/aging.103080. [DOI] [PMC free article] [PubMed] [Google Scholar]
- 6.Kohsaka S, Hayashi T, Nagano M, Ueno T, Kojima S, Kawazu M, et al. Identification of novel CD74-NRG2alpha fusion from comprehensive profiling of lung adenocarcinoma in Japanese never or light smokers. J. Thorac. Oncol. 2020;15:948–961. doi: 10.1016/j.jtho.2020.01.021. [DOI] [PubMed] [Google Scholar]
- 7.Yuan H, Yan M, Zhang G, Liu W, Deng C, Liao G, et al. CancerSEA: A cancer single-cell state atlas. Nucleic Acids Res. 2019;47:900–908. doi: 10.1093/nar/gky939. [DOI] [PMC free article] [PubMed] [Google Scholar]
- 8.Rousseaux S, Debernardi A, Jacquiau B, Vitte A, Vesin A, Nagy-Mignotte H, et al. Ectopic activation of germline and placental genes identifies aggressive metastasis-prone lung cancers. Sci. Transl. Med. 2013;5:186ra66. doi: 10.1126/scitranslmed.3005723. [DOI] [PMC free article] [PubMed] [Google Scholar]
- 9.Tang H, Xiao G, Behrens C, Schiller J, Allen J, Chow CW, et al. A 12-gene set predicts survival benefits from adjuvant chemotherapy in non-small cell lung cancer patients. Clin. Cancer Res. 2013;19:1577–1586. doi: 10.1158/1078-0432.CCR-12-2321. [DOI] [PMC free article] [PubMed] [Google Scholar]
- 10.Kong FE, Tang YG, Gong YF, Mo JQ, Zhao Y, Li MM, et al. Identification of prognostic claudins signature in hepatocellular carcinoma from a hepatocyte differentiation model. Hepatol. Int. 2020;14:521–533. doi: 10.1007/s12072-020-10035-z. [DOI] [PubMed] [Google Scholar]
- 11.Zeng F, Wang K, Liu X, Zhao Z. Comprehensive profiling identifies a novel signature with robust predictive value and reveals the potential drug resistance mechanism in glioma. Cell Commun. Signal. 2020;18:2. doi: 10.1186/s12964-019-0492-6. [DOI] [PMC free article] [PubMed] [Google Scholar]
- 12.Yang L, Peng X, Li Y, Zhang X, Ma Y, Wu C, et al. Long non-coding RNA HOTAIR promotes exosome secretion by regulating RAB35 and SNAP23 in hepatocellular carcinoma. Mol. Cancer. 2019;18:78. doi: 10.1186/s12943-019-0990-6. [DOI] [PMC free article] [PubMed] [Google Scholar]
- 13.Shen H, Wang Z, Ren S, Wang W, Duan L, Zhu D, et al. Prognostic biomarker MITD1 and its correlation with immune infiltrates in hepatocellular carcinoma (HCC) Int. Immunopharmacol. 2020;81:106222. doi: 10.1016/j.intimp.2020.106222. [DOI] [PubMed] [Google Scholar]
- 14.D'Angelo SP, Bhatia S, Brohl A, Hamid O, Mehnert JM, Terheyden P, et al. Avelumab in patients with previously treated metastatic Merkel cell carcinoma: Long-term data and biomarker analyses from the single-arm phase 2 JAVELIN Merkel 200 trial. J. Immunother Cancer. 2020;8:2. doi: 10.1136/jitc-2020-000674. [DOI] [PMC free article] [PubMed] [Google Scholar]
- 15.Qin S, Long X, Zhao Q, Zhao W, et al. Co-expression network analysis identified genes associate d with cancer stem cell characteristics in lung squamous cell carcinoma. Cancer Invest. 2020;38:13–22. doi: 10.1080/07357907.2019.1697281. [DOI] [PubMed] [Google Scholar]
- 16.Pece S, Disalvatore D, Tosoni D, Vecchi M, Confalonieri S, Bertalot G, et al. Identification and clinical validation of a multigene assay that interrogates the biology of cancer stem cells and predicts metastasis in breast cancer: A retrospective consecutive study. EBioMedicine. 2019;42:352–362. doi: 10.1016/j.ebiom.2019.02.036. [DOI] [PMC free article] [PubMed] [Google Scholar]
- 17.Santoro A, Vlachou T, Luzi L, Melloni G, Mazzarella L, D'Elia E, et al. p53 loss in breast cancer leads to Myc activation, increased cell plasticity, and expression of a mitotic signature with prognostic value. Cell Rep. 2019;26:624–638. doi: 10.1016/j.celrep.2018.12.071. [DOI] [PMC free article] [PubMed] [Google Scholar]
- 18.Liao Y, Wang Y, Cheng M, Huang C, Fan X. Weighted gene coexpression network analysis of features that control cancer stem cells reveals prognostic biomarkers in lung adenocarcinoma. Front. Genet. 2020;11:311. doi: 10.3389/fgene.2020.00311. [DOI] [PMC free article] [PubMed] [Google Scholar]
- 19.Kariri YA, Joseph C, Kurozumi S, Toss MS, Alsaleem M, Raafat S, et al. Prognostic significance of KN motif and ankyrin repeat domains 1 (KANK1) in invasive breast cancer. Breast Cancer Res. Treat. 2020;179:349–357. doi: 10.1007/s10549-019-05466-8. [DOI] [PMC free article] [PubMed] [Google Scholar]
- 20.Takashima Y, Hamano M, Fukai J, Iwadate Y, Kajiwara K, Kobayashi T, et al. GSEA-assisted gene signatures valid for combinations of prognostic markers in PCNSL. Sci. Rep. 2020;10:8435. doi: 10.1038/s41598-020-65463-6. [DOI] [PMC free article] [PubMed] [Google Scholar]
- 21.Wang P, Zhang X, Sun N, Zhao Z, He J. Comprehensive analysis of the tumor microenvironment in cutaneous melanoma associated with immune infiltration. J. Cancer. 2020;2:858–3870. doi: 10.7150/jca.44413. [DOI] [PMC free article] [PubMed] [Google Scholar]
- 22.Ma F, Wang B, Xue L, Kang W, Li Y, Li W, et al. Neoadjuvant chemotherapy improves the survival of patients with neuroendocrine carcinoma and mixed adenoneuroendocrine carcinoma of the stomach. J. Cancer Res. Clin. Oncol. 2020;146:2135–2142. doi: 10.1007/s00432-020-03214-w. [DOI] [PubMed] [Google Scholar]
- 23.Castello, A., Rimassa, L., Personeni, N., Pressiani, T., Smiroldo, V. & Lopci, E., et al. Metabolic switch in hepatocellular carcinoma patients treated with sorafenib: A proof-of-concept trial. Mol. Imaging Biol. (2020). [DOI] [PubMed]
- 24.Malta TM, Sokolov A, Gentles AJ, Laird PW, Noushmehr H, Wiznerowicz M, et al. Machine learning identifies stemness features associated with oncogenic dedifferentiation. Cell. 2018;173:338–354. doi: 10.1016/j.cell.2018.03.034. [DOI] [PMC free article] [PubMed] [Google Scholar]
- 25.Lian H, Han PY, Zhang YC, Zhao Y, Yan S, Li QF, et al. Integrative analysis of gene expression and DNA methylation through one-class logistic regression machine learning identifies stemness features in medulloblastoma. Mol. Oncol. 2019;13:2227–2245. doi: 10.1002/1878-0261.12557. [DOI] [PMC free article] [PubMed] [Google Scholar]
- 26.Pan S, Zhan Y, Chen X, Wu B, Liu B, et al. Identification of biomarkers for controlling cancer stem cell characteristics in bladder cancer by network analysis of transcriptome data stemness indices. Front. Oncol. 2019;9:61–63. doi: 10.3389/fonc.2019.00061. [DOI] [PMC free article] [PubMed] [Google Scholar]
- 27.Di Z, Di M, Fu W, Tang Q, Liu Y, Lei P, et al. Integrated analysis identifies a nine-microRNA signature biomarker for diagnosis and prognosis in colorectal cancer. Front. Genet. 2020;11:192. doi: 10.3389/fgene.2020.00192. [DOI] [PMC free article] [PubMed] [Google Scholar]
- 28.Cheng Y, Yang S, Shen B, Zhang Y, Zhang X, Liu T, et al. Molecular characterization of lung cancer: A two-miRNA prognostic signature based on cancer stem-like cells related genes. J. Cell. Biochem. 2020;121:2889–2900. doi: 10.1002/jcb.29525. [DOI] [PubMed] [Google Scholar]
- 29.Li W, Liu J, Zhao H. Identification of a nomogram based on long non-coding RNA to improve prognosis prediction of esophageal squamous cell carcinoma. Aging (Albany NY) 2020;12:1512–1526. doi: 10.18632/aging.102697. [DOI] [PMC free article] [PubMed] [Google Scholar]
- 30.Wang L, Wu Q, Li Z, Sun S, Yuan J, Li J, et al. Delta/notch-like epidermal growth factor-related receptor promotes stemness to facilitate breast cancer progression. Cell Signal. 2019;63:10938–10939. doi: 10.1016/j.cellsig.2019.109389. [DOI] [PubMed] [Google Scholar]
- 31.Wang L, Wu Q, Zhu S, Li Z, Yuan J, Yu D, et al. Delta/notch-like epidermal growth factor-related receptor (DNER) orchestrates stemness and cancer progression in prostate cancer. Am. J. Transl. Res. 2017;9:5031–5039. [PMC free article] [PubMed] [Google Scholar]
- 32.Ballester-Lopez C, Conlon TM, Ertüz Z, Greiffo FR, Irmler M, Verleden SE, et al. The Notch ligand DNER regulates macrophage IFNgamma release in chronic obstructive pulmonary disease. EBioMedicine. 2019;43:562–575. doi: 10.1016/j.ebiom.2019.03.054. [DOI] [PMC free article] [PubMed] [Google Scholar]
- 33.Jeong JK, Kim JG, Kim HR, Lee TH, Park JW, Lee BJ, et al. A role of central NELL2 in the regulation of feeding behavior in rats. Mol. Cells. 2017;40:186–194. doi: 10.14348/molcells.2017.2319. [DOI] [PMC free article] [PubMed] [Google Scholar]
- 34.Yang Y, Mu J, Chen G, Zhan Y, Zhong J, Wei Y, et al. iTRAQ-based quantitative proteomic analysis of cerebrospinal fluid reveals NELL2 as a potential diagnostic biomarker of tuberculous meningitis. Int. J. Mol. Med. 2015;35:1323–1332. doi: 10.3892/ijmm.2015.2131. [DOI] [PubMed] [Google Scholar]
- 35.Lee DY, Kim E, Lee YS, Ryu H, Park JY, Hwang EM, et al. The cytosolic splicing variant of NELL2 inhibits PKCbeta1 in glial cells. Biochem. Biophys. Res. Commun. 2014;454:459–464. doi: 10.1016/j.bbrc.2014.10.110. [DOI] [PubMed] [Google Scholar]
- 36.Zhang L, Li S, Wang R, Chen C, Ma W, Cai H, et al. Anti-tumor effect of LATS2 on liver cancer death: Role of DRP1-mediated mitochondrial division and the Wnt/beta-catenin pathway. Biomed. Pharmacother. 2019;114:10882–10885. doi: 10.1016/j.biopha.2019.108825. [DOI] [PubMed] [Google Scholar]
- 37.Guo C, Liang C, Yang J, Hu H, Fan B, Liu X. LATS2 inhibits cell proliferation and metastasis through the Hippo signaling pathway in glioma. Oncol. Rep. 2019;41:2753–2761. doi: 10.3892/or.2019.7065. [DOI] [PMC free article] [PubMed] [Google Scholar]
- 38.Cao W, Li M, Liu J, Zhang S, Noordam L, Verstegen MMA, et al. LGR5 marks targetable tumor-initiating cells in mouse liver cancer. Nat. Commun. 2020;11:1961. doi: 10.1038/s41467-020-15846-0. [DOI] [PMC free article] [PubMed] [Google Scholar]
- 39.Nakajima T, Uehara T, Iwaya M, Kobayashi Y, Maruyama Y, Ota H, et al. Characterization of LGR5 expression in poorly differentiated colorectal carcinoma with mismatch repair protein deficiency. BMC. Cancer. 2020;20:319. doi: 10.1186/s12885-020-06791-8. [DOI] [PMC free article] [PubMed] [Google Scholar]
- 40.Xu L, Lin W, Wen L, Li G. Lgr5 in cancer biology: Functional identification of Lgr5 in cancer progression and potential opportunities for novel therapy. Stem Cell Res. Ther. 2019;10:219. doi: 10.1186/s13287-019-1288-8. [DOI] [PMC free article] [PubMed] [Google Scholar]
- 41.Yan S, Cheng M, Duan Q, Wang Z, Gao W, Ren B, et al. MiR-6803-5p promotes cancer cell proliferation and invasion via PTPRO/NF-kappaB axis in colorectal cancer. Mediat. Inflamm. 2019;2019:8128501. doi: 10.1155/2019/8128501. [DOI] [PMC free article] [PubMed] [Google Scholar]
- 42.Radder JE, Zhang Y, Gregory AD, Yu S, Kelly NJ, Leader JK, et al. Extreme trait whole-genome sequencing identifies PTPRO as a novel candidate gene in emphysema with severe airflow obstruction. Am. J. Respir. Crit. Care Med. 2017;196:159–171. doi: 10.1164/rccm.201606-1147OC. [DOI] [PMC free article] [PubMed] [Google Scholar]
- 43.Li W, Zhou Y. LRIG1 acts as a critical regulator of melanoma cell invasion, migration, and vasculogenic mimicry upon hypoxia by regulating EGFR/ERK-triggered epithelial-mesenchymal transition. Biosci. Rep. 2019;39:2. doi: 10.1042/BSR20181165. [DOI] [PMC free article] [PubMed] [Google Scholar]
- 44.Yu S, Yang M, Lim KM, Cho Y, Kim H, Lee K, et al. Expression of LRIG1, a negative regulator of EGFR, is dynamically altered during different stages of G astric carcinogenesis. Am. J. Pathol. 2018;188:2912–2923. doi: 10.1016/j.ajpath.2018.08.006. [DOI] [PMC free article] [PubMed] [Google Scholar]
- 45.Su R, Ma J, Zheng J, Liu X, Liu Y, Ruan X, et al. PABPC1-induced stabilization of BDNF-AS inhibits malignant progression of glioblastoma cells through STAU1-mediated decay. Cell Death Dis. 2020;11:81. doi: 10.1038/s41419-020-2267-9. [DOI] [PMC free article] [PubMed] [Google Scholar]
- 46.Minor M, Alcedo KP, Battaglia RA, Snider NT, et al. Cell type- and tissue-specific functions of ecto-5'-nucleotidase (CD73) Am. J. Physiol. Cell Physiol. 2019;317:C1079–C1092. doi: 10.1152/ajpcell.00285.2019. [DOI] [PMC free article] [PubMed] [Google Scholar]
- 47.Chen S, Wainwright DA, Wu JD, Wan Y, Matei DE, Zhang Y, et al. CD73: An emerging checkpoint for cancer immunotherapy. Immunotherapy. 2019;11:983–997. doi: 10.2217/imt-2018-0200. [DOI] [PMC free article] [PubMed] [Google Scholar]
Associated Data
This section collects any data citations, data availability statements, or supplementary materials included in this article.
Supplementary Materials
Data Availability Statement
All data were from TCGA and GEO, which are publicly available. Data and code available.


