

Abstract
Background:
Exposure to respirable coal mine dust can cause pneumoconiosis, an irreversible lung disease that can be debilitating. The mass concentration and quartz mass percent of respirable coal mine dust samples (annually, by occupation, by geographic region) from surface coal mines and surface facilities at U.S. underground mines during 1982–2017 were summarized.
Methods:
Mine Safety and Health Administration (MSHA) collected and analyzed data for respirable dust and a subset of the samples were analyzed for quartz content. We calculated the respirable dust and quartz concentration geometric mean, arithmetic mean, and percent of samples exceeding the respirable dust permissible exposure limit (PEL) of 2.0 mg/m3, and the average percent of quartz content in samples.
Results:
The geometric mean for 288 705 respirable dust samples was 0.17 mg/m3 with 1.6% of the samples exceeding the 2.0 mg/m3 PEL. Occupation-specific geometric means for respirable dust in active mining areas were highest among drillers. The geometric mean for respirable dust was higher in central Appalachia compared to the rest of the U.S. The geometric mean for respirable quartz including 54 040 samples was 0.02 mg/m3 with 15.3% of these samples exceeding the applicable standard (PEL or reduced PEL). Occupation-specific geometric means for respirable quartz were highest among drillers.
Conclusion:
Higher concentrations of respirable dust or quartz in specific coal mining occupations, notably drilling occupations, and in certain U.S. regions, underscores the need for continued surveillance to identify workers at higher risk for pneumoconiosis.
Keywords: Coal mine dust, MSHA, occupational groups, quartz
1 |. INTRODUCTION
The prevalence and severity of pneumoconiosis in U.S. coal miners have steadily increased in the last two decades.1 Prevalence of the most severe and debilitating form, progressive massive fibrosis (PMF), has reached unprecedented levels,2–4 as have the associated consequences including increased lung transplantation1,5 and a higher percentage of federal Black Lung benefits claims awarded.6 A recent study identified a cluster of 416 cases of PMF, primarily among former miners from Virginia or Kentucky, and 10% of these cases were in surface miners.4 Although the prevalence varies by region and by state, pneumoconiosis has been observed among contemporary coal miners in each state where coal is mined, including miners who work at underground and surface operations.7–9
To better inform our understanding of the pneumoconiosis trends in the U.S., we recently summarized the annual mass concentration and quartz mass concentration of respirable dust samples collected during 1982–2017 for compliance purposes in underground coal mines by Mine Safety and Health Administration (MSHA) inspectors.10 The primary findings demonstrated that the mean percent quartz content in Appalachian underground coal mines consistently exceeded 5% and nearly one-third of U.S. coal mines had a least one section placed on a reduced standard. Our initial focus was to summarize the exposures of underground miners because the majority of coal mine dust-related respiratory health research has focused on underground miners. However, pneumoconiosis and other occupational respiratory diseases also occur in surface coal miners, which is noteworthy given current differences between the surface and underground coal mining industries in the United States. In 2017, surface operations produced 500 million short tons of coal, compared with 271 million from underground mines; there were twice as many surface mines than underground mines, and surface operations employed 17 800 more miners than underground operations (29 000 underground miners).11
Investigations in the 1980s12–14 identified pneumoconiosis with radiographic characteristics of silicosis among drillers at surface coal mines and analysis of inspector dust samples collected at surface coal mines identified drilling occupations as having the highest quartz exposures.15,16 More than two decades later, severe pneumoconiosis continued to be identified among surface coal miners, with evidence suggesting drillers continued to be at highest risk.4,7,8
We are unaware of any recent scientific study summarizing the results of air samples collected during inspections at U.S. surface coal mines. In light of the long-recognized hazard of silica and other hazardous dust exposures in surface coal miners, we analyzed 36 years of MSHA inspector-collected respirable dust and quartz (crystalline silica) surface coal mine data to describe trends over time, by occupation, and by region. These data can be used to inform public health decision-making.
2 |. METHODS
2.1 |. Permissible exposure limits
In 1972, the MSHA permissible exposure limit (PEL) for respirable dust was reduced to 2.0 mg/m3.17 However, when the quartz content of the respirable dust sample exceeds 5% in an average of multiple samples, the PEL for respirable dust is reduced for that area of the mine based on the following formula17:
The PELs were based on time-weighted average concentrations sampled over an 8-hour work shift. Sampling devices must be worn by a specified mining occupation and remain operational throughout the entire shift or for 8 hours, whichever time was less. Each sample was compared to the historic PEL of 2.0 mg/m3 for the respirable dust analysis (MSHA reduced the PEL to 1.5 mg/m3 on August 1, 2016 and required sampling for the full duration of the miner’s shift, even if longer than 8 hours).
2.2 |. Respirable dust and respirable quartz data
Data consist of respirable dust air samples collected by MSHA inspectors at surface mines during 1982–2017 to assess for compliance with dust regulations and included a subset of samples analyzed for quartz content. NIOSH received 1982–1999 respirable dust data from MSHA’s Laboratory Information Management System database and 2000–2017 data were publicly available.18 Respirable quartz data for 1982–2017 were received from MSHA’s Pittsburgh Quartz Database. Respirable dust data include the date the sample was taken, the concentration of respirable dust, the sample type (eg, designated work position), the occupation code, and the MSHA mine ID. For respirable dust samples analyzed for quartz, the concentration of airborne respirable quartz, and the percentage of quartz (by weight) in the sample were also calculated.
The respirable dust and respirable quartz samples were included in the analysis if they met the following criteria: (a) sample was taken at a surface coal mine or at surface facilities of an underground coal mine; (b) designated by MSHA as valid; (c) occupational “full-shift” (ie, at least 8-hours) sample; and (d) sample was collected by an MSHA inspector. Additionally, respirable quartz samples were included in the analysis if the quartz content was greater than or equal to zero. Concentrations were imputed for respirable dust and respirable quartz samples with a value of less than the minimum quantifiable concentration (MQC) based upon the distribution of quantifiable samples MQC/√2.19
2.2.1 |. Occupations
MSHA collected samples from a variety of surface miner occupations with most from previously-established higher risk occupations (eg, highwall drill operator, bulldozer operator, and blaster/shooter/shotfirer). The occupation-specific geometric mean, arithmetic mean, and percent of samples exceeding the MSHA PEL for respirable dust and respirable quartz were calculated. Not all results exceeding the MSHA PEL led to an MSHA citation; for example, there was no upward adjustment for sampling uncertainty. Surface miner occupations with fewer than 400 respirable dust samples were combined. Occupations were also combined to summarize results for samples collected in specific areas of work including the strip mine (active mining area), shop/maintenance (includes work in the shop and maintenance work throughout the facility), and coal prep facility. Within the strip mine area, we created a combined drillers occupation group that consisted of highwall drill operator and helper, rock driller, blaster/shooter/shotfirer, and coal drill operator and helper.
2.2.2 |. Geographical areas
MSHA coal mining districts are comprised of counties where a mine is located. Although MSHA districts changed during the study period, we assigned all samples to the current MSHA district as of the preparation of this manuscript. A map of the MSHA districts can be found at https://www.msha.gov/about/program-areas/coal-mine-safety-and-health. Data from MSHA Districts 4, 5, and 12 were combined (central Appalachia) and compared with MSHA Districts 2 to 3 and 7 to 10 combined (rest of the United States). Detailed methods and maps are available in a recent publication.10
2.3 |. Data analysis
Data were analyzed by the calendar year, occupation, and MSHA district. For respirable dust and quartz, the number of samples, the geometric mean, arithmetic mean, 95th percentile, and percent of samples over the PEL were calculated. The mean percentage of quartz was also reported for respirable quartz samples. All analyses were conducted using SAS (version 9.4, SAS Institute, Cary, NC). Data from central Appalachia were compared to the rest of the United States using Proc TTEST Cochran in SAS and a statistically significant difference was determined at P < .05. Figures were created using SigmaPlot (version 12.5, Systat Software, San Jose, CA).
3 |. RESULTS
Summaries of the respirable dust samples and respirable dust samples containing quartz collected by MSHA inspectors during 1982–2017 are presented. The driller occupations had the highest respirable quartz concentrations. Central Appalachia had statistically higher respirable dust, respirable quartz, and percent quartz in samples compared to the rest of the United States.
3.1 |. Respirable coal mine dust
The percentage of respirable dust samples exceeding the PEL, by year, is shown in Table 1. There were 288 705 respirable dust samples collected during 1982–2017 included in this analysis; 6479 samples (2.2%) were less than the MQC and were imputed, and 4520 (1.6%) of the respirable dust samples exceeded the MSHA PEL.
TABLE 1.
MSHA inspector samples respirable coal mine dust and respirable quartz by year, 1982–2017
| Respirable dust | Respirable quartz | ||||||
|---|---|---|---|---|---|---|---|
| All samples | All samples | ||||||
| Year | n | 95th | % >PEL | n | 95th | % >PEL | % Quartz |
| 1982 | 8857 | 1.80 | 3.7 | 535 | 0.79 | 44.1 | 8.7 |
| 1983 | 8052 | 2.00 | 4.5 | 1017 | 0.75 | 43.2 | 8.0 |
| 1984 | 8144 | 2.00 | 5.0 | 1009 | 0.75 | 42.4 | 8.1 |
| 1985 | 7919 | 1.70 | 3.4 | 771 | 0.60 | 39.7 | 6.6 |
| 1986 | 7199 | 1.90 | 4.2 | 887 | 0.56 | 37.3 | 6.1 |
| 1987 | 6765 | 1.80 | 4.0 | 717 | 0.40 | 33.5 | 5.8 |
| 1988 | 6910 | 2.00 | 4.8 | 961 | 0.57 | 36.3 | 6.9 |
| 1989 | 6571 | 1.70 | 3.7 | 686 | 0.64 | 35.1 | 7.3 |
| 1990 | 6614 | 1.70 | 3.4 | 682 | 0.47 | 37.4 | 7.6 |
| 1991 | 3869 | 1.50 | 3.1 | 407 | 0.42 | 26.0 | 6.4 |
| 1992 | 4163 | 1.80 | 3.5 | 1442 | 0.29 | 20.5 | 5.8 |
| 1993 | 5685 | 1.40 | 2.6 | 1303 | 0.40 | 28.6 | 6.5 |
| 1994 | 6264 | 1.40 | 2.2 | 1293 | 0.36 | 28.4 | 6.6 |
| 1995 | 5901 | 1.20 | 1.7 | 1436 | 0.27 | 25.1 | 9.3 |
| 1996 | 6515 | 1.14 | 1.2 | 1550 | 0.22 | 20.1 | 9.6 |
| 1997 | 7505 | 1.15 | 1.1 | 2021 | 0.22 | 19.7 | 9.4 |
| 1998 | 9233 | 1.04 | 1.0 | 1973 | 0.21 | 19.5 | 9.9 |
| 1999 | 10 184 | 1.07 | 1.0 | 2174 | 0.19 | 17.8 | 9.4 |
| 2000 | 9730 | 1.06 | 1.1 | 2044 | 0.16 | 15.2 | 8.2 |
| 2001 | 9967 | 1.04 | 0.9 | 5076 | 0.09 | 5.7 | 5.7 |
| 2002 | 9464 | 0.94 | 0.8 | 3952 | 0.08 | 5.2 | 5.5 |
| 2003 | 8231 | 0.91 | 0.7 | 1203 | 0.11 | 10.6 | 7.7 |
| 2004 | 8790 | 0.87 | 0.6 | 1146 | 0.16 | 14.5 | 8.8 |
| 2005 | 8690 | 0.88 | 0.7 | 1134 | 0.16 | 14.6 | 8.9 |
| 2006 | 7706 | 0.87 | 0.7 | 960 | 0.18 | 16.0 | 8.4 |
| 2007 | 8541 | 0.84 | 0.6 | 997 | 0.15 | 13.5 | 8.2 |
| 2008 | 10 435 | 0.78 | 0.5 | 1107 | 0.15 | 12.4 | 8.0 |
| 2009 | 11 401 | 0.75 | 0.3 | 1176 | 0.14 | 11.2 | 8.6 |
| 2010 | 9528 | 0.73 | 0.4 | 3202 | 0.06 | 3.3 | 4.9 |
| 2011 | 10 340 | 0.65 | 0.2 | 794 | 0.15 | 11.1 | 8.8 |
| 2012 | 10 101 | 0.64 | 0.2 | 773 | 0.13 | 11.6 | 8.8 |
| 2013 | 8619 | 0.64 | 0.4 | 622 | 0.11 | 11.3 | 7.6 |
| 2014 | 8283 | 0.59 | 0.1 | 2400 | 0.06 | 3.0 | 5.7 |
| 2015 | 8386 | 0.54 | 0.2 | 2377 | 0.07 | 2.9 | 6.4 |
| 2016 | 7227 | 0.51 | 0.2 | 2133 | 0.07 | 2.6 | 6.6 |
| 2017 | 6916 | 0.51 | 0.1 | 2080 | 0.07 | 3.0 | 6.7 |
| Total | 288 705 | 1.13 | 1.6 | 54 040 | 0.20 | 15.3 | 7.2 |
Abbreviations: PEL, permissible exposure limit; 95th, 95th percentile in mg/m3.
The overall geometric mean and arithmetic mean for respirable dust exposure were 0.17; 0.35 mg/m3, respectively. The annual respirable dust geometric mean and arithmetic mean are shown in Figure 1. Although the mean exposures declined over time, the 95th percentile averaged 1.13 mg/m3 during the time period analyzed (Table 1).
FIGURE 1.
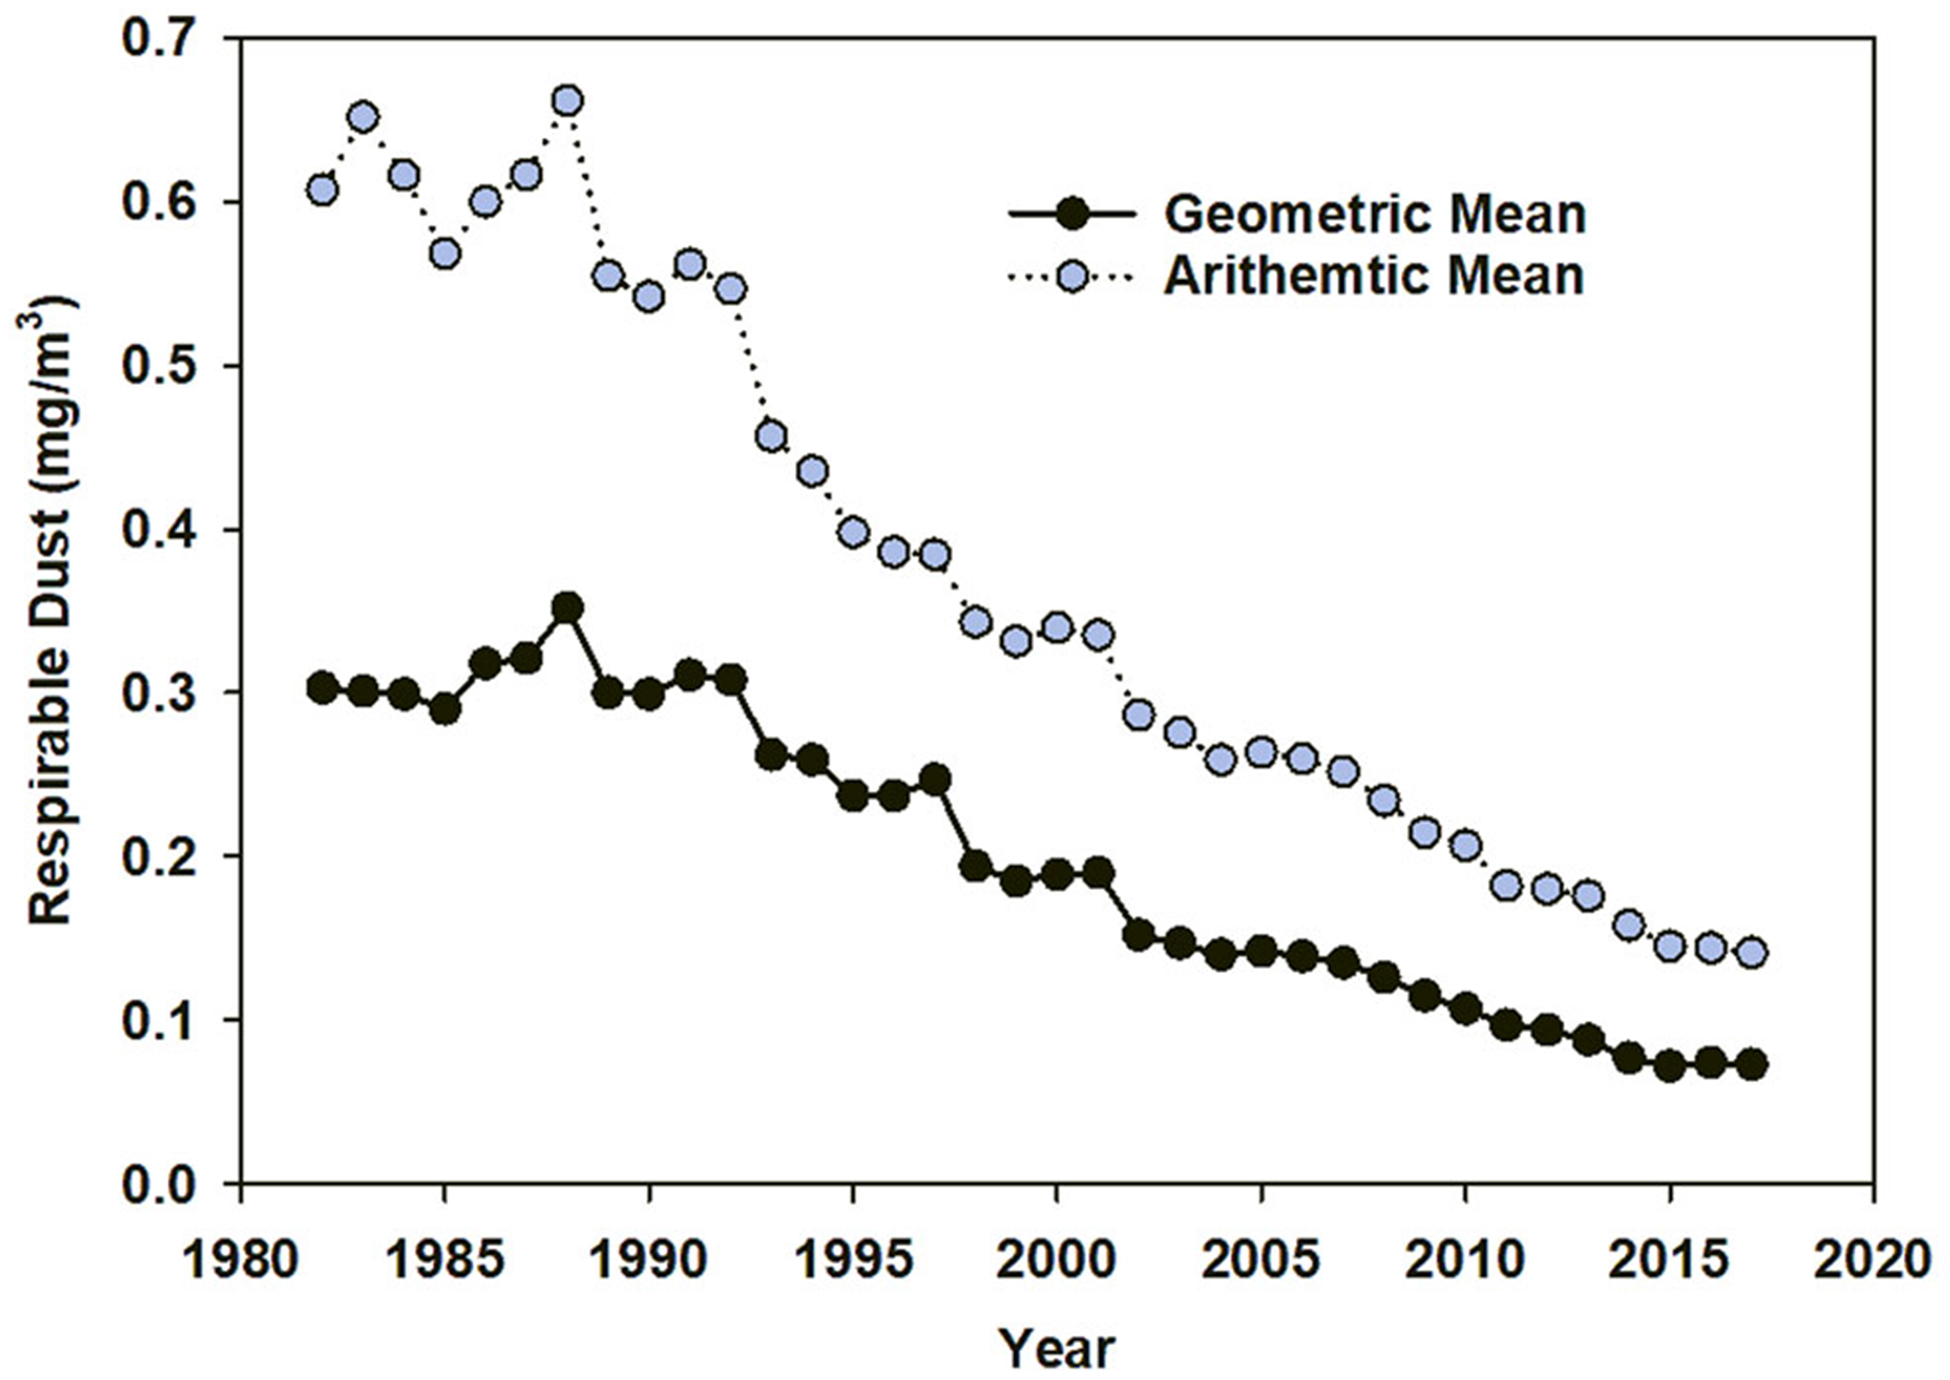
Annual geometric and arithmetic mean respirable coal mine dust by year, 1982–2017
Aside from drilling occupations, occupations20 in the strip mine with the highest geometric mean and arithmetic mean respirable dust exposures, respectively, included groundman (0.20; 0.32 mg/m3), auger helper (0.19; 0.31 mg/m3), scraper operator (0.19; 0.33 mg/m3), refuse truck driver/backfill truck driver (0.16; 0.30 mg/m3), auger operator (0.16; 0.27 mg/m3), bulldozer operator (0.15; 0.29 mg/m3), and coal truck driver (0.14; 0.26 mg/m3) (Table 2). For the combined drilling occupations (highwall drill operator and helper, rock driller, blaster/shooter/shotfirer, coal drill operator, and helper) the respirable dust geometric mean, arithmetic mean, and 95th percentile, respectively, (0.26; 0.61; 2.10 mg/m3) were all higher than the overall means for each of those metrics (Table 2). The coal drill helper is not individually presented in Table 2 but is combined into drilling occupations. Occupations were also combined by areas of work where the samples were collected such as strip mine, shop/maintenance, and prep facility (Table 2). The concentrations of respirable dust for the strip mine were lower than the other areas of work.
TABLE 2.
MSHA inspector samples respirable coal mine dust and respirable quartz by surface miner occupation 1982–2017
| Respirable dust | Respirable quartz | ||||||||||
|---|---|---|---|---|---|---|---|---|---|---|---|
| All samples | All samples | ||||||||||
| Occupation | n | GM | AM | 95th | % >PEL | n | GM | AM | 95th | % >PEL | % Quartz |
| Highwall drill helper (D) | 989 | 0.29 | 0.67 | 2.20 | 5.4 | 219 | 0.09 | 0.24 | 0.89 | 44.3 | 13.7 |
| Rock driller (D) | 400 | 0.27 | 0.60 | 2.05 | 5.0 | 107 | 0.07 | 0.17 | 0.64 | 39.3 | 10.9 |
| Highwall drill operator (D) | 22 907 | 0.26 | 0.65 | 2.34 | 6.0 | 7103 | 0.06 | 0.16 | 0.61 | 34.2 | 13.5 |
| Blaster/shooter/shotfirer (D) | 2826 | 0.24 | 0.36 | 1.00 | 1.1 | 829 | 0.05 | 0.07 | 0.17 | 14.5 | 11.1 |
| Groundman | 1139 | 0.20 | 0.32 | 0.88 | 0.5 | 240 | 0.02 | 0.03 | 0.07 | 2.9 | 4.4 |
| Coal drill operator (D) | 514 | 0.20 | 0.43 | 1.40 | 2.5 | 88 | 0.05 | 0.15 | 0.60 | 33.0 | 10.0 |
| Auger helper | 2814 | 0.19 | 0.31 | 0.90 | 0.4 | 367 | 0.02 | 0.03 | 0.07 | 3.8 | 3.6 |
| Scraper operator | 2986 | 0.19 | 0.33 | 1.00 | 1.5 | 293 | 0.05 | 0.10 | 0.34 | 31.1 | 8.3 |
| Refuse truck driver/backfill truck driver | 32 450 | 0.16 | 0.30 | 1.00 | 0.7 | 5188 | 0.02 | 0.04 | 0.13 | 8.9 | 5.1 |
| Auger operator | 3783 | 0.16 | 0.27 | 0.80 | 0.5 | 405 | 0.01 | 0.02 | 0.06 | 5.4 | 2.1 |
| Bulldozer operator | 58 526 | 0.15 | 0.29 | 1.00 | 0.8 | 12 331 | 0.04 | 0.08 | 0.29 | 21.6 | 13.9 |
| Coal truck driver | 5802 | 0.14 | 0.26 | 0.72 | 0.4 | 444 | 0.02 | 0.04 | 0.12 | 9.2 | 4.4 |
| Water truck operator | 1041 | 0.14 | 0.21 | 0.67 | 0.2 | 91 | 0.02 | 0.03 | 0.06 | 1.1 | 4.3 |
| Coal Shovel Operator | 1381 | 0.12 | 0.22 | 0.70 | 0.3 | 96 | 0.02 | 0.04 | 0.11 | 10.4 | 6.2 |
| High lift operator/front end loader | 55 905 | 0.12 | 0.22 | 0.70 | 0.3 | 6411 | 0.01 | 0.02 | 0.08 | 4.7 | 4.3 |
| Stripping shovel operator | 1895 | 0.12 | 0.20 | 0.69 | 0.2 | 161 | 0.02 | 0.06 | 0.18 | 18.6 | 9.6 |
| Crane operator/dragline operator | 4222 | 0.11 | 0.18 | 0.43 | 0.2 | 102 | 0.01 | 0.03 | 0.12 | 11.8 | 7.0 |
| Road grader operator | 3532 | 0.11 | 0.22 | 0.70 | 0.2 | 288 | 0.02 | 0.03 | 0.10 | 5.6 | 5.2 |
| Rotary bucket excavator operator | 1844 | 0.10 | 0.17 | 0.54 | 0.1 | 164 | 0.02 | 0.05 | 0.15 | 13.4 | 8.6 |
| Backhoe operator | 8154 | 0.09 | 0.16 | 0.55 | 0.2 | 681 | 0.02 | 0.05 | 0.17 | 14.8 | 8.6 |
| Total strip mine | 213 908 | 0.15 | 0.31 | 1.00 | 1.2 | 35 689 | 0.03 | 0.08 | 0.27 | 18.2 | 10.0 |
| Total drillers (D) combined | 27 670 | 0.26 | 0.61 | 2.10 | 5.4 | 8348 | 0.06 | 0.15 | 0.57 | 32.6 | 13.2 |
| Welder (Shop) | 1485 | 0.39 | 1.00 | 3.62 | 11.2 | 89 | 0.01 | 0.01 | 0.04 | 27.0 | 0.4 |
| Welder (non-shop) | 1030 | 0.35 | 0.74 | 2.40 | 7.3 | 342 | 0.01 | 0.01 | 0.03 | 21.1 | 1.0 |
| Laborer/blacksmith | 8786 | 0.30 | 0.59 | 2.00 | 4.6 | 2394 | 0.01 | 0.02 | 0.07 | 15.9 | 1.9 |
| Electrician | 3772 | 0.23 | 0.35 | 1.00 | 0.4 | 798 | 0.01 | 0.01 | 0.04 | 2.6 | 2.0 |
| Oiler/greaser | 2719 | 0.18 | 0.31 | 1.00 | 0.7 | 327 | 0.02 | 0.04 | 0.14 | 11.9 | 4.8 |
| Mechanic | 9123 | 0.18 | 0.36 | 1.20 | 1.4 | 2057 | 0.01 | 0.01 | 0.04 | 7.6 | 1.6 |
| Total shop/maintenance | 27 999 | 0.23 | 0.47 | 1.53 | 2.9 | 6132 | 0.01 | 0.02 | 0.06 | 11.5 | 1.9 |
| Froth cell operator | 479 | 0.74 | 0.97 | 2.36 | 7.1 | 272 | 0.01 | 0.01 | 0.03 | 7.4 | 1.2 |
| Fine coal plant operator | 3773 | 0.49 | 0.80 | 2.20 | 6.2 | 1592 | 0.01 | 0.02 | 0.05 | 10.7 | 1.4 |
| Scalper-screen operator | 1280 | 0.49 | 0.94 | 2.80 | 10.3 | 421 | 0.02 | 0.03 | 0.10 | 22.3 | 2.0 |
| Dryer operator | 834 | 0.39 | 0.69 | 1.80 | 3.4 | 258 | 0.01 | 0.01 | 0.04 | 8.9 | 1.2 |
| Washer Operator | 1365 | 0.31 | 0.49 | 1.42 | 1.3 | 408 | 0.01 | 0.02 | 0.04 | 3.9 | 1.8 |
| Cleaning plant operator | 7237 | 0.28 | 0.50 | 1.43 | 1.8 | 2154 | 0.01 | 0.01 | 0.04 | 5.8 | 1.4 |
| Crusher attendant | 1699 | 0.27 | 0.49 | 1.50 | 2.4 | 414 | 0.02 | 0.04 | 0.13 | 17.4 | 4.3 |
| Coal sampler | 1767 | 0.25 | 0.51 | 1.51 | 3.3 | 350 | 0.02 | 0.03 | 0.08 | 11.1 | 2.5 |
| Utility man | 6615 | 0.24 | 0.42 | 1.32 | 1.5 | 2332 | 0.01 | 0.02 | 0.05 | 5.5 | 2.1 |
| Tipple operator | 7301 | 0.23 | 0.46 | 1.49 | 2.6 | 1212 | 0.01 | 0.02 | 0.05 | 9.4 | 1.5 |
| Car dropper | 1370 | 0.18 | 0.30 | 0.92 | 0.9 | 90 | 0.01 | 0.02 | 0.05 | 12.2 | 1.5 |
| Preparation plant foreman safety director | 1092 | 0.18 | 0.30 | 0.91 | 0.3 | 168 | 0.01 | 0.02 | 0.04 | 1.8 | 2.1 |
| Car trimmer/car loader | 1152 | 0.16 | 0.25 | 0.72 | 0.6 | 84 | 0.01 | 0.01 | 0.03 | 6.0 | 2.4 |
| Barge attendant | 1007 | 0.12 | 0.20 | 0.60 | 0.1 | 62 | 0.01 | 0.01 | 0.03 | 3.2 | 1.5 |
| Weighman | 1677 | 0.10 | 0.17 | 0.51 | 0.1 | 65 | 0.01 | 0.01 | 0.03 | 4.6 | 1.3 |
| Total prep facility | 39 699 | 0.26 | 0.49 | 1.50 | 2.6 | 10 225 | 0.01 | 0.02 | 0.05 | 8.3 | 1.8 |
| Cleanup man | 2675 | 0.43 | 0.70 | 2.10 | 5.4 | 1048 | 0.01 | 0.02 | 0.05 | 11.1 | 1.7 |
| Belt man/conveyor man | 1202 | 0.27 | 0.44 | 1.31 | 1.7 | 403 | 0.01 | 0.02 | 0.06 | 8.2 | 2.4 |
| Conveyor operator | 585 | 0.25 | 0.46 | 1.50 | 2.2 | 98 | 0.02 | 0.04 | 0.11 | 12.2 | 3.6 |
| Forklift operator | 918 | 0.12 | 0.20 | 0.60 | 0.2 | 139 | 0.01 | 0.02 | 0.06 | 5.8 | 2.8 |
| Outside foreman | 840 | 0.11 | 0.20 | 0.68 | 0.1 | 77 | 0.01 | 0.02 | 0.07 | 3.9 | 2.9 |
| Total misc | 7099 | 0.24 | 0.46 | 1.50 | 2.6 | 1994 | 0.01 | 0.02 | 0.06 | 9.1 | 2.2 |
| Jobs with <400 dust samples | 3812 | 0.16 | 0.37 | 1.10 | 1.1 | 778 | 0.01 | 0.02 | 0.06 | 6.0 | 2.5 |
| Total all areas and occupations | 288 705 | 0.17 | 0.35 | 1.13 | 1.6 | 54 040 | 0.02 | 0.06 | 0.20 | 15.3 | 7.2 |
Abbreviations: AM, Arithmetic mean mg/m3; (D), drillers occupation; GM, Geometric mean mg/m3; PEL, permissible exposure limit; 95th, 95th percentile mg/m3.
The bold values are summaries of number of samples, averages, etc, for each section including strip mine, shop/maintenance, prep facility and misc, and summary for all samples, and averages.
Overall, the geometric mean and arithmetic mean for respirable dust, respectively, were significantly higher in central Appalachia (0.19; 0.38 mg/m3) than the rest of U.S. (0.15; 0.33 mg/m3), P < .05.
3.2 |. Respirable quartz dust
The annual percentages of respirable dust samples containing quartz that exceed the PEL or the reduced PEL are shown in Table 1. Of the 54 040, respirable quartz samples collected during 1982–2017 included in the analysis; 10 245 samples (19.0%) were less than the MQC and were imputed, and 15.3% of the samples exceeded the applicable dust standard (PEL or reduced PEL). The overall respirable quartz geometric mean and arithmetic mean were 0.02 and 0.06 mg/m3, respectively. In general, there was a decline over time in respirable quartz concentrations, but the mean percent quartz in the samples was similar over time and remained above 5% in all but 1 year (2010) (Table 1). The annual respirable quartz concentration geometric mean and arithmetic mean are presented in Figure 2. Although the mean exposures were declining over time, the 95th percentile averaged 0.20 mg/m3 indicating there was substantial exposure to respirable quartz during the time period analyzed (Table 1).
FIGURE 2.
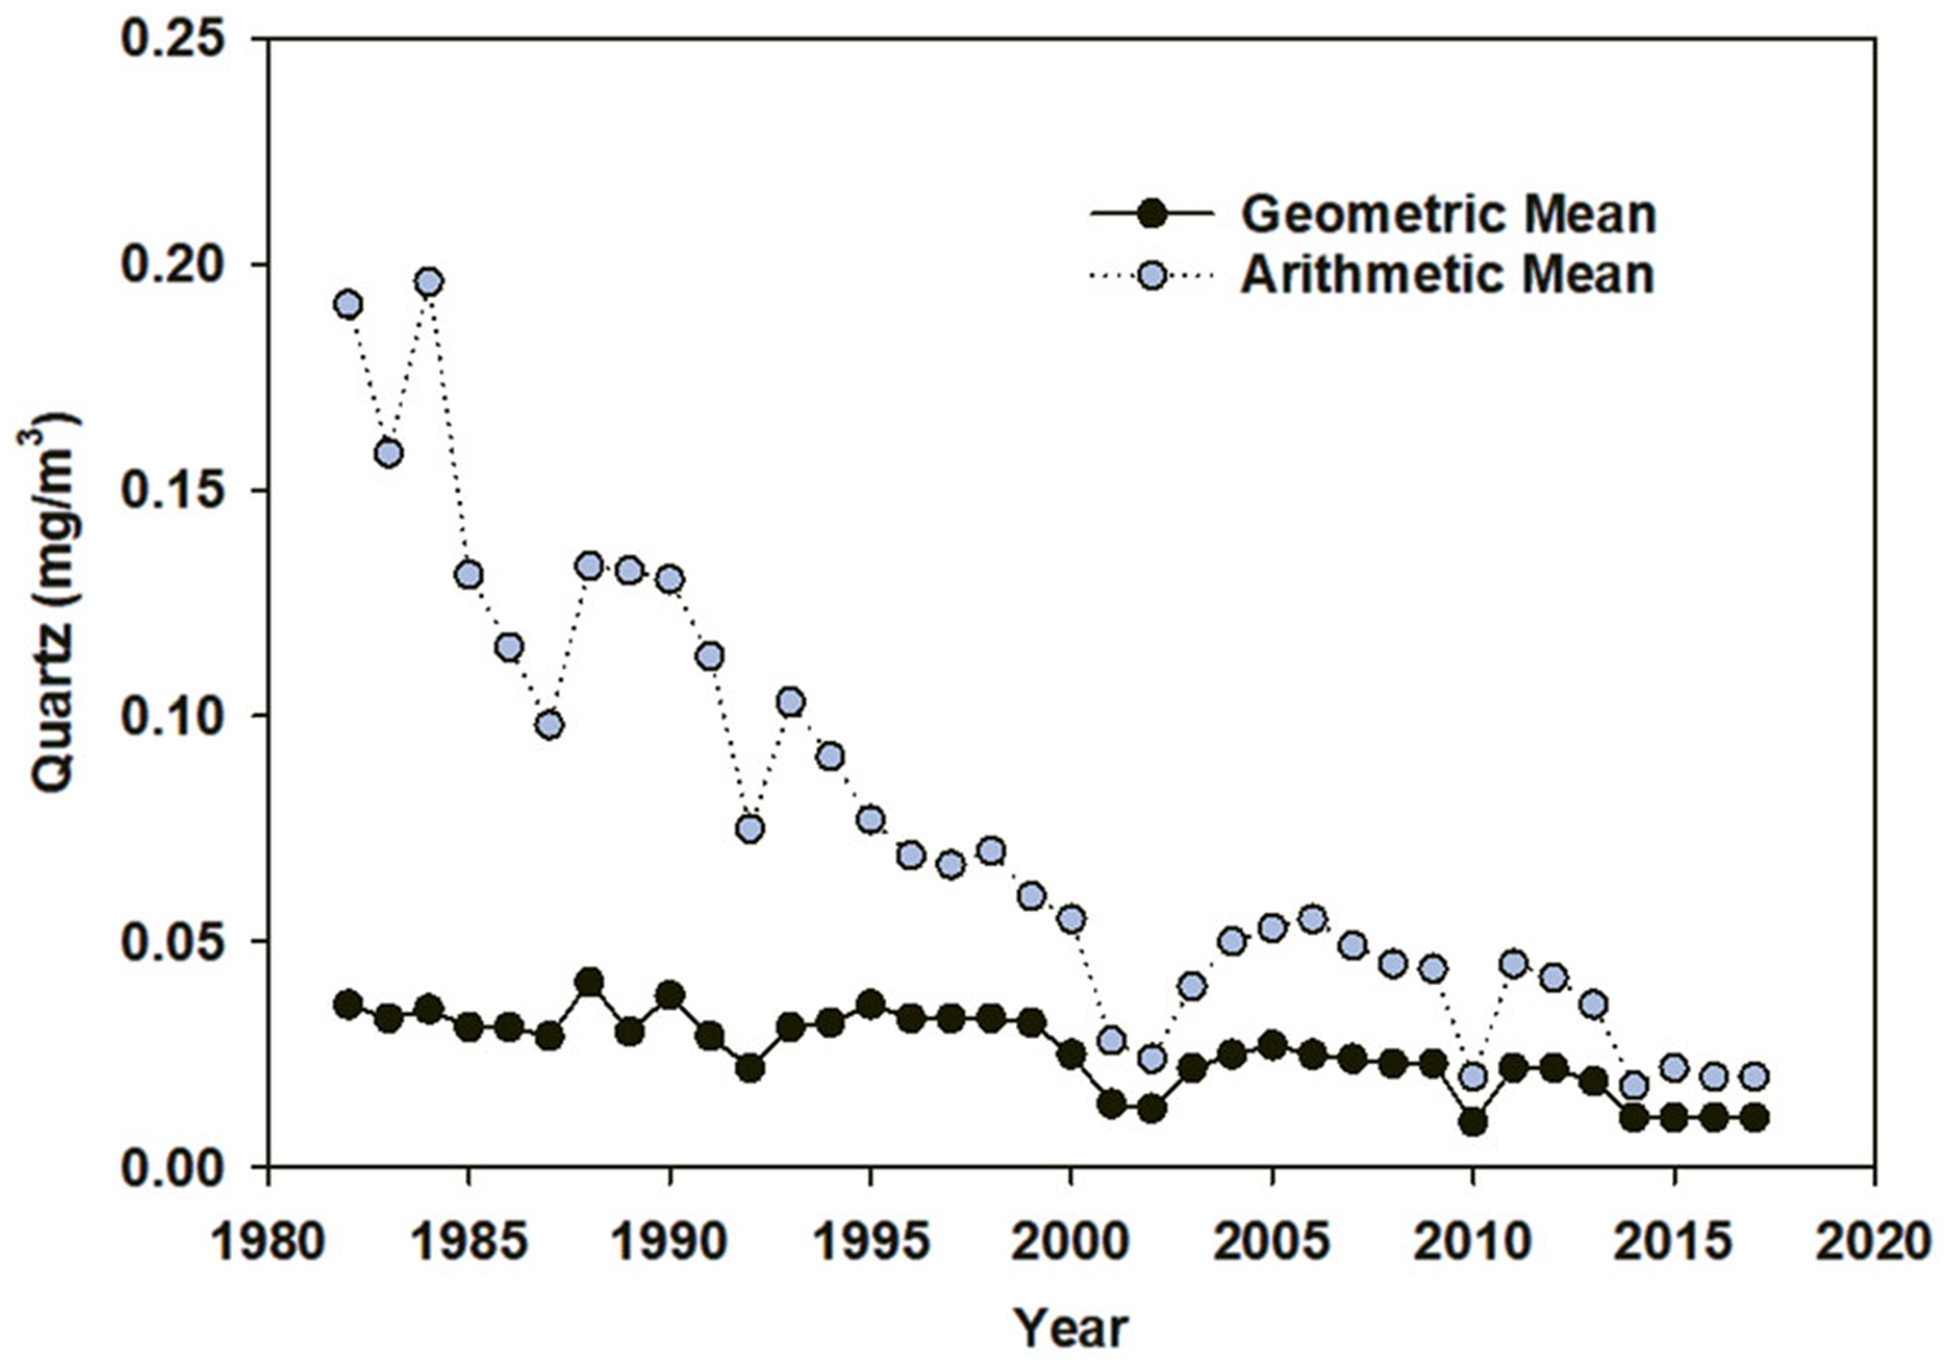
Annual geometric and arithmetic mean respirable quartz by year, 1982–2017
The occupations with the highest geometric mean and arithmetic mean respirable quartz exposures included highwall drill helper (0.09; 0.24 mg/m3), rock driller (0.07; 0.17 mg/m3), highwall drill operator (0.06; 0.16 mg/m3), blaster/shooter/shotfirer (0.05; 0.07 mg/m3), scraper operator (0.05; 0.10 mg/m3), coal drill operator (0.05; 0.15 mg/m3), and bulldozer operator (0.04; 0.08 mg/m3) (Table 2).
Among the drilling occupations, more than 32% of quartz samples exceeded the PEL. The respirable quartz arithmetic mean for the drilling occupations was 0.15 mg/m3, which was nearly three times higher than the average of all other occupational exposure (0.04 mg/m3). The mean percent quartz in drilling occupations samples analyzed for quartz was nearly double the average (13.2% vs 7.2%). The results for respirable quartz for the strip mine were higher than the other areas. Occupations in the prep facility area including the scalper-screen operator, crusher attendant, car dropper, coal sampler, and fine coal plant operator had over 10% of the respirable dust samples containing quartz that exceeded the respirable dust PEL (or reduced PEL).
The mean percent quartz in samples was significantly higher in central Appalachia compared to the rest of U.S. (7.5% vs 7.0%; P < .05). The mean percent quartz was usually above 5% in all MSHA coal mine districts. The geometric mean for respirable quartz was slightly, but significantly higher in central Appalachia (0.021 vs 0.020 mg/m3; P < .05).
4 |. DISCUSSION
To the best of our knowledge, a comprehensive assessment of respirable dust and respirable quartz exposures at U.S. surface coal mines has not been conducted. During 1982–2017, greater than 15% of respirable coal mine dust samples analyzed for quartz content exceeded the MSHA respirable dust PEL or the reduced PEL. Furthermore, nearly one-third of samples from drilling occupations exceeded the respirable dust PEL or reduced PEL, consistent with the epidemiological data indicating this surface mining occupation is at a higher risk for pneumoconiosis. In addition, MSHA has a surface mine drill dust control standard (30 CFR 72.620) that is enforced by inspector observation and is independent of air monitoring. Since 2000, MSHA has issued nearly 2200 citations for inadequate drill dust controls. We found higher respirable coal dust and quartz concentrations in central Appalachian surface mines compared to those in the rest of the United States. Annually, the surface mine national mean percent quartz was 5% or greater for nearly the entire study period (1982–2017), with a peak of 9.9% in 1998. The mean percent quartz was significantly higher in central Appalachia (7.5%) than the rest of the United States (7.0%). Importantly, both were higher than the underground mine samples mean percent quartz (6.7%) for central Appalachia and the rest of the United States (3.9%).10
Excessive exposure to respirable quartz can lead to silicosis, an irreversible and often progressive occupational respiratory disease. Silicosis has been previously documented in surface miners and excessive exposure to quartz has been implicated in the resurgence of severe pneumoconiosis in underground miners.21–23 Previous studies have investigated the quartz content of MSHA samples and found that even in samples with less than 5% quartz content, 26.3% of these samples exceeded 100 μg/m3 of respirable quartz, which was the equivalent of the PEL for samples containing quartz.24,25 Particle size may also be a factor and Mischler et al26 found that smaller crystalline silica particle size with a geometric mean of 0.3 μm had increased mitochondrial reactive oxygen species generation compared to silica particles with a geometric mean of 4.1 μm. Johann-Essex et al27 found that samples from mines in mid-central Appalachia (MSHA District 4) had a higher percentage of very small particles and quartz than mines in more northern Appalachia. The characteristics of occupations and areas of work are key to understanding the distributions of exposures. Occupations in the strip mine such as drilling occupations, scraper operator, and bulldozer occupations disturb overburden and have the highest mean respirable quartz concentrations, while occupations in preparation facilities and shop/maintenance had higher respirable dust concentrations than strip mine occupations.
The respirable dust and respirable quartz exposure findings presented in this study could inform our understanding of differences in the distribution of respiratory disease and help guide interventions to reduce exposure. The MSHA 2014 rulemaking and subsequent NIOSH medical surveillance standards made a number of enhancements to the prior regulatory requirements including reductions in the PEL and establishment of medical surveillance for surface miners. We anticipate this surveillance will help identify cases of pneumoconiosis and help prevent the progression of the disease.
It is important to characterize the exposures of surface coal miners and understand the occupations at greatest risk of developing dust-related respiratory illness so steps can be taken to reduce preventable occupational lung diseases associated with surface coal mining. Data presented in this report can support that effort. It is also important to adequately characterize respiratory morbidity among U.S. surface coal miners. To that end, in 2010, NIOSH launched an initiative to conduct respiratory disease surveillance among U.S. surface coal miners. Our next objective will focus on the respiratory disease burden of U.S. surface coal miners using data that is currently being collected.
5 |. CONCLUSIONS
There was a decline over time in the number of respirable surface coal mine dust samples exceeding the 2.0 mg/m3 PEL. Overall, the respirable dust geometric mean was higher in central Appalachia compared to the rest of the United States. Additionally, both the respirable quartz geometric mean and the mean percent quartz in central Appalachia were higher than the rest of the country. We found that 1.6% of surface mine respirable dust samples exceeded 2.0 mg/m3 and 15.3% of respirable dust samples containing quartz exceeded the respirable dust standard or the reduced standard. Overexposures to respirable dust containing quartz continue to occur at U.S. surface coal mines, particularly among miners in drilling occupations. Enhanced efforts to control quartz exposures is warranted.
ACKNOWLEDGMENTS
The authors thank technical reviewers Gerald Joy and Emanuele Cauda of NIOSH for providing insightful comments during the manuscript development. The authors are government employees and the work performed in the course of their normal duties. The work was performed at Respiratory Health Division, National Institute for Occupational Safety and Health, Centers for Disease Control and Prevention, Morgantown, WV.
Footnotes
CONFLICT OF INTERESTS
The authors declare that there is no conflict of interests.
DISCLOSURE BY AJIM EDITOR OF RECORD
John Meyer declares that he has no conflict of interest in the review and publication decision regarding this article.
ETHICS APPROVAL AND INFORMED CONSENT
Data was collected for compliance purposes and is di-identified and publicly available. No reviews and approvals needed.
Publisher's Disclaimer: DISCLAIMER
Publisher's Disclaimer: The findings and conclusions of this report are those of the authors and do not necessarily represent the views of the National Institute for Occupational Safety and Health. Mention of a specific product or company does not constitute an endorsement by the Centers for Disease Control and Prevention.
REFERENCES
- 1.Blackley DJ, Halldin CN, Laney AS. Continued increase in prevalence of coal workers’ pneumoconiosis in the United States, 1970–2017. Am J Public Health. 2018;108:1220–1222. [DOI] [PMC free article] [PubMed] [Google Scholar]
- 2.Blackley DJ, Crum JB, Halldin CN, Storey E, Laney AS. Resurgence of progressive massive fibrosis in coal miners — eastern Kentucky, 2016. MMWR Morb Mortal Wkly Rep. 2016;65: 1385–1389. [DOI] [PubMed] [Google Scholar]
- 3.Blackley DJ, Halldin CN, Laney AS. Resurgence of a debilitating and entirely preventable respiratory disease among working coal miners. Am J Respir Crit Care Med. 2014;190:708–709. [DOI] [PMC free article] [PubMed] [Google Scholar]
- 4.Blackley DJ, Reynolds LE, Short C, et al. Progressive massive fibrosis in coal miners from 3 clinics in Virginia. JAMA. 2018;319: 500–501. [DOI] [PMC free article] [PubMed] [Google Scholar]
- 5.Blackley DJ, Halldin CN, Cummings KJ, Laney AS. Lung transplantation is increasingly common among patients with coal workers’ pneumoconiosis: lung transplantation for coal workers’ pneumoconiosis. Am J Ind Med. 2016;59:175–177. [DOI] [PMC free article] [PubMed] [Google Scholar]
- 6.Almberg KS, Halldin CN, Blackley DJ, et al. Progressive massive fibrosis resurgence identified in U.S. coal miners filing for black lung benefits, 1970–2016. Ann Am Thorac Soc. 2018;15:1420–1426. [DOI] [PMC free article] [PubMed] [Google Scholar]
- 7.Centers for Disease Control and Prevention. Pneumoconiosis and advanced occupational lung disease among surface coal miners-16 states, 2010–2011. MMWR Morb Mortal Wkly Rep. 2012;61:431–434. [PubMed] [Google Scholar]
- 8.Halldin CN, Reed WR, Joy GJ, et al. Debilitating lung disease among surface coal miners with no underground mining tenure. J Occup Environ Med. 2015;57:62–67. [DOI] [PMC free article] [PubMed] [Google Scholar]
- 9.Reynolds LE, Blackley DJ, Laney AS, Halldin CN. Respiratory morbidity among U.S. coal miners in states outside of central Appalachia. Am J Ind Med. 2017;60:513–517. [DOI] [PMC free article] [PubMed] [Google Scholar]
- 10.Doney BC, Blackley D, Hale JM, et al. Respirable coal mine dust in underground mines, United States, 1982–2017. Am J Ind Med. 2019;62: 478–485. [DOI] [PMC free article] [PubMed] [Google Scholar]
- 11.MSHA Part 50 Data. https://www.msha.gov/data-reports/data-Sources-calculators#part50. Accessed April 12, 2019.
- 12.Banks DE, Bauer MA, Castellan RM, Lapp NL. Silicosis in surface coalmine drillers. Thorax. 1983;38:275–278. [DOI] [PMC free article] [PubMed] [Google Scholar]
- 13.Amandus HE, Kanke W, Kullman G, Geger RB. A re-evaluation of radiological evidence from a study of U.S. strip coal miners. Arch Environ Health. 1984;39:346–351. [DOI] [PubMed] [Google Scholar]
- 14.Amandus HE, Petersen MR, Richards TB. Health status of anthracite surface coal miners. Arch Environ Health. 1989;44:75–81. [DOI] [PubMed] [Google Scholar]
- 15.Amandus HE, Piacitelli G. Dust exposures at U.S. surface coal mines in 1982–1983. Arch Environ Health. 1987;42:374–380. [DOI] [PubMed] [Google Scholar]
- 16.Piacitelli GM, Amandus HE, Dieffenbach A. Respirable dust exposures in U.S. surface coal mines (1982–1986). Arch Environ Health. 1990;45: 202–209. [DOI] [PubMed] [Google Scholar]
- 17.National Institute for Occupational Safety and Health (NIOSH). Criteria for a Recommended Standard: Occupational Exposure to Respirable Coal Mine Dust, DHHS (NIOSH) Pub. No. 95–106 Cincinnati, OH: NIOSH, 1995. https://www.cdc.gov/niosh/docs/95-106/pdfs/95-106.pdf. Accessed April 4, 2018. [Google Scholar]
- 18.MSHA web site. https://www.msha.gov. Accessed April 17, 2019.
- 19.Hornung RW, Reed L. Estimation of average concentration in the presence of nondetectable values. Appl Occup Environ Hyg. 1990;5: 46–51. [Google Scholar]
- 20.National Institute for Occupational Safety and Health. (1996). NIOSH Technical Report: Results from the National Occupational Health Survey of Mining (NOHSM), DHHS (NIOSH) Pub. No. 96–136 Cincinnati, OH: NIOSH. [Google Scholar]
- 21.Hall NB, Blackley DJ, Halldin CN, Laney AS. Continued increase in prevalence of r-type opacities among underground coal miners in the USA. Occup Environ Med. 2019;76:479–481. [DOI] [PMC free article] [PubMed] [Google Scholar]
- 22.Cohen RA, Petsonk EL, Rose C, et al. Lung pathology in U.S. coal workers with rapidly progressive pneumoconiosis implicates silica and silicates. Am J Respir Crit Care Med. 2016;193:673–680. [DOI] [PMC free article] [PubMed] [Google Scholar]
- 23.Centers for Disease Control and Prevention. Silicosis screening in surface coal miners--Pennsylvania, 1996–1997. MMWR Morb Mortal Wkly Rep. 2000;49:612–615. [PubMed] [Google Scholar]
- 24.Joy GJ. Evaluation of the approach to respirable quartz exposure control in U.S. coal mines. J Occup Environ Hyg. 2012;9:65–68. [DOI] [PubMed] [Google Scholar]
- 25.Cauda E, Joy GJ, Miller A, Mischler SE (2013). Analysis of the silica percent in airborne respirable mine dust samples from U.S. operations: ASTM STP1565 on Symposium on Silica and Associated Respirable Mineral Particles, October 25, 2012 - October 26, 2012, in Atlanta, GA. [Google Scholar]
- 26.Mischler SE, Cauda EG, Di Giuseppe M, et al. Differential activation of RAW 264.7 macrophages by size-segregated crystalline silica. J Occup Med Toxicol. 2016;11(57):1–14. [DOI] [PMC free article] [PubMed] [Google Scholar]
- 27.Johann-Essex V, Keles C, Rezaee M, Scaggs-Witte M, Sarver E. Respirable coal mine dust characteristics in samples collected in central and northern Appalachia. Int J Coal Geol. 2017;182:85–93. [Google Scholar]