

Abstract
Purpose
To characterize inheritance, penetrance, and trinucleotide repeat expansion stability in Fuchs endothelial corneal dystrophy (FECD).
Methods
One thousand unrelated and related subjects with and without FECD were prospectively recruited. CTG18.1 repeat length (CTG18.1L) was determined via short tandem repeat assay and Southern blotting of leukocyte DNA. Multivariable logistic regression and generalized estimating equation models were employed.
Results
There were 546 unrelated FECD cases (67.6% female; 70 ± 10 years) and 235 controls (63.8% female; 73 ± 8 years; all ≥ 50 years). CTG18.1 expansion (CTG18.1exp+) was observed in 424 (77.7%) cases and 18 (7.7%) controls (P = 2.48 × 10–44). CTG18.1 expansion was associated with FECD severity (P = 5.62 × 10⁻⁷). The family arm of the study included 331 members from 112 FECD-affected families; 87 families were CTG18.1exp+. Autosomal dominant inheritance with variable expression of FECD was observed, regardless of expansion status. FECD penetrance of CTG18.1 expansion increased with age, ranging from 44.4% in the youngest (19–46 years) to 86.2% in the oldest (64–91 years) age quartiles. Among 62 parent–offspring transmissions of CTG18.1exp+, 48 (77.4%) had a change in CTG18.1L ≤ 10 repeats, and eight (12.9%) were ≥50 repeats, including five large expansions (∼1000–2000 repeats) that contracted. Among 44 offspring who did not inherit the CTG18.1exp+ allele, eight (18.2%) exhibited FECD.
Conclusions
CTG18.1 expansion was highly associated with FECD but demonstrated incomplete penetrance. CTG18.1L instability occurred in a minority of parent–offspring transmissions, with large expansions exhibiting contraction. The observation of FECD without CTG18.1 expansion among family members in CTG18.1exp+ families highlights the complexity of the relationship between the FECD phenotype and CTG18.1 expansion.
Keywords: fuchs, CTG18.1 expansion, intergenerational instability
Fuchs endothelial corneal dystrophy (FECD) is a highly prevalent, bilateral, late-onset heritable disorder that affects the corneal endothelium, the innermost non-regenerating monolayer of cells that maintains relative deturgescence and clarity of the cornea. The clinical hallmark of FECD is excrescence of Descemet membrane (guttae), the basement membrane of the corneal endothelium.1 Disease progression with age involves an increasing density of guttae and attrition of endothelial cells, resulting in progressive corneal edema associated with endothelial cell dysfunction and loss, loss of visual acuity, and, in severe cases, corneal transplantation. FECD is the most common trinucleotide repeat (TNR) expansion disorder, with approximately 80% of Caucasian patients with FECD harboring an intronic cytosine–thymine–guanine (CTG) TNR expansion in the transcription factor 4 (TCF4) gene on chromosome 18, also termed CTG18.1 expansion.2–4 A CTG18.1 expansion length of approximately ≥40 repeats confers increased FECD risk, which is observed in Caucasian, Australian, Asian, Indian, and African American populations.2–10
Much of our current understanding of the molecular pathogenesis of FECD comes from other TNR expansion disorders such as Huntington disease, spinocerebellar ataxia, and myotonic dystrophy type 1.11 Short TNR expansions are typically stable and non-pathologic, whereas TNR expansions surpassing a certain threshold tend to be unstable, both somatically and intergenerationally, and contribute to disease through gain-of-function mechanisms such as RNA toxicity, in which transcribed repeat RNA accumulates intranuclearly and sequesters RNA splicing factors such as muscleblind-like 1.12 Depending on whether transmission is maternal or paternal, TNR expansion disorders may also demonstrate clinical anticipation, which refers to phenotypic presentation at younger ages or increased disease severity in subsequent generations, and intergenerational repeat length instability, in which TNR expansions significantly lengthen or shorten between generations.13 Myotonic dystrophy type 1, for example, is caused by a non-coding CTG repeat expansion and may present with profound anticipation and intergenerational repeat length instability skewed toward expansions, particularly when transmitted maternally.14 Although clinical anticipation is not considered a usual feature of FECD, anticipation has been described in a family of three FECD-affected patients in three consecutive generations; however, CTG18.1 expansion was not present in this family.15
Other than CTG18.1 expansion, genetic variants implicated in FECD pathogenesis include COL8A2, SLC4A11, AGBL1, LOXHD1, DMPK, and ZEB1,9,16–22 which were mostly identified from specific extended multiplex FECD families. A recent genome-wide association study identified three novel potential loci for FECD pathogenesis (KANK4, LAMC1, and ATP1B1); yet, TCF4 variants remain the strongest association.23 Among FECD cases without CTG18.1 expansion, no known genetic variant appears to contribute the majority of FECD risk.
It remains unclear as to what extent CTG18.1 expansion in FECD demonstrates phenomena observed in other TNR expansion disorders, such as intergenerational instability of the repeat length.24 The specific aims of this study were to describe the clinical and genetic variables in a large cohort of unrelated subjects with and without FECD, as well as in a cohort of FECD families with and without CTG18.1 expansion. We also sought to characterize the modes of inheritance of FECD, intergenerational CTG18.1 expansion length stability, phenotypic penetrance, and sex differences.
Methods
Study Participants
This research was approved by the institutional review boards of Mayo Clinic and Duke University, adhered to the tenets of the Declaration of Helsinki, and complied with the Health Insurance Portability and Accountability Act. Study participants were prospectively recruited from June 1, 2007, through August 1, 2019, into the Mayo Clinic Hereditary Eye Disease Study and the Duke Eye Center Fuchs Genetics Study after informed consent. Patients who initially sought ophthalmic care for FECD were defined as probands, and family members were invited to participate in this study. Data on all available family members were included, irrespective of family member age. A control group was generated by recruiting unrelated subjects who were ≥50 years old and without FECD and who had been seen within the practices of the clinician investigators (NAA, KHB, WLB, LJM, SVP). FECD severity was ascertained by the clinician investigators via slit-lamp biomicroscopy, using the modified Krachmer grading system: grade 0 (no guttae) through grade 6 (confluent guttae with edema).25,26 FECD cases were defined as patients with a Krachmer grade of ≥2 (>12 scattered, non-confluent guttae). Controls were defined as patients with a Krachmer grade 0 (no guttae) or grade 1 (≤12 scattered, non-confluent guttae). With respect to FECD disease severity, grades 2 to 4 were defined as mild FECD, and grades 5 to 6 were defined as severe FECD. The Krachmer grade of the worse eye was used for analysis.
CTG18.1 Expansion Length
DNA was extracted from peripheral blood leukocytes to determine CTG18.1 repeat length (CTG18.1L) using direct sequencing and short tandem repeat assay of PCR-amplified DNA, described previously by our group.6 For samples in which only one repeat length was identified, Southern blotting was performed to differentiate bi-allelic CTG18.1L of the same size from the presence of a large CTG18.1 expansion (generally, >120 repeats) that could not be detected with aforementioned techniques. CTG18.1L determined by Southern blotting was assigned approximate values by comparing the size of the largest product bands to the 1-kb ladder (Thermo Fisher Scientific, Waltham, MA, USA) that was run on each individual blot. Product size was estimated to the nearest 0.5 kb for bands < 3 kb and to the nearest 1 kb for bands > 3 kb. CTG18.1L determined by short tandem repeat analysis (≤120 repeats) was assumed to be accurate within three repeats. Patients with CTG18.1L < 40 repeats of both alleles were defined as CTG18.1, indicating the normal unexpanded state. Subjects with uni-allelic CTG18.1 expansion of ≥40 repeats were defined as CTG18.1exp+/–, and those with bi-allelic CTG18.1 expansion of ≥40 repeats were defined as CTG18.1exp+/+. Subjects who were either CTG18.1exp+/– or CTG18.1exp+/+ were considered CTG18.1exp+ patients. Families were defined as CTG18.1exp+ if they contained at least one parent that was CTG18.1exp+ or if the proband was defined as CTG18.1exp+ when no parent genotype was available. All other families were defined as CTG18.1.
Statistical Analysis
Demographic characteristics and other variables of interest were reported as frequency (percentage) for categorical variables and mean (SD) for continuous variables. Differences in each variable between FECD cases and controls were compared using the χ2 test or two-sample t-test as appropriate. To ascertain the effect of CTG18.1 expansion on FECD, analysis was performed using dichotomized CTG18.1 status (CTG18.1 expansion vs. CTG18.1) and continuous CTG18.1L. Penetrance of CTG18.1 expansion on FECD phenotype was defined as the ratio of CTG18.1exp+ FECD patients to all CTG18.1exp+ subjects.
For the unrelated case–control dataset, multivariable logistic regression models were performed to assess the association of CTG18.1 expansion status and CTG18.1L with FECD after covariate adjustment in the overall dataset (age- and sex-adjusted) and the sex-stratified subsets (age-adjusted), respectively. For the family dataset, descriptive statistics of each variable were computed for FECD and non-FECD family members. To account for familial correlation, the generalized estimating equation (GEE) was used to analyze the association between CTG18.1 expansion and FECD using exchangeable covariance structure. GEE analyses were performed for CTG18.1 expansion status and CTG18.1L with covariate adjustment for age and sex. The same analysis was performed in CTG18.1exp+ families.
To evaluate the intergenerational stability of CTG18.1 expansion, we analyzed offspring with available parental CTG18.1L data. We applied the strategy of orthogonal decomposition of genotype score used in family-based association tests to our data,27,28 where we partitioned individual CTG18.1L into two orthogonal components: the shared CTG18.1L with the parent and the deviation of the offspring's CTG18.1L from the shared parental CTG18.1L (CTG18.1L,D). Importantly, shared CTG18.1L with the parent should ideally be the CTG18.1L transmitted from parent to offspring. However, because most families had CTG18.1 expansion data from only one parent, CTG18.1L from the available parent was used. When data from both parents were available, CTG18.1L closer to the offspring's was used. For subjects with no available parental CTG18.1L data, CTG18.1L,D was defined as the deviation of individual's CTG18.1L from the median repeat length among all siblings. Descriptive statistics were compared between affected and unaffected FECD subjects and between father and mother transmission. Statistical analysis was performed in R 4.0.0 (R Foundation for Statistical Computing, Vienna, Austria) using RStudio 1.2.1335 (RStudio, Inc., Boston, MA, USA).
Results
Unrelated Subjects Dataset
A total of 1000 participants were assessed (Fig. 1, Supplemental Table), including 546 unrelated FECD cases, 219 family members, and 235 unrelated control participants. Demographically, the unrelated dataset of 781 unrelated subjects included the following: 546 (69.9%) FECD cases (67.6% female; mean age ± SD, 70 ± 10 years; two [0.3%] African American), and 235 (30.1%) controls (63.8% female; mean age ± SD, 73 ± 8 years; five [2.1%] African American) (Table 1). In the unrelated dataset, 774 (99.1%) of the subjects were Caucasian. A total of 397 (72.7%) FECD cases were CTG18.1exp+/–, and 27 (4.9%) were CTG18.1exp+/+; 424 (77.7%) FECD cases were CTG18.1exp+. Among controls, 18 subjects (7.7%; 95% confidence interval [CI], 4%–11%) were CTG18.1exp+/– (Table 2). The distribution of CTG18.1L among cases and controls is illustrated in Figure 2.
Figure 1.
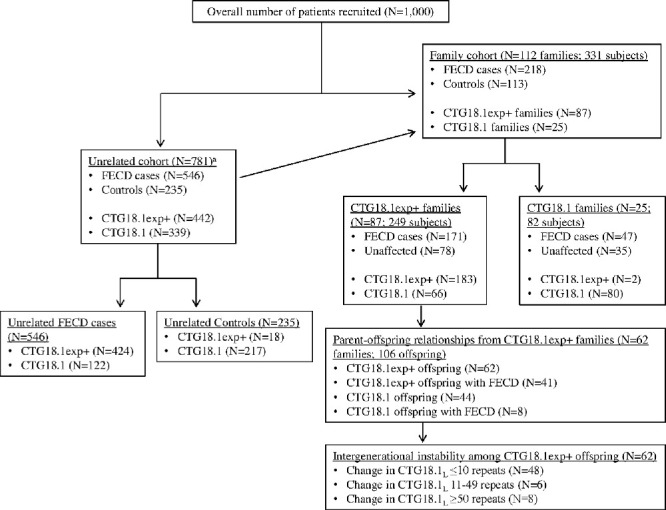
Distribution of FECD cases versus control subjects and CTG18.1exp+ versus CTG18.1 subjects in the unrelated and family cohorts. All probands from the family cohort were included in the unrelated cohort.
Table 1.
Clinical and Genetic Characteristics in the Unrelated Case–Control and Family Cohorts
| Unrelated Case–Control Cohort (n = 781) | Family Cohort (n = 331; 112 Families) | |||||
|---|---|---|---|---|---|---|
| Characteristic | FECD (n = 546) | Non-FECD (n = 235) | P | FECD (n = 218) | Non-FECD (n = 113) | P |
| Female, n (%) | 369 (67.6) | 149 (63.8) | 0.35 | 163 (74.8) | 75 (66.4) | 0.14 |
| Age (y), mean (SD) | 70.1 (10.0) | 72.6 (8.4) | <0.001 | 64.5 (13.8) | 52.9 (15.0) | <0.001 |
| Krachmer grade, n (%) | <0.001 | <0.001 | ||||
| 0 | 0 (0) | 224 (95.3) | 0 (0) | 97 (85.8) | ||
| 1 | 0 (0) | 11 (4.7) | 0 (0) | 15 (14.2) | ||
| 2 | 53 (9.7) | 0 (0) | 39 (17.9) | 0 (0) | ||
| 3 | 80 (14.7) | 0 (0) | 40 (18.3) | 0 (0) | ||
| 4 | 49 (9.0) | 0 (0) | 23 (10.6) | 0 (0) | ||
| 5 | 54 (9.9) | 0 (0) | 17 (7.8) | 0 (0) | ||
| 6 | 310 (56.8) | 0 (0) | 99 (45.4) | 0 (0) | ||
| CTG18.1L, mean (SD) | 110 (264) | 32 (130) | <0.001 | 140 (373) | 69 (262) | 0.05 |
| CTG18.1 expansion status, n (%) | <0.001 | <0.001 | ||||
| CTG18.1exp+ | 424 (77.7) | 18 (7.7) | 158 (72.5) | 27 (23.9) | ||
| CTG18.1 | 122 (22.3) | 217 (92.3) | 60 (27.5) | 86 (76.1) | ||
| CTG18.1 genotype, n (%) | <0.001 | <0.001 | ||||
| CTG18.1exp–/– | 122 (22.3) | 217(92.3) | 60 (27.5) | 86 (76.1) | ||
| CTG18.1exp+/– | 397 (72.7) | 18 (7.7) | 154 (70.6) | 26 (23.0) | ||
| CTG18.1exp+/+ | 27 (4.9) | 0 (0) | 4 (1.8) | 1 (0.9) | ||
CTG18.1exp–/–; n = number of subjects; SD = standard deviation; CTG18.1L = CTG18.1 expansion length; CTG18.1exp+ = with CTG18.1 expansion; CTG18.1 = no CTG18.1 expansion; CTG18.1exp+/– = heterozygous for CTG18.1 expansion; CTG18.1exp+/+ = homozygous for CTG18.1 expansion; CTG18.1 = both alleles have no expansion.
Table 2.
Clinical Characteristics of Control Subjects Unaffected by FECD Who Had CTG18.1 Expansion From the Unrelated Cohort*
| Case ID | Age (y) | Sex | FECD Grade | CTG18.1L |
|---|---|---|---|---|
| D-124 | 74 | Female | 0 | 2000 |
| D-121 | 70 | Male | 0 | 42 |
| D-122 | 75 | Male | 0 | 93 |
| D-169 | 80 | Female | 0 | 97 |
| D-178 | 81 | Female | 0 | 88 |
| D-90 | 75 | Male | 0 | 106 |
| MC-161 | 68 | Female | 0 | 92 |
| MC-1679 | 81 | Female | 1 | 54 |
| MC-1684 | 77 | Male | 0 | 83 |
| MC-1694 | 66 | Female | 0 | 74 |
| MC-2071 | 74 | Female | 0 | 49 |
| MC-302 | 68 | Female | 0 | 92 |
| MC-337 | 82 | Female | 0 | 82 |
| MC-528 | 83 | Male | 0 | 56 |
| MC-554 | 81 | Female | 0 | 67 |
| MC-583 | 62 | Male | 0 | 74 |
| MC-641 | 85 | Female | 0 | 43 |
| MC-677 | 63 | Male | 0 | 103 |
All subjects were heterozygous for CTG18.1 expansion.
Figure 2.
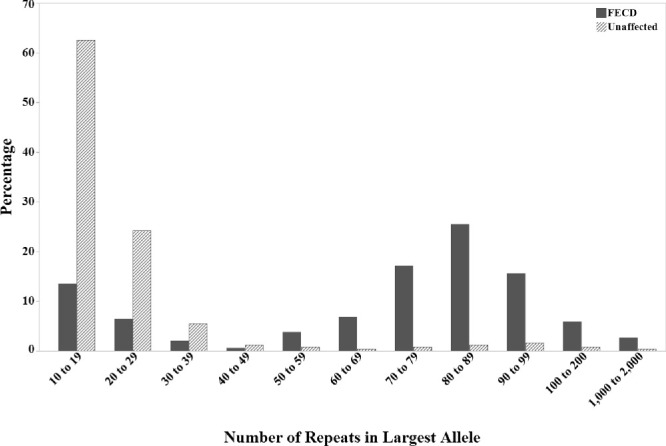
Distribution of CTG18.1 expansion length in 546 FECD cases and 235 unaffected control subjects in the unrelated case–control cohort.
A diagnosis of FECD was significantly associated with CTG18.1 expansion status (P = 2.48 × 10–44) and CTG18.1L (P = 3.38 × 10–46) after adjusting for age and sex (Table 3). However, among CTG18.1exp+ subjects (n = 424), no significant difference in CTG18.1L existed between FECD cases and controls (P = 0.47). The median CTG18.1L was 84 repeats (range, 43 to ∼2000 repeats) in the 424 CTG18.1exp+ FECD cases compared to 83 repeats (range, 42 to ∼2000 repeats) in the 18 CTG18.1exp+ controls. In the sex-stratified analysis after age adjustment, CTG18.1 expansion status (P = 4.86 × 10⁻²⁷; 2.84 × 10⁻¹⁹) and CTG18.1L (P = 1.01 × 10⁻²⁸; 1.03 × 10⁻¹⁶) were significantly associated with a diagnosis of FECD among females (n = 519) and males (n = 262), respectively.
Table 3.
Multivariable Regression Models for the Effects of CTG18.1exp+ and CTG18.1L on FECD in the Unrelated Case–Control and Family Datasets
| Unrelated Case–Control Cohort (n = 781) | Family Cohort (n = 325, 110 Families) | ||||
|---|---|---|---|---|---|
| Model | Variable | Odds Ratio (95% CI) | P | Beta (SE) | P |
| CTG18.1 expansion status | CTG18.1exp+ | 43.19 (26.13–75.58) | 2.48 × 10–44 | 2.19 (0.30) | 6.2 × 10⁻¹³ |
| Age | 0.98 (0.96–1.00) | 0.078 | 0.05 (0.01) | 2.48 × 10⁻⁶ | |
| Sex | 1.61 (1.04–2.51) | 0.036 | 0.49 (0.29) | 0.10 | |
| Log10 (CTG18.1L) | Log10 (CTG18.1L) | 189.71 (94.38–399.58) | 3.38 × 10–46 | 2.63 (0.59) | 8.0 × 10⁻⁶ |
| Age | 0.98 (0.96–1.00) | 0.04 | 0.05 (0.011) | 3.2 × 10⁻⁶ | |
| Sex | 1.41 (0.92–2.17) | 0.11 | 0.47 (0.27) | 0.07 | |
The effect of sex, CTG18.1 expansion status, and CTG18.1L on FECD severity was assessed. Among the 546 FECD cases, 133 (24.4%) had mild FECD (grade 2 to 4), whereas 413 (75.6%) were classified as severe FECD (grade 5 to 6). The proportion of females in the mild and severe FECD groups was similar, as 88 (66.2%) had mild FECD and 281 (68.0%) had severe FECD (P = 0.77). After age adjustment, sex was not associated with FECD severity (P = 0.69). Compared to mild FECD cases, severe FECD cases were more often CTG18.1exp+ and had on average greater CTG18.1L. Among the 424 CTG18.1exp+ FECD cases, 342 (80.7%) had severe FECD compared to 82 (19.3%) with mild FECD (P = 6.6 × 10⁻⁷). After age and sex adjustment, CTG18.1exp+ status remained significantly associated with FECD severity (P = 5.62 × 10⁻⁷). Finally, severe FECD was also associated with CTG18.1L among all FECD cases (P = 8.8 × 10⁻⁴), but FECD severity was not associated with CTG18.1L when examining only FECD cases with CTG18.1 expansion (P = 0.33).
Family Study
The family arm of the study included 112 probands from the 546 unrelated FECD cases and 219 family members. The total cohort of 331 subjects in 112 families—87 (79%) CTG18.1exp+ and 25 (21%) CTG18.1—included 218 (65.9%) FECD cases and 113 (34.1%) unaffected patients (Table 1). The mean number of subjects per CTG18.1exp+ family was three subjects, and family size ranged from two to 15 family members. CTG18.1L was greater in FECD cases (mean ± SD, 140 ± 373 repeats) compared to unaffected patients (mean ± SD, 69 ± 262 repeats) (P = 0.05). CTG18.1exp+ was observed in 158 (72.5%) of 218 subjects with FECD in the family cohort compared to 27 (23.9%) of 113 subjects without FECD (P < 0.001). A total of 154 (70.6%) FECD cases were CTG18.1exp+/–, and four (1.8%) were CTG18.1exp+/+, implying autosomal dominant inheritance of the CTG18.1 expansion. Example pedigrees of CTG18.1exp+ and CTG18.1 families that demonstrate autosomal dominant inheritance are illustrated in Figure 3. Penetrance of FECD associated with CTG18.1exp+ in the family cohort was estimated at 85.4%.
Figure 3.

Representative pedigrees of FECD-affected families listing subject ID, age at time of examination, and repeat length in both alleles. (A) CTG18.1 family demonstrating autosomal dominant inheritance. (B–D) CTG18.1exp+ families demonstrating autosomal dominant inheritance, incomplete penetrance, and variable expression. Families 321 and 98 both had a family member (within red oval) who did not inherit CTG18.1 expansion but still had FECD. Blue outline, not examined; red outline, examined; blue shading, affected by FECD (Krachmer grade 2 to 6); unshaded, no FECD (Krachmer grade 0 to 1); red ovals, subjects who did not inherit the repeat length but were affected by FECD.
After age and sex adjustment in the overall family dataset, FECD was significantly associated with CTG18.1exp+ status (β = 2.19, standard error [SE] = 0.30, P = 6.23 × 10⁻¹³) (Table 3). Due to the right-skewed distribution of CTG18.1L (mean, 116 repeats; median, 65 repeats; range, 11 to ∼3000 repeats), log10 transformation on CTG18.1L was performed to test the effect of CTG18.1L on FECD at the log10 scale. FECD was significantly associated with log10(CTG18.1L) (β = 2.63, SE = 0.59, P = 8.0 × 10⁻⁶).
CTG18.1exp+ Families
The 249 subjects from 87 CTG18.1exp+ families included 171 (68.7%) FECD cases and 78 (31.3%) unaffected subjects (Table 4). The number of FECD-affected patients per family ranged from one to five, and 183 (73.5%) subjects were CTG18.1exp+. Average age among FECD cases (mean ± SD, 64 ± 13 years) was significantly greater than that of non-FECD cases (mean age ± SD, 53 ± 15 years) (P < 0.001). In addition, a higher proportion of CTG18.1exp+ was observed in FECD-affected cases (156, 91.2%) than in FECD-unaffected members (27, 34.6%) (P < 0.001). In the multivariable GEE model, a diagnosis of FECD was associated with CTG18.1exp+ status (β = 2.19, SE = 0.30, P = 6.2 × 10⁻¹³) and log10(CTG18.1L) (β = 2.63, SE = 0.59, P = 8.0 × 10⁻⁶) (Table 3).
Table 4.
Clinical and Genetic Characteristics in CTG18.1exp+ and CTG18.1 Families
| CTG18.1exp+ Families (87 Families, 249 Subjects) | CTG18.1 Families (25 Families, 82 Subjects) | |||||
|---|---|---|---|---|---|---|
| Characteristic | FECD (n = 171) | Non-FECD (n = 78) | P | FECD (n = 47) | Non-FECD (n = 35) | P |
| Female, n (%) | 126 (73.7) | 50 (64.1) | 0.16 | 37 (78.7) | 25 (71.4) | 0.62 |
| Age (y), mean (SD) | 64.3 (12.8) | 52.5 (14.6) | <0.001 | 65.2 (17.2) | 53.9 (15.9) | 0.003 |
| Krachmer grade, n (%) | <0.001 | <0.001 | ||||
| 0 | 0 (0) | 67 (85.9) | 0 (0) | 30 (85.7) | ||
| 1 | 0 (0) | 11 (14.1) | 0 (0) | 5 (14.3) | ||
| 2 | 29 (17.0) | 0 (0) | 10 (21.3) | 0 (0) | ||
| 3 | 30 (17.5) | 0 (0) | 10 (21.3) | 0 (0) | ||
| 4 | 18 (10.5) | 0 (0) | 5 (10.6) | 0 (0) | ||
| 5 | 13 (7.6) | 0 (0) | 4 (8.5) | 0 (0) | ||
| 6 | 81 (47.4) | 0 (0) | 18 (38.3) | 0 (0) | ||
| CTG18.1L, mean (SD) | 171 (415) | 91.1 (313) | 0.09 | 25.3 (18.3) | 20.2 (6.6) | 0.09 |
| CTG18.1 expansion status, n (%) | <0.001 | 0.61 | ||||
| CTG18.1exp+ | 156 (91.2) | 27 (34.6) | 2 (4.3) | 0 (0) | ||
| CTG18.1 | 15 (8.8) | 51 (65.4) | 45 (95.7) | 35 (100) | ||
| CTG18.1 genotype, n (%) | <0.001 | N/A | ||||
| CTG18.1exp–/– | 15(8.8) | 51(65.4) | 45 (95.7) | 35 (100) | ||
| CTG18.1exp+/– | 152 (88.9) | 26 (33.3) | 2 (4.3) | 0 (0) | ||
| CTG18.1exp+/+ | 4 (2.3) | 1 (1.3) | 0 (0) | 0 (0) | ||
Penetrance of the FECD phenotype among the 183 CTG18.1exp+ subjects increased by age quartile: 52.9% (19–50 years; n = 34), 87.8% (51–59 years; n = 41), 92.3% (60–71 years; n = 52), and 96.4% (72–91 years; n = 56). When analyzing only the 162 relatives of the 87 probands from CTG18.1exp+ families, FECD penetrance of CTG18.1exp+ was also age dependent: 44.4% (19–46 years; n = 18), 63% (47–54 years; n = 27), 86.4% (55–63 years; n = 22), and 86.2% (64–91 years; n = 29). Notably, among all subjects (including CTG18.1exp+ and CTG18.1) in the oldest interquartile age range (64–91 years old), 14 (33.3%) did not have evidence of FECD. When stratified by sex, penetrance of the FECD phenotype among all relatives was 68.6% in males and 73.8% in females (P = 0.08).
In 106 parent–offspring relationships from 62 CTG18.1exp+ families, CTG18.1exp+ status was observed in the father in 23 (21.7%) cases and the mother in 83 (78.3%). Overall, CTG18.1 expansion was transmitted to the offspring in 62 (58.5%) parent-offspring relationships, and 41 (66.1%) CTG18.1exp+ offspring exhibited the FECD phenotype, yielding an overall penetrance of 66.1%. By parental sex, transmission of the expanded repeat occurred in 15 (65.2%) father–offspring relationships and 47 (56.6%) mother–offspring relationships (P = 0.62). Of note, eight (18.2%) of the 44 offspring who did not inherit the CTG18.1 expansion allele did exhibit the FECD phenotype (Table 5).
Table 5.
Clinical Characteristics of Offspring From CTG18.1exp+ Families Affected by FECD Who Did Not Inherit the CTG18.1 Expansion
| Case ID | Family No. | Age (y) | Sex | FECD Grade | CTG18.1L | Sex of CTG18.1exp+ Parent |
|---|---|---|---|---|---|---|
| D-10 | 48 | 48 | Male | 4 | 18 | Female |
| D-25 | 353 | 48 | Male | 2 | 18 | Female |
| MC-100 | 98 | 49 | Male | 2 | 18 | Male |
| MC-142 | 14 | 39 | Female | 2 | 18 | Female |
| MC-159 | 158 | 32 | Female | 2 | 17 | Female |
| MC-172 | 2204 | 65 | Female | 2 | 19 | Female |
| MC-757 | 756 | 38 | Female | 2 | 12 | Female |
| MC-777 | 778 | 60 | Female | 2 | 12 | Female |
Intergenerational Instability
Intergenerational stability of CTG18.1 expansion was assessed by comparing the deviation in CTG18.1L (CTG18.1L,D) between parent–offspring pairs who were both CTG18.1exp+ (Fig. 4). Among the 62 CTG18.1exp+ offspring from 44 CTG18.1exp+ families, average age significantly differed between FECD cases (mean ± SD, 52.4 ± 7.6 years) and non-FECD offspring (mean age ± SD, 44.6 ± 13.9 years) (P = 0.02). No significant difference existed in CTG18.1L (P = 0.99) or CTG18.1L,D (P = 0.24) in FECD versus non-FECD offspring.
Figure 4.
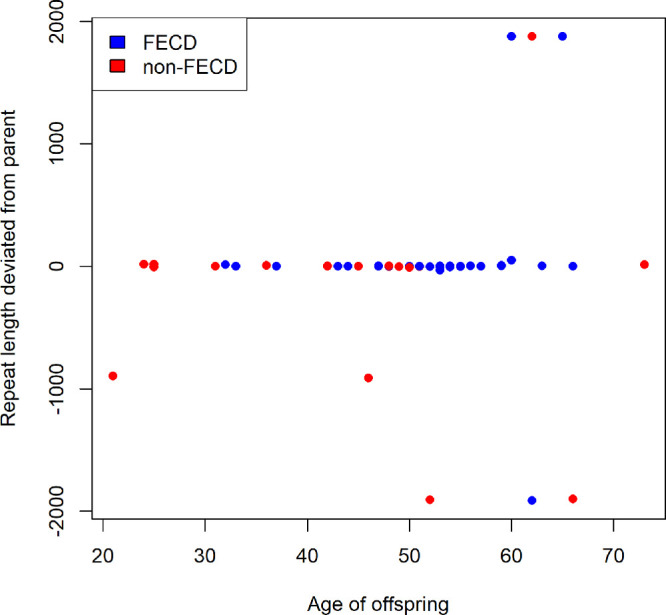
Difference in CTG18.1 repeat expansion length between CTG18.1exp+ parent and CTG18.1exp+ offspring versus age of offspring among 62 parent–offspring transmissions.
Of the 62 CTG18.1exp+ offspring, 38 (61.3%) had CTG18.1L,D ≤ 3 repeats (15 expansions, 18 contractions, five no change), which was considered within the limit of detection of a real difference in repeat length analysis. Ten offspring (16.1%) had CTG18.1L,D between four and 10 repeats (four expansions, six contractions) and six offspring (9.7%) had CTG18.1L,D > 10 to 48 repeats (five expansions, one contraction). Of the remaining eight offspring, three siblings (4.8%) within a single family had expansions of approximately 1900 repeats; five unrelated offspring (8.1%) had contractions ranging from approximately –900 to –1900 repeats (Table 6). Of note, the latter five were the only participants with parents harboring very large repeat lengths, suggesting that the offspring of a parent with a very long CTG18.1L is likely to experience a large contraction.
Table 6.
Clinical Characteristics of Offspring from CTG18.1exp+ Families With Intergenerational Instability of the CTG18.1 Expansion (≥50 Repeats)
| Case ID | Age (y) | Sex | Krachmer Grade | CTG18.1L | Sex of Parent | Krachmer Grade of Parent | CTG18.1L of Parent | Approximate CTG18.1L,D |
|---|---|---|---|---|---|---|---|---|
| Contraction | ||||||||
| MC-152 | 52 | Female | 0 | 92 | Mother | 3 | 2000 | –1900 |
| MC-181 | 62 | Female | 6 | 85 | Father | 0 | 2000 | –1900 |
| MC-226 | 21 | Male | 1 | 105 | Mother | 5 | 1000 | –900 |
| MC-290 | 66 | Female | 0 | 98 | Mother | 6 | 2000 | –1900 |
| MC-320 | 46 | Female | 0 | 86 | Mother | 6 | 1000 | –900 |
| Expansion | ||||||||
| MC-037* | 60 | Male | 6 | 2000 | Mother | 6 | 122 | 1900 |
| MC-143* | 62 | Female | 0 | 2000 | Mother | 6 | 122 | 1900 |
| MC-331* | 65 | Female | 3 | 2000 | Mother | 6 | 122 | 1900 |
Siblings within a single family.
Repeat instability was also assessed by evaluating sibling pairs for which parental data were not available in CTG18.1exp+ families. This group was comprised of 83 siblings from 31 families, for which the number of siblings per family ranged from two to six. The median absolute value of CTG18.1L,D was seven repeats (interquartile range, 32; range, 0 to ∼1900). A total of 47 (56.6%) sibling pairs had CTG18.1L,D < 10 repeats, 33 (40.2%) had intermediate-sized CTG18.1L,D between 10 and 100 repeats, and three (3.6%) had CTG18.1L,D > 100 repeats (∼450, ∼450, and ∼1900).
CTG18.1 Families
The 25 CTG18.1 families consisted of 47 FECD and 35 non-FECD family members (Table 4). Average age ± SD significantly differed between FECD (65 ± 17 years) and non-FECD (54 ± 16 years) family members (P = 0.003), whereas no significant difference existed with respect to sex (P = 0.62) with regard to FECD status. Two (4.3%) FECD cases were CTG18.1exp+/–, and all other subjects were CTG18.1. A higher proportion of subjects from CTG18.1exp+ families were diagnosed with FECD (68.7%) compared to subjects from CTG18.1 families (57.8%), although this difference was not statistically significant (P = 0.08). Of the 25 CTG18.1 families, 44 offspring (19 FECD and 25 non-FECD) from 21 families had available parental CTG18.1 data. Two (4.5%) of the 44 offspring were CTG18.1exp+/–, one with CTG18.1Lof 87 repeats (CTG18.1L of father: 29 repeats) and one with CTG18.1L of 120 repeats (CTG18.1L of mother: 19 repeats). In these two transmissions, both the parent and child were affected by FECD.
Discussion
In this large cohort of 1000 participants from two referral centers, we confirmed the presence of CTG18.1 expansion in a large proportion of FECD cases and correlated FECD severity to CTG18.1L, lending confidence to similar observations from prior smaller studies.2–10 The novel findings from our study include the assessment of phenotypic penetrance of CTG18.1 expansion, the lack of a clear pattern of intergenerational contraction or expansion of CTG18.1 expansion, and the surprisingly common occurrence of the FECD phenotype in family members who do not harbor the CTG18.1 expansion but are part of CTG18.1exp+ families.
We established the prevalence of CTG18.1 expansion in 77.7% of 546 patients with FECD (Krachmer grade ≥ 2), reconfirming the strong association between FECD and CTG18.1 expansion. The high prevalence of CTG18.1 expansion in this study is comparable to that reported by other studies that have investigated US and European cohorts but is higher than that found by studies of Asian, Indian, and African American US cohorts.12 The higher frequency of CTG18.1 expansion in certain populations may be the driving mechanism explaining the higher reported prevalence of guttae and the perceived higher incidence of FECD among individuals of northern European and Scandinavian descent, but we are not aware of studies that answer this question using direct epidemiologic comparisons.29,30
Prior reports have indicated that the presence of CTG18.1 expansion and the length of the expansion are related to disease severity or a higher likelihood of requiring corneal transplantation.10,31,32 Consistent with these studies, we did find that CTG18.1 expansion was associated with more severe disease. However, among the group limited to CTG18.1exp+ FECD cases, a longer expansion was not associated with disease severity. In the unrelated cohort, we also identified CTG18.1 expansion, defined as ≥40 repeats, in 7.7% (95% CI, 4%–11%) of 235 control subjects (≥50 years old), consistent with previous reports in US and European cohorts,33 but higher than that in studies of Asian cohorts.12 As a group, our CTG18.1exp+ control subjects did not have repeat lengths significantly different than CTG18.1exp+ FECD patients, so we cannot conclude that CTG18.1exp+ controls have relatively shorter expansions. In fact, one control participant harbored a very large repeat length of approximately 2000 repeats. In the family arm of our study, we also observed an unaffected 74-year-old woman with a CTG18.1L of approximately 2000 repeats and a 50-year-old CTG18.1exp+/+ male with CTG18.1L of 44 (borderline for expansion) and 64 who had no clinical evidence of FECD.
Interestingly, in the distribution of repeat expansion length among unrelated cases and controls, only six (0.8%; three FECD cases and three controls, all CTG18.1exp+/–) of 781 subjects had CTG18.1L between 40 and 50 repeats (Fig. 2). The reason for this previously noted distribution pattern has yet to be elucidated and highlights the unknown threshold for repeat instability and pathogenic repeat length.3,33 In their initial characterization of the CTG18.1 expansion, Breschel and colleagues34 noted stability in expansion lengths up to 37 repeats and intergenerational instability over 53 repeats. They did not have the opportunity to observe transmission of repeat lengths in the intervening interval, and neither did the current study. We defined the threshold for CTG18.1 expansion as CTG18.1L ≥ 40 repeats, a relatively arbitrary value. The true threshold may only be established by studying somatic and intergenerational stability and pathogenic cellular events in patients harboring repeat lengths in this indeterminate interval (40 to 50 repeats). If the true threshold for repeat instability is indeed >40 repeats, then we have overestimated the proportion of CTG18.1exp+ controls by as much as 1.3% (6.4% [15/235] vs. 7.7% [18/235]).
In a 1978 study, Krachmer and colleagues25 identified the strong familial tendency of FECD and its predisposition toward women in a cohort of 64 families. In the family cohort of 331 patients from 112 families in the present study, FECD demonstrated an autosomal dominant inheritance pattern, and the phenotypic penetrance of CTG18.1 expansion was notably incomplete but age related. Penetrance of CTG18.1 expansion among the relatives of CTG18.1exp+ probands increased with age, ranging from 44% in the youngest age group to 86% in the oldest group. Even in the oldest age group, some CTG18.1exp+ individuals were disease free.
Prior studies have described female sex as a risk factor for FECD.25,30,35 One large study of almost 900 cases of FECD calculated that the risk of severe FECD was 34% higher in women than men.35 In our cohort of unrelated FECD subjects, approximately two-thirds were female, but disease severity between males and females was similar. The larger proportion of women in our case cohort, which was also noted by the prior study, might suggest sex as a risk factor, but we cannot state this with certainty, as other factors, most notably increased longevity in women, could skew the gender prevalence in this cohort of primarily elderly patients. Among CTG18.1exp+ families, there was a trend toward higher penetrance in females (73.8%) compared to males (68.6%), but this observation did not attain statistical significance (P = 0.08). When examining the 18 CTG18.1exp+ control subjects, male sex did not appear to confer protection from disease, because only 39% of these 18 cases were male, a proportion only slightly higher than that observed in the unrelated FECD-affected group (32.4%) (Table 4). In the CTG18.1 families, sex was not associated with FECD status. As a result, we can neither conclude nor exclude that higher penetrance of CTG18.1 expansion is the cause for prior observations of women being more frequently affected by FECD.
A notable finding in CTG18.1exp+ families was that 18% of the 44 offspring of CTG18.1exp+ families did not inherit a repeat expansion but did demonstrate FECD, albeit 87% of the eight had low-grade FECD (Table 4). One possible explanation is that these offspring also inherited FECD risk alleles other than CTG18.1 expansion from one of the parents. However, the likelihood of such an event would be expected to be much less frequent, considering that the prevalence of FECD unrelated to CTG18.1 expansion in the US Caucasian population is estimated at approximately 1%. A potential factor is the role of female sex in parental transmission, as seven (87.5%) of these cases had mothers who were CTG18.1exp+. Thus, maternal transmission is a potential susceptibility factor that warrants further investigation, particularly in light of studies suggesting the role of mitochondrial variants in the disease.36,37
To our knowledge, only one study to date has investigated intergenerational instability of CTG18.1 expansion in FECD-affected families. In a cohort of 26 FECD families, Saade and colleagues24 reported that 14 (32%) of 44 parent–child transmissions resulted in intergenerational instability of CTG18.1L ≥ 10 repeats. They also found that intermediate-sized expansions (CTG18.1L: 77–120 repeats) tended to expand, whereas large alleles (CTG18.1L: >120 repeats) tended to contract. In our study, the majority of offspring (61.3%) did not have a detectable repeat length difference from the parent, whereas 22.6% (14/62) had differences of >10 repeats. Very large expansions or contractions were observed in only 12.9% of 62 parent-to-child transmissions (Table 6). Notably, all five parents with very large CTG18.1L (∼1000–2000 repeats) yielded offspring with much smaller repeats (85–105 repeats), consistent with Saade et al.24 for their two parents with repeat sizes up to 500 and 800 repeats. Otherwise, we did not observe a clear pattern of expansion or contraction, supporting our clinical suspicion that phenotypic anticipation is not a typical feature of FECD. Saade and colleagues24 also noted that maternal transmission may be more prone to intergenerational instability, although their findings were not statistically significant. In the current study, we were unable to evaluate the effect of parental sex on CTG18.1 expansion transmission due to the low frequency of father–offspring transmissions and the small proportion of significant expansions or contractions.
CTG18.1 families also demonstrated an apparent autosomal dominant mode of inheritance, given that 57.3% of family members had FECD. This observation was not surprising because prior studies linking FECD to loci other than CTG18.1 have also demonstrated autosomal dominant inheritance.38–40 Other patterns of inheritance in some families cannot be ruled out. We assumed genetic heterogeneity of our CTG18.1 families based on our inability to identify any other genetic associations or previously identified non-TCF4 mutation in any of our probands or family members, although we have not approached such an analysis in a systematic manner. Given our assumption that non-CTG18.1 expansion-associated FECD may arise from multiple, unrelated genetic mutations (multigenic) and/or the interaction of multiple genetic and environmental risk factors (complex genetic trait), other modes of inheritance may certainly exist.
There are several limitations to this study that should be considered. First, for nearly all parent–offspring transmissions, CTG18.1L data were available for only one parent. In most instances, affected probands were initially enrolled and then offspring were subsequently recruited; thus, evaluation of the unaffected parent was rare. It was thus impossible to distinguish with complete certainty between intergenerational CTG18.1 expansion instability and inheritance of CTG18.1 expansion from the unaffected, non-genotyped parent. Second, accurate evaluation of clinical anticipation, the tendency for earlier and/or more severe disease in subsequent generations, could not be accurately assessed because we did not define age of FECD onset or the relationship between severity and age in parents and their offspring in this non-longitudinal study. However, we do not suspect that clinical anticipation is a typical pattern in FECD, given the lack of any specific pattern of intergenerational expansion of CTG18.1 observed and our clinical experience. Finally, our cohort of referred patients may have produced recruitment bias skewed toward more severe disease, potentially limiting our ability to make observations in cases with milder disease.
Estimating repeat length in leukocyte DNA introduces inherent inaccuracies due to the unstable nature of the expanded repeat, which creates heterogeneity both within the in vivo leukocyte population in an individual and in the in vitro PCR-expanded products generated for short tandem repeat analysis. Amplification-free long read sequencing and Southern blotting, which circumvent the need for PCR amplification, lend evidence for in vivo heterogeneity in FECD.24,41,42 Another limitation in the present and prior studies is that CTG18.1L in leukocytes may not necessarily reflect CTG18.1L in corneal endothelial tissue. We suspect that the repeat length in leukocytes is a flawed surrogate for the actual repeat length in the diseased corneal tissue. It is plausible that repeat length in the endothelium differs from that in leukocytes and could help to explain many phenotypic aspects, including incomplete penetrance, variable expression, and a predilection for involvement limited to the cornea. Attempts to quantify repeat length in corneal endothelium are hampered by insufficient volume of DNA extractable from the tissue, which is necessary to perform amplification-free Southern blotting or long-read sequencing. Overcoming methodological challenges in measuring long CTG18.1 expansions from FECD endothelial tissue will constitute an important breakthrough.
In conclusion, we summarized the clinical and genetic findings in a group of 1000 subjects with and without FECD. CTG18.1 expansion (≥40 repeats) was observed in over 77% of 781 unrelated FECD cases, and disease severity was related to the presence of a repeat expansion and also CTG18.1 expansion length. In contrast to other TNR-associated disorders, very large expansions contracted in parent–child transmission, but there was no other clear pattern of CTG18.1 expansion or contraction between generations or in maternal versus paternal transmission. Penetrance of the FECD phenotype in CTG18.1exp+ families was incomplete and age dependent. Surprisingly, members of CTG18.1exp+ families appeared to inherit FECD but not CTG18.1exp relatively frequently. These observations and the occurrence of CTG18.1exp in patients without FECD highlight the complex relationship between FECD and the repeat expansion and emphasize the gaps in knowledge regarding other genetic and/or environmental factors influencing the penetrance and expression of FECD.
Supplementary Material
Acknowledgments
Supported by grants from the National Eye Institute, National Institutes of Health (EY16514, EY25071, and EY26490) and by the Mayo Foundation under a Mayo Clinic Career Development Award. The funding sources had no role in the conduct of the research or preparation of the article.
The material in this manuscript was accepted in part as a paper presentation at the ARVO 2020 Annual Meeting (canceled due to COVID-19).
Disclosure: T.T. Xu, None; Y.-J. Li, None; N.A. Afshari, None; R.A. Aleff, None; T.A. Rinkoski, None; S.V. Patel, GlaxoSmithKline (F), Senju Pharmaceutical Co., Ltd. (F), Santen Pharmaceutical Co., Ltd. (F), Emmecell (F); L.J. Maguire, None; A.O. Edwards, None; W.L. Brown, None; M.P. Fautsch, None; E.D. Wieben, None; K.H. Baratz, None
References
- 1. Hogan MJ, Wood I, Fine M. Fuchs’ endothelial dystrophy of the cornea. 29th Sanford Gifford Memorial lecture. Am J Ophthalmol. 1974; 78(3): 363–383. [DOI] [PubMed] [Google Scholar]
- 2. Baratz KH, Tosakulwong N, Ryu E, et al.. E2-2 protein and Fuchs's corneal dystrophy. N Engl J Med. 2010; 363(11): 1016–1024. [DOI] [PubMed] [Google Scholar]
- 3. Wieben ED, Aleff RA, Tosakulwong N, et al.. A common trinucleotide repeat expansion within the transcription factor 4 (TCF4, E2-2) gene predicts Fuchs corneal dystrophy. PLoS One. 2012; 7(11): e49083. [DOI] [PMC free article] [PubMed] [Google Scholar]
- 4. Mootha VV, Gong X, Ku HC, Xing C. Association and familial segregation of CTG18.1 trinucleotide repeat expansion of TCF4 gene in Fuchs’ endothelial corneal dystrophy. Invest Ophthalmol Vis Sci. 2014; 55(1): 33–42. [DOI] [PMC free article] [PubMed] [Google Scholar]
- 5. Kuot A, Hewitt AW, Snibson GR, et al.. TGC repeat expansion in the TCF4 gene increases the risk of Fuchs’ endothelial corneal dystrophy in Australian cases. PLoS One. 2017; 12(8): e0183719. [DOI] [PMC free article] [PubMed] [Google Scholar]
- 6. Nakano M, Okumura N, Nakagawa H, et al.. Trinucleotide repeat expansion in the TCF4 gene in Fuchs’ endothelial corneal dystrophy in Japanese. Invest Ophthalmol Vis Sci. 2015; 56(8): 4865–4869. [DOI] [PubMed] [Google Scholar]
- 7. Thalamuthu A, Khor CC, Venkataraman D, et al.. Association of TCF4 gene polymorphisms with Fuchs’ corneal dystrophy in the Chinese. Invest Ophthalmol Vis Sci. 2011; 52(8): 5573–5578. [DOI] [PubMed] [Google Scholar]
- 8. Eghrari AO, Vahedi S, Afshari NA, Riazuddin SA, Gottsch JD. CTG18.1 expansion in TCF4 among African Americans with Fuchs’ corneal dystrophy. Invest Ophthalmol Vis Sci. 2017; 58(14): 6046–6049. [DOI] [PMC free article] [PubMed] [Google Scholar]
- 9. Nanda GG, Padhy B, Samal S, Das S, Alone DP. Genetic association of TCF4 intronic polymorphisms, CTG18.1 and rs17089887, with Fuchs’ endothelial corneal dystrophy in an Indian population. Invest Ophthalmol Vis Sci. 2014; 55(11): 7674–7680. [DOI] [PubMed] [Google Scholar]
- 10. Soliman AZ, Xing C, Radwan SH, Gong X, Mootha VV. Correlation of severity of Fuchs endothelial corneal dystrophy with triplet repeat expansion in TCF4. JAMA Ophthalmol. 2015; 133(12): 1386–1391. [DOI] [PubMed] [Google Scholar]
- 11. Paulson H. Repeat expansion diseases. Handb Clin Neurol. 2018; 147: 105–123. [DOI] [PMC free article] [PubMed] [Google Scholar]
- 12. Fautsch MP, Wieben ED, Baratz KH, et al.. TCF4-mediated Fuchs endothelial corneal dystrophy: insights into a common trinucleotide repeat associated disease [published online ahead of print July 28, 2020]. Prog Retin Eye Res, 10.1016/j.preteyeres.2020.100883. [DOI] [PMC free article] [PubMed] [Google Scholar]
- 13. McMurray CT. Mechanisms of trinucleotide repeat instability during human development. Nat Rev Genet. 2010; 11(11): 786–799. [DOI] [PMC free article] [PubMed] [Google Scholar]
- 14. Morales F, Vásquez M, Cuenca P, et al.. Parental age effects, but no evidence for an intrauterine effect in the transmission of myotonic dystrophy type 1. Eur J Hum Genet. 2015; 23(5): 646–653. [DOI] [PMC free article] [PubMed] [Google Scholar]
- 15. Greiner MA, Terveen DC, Vislisel JM, Roos BR, Fingert JH. Assessment of a three-generation pedigree with Fuchs endothelial corneal dystrophy with anticipation for expansion of the triplet repeat in the TCF4 gene. Eye (Lond). 2017; 31(8): 1250–1252. [DOI] [PMC free article] [PubMed] [Google Scholar]
- 16. Winkler NS, Milone M, Martinez-Thompson JM, et al.. Fuchs’ endothelial corneal dystrophy in patients with myotonic dystrophy, type 1. Invest Ophthalmol Vis Sci. 2018; 59(7): 3053–3057. [DOI] [PMC free article] [PubMed] [Google Scholar]
- 17. Gottsch JD, Sundin OH, Liu SH, et al.. Inheritance of a novel COL8A2 mutation defines a distinct early-onset subtype of Fuchs corneal dystrophy. Invest Ophthalmol Vis Sci. 2005; 46(6): 1934–1939. [DOI] [PubMed] [Google Scholar]
- 18. Riazuddin SA, Parker DS, McGlumphy EJ, et al.. Mutations in LOXHD1, a recessive-deafness locus, cause dominant late-onset Fuchs corneal dystrophy. Am J Hum Genet. 2012; 90(3): 533–539. [DOI] [PMC free article] [PubMed] [Google Scholar]
- 19. Riazuddin SA, Vasanth S, Katsanis N, Gottsch JD. Mutations in AGBL1 cause dominant late-onset Fuchs corneal dystrophy and alter protein–protein interaction with TCF4. Am J Hum Genet. 2013; 93(4): 758–764. [DOI] [PMC free article] [PubMed] [Google Scholar]
- 20. Vithana EN, Morgan PE, Ramprasad V, et al.. SLC4A11 mutations in Fuchs endothelial corneal dystrophy. Hum Mol Genet. 2008; 17(5): 656–666. [DOI] [PubMed] [Google Scholar]
- 21. Kuot A, Hewitt AW, Griggs K, et al.. Association of TCF4 and CLU polymorphisms with Fuchs’ endothelial dystrophy and implication of CLU and TGFBI proteins in the disease process. Eur J Hum Genet. 2012; 20(6): 632–638. [DOI] [PMC free article] [PubMed] [Google Scholar]
- 22. Gupta R, Kumawat BL, Paliwal P, et al.. Association of ZEB1 and TCF4 rs613872 changes with late onset Fuchs endothelial corneal dystrophy in patients from northern India. Mol Vis. 2015; 21: 1252–1260. [PMC free article] [PubMed] [Google Scholar]
- 23. Afshari NA, Igo RP Jr, Morris NJ, et al.. Genome-wide association study identifies three novel loci in Fuchs endothelial corneal dystrophy. Nat Commun. 2017; 8: 14898. [DOI] [PMC free article] [PubMed] [Google Scholar]
- 24. Saade JS, Xing C, Gong X, Zhou Z, Mootha VV.. Instability of TCF4 triplet repeat expansion with parent-child transmission in Fuchs’ endothelial corneal dystrophy. Invest Ophthalmol Vis Sci. 2018; 59(10): 4065–4070. [DOI] [PMC free article] [PubMed] [Google Scholar]
- 25. Krachmer JH, Purcell JJ Jr, Young CW, Bucher KD. Corneal endothelial dystrophy. A study of 64 families. Arch Ophthalmol. 1978; 96(11): 2036–2039. [DOI] [PubMed] [Google Scholar]
- 26. Repp DJ, Hodge DO, Baratz KH, McLaren JW, Patel SV. Fuchs’ endothelial corneal dystrophy: subjective grading versus objective grading based on the central-to-peripheral thickness ratio. Ophthalmology. 2013; 120(4): 687–694. [DOI] [PMC free article] [PubMed] [Google Scholar]
- 27. Fulker DW, Cherny SS, Sham PC, Hewitt JK. Combined linkage and association sib-pair analysis for quantitative traits. Am J Hum Genet. 1999; 64(1): 259–267. [DOI] [PMC free article] [PubMed] [Google Scholar]
- 28. Abecasis GR, Cardon LR, Cookson WO. A general test of association for quantitative traits in nuclear families. Am J Hum Genet. 2000; 66(1): 279–292.10631157 [Google Scholar]
- 29. Kitagawa K, Kojima M, Sasaki H, et al.. Prevalence of primary cornea guttata and morphology of corneal endothelium in aging Japanese and Singaporean subjects. Ophthalmic Res. 2002; 34(3): 135–138. [DOI] [PubMed] [Google Scholar]
- 30. Zoega GM, Fujisawa A, Sasaki H, et al.. Prevalence and risk factors for cornea guttata in the Reykjavik Eye Study. Ophthalmology. 2006; 113(4): 565–569. [DOI] [PubMed] [Google Scholar]
- 31. Eghrari AO, Vasanth S, Wang J, Vahedi F, Riazuddin SA, Gottsch JD. CTG18.1 expansion in TCF4 increases likelihood of transplantation in Fuchs corneal dystrophy. Cornea. 2017; 36(1): 40–43. [DOI] [PMC free article] [PubMed] [Google Scholar]
- 32. Vasanth S, Eghrari AO, Gapsis BC, et al.. Expansion of CTG18.1 trinucleotide repeat in TCF4 is a potent driver of Fuchs’ corneal dystrophy. Invest Ophthalmol Vis Sci. 2015; 56(8): 4531–4536. [DOI] [PMC free article] [PubMed] [Google Scholar]
- 33. Zarouchlioti C, Sanchez-Pintado B, Hafford Tear NJ, et al.. Antisense therapy for a common corneal dystrophy ameliorates TCF4 repeat expansion-mediated toxicity. Am J Hum Genet. 2018; 102(4): 528–539. [DOI] [PMC free article] [PubMed] [Google Scholar]
- 34. Breschel TS, McInnis MG, Margolis RL, et al.. A novel, heritable, expanding CTG repeat in an intron of the SEF2-1 gene on chromosome 18q21.1. Hum Mol Genet. 1997; 6(11): 1855–1863. [DOI] [PubMed] [Google Scholar]
- 35. Zhang X, Igo RP Jr, Fondran J, et al.. Association of smoking and other risk factors with Fuchs’ endothelial corneal dystrophy severity and corneal thickness. Invest Ophthalmol Vis Sci. 2013; 54(8): 5829–5835. [DOI] [PMC free article] [PubMed] [Google Scholar]
- 36. Li YJ, Minear MA, Qin X, et al.. Mitochondrial polymorphism A10398G and Haplogroup I are associated with Fuchs’ endothelial corneal dystrophy. Invest Ophthalmol Vis Sci. 2014; 55(7): 4577–4584. [DOI] [PMC free article] [PubMed] [Google Scholar]
- 37. Miyai T, Vasanth S, Melangath G, et al.. Activation of PINK1-Parkin-mediated mitophagy degrades mitochondrial quality control proteins in Fuchs endothelial corneal dystrophy. Am J Pathol. 2019; 189(10): 2061–2076. [DOI] [PMC free article] [PubMed] [Google Scholar]
- 38. Riazuddin SA, Eghrari AO, Al-Saif A, et al.. Linkage of a mild late-onset phenotype of Fuchs corneal dystrophy to a novel locus at 5q33.1-q35.2. Invest Ophthalmol Vis Sci. 2009; 50(12): 5667–5671. [DOI] [PubMed] [Google Scholar]
- 39. Sundin OH, Jun AS, Broman KW, et al.. Linkage of late-onset Fuchs corneal dystrophy to a novel locus at 13pTel-13q12.13. Invest Ophthalmol Vis Sci. 2006; 47(1): 140–145. [DOI] [PubMed] [Google Scholar]
- 40. Riazuddin SA, Zaghloul NA, Al-Saif A, et al.. Missense mutations in TCF8 cause late-onset Fuchs corneal dystrophy and interact with FCD4 on chromosome 9p. Am J Hum Genet. 2010; 86(1): 45–53. [DOI] [PMC free article] [PubMed] [Google Scholar]
- 41. Wieben ED, Aleff RA, Basu S, et al.. Amplification-free long-read sequencing of TCF4 expanded trinucleotide repeats in Fuchs endothelial corneal dystrophy. PLoS One. 2019; 14(7): e0219446. [DOI] [PMC free article] [PubMed] [Google Scholar]
- 42. Hafford-Tear NJ, Tsai YC, Sadan AN, et al.. CRISPR/Cas9-targeted enrichment and long-read sequencing of the Fuchs endothelial corneal dystrophy-associated TCF4 triplet repeat. Genet Med. 2019; 21(9): 2092–2102. [DOI] [PMC free article] [PubMed] [Google Scholar]
Associated Data
This section collects any data citations, data availability statements, or supplementary materials included in this article.