

Abstract
Children with malformations of cortical development (MCD) are at risk for epilepsy, developmental delays, behavioral disorders, and intellectual disabilities. For a subset of these children, antiseizure medications or epilepsy surgery may result in seizure freedom. However, there are limited options for treating or curing the other conditions, and epilepsy surgery is not an option in all cases of pharmacoresistant epilepsy. Understanding the genetic and neurobiological mechanisms underlying MCD is a necessary step in elucidating novel therapeutic targets. The tish (telencephalic internal structural heterotopia) rat is a unique model of MCD with spontaneous seizures, but the underlying genetic mutation(s) have remained unknown. DNA and RNA-sequencing revealed that a deletion encompassing a previously unannotated first exon markedly diminished Eml1 transcript and protein abundance in the tish brain. Developmental electrographic characterization of the tish rat revealed early-onset of spontaneous spike-wave discharge (SWD) bursts beginning at postnatal day (P) 17. A dihybrid cross demonstrated that the mutant Eml1 allele segregates with the observed dysplastic cortex and the early-onset SWD bursts in monogenic autosomal recessive frequencies. Our data link the development of the bilateral, heterotopic dysplastic cortex of the tish rat to a deletion in Eml1.
Keywords: Dysplasia, Epilepsy, EEG
1. Introduction
Malformations of cortical development (MCD) largely occur as a consequence of abnormal neuronal proliferation and migration, and result in aberrant cortical organization and neural network dysfunction. Common forms of MCD include focal cortical dysplasia, periventricular nodular heterotopia, lissencephaly and subcortical band heterotopia (Gleeson et al., 2000; Barkovich et al., 2005; Guerrini and Dobyns, 2014; Romero et al., 2018; Buchsbaum and Cappello, 2019). Children with MCD are at increased risk for developmental delays, behavioral disorders, intellectual disabilities, and epilepsy (Leventer et al., 1999; Lagae, 2000). In pediatric epilepsy surgery case series, children with MCD represent 25–40% of the cases of pharmacoresistant epilepsy (Leventer et al., 2008). However, surgery is not always successful and some forms of MCD cannot be resected. Elucidation of how MCDs disrupt the development and function of neural networks, and in turn, how these aberrant networks lead to the disabilities outlined above is essential for the establishment of novel approaches and therapies.
Classic examples of animal models that have proven useful in the study of MCD include the freeze-lesion and methylazoxymethanol acetate (MAM) models (Dvorak and Feit, 1977; Colacitti et al., 1998; Paredes et al., 2006). More recently, manipulation of genes critical for proper neuronal proliferation and migration have been used to induce subcortical heterotopia. Examples of this approach include knockdown of Dcx by RNA interference (Bai et al., 2003; Ackman et al., 2009; Petit et al., 2014; Sahu et al., 2018), conditional knockout of the small GTPase Rhoa (Cappello et al., 2012) and overexpression of Wnt3a (Munji et al., 2011).
The tish rat occurred spontaneously in a colony of Sprague-Dawley (SD) rats maintained at the University of Virginia. The brain of the tish (telencephalic internal structural heterotopia) rat harbors a MCD that is characterized by a large bilateral heterotopic dysplastic cortex separated by a slim layer of white matter from the overlying, thinned six-layer laminated normotopic neocortex with a reduced population of parvalbumin interneurons (Lee et al., 1997; Trotter et al., 2006) and the presence of spontaneous convulsive seizures in adult animals (Lee et al., 1997; Chen et al., 2000). Prior studies investigating the cortical development in the tish rat found, that in addition to normally positioned, proliferating cells in the ventricular zone, the developing tish cortex harbors a second, aberrant band of proliferating cells within the intermediate zone and cortical plate. These misplaced neuronal progenitors undergo altered cell cycle kinetics and neuronal migration (Lee et al., 1998; Fitzgerald et al., 2011). To-date, the underlying genetic variant(s) mutation(s) responsible for this phenotype has remained, heretofore, unidentified.
2. Materials and methods
2.1. Animal care and use
Animal care and use procedures were carried out in accordance with protocols written under the guidelines of the National Institutes of Health Guide for the Care and Use of Laboratory Animals and approved by the Institutional Animal Care and Use Committee at the University of Virginia. Animals were housed in a temperature-controlled environment on a standard light/dark schedule with ad libitum access to food and water. Tish rats arose from a Sprague–Dawley colony and were bred and maintained from the colony originating at the University of Virginia (Lee et al., 1997), while Sprague-Dawley (SD) and Brown-Norway rats were purchased from Taconic Bioscience (Hudson, NY, USA). In accordance with NIH Guidelines, all experiments utilized both male and female animals.
2.2. Animal breeding and genotyping
The inheritance pattern of the tish rat is autosomal recessive (Lee et al., 1997); thus, the tish colony was maintained by pairing homozygotic tish females and homozygotic tish males to yield 100% homozygotic tish pups. Timed pregnancies were obtained by pairing adult homozygotic male and female tish rats. The female was checked daily for the appearance of the vaginal plug, which once observed was designated as embryonic day (E) 0.5. For SD litters, a pregnant mom was ordered (Taconic Bioscience, Hudson, NY, USA) to arrive on E13–15 with animals being utilized at the E18 time point.
For experimental purposes SD rats were paired with homozygotic tish rats to produce litters of heterozygotic pups, with the day of birth considered to be postnatal day (P) 0. Additional breeding between heterozygotic pups from separate litters was maintained for experiments as outlined below. Animals were genotyped based on the presence of Eml1. DNA was extracted from a single tail snip from the animal and primers spanning the Eml1 deletion were generated. The assay was optimized using a total reaction volume of 20 μl. For a single reaction 10 μl KAPA2G (Kapa Biosystems), 7 μl nuclease-free water, 1 μl DMSO and 1 μl each forward (ACAAAGGGTGGGCAAGAGGG) and reverse (GCAGAAACATTCCCATGAGTCTA) primer. PCR reactions were performed using a MasterCycler Nexus GX2 (Eppendorf). The standard cycling parameters were 95 °C for 1 min followed by 30 cycles of 95 °C for 30 s, 63 °C for 30 s, 72 °C for 2 min and a final elongation step of 72 °C for 10 min. Samples were run a 1.5% agarose gel with SmartGlow Pre-stain (Accuris Instruments) for 1 h and imaged on a ChemiDoc Touch Gel Imaging System (BioRad).
2.3. Whole genome sequencing
High quality genomic DNA was extracted from the neocortex of E18 SD and the cortex (normotopic neocortex and heterotopic dysplastic cortex) of tish rats using the Gentra Puregene Tissue Kit (Qiagen). Purified DNA was sequenced on an Illumina (San Diego, CA), NextSeg platform by Hudson Alpha Genomics (Hunstville, AL). We obtained 441,353,521,100 bp paired-end reads for SD and 392,442,727,100 bp paired-end reads for tish. Reads were aligned to the Rnor_6.0 (Rnor_5.0 for SNV) using BWA-MEM (Li and Durbin, 2010), PCR duplicates were removed using SAMblaster (Li et al., 2009). This process led to a mean per-base genomic coverage of 43.15× for SD and 31.43× for tish. Single nucleotide variants and small indels were identified using Freebayes and structural variants were identified using WhamG (Kronenberg et al., 2015) and genotyped using SVtyper (Chiang et al., 2015) with split-read alignments generated using YAHA (Faust and Hall, 2012). Both data sets were evaluated using bedtools (Quinlan and Hall, 2010).
2.4. RNA sequencing
Total RNA was isolated from the neocortex of E18 SD and the cortex (normotopic neocortex and heterotopic dysplastic cortex) of tish rats in triplicate (three animals per group) and extracted using the trizol/chloroform protocol and the PureLink RNA Mini Kit (Invitrogen). Isolated RNA was treated with DNAse (New England Biolabs) and RNA concentrations were measured with a Nanodrop Lite (Thermo Scientific). Sequencing and library preparation were performed by Hudson Alpha (Huntsville, AL). Three independent samples of each genotype generated 25.5–34.2 million paired-end 50 bp reads per replicate. After aligning data with STAR (Dobin et al., 2013), we counted reads mapping to GENCODE genes using the FeatureCounts software in the Subread package (Liao et al., 2014). We then used the DESeq2 Bioconductor package (Anders and Huber, 2010; Love et al., 2014) in the R statistical computing environment (RCoreTeam, 2015) to normalize count data, estimate dispersion, and fit a negative binomial model for each gene. GENCODE/Ensembl gene IDs mapping to predicted genes were excluded and the Benjamini-Hochberg False Discovery Rate procedure was used to re-estimate the adjusted p-values for GENCODE/Ensembl gene IDs mapping to known genes. Transcriptome assembly was performed using HiSat (Kim et al., 2015) and StringTie (Pertea et al., 2015) as described (Pertea et al., 2016).
2.5. RT-PCR
Hippocampus, cerebellum and either neocortex or cortex (normotopic neocortex and heterotopic dysplastic cortex) were isolated from SD and tish rats, respectively, at E18, P3 and P35 and from Brown-Norway rats at P3. At E18 only tissue from hippocampus, SD neocortex and tish cortex was collected. Tissue was stored at −80 °C until use. Total RNA was extracted and isolated using the trizol/chloroform protocol and the PureLink RNA Mini Kit (Invitrogen). Isolated RNA was treated with DNAse (New England Biolabs) and RNA concentrations were measured with a Nanodrop Lite (Thermo Scientific). One microgram of total RNA was synthesized to cDNA with iScript cDNA Synthesis Kit (BioRad). RT-PCR was performed by using a MasterCycler Nexus GX2 (Eppendorf). Primer sets spanning Eml1 and GAPDH as an internal loading control were utilized. Samples were electrophoresed on a 1.5% agarose gel with SmartGlow Pre-stain (Accuris Instruments) for 45 min and imaged on a ChemiDoc Touch Gel Imaging System (BioRad). PCR products were confirmed with Sanger Sequencing.
2.6. Western blot analysis
Protein expression of Eml1 was determined in E18 neocortex collected from SD rats and cortex (normotopic neocortex and heterotopic dysplastic cortex) collected from tish rats. Briefly, pregnant female rats were deeply anesthetized and embryonic pups were removed. Cortical tissue was removed and placed in ice-cold standard radio-immunoprecipitation assay (RIPA) lysis buffer with the addition of 1 mM sodium orthovanadate and a protease inhibitory cocktail (Cocktail set I; Calbiochem, La Jolla, CA). Samples were lysed and sonicated using a Sonic Dismembrator F60 (Fisher Scientific) and centrifuged for 10 min at 15,000 ×g at 4 °C. Protein concentrations and western blot analysis were performed on the remaining supernatant.
Aliquots of 40 μg of protein were separated by SDS/PAGE (8%), transferred to a polyvinyl difluoride (PVDF) membrane and blocked in tris-buffered saline (TBS) plus 0.01% Tween 20 (TBS-T) plus 5% non-fat dry milk for 60 min at room temperature. PVDF membranes were incubated with primary antisera to C-terminal Eml1 (1:1000; Abcam, ab153703) in TBS-T and 1% BSA overnight at 4 °C with gentle shaking. Following overnight incubation, membranes were washed with TBS-T and developed using enhanced chemiluminescence reagents (ECL, PerkinElmer) and a ChemiDoc Touch Gel Imaging System (BioRad). Normalization for protein loading was performed using a mouse monoclonal primary antibody selective for β-actin (1:2000; Sigma-Aldrich).
2.7. Electroencephalogram recordings
Video electroencephalogram (vEEG) recordings were performed on SD and tish rats from P8 to P35 and at 1-year of age as previously described (Goodkin et al., 2003; Zanelli et al., 2014; DiGruccio et al., 2015). The use of vEEG recordings was critical in defining the animal's behavior at the time of the EEG patterns of interest and to assure that the waveform was not an artifact of normal animal behavior (e.g. eating, scratching). Separate developmental cohorts of animals were used to ensure animal health and proper electrode placement. Briefly, animals had monopolar stainless steel electrodes stereotaxically implanted into the heterotopic dysplastic cortex (HDCx; tish rats only), normotopic neocortex (NNCx; tish rats only), neocortex (NCx; SD rats only), thalamus (Th) and hippocampus (Hc) with a reference electrode placed in the cerebellum. In a subset of adult tish rats (P50, n = 3), electromyogram (EMG) recordings were performed by placing an electrode subcutaneously in the neck muscle. Electrode placement was confirmed in a subset of animals (data not shown). Animals were provided at least one day of recovery prior to commencement of vEEG recordings. Fully weaned animals (P21 and older) were recorded for 24 h/day for a maximum duration of 2 weeks. Recordings in the youngest cohort of animals (P8 – P13) were restricted to 3–4 h sessions, typically occurring from approximately 12 pm – 4 pm. Older, yet not fully weaned animals (P14 – P20) were recorded for a maximum of 9 h during the day. Animals not fully weaned were returned to the dam during the evening hours and were weighed prior to daily recordings. Animals that did not gain weight for two consecutive days were removed from the study. Given that spike-wave discharge (SWD) bursts in the normotopic neocortex and heterotopic dysplastic cortex of the tish rat are essentially identical in appearance and appeared to occur in tandem, all analysis of SWD bursts (total number, frequency, duration) was obtained from the SWD in the normotopic neocortex.
Re-derived control and tish rats underwent electrode implantation on P14–15 with vEEG recordings beginning at P17 in order to determine the presence of spontaneous spike-wave discharges. Animals were recorded for a maximum of 9 h/day prior to P21 with continuous 24 h/day recordings beginning at P21 through the remainder of the recording period. EEG recordings were reviewed by Dr. Grosenbaugh and Dr. Goodkin. Review of EEG recordings was not blinded.
2.8. Ethosuximide treatment
Following electrode implantation surgery and recovery, as described above, tish rats (P25 and older) underwent continuous vEEG. Following a baseline 24 h recording period, tish rats were administered either ethosuximide (ESM, 100 mg/kg, i.p., Fisher Scientific) or vehicle (Veh, 0.9% saline) at approximately 9:00 am. Following treatment, continuous vEEG recordings continued for two additional days. The total number of spontaneous SWD bursts in a two – hour window (10 am – 12 pm) was counted on each of the three days to determine SWD burst baseline frequency (Day 1), effectiveness of ethosuximide/vehicle (Day 2) and recovery from treatment (Day 3). The total number of minutes spent awake or asleep in the two – hour analysis window was determined for each animal (ESM, n = 5; Veh, n = 4). Data represent the average number of minutes (mean ± SE) spent awake or asleep per treatment group on Day 1, Day 2 and Day 3.
2.9. Nissl staining
Nissl staining was used to demonstrate the presence, or absence, of the dysplastic cortex of the tish and SD rats, respectively, in histological preparations. Animals were deeply anesthetized and transcardially perfused with 0.05 M phosphate buffer followed by 4% paraformaldehyde. Brains were post-fixed for 48 h and cryoprotected in 30% sucrose prior to sectioning on a cryostat (Leica CM1900). 50 μM thick-coronal brain sections were mounted in 0.15% gelatin and allowed to dry overnight prior to rehydration (95% ethanol- 5 min; 70% ethanol- 3 min; 50% ethanol- 3 min; distilled water- 30 s) and staining in 0.5% cresyl violet (Sigma Aldrich) for 2 min. Sections were then differentiated (70% ethanol with glacial acetic acid- 2 min), and dehydrated (95% ethanol- 3 min; 100% ethanol- 3 min × 2). Sections were cleared with xylene (3 min × 3) and cover-slipped with DPX mounting solution (Sigma Aldrich).
2.10. Statistical analysis
Group data are expressed as the mean ± SEM. The two-tailed Student's t-test was used to determine the statistical significance in the means for Western blots, treatment with ethosuximide or vehicle, and characteristics of SWD bursts. Differences in the temporal appearance of SWD bursts in fully weaned tish animals was determined by counting the number of spontaneous bursts during a two-hour period during the sleep-cycle (day-time hours; lights on) and a two-hour period during the wake-cycle (night-time hours; lights off). For all statistical analysis the level of significance was set at p < .05.
3. Results
3.1. Eml1 is the most differentially expressed gene in the tish rat brain
The brain of the tish rat is characterized by large bilateral heterotopic dysplastic regions located inferior to the normotopic neocortex (Lee et al., 1997; Fig. 1A). This large cortical malformation can be macroscopically observed from birth and has been linked to alterations in neuronal proliferation and migration as early as embryonic day (E) 15 (Lee et al., 1998; Fitzgerald et al., 2011).
Fig. 1.

A chromosome 6 deletion in the tish genome overlaps with an unannotated RNA peak in the SD genome. (A) Representative images of Nissl-stained brain sections from P32 tish (top panel) and SD (bottom panel) rats demonstrating the large bilateral dysplastic cortex of the tish rat (**). (B) Alignment of DNA sequencing reads (top two panels) indicate a 1215 bp deletion (gray arrow) on tish chromosome 6 (red) relative to SD (blue). Alignment of RNA sequencing reads (bottom two panels). The black arrow indicates a clear peak for the annotated exon 1 in SD (blue) with no, or extremely limited, reads present in tish (red). The gray arrow indicates the presence of the previously unannotated exon 1 (pEx1) in SD (blue) with no reads present in tish (red). (C) Enlargement of boxed region (B) demonstrates that a clear, previously unannotated RNA peak (gray arrow) is observed in SD (blue) that overlaps the DNA region in tish where the 1215 bp deletion is observed (red). The y-axis is scaled to 75 reads in all panels. The x-axis scale is 64 kb (A) and 1698 bp (B).
The structural phenotype of the tish rat is similar to that observed in patients diagnosed with subcortical band heterotopia (SBH). To-date, two genes have been linked to SBH, Lis1 and DCX, with the majority of patients exhibiting mutations in DCX (Gleeson et al., 2000; Matsumoto et al., 2001). To determine if these genes contributed to the tish phenotype, we performed 30× DNA and RNA sequencing on E18 tish cortex (normotopic neocortex and heterotopic dysplastic cortex) and SD neocortex. Formation of the heterotopic dysplastic cortex is evident as early as E15, with expression of misplaced progenitor cells dramatically increasing between E17 – E20 in the tish cortex (Fitzgerald et al., 2011), thus E18 represented a time point at which the heterotopic dysplastic cortex is known to be approximately mid-development. Analysis of RNA sequencing data revealed that DCX was not differentially expressed in tish compared to SD (p = .122, fold change = −0.324) and Lis1 expression was not detected in either strain. Therefore, we continued our efforts to identify the mutated gene(s) contributing to the tish rat.
Early studies identified a strong (78%) linkage region for the tish phenotype that mapped proximal to 90.54 cM on chromosome 6 (M. Fitzgerald and K.S. Lee, unpublished data). Transcriptomic analysis of tish chromosome 6 relative to SD neocortex revealed Eml1 as the most differentially expressed gene (~4-fold change; Supplemental Fig. S1). Genomic analysis further identified, four potential coding, nonsynonymous single nucleotide and indel variants, and 82 possible structural variants on tish chromosome 6 (Supplemental Table S1). The four genes affected by small variants were excluded as candidates because these were not expressed in cortical tissue obtained from either SD or tish rats (Supplemental Table S1). One of the structural variants, a 1215 bp deletion in the tish genome, was found to encompass an unannotated SD RNA expression peak (Fig. 1B, C). This deletion is located 50 kb upstream from the annotated location of Eml1 (Rnor_6.0; ENSRNOG00000043143) and was confirmed by PCR and Sanger sequencing. Together with markedly diminished Eml1 expression in tish cortex and clinically-relevant homology between the expressed SD sequence and human EML1 exon 1, we hypothesized that the tish deletion may affect a new, previously unannotated exon 1 of Eml1 in the SD genome.
3.2. Two Eml1 transcripts are observed in the rat brain
We next sought to determine if Eml1 transcripts include the previously unannotated Eml1 exon 1 in the SD brain. Using RNAseq data, we designed two primer pairs (Pair A, B) that span the junction between the putative (i.e., unannotated) exon 1 (pEx1) and the annotated Eml1 exon 1 (Ex1, ENSEMBLE ENSRNOG00000043143), and performed reverse transcription (RT)-PCR on cDNA from E18 SD neocortex (Fig. 2A). Primer pairs spanning the junction of annotated (ENSEMBLE ENSRNOG00000043143) exons 2 and 3 (Pair C) and downstream exons 19 and 20 (Pair D) were used as positive controls. In SD neocortex, all primer pairs amplified products of predicted size, and Sanger sequencing confirmed that these RT-PCR products align to RNAseq data. Eml1 transcripts containing pEx1 (Pair A, B) were also present in P3 neocortex from the reference Brown-Norway strain (Supplemental Fig. S2). These findings suggest that two Eml1 transcripts exist in rat neocortex; a previously unannotated long transcript (Eml1-L) that includes our finding of the novel pEx1 and a shorter, previously annotated, transcript (Eml1-S). Transcriptome assembly provided additional evidence for expression of both Eml1-L and Eml1-S transcripts in the SD rat, albeit with a nearly 8-fold decrease in Eml1-S transcript abundance.
Fig. 2.

Eml1 expression is reduced in E18 cortex of the tish rat. (A) Schematic of predicted Eml1 in the SD rat. The observed tish deletion encompasses the unannotated pEx1 (red). Primer map depicts the primer pairs utilized to delineate the presence of the putative, unannotated exon1 (pEx1, red) in the SD rat. Agarose gel image of primer products located throughout Eml1 in RNA collected from E18 neocortical (Cx) tissue of SD (left) and cortical tissue (normotopic neocortex and heterotopic dysplastic cortex) of tish (right) rats. Primers located within pEx1 (Pair A, B) are amplified in SD demonstrating the presence of a long Eml1 transcript (Eml1-L). These products are not present in tish. Primers located downstream of pEx1 (Pairs C, D) are robustly expressed in SD with dramatically diminished expression in tish, indicative of a shorter Eml1 transcript (Eml1-S). (B) Western blot analysis of Eml1 protein in cortical tissue from E18 tish rats (normotopic neocortex and heterotopic dysplastic cortex, red circles) is significantly reduced compared with neocortical tissue from age-matched SD animals (blue triangles). ***p = .00008, Student's t-test; n = 8/group.
3.3. Only Eml1-S transcripts are observed in the tish rat brain
Consistent with RNAseq data, primer pairs A and B spanning pEx1, failed to produce PCR products from E18 tish cortex (Fig. 2A). In contrast, primer pairs C and D, located downstream of the tish deletion and annotated pEx1, did produce products in tish cortex (normotopic neocortex and heterotopic dysplastic cortex), suggesting the presence of the annotated rat Eml1-S transcript. Although RT-PCR is not quantitative, we consistently observed qualitatively diminished abundance of Eml1-S transcripts in tish relative to SD neocortex; concordant with −4.2 fold diminished expression of Eml1 reported from RNAseq data (Fig. 2A; Supplemental Fig. S1). We further determined that Eml1-L was expressed at all ages and in all brain regions examined in SD rats (Fig. 3). In contrast, Eml1-L was never observed in the tish brain, while Eml1-S was always detected (Fig. 3).
Fig. 3.

Putative, unannotated exon 1 (pEx1, red) is expressed in three distinct brain regions of the SD rat during development. Primer map depicts the primer pairs utulized to demonstrate the presence of the putative exon1 (pEx1, red), indicative of the Eml1-L transcript, that is encopmassed by the 1215 bp deletion observed in the tish rat. Agarose gel images of primer products located along the Eml1 transcript. RNA was isolated from E18 (A), P3 (B) and P35 (C) SD and tish brains and RT-PCR was performed. In all brain regions examined at each developmental time point, primers located within pEx1 (Pair A, B) are amplified in SD. These products are not present in any of the tish samples. Primers located downstream to pEx1 (Pair C, D) are expressed in all SD samples. Tish samples consistently show faint amplification of products from downstream primers, representaive of the Eml1-S transcript. Note that a non-specific band of ~200 bp (*) is evident in products from primer pair A, but not pair B, and that this band is not apparent in every gel. Cx, SD – neocortex, tish – normotopic neocortex and heterotopic dysplastic cortex; Hc, hippocampus; Cb, cerebellum.
Likewise, western blot analysis confirmed markedly diminished, but not absent, levels of Eml1 protein in E18 tish cortex (normotopic neocortex and heterotopic dysplastic cortex) relative to SD neocortex (13.9 ± 0.02% of SD, ***p = .00008, Student's t-test; Fig. 2B). The Eml1 isoforms encoded by Eml1-L and Eml1-S are predicted to differ by 31 N-terminal amino acids (3.27 kDA); thus indistinguishable relative migration of either > 80 kDa isoform is expected.
Taken together these findings show that the rat Eml1 can be encoded by two transcripts, Eml1-L and Eml1-S. The most abundant transcript, Eml1-L, is expressed throughout rat brain; however, the less abundant transcript, Eml1-S, is also expressed and can encode protein in the tish brain. Importantly, deletion of pEx1 eliminates Eml1-L expression in tish rats suggesting that Eml1-L is essential for normal cortical development.
3.4. The deletion in pEx1 of Eml1 segregates with the structural tish phenotype
As would be expected after 20 years of independent colony maintenance, many additional variants distinguish the tish and SD genomes. Thus, we performed a dihybrid cross to determine if the Eml1 deletion in pEx1 segregates with the heterotopic dysplastic cortex. To this end, two F1 litters of heterozygous tish rats were generated. One litter was born from a tish female and SD male, the other from an SD female and tish male. F1 progeny were reciprocally-paired to generate 142 F2 offspring (Fig. 4A; Supplemental Fig. S3). Genotyping of F2 progeny showed monogenic Mendelian ratios of inheritance for the Eml1 deletion (tish = 27%, heterozygous = 53%, SD = 20%; X2 > 0.05; Fig. 4B) and no parent-of-origin effects were observed. Macroscopic phenotyping found a heterotopic dysplastic cortex in all F2 tish rats (n = 38). No macroscopic cortical abnormalities were observed in any of the F2 heterozygous (n = 76) or SD rats (n = 28) examined.
Fig. 4.

The deletion in pEx1 of Eml1 segregates with the structural tish phenotype. (A) Pedigree of the breeding colony in which SD (open) and tish (closed) rats were paired to generate a 100% heterozygotic litter (half open, half closed). Male (squares) and females (circles) from one litter were paired with animals from the second litter to generate SD, tish and heterozygous pups. (B) Schematic of Eml1 with primer map (blue arrows) depicting primer locations in the Eml1 transcript and predicated fragment sizes (SD, 1672 bp; tish, 457 bp). Representative agarose gel from Lineage1a in which primers to Eml1 consistently delineate tish, heterozygous and SD based on predicted band size. A single, non-specific band of ~1000 bp (*) is evident in all samples. Summary of breeding outcomes for female inheritance (Lineages 1–3) and male inheritance (Lineages 4–6), as well as total outcomes from all breeding pairs reveal a Mendelian pattern of inheritance of the tish rat phenotype. Chi-square test; p = .35.
3.5. The functional tish phenotype of early-onset SWD bursts segregates with both the deletion in pEx1 of Eml1 and the structural tish phenotype
Trotter et al. (2006) had previously demonstrated that GABA-mediated synaptic inhibition was reduced as early as P15 in the normotopic cortex of the tish rat. Based on that finding, we sought to determine if there was a functional EEG phenotype that commenced at this early age that could also be demonstrated to segregate with the deletion of pEx1 of Eml1 and the structural tish phenotype.
Video-EEG (vEEG) recordings were obtained from 30 tish rats from the original colony and 22 age-matched SD rats from postnatal day (P) 8–35 (n = 3–16 animals/age). On visual analysis, the EEG tracing obtained prior to P17 from the tish rat was indistinguishable from that of the SD rat. On P17, bursts of spike wave discharges (SWD) were observed in the recording obtained from 1 of 14 tish animals. By P18, 11 of 14 tish animals displayed spontaneous SWD bursts, and by P19 spontaneous SWD bursts were observed in 100% of the recordings obtained from tish rats. Similar SWD bursts were not observed in any of the recordings from developing SD rats of either sex (P8-P35; Fig. 5A, B).
Fig. 5.

Early-onset of spontaneous spike-wave discharge bursts in the developing tish rat. (A) Representative EEG recordings from a P27 tish rat (top panel, red traces) demonstrating a spontaneous SWD burst and representative EEG from an age-matched SD rat showing normal EEG (bottom panel, blue traces). HDCx, heterotopic dysplastic cortex; NNCx, normotopic neocortex; NCx, neocortex; Th, thalamus; Hc, hippocampus. (B) Spontaneous SWD bursts begin at P17 – P19 in the developing tish rat (red circles) with no SWD bursts observed in age-matched SD rats (blue triangles). All animals were recorded for a two – hour period during day – time hours, with fully weaned animals (P21 and older) recorded for an additional two – hour period during night – time hours. n = 3–16/age.
The bursts had a duration that ranged from 1 to 10 s (average 3.5 ± 0.2 s) with a within burst frequency of 6.9 ± 0.2 Hz. The majority of the bursts occurred during the sleep-cycle (day-time hours; light on), and thus provided no behavioral correlate (wake-cycle: 8.8 ± 0.7; sleep-cycle: 11.2 ± 0.8, *p = .024, Student's t-test; Supplemental Fig. S4). When the animal was awake, SWD bursts were always accompanied by immobility (Taylor et al., 2017). The age of onset and the total number of SWD bursts was not significantly different between male and female rats (male: 8.9 ± 2.3, n = 9; female: 7.1 ± 2.0, n = 8; p = .566, Student's t-test). Thalamic activity was not observed to consistently lead or lag the burst onset and hippocampal involvement was not a consistent feature of the bursts. Burst onset appeared nearly simultaneously in the heterotopic dysplastic cortex (HDCx) and overlying normotopic neocortex (NNCx).
Ethosuximide (ESM), a T-type calcium channel antagonist, has been reported to block the appearance of spontaneous SWD bursts across a variety of both inbred and outbred rat strains (Julien et al., 1975; Coulter et al., 1989; Pearce et al., 2014). Tish rats P25 and older (n = 4–5/group) were used to determine the ability of ESM to reduce, or to block, the appearance of SWD bursts. In the two-hour window following treatment with ESM (100 mg/kg, i.p., n = 5), the number of spontaneous SWD bursts was dramatically reduced with recovery of SWD bursts the following day (Fig. 6A, B). In contrast, no change in the frequency of SWD bursts was observed following treatment with vehicle (0.9% saline, n = 4; Fig. 6A, B). On average, a nearly 70% reduction in the incidence of SWD bursts in the tish rat followed a single treatment with ESM (71.0 ± 2.6%, n = 5; Fig. 6B) was observed.
Fig. 6.
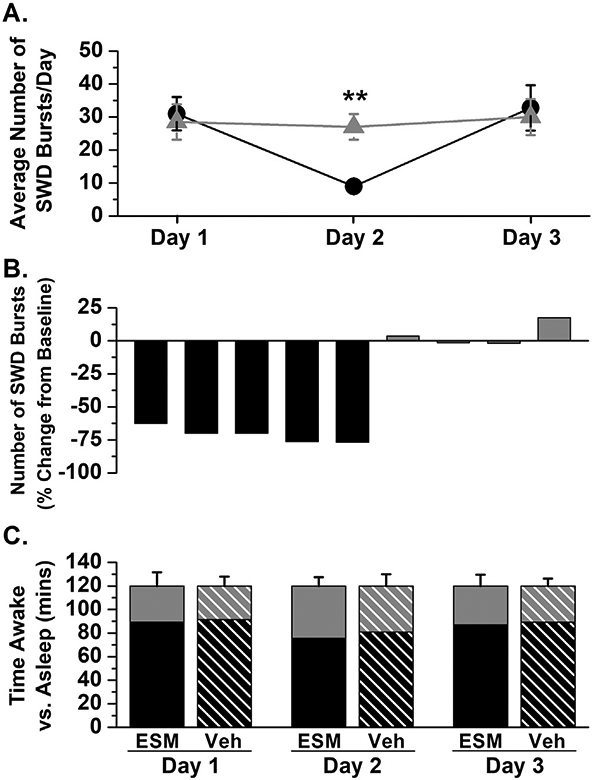
Ethosuximide reduces the number of SWD bursts in the tish rat. (A) The average number of spontaneous SWD bursts observed in a two – hour (10 am – 12 pm) recording window was significantly reduced on Day 2, following administration of ethosuximide (100 mg/kg, i.p., n = 5, black circles) compared to vehicle (0.9% saline, n = 4, gray triangles). **p = .002, Student's t-test; Day 1 – baseline, Day 2 – treatment (ethosuximide or vehicle), Day 3 – Recovery (B) Percent change from baseline in the total number of spontaneous SWD bursts observed per animal following administration of ESM (100 mg/kg, i.p., n = 5, black bars) or vehicle (0.9% saline, gray bars). (C) The total number of minutes spent awake (black bars) or asleep (gray bars) during the two – hour (120 min) analysis window was not significantly different between ESM or vehicle (Veh) treated tish rats on any of the three experimental days. Day 1, baseline, p = .892; Day 2, treatment, p = .672; Day 3, recovery, p = .858.
Given that the majority of spontaneous SWD bursts were observed during the sleep-cycle (day-time hours; lights on) of the tish rat, we sought to examine if the number of minutes spent asleep during the two-hour analysis window was significantly different following administration of either ESM or vehicle. To determine this variable, the total number of minutes spent awake or asleep during the two-hour window was calculated for each tish rat on each of the three experimental days (Day 1, baseline; Day 2, treatment; Day 3, recovery). Treatment with either ESM or vehicle did not significantly alter the total number of minutes spent awake or asleep (Fig. 6C). Therefore, the observed decrease in spontaneous SWD bursts in the tish rat following treatment with ESM, is not due to alterations in sleep patterns following administration of ESM or vehicle.
SWD bursts have been reported in both inbred and outbred rat strains including the SD rat (Rodgers et al., 2015; Taylor et al., 2017; Taylor et al., 2019). The significance of this electrographic pattern is debated (Kaplan, 1985; Kelly, 2004; Shaw, 2004; Pearce et al., 2014; Rodgers et al., 2015; Taylor et al., 2019). Although one study has demonstrated SWD burst fragments at one month of age in outbred SD rats (Rodgers et al., 2015), the onset of well-formed SWD bursts as early as P17 in the SD rat has not previously been observed in either female or male rats (Pearce et al., 2014).
To assure that the early-onset of these bursts segregated with the Eml1 deletion and the dysplastic cortex, we obtained EEG recordings from the rederived tish rats and littermate SD rats generated from the dihybrid cross. Spontaneous SWD bursts were observed at P17 – P18 in all F2 tish rats examined (n = 7; Fig. 7A, B). Neither the number of SWD bursts per day, nor the duration and frequency of SWD bursts were significantly different between founding and F2 tish populations (frequency: 7.6 ± 0.4 Hz; duration: 3.3 ± 0.1 s; 6.8 ± 1.2 SWDs/day, p > .05, Student's t-test). Importantly, spontaneous bursts were not observed in any of the F2 heterozygous (n = 10) or SD rats (n = 8) examined (P15 – P31). This finding demonstrates that the functional tish phenotype of early-onset of the SWD bursts segregates with the previously unannotated exon 1, pEx1, of Eml1 and the heterotopic dysplastic cortex.
Fig. 7.

The deletion in pEx1 of Eml1 segregates with the functional tish phenotype. (A) Representative coronal images of a Nissl-stained brain section and whole brain sectioned past the prefrontal cortex from P37 re-derived tish (Top panel) and SD (Bottom panel) rats clearly displays the large dysplastic cortex of the tish rat (**). (B) Representative EEG recordings from a P25 re-derived tish rat (top panel, red traces) and SD rat (bottom panel, blue traces) demonstrate a spontaneous SWD burst in both the heterotopic dysplastic cortex (HDCx) and normotopic neocortex (NNCx) of the tish rat and no spontaneous activity in the neocortex (NCx) of the SD rat. Th, thalamus; Hc, hippocampus.
3.6. SWD bursts in the adult tish rat differ from those of the adult SD rat
The early-onset of the SWD bursts suggest that the thalamocortical network responsible for generating these bursts is altered in the tish rat, potentially as the result of thalamocortical architecture (Schottler et al., 1998; Schottler et al., 2001) and the reduced synaptic inhibition in the normotopic neocortex (Trotter et al., 2006). Therefore, we hypothesized that the SWD bursts generated in the adult SD rat, from which the tish rat spontaneously arose, would also differ from those generated by the adult tish rat.
To test this hypothesis, we obtained vEEG recordings from SD rats and tish rats 1 year of age (Fig. 8). In these recordings, the average duration of the SWD burst was significantly longer in adult SD (9.9 ± 1.5 s, n = 6) compared to adult tish rats (3.8 ± 0.6 s, n = 3; *p = .03, Student's t-test). Additionally, the within burst spike-wave frequency was significantly higher in adult SD (8.3 ± 0.2 Hz, n = 6) compared to both young (6.9 ± 0.2 Hz, n = 17; **p = .002) and adult tish (7.3 ± 0.5 Hz, n = 3, *p = .04) animals. Of note, although young and adult tish rats experienced more SWD bursts during the sleep-cycle (day-time hours; lights on), SWD bursts in adult SD rats occurred more frequently during the wake-cycle (night-time hours; lights off; Fig. 8D). Similar to young tish rats, SWD bursts observed in adult tish and SD rats were accompanied by immobility.
Fig. 8.

Spontaneous SWD bursts in tish rats are distinct from those observed in SD rats. (A) Representative EEG recordings from 1 – year old adult tish (red traces) and SD rats (blue traces) demonstrating the presence of prolonged SWD burst duration in adult SD animals. HDCx, heterotopic dysplastic cortex; NNCx, normotopic neocortex; NCx, neocortex; Th, thalamus; Hc, hippocampus. Both SWD burst duration (B) and SWD frequency within the burst (C) was increased in adult SD rats. (D) SWD bursts are more prominent during the sleep-cycle of both young and adult tish rats. In contrast, significantly more SWD bursts were observed during the wake-cycle of adult SD rats. *p = .024; 0.015, ****p = .0003, Student's t-test; ANOVA ****#p < .05, ###p < .001; young tish, n = 17; adult tish, n = 3; adult SD, n = 6.
4. Discussion
In the current study we employed concomitant RNA and DNA sequencing to identify the mutation underlying the tish rat MCD phenotype (Lee et al., 1997). This approach proved critical as we found that the underlying genetic mutation in the tish rat spans a currently unannotated exon 1 of rat Eml1, located approximately 50 kb upstream of the reference annotation for rat exon 1 (Fig. 1). We also report that the tish rat is characterized by both structural and functional phenotypes: macroscopic bilateral heterotopic cortex and early-onset spontaneous SWD bursts by P17. Importantly, we show that the mutant Eml1 allele segregates with both phenotypes at Mendelian ratios consistent with autosomal recessive inheritance. The deletion in Eml1 in the tish rat reported here, provides an important genetic link between migration-related dysplastic structural phenotypes and circuit-based phenotypes, including altered anatomical connections (Schottler et al., 1998; Schottler et al., 2001) and reduced inhibitory connectivity (Trotter et al., 2006), from which these SWDs could emerge.
Eml1 is a member of the echinoderm microtubule-associated proteins (EMAPs; Eml1–6). It was originally identified as one of the most abundant microtubule-associated proteins in sea urchin (Suprenant et al., 1993). Microtubule-associated proteins play essential roles in cytoskeletal reorganization during neuronal migration and maturation. In proliferating cells, Eml1, Eml2 and Eml4 associate with the mitotic spindle (Suprenant et al., 1993; Eichenmuller et al., 2002; Houtman et al., 2007; Kielar et al., 2014) and are required for proper cellular proliferation and migration. Clinically, mutations in EML1 were identified in two families where the proband displayed bilateral periventricular and ribbon-like subcortical heterotopia (Kielar et al., 2014). Furthermore, we note that the DatabasE of genomiC varIation of Phenotype in Humans using Ensembl Resources (DECIPHER; Firth et al., 2009) identified 27 patients with genomic duplications or deletions encompassing EML1, many of whom display intellectual disability, developmental delay, or craniofacial developmental abnormalities. Recently, a mutation in EML1 was identified as the genetic cause of intractable epilepsy and congenital hydrocephalus in a two – year old girl, further confirming the role of EML1 in altered nervous system development in humans (Shaheen et al., 2017).
Similar to the tish rat, the HeCo mouse also displays a bilateral heterotopic cortex resulting from a mutation in Eml1 (Croquelois et al., 2009; Kielar et al., 2014). Loss of Eml1 in the HeCo mouse results in increased spindle length and alterations in cell shape during early – mid corticogenesis, thus contributing to the impaired positioning of radial glial cells and the development of the heterotopic cortex (Bizzotto et al., 2017). Despite the lack of EEG recordings in the HeCo mouse, the behavioral description of an abrupt interruption in exploratory behavior in P28 – P35 HeCo mice (Croquelois et al., 2009) is similar to the behavioral phenotype observed in the awake tish rat during SWD bursts. The presence of spontaneous convulsive seizures in both models, albeit infrequent, has also been reported (Lee et al., 1997; Chen et al., 2000; Croquelois et al., 2009). Full EEG characterization of the HeCo mouse, as conducted here in the tish rat, will be necessary to confirm potential similarities of a functional phenotype in the HeCo mouse.
Despite similar structural phenotypes, different pathogenic variants in Eml1 underlie the tish rat and HeCo mouse. The HeCo mouse phenotype results from a retrotransposon insertion in intron 22 of mouse Eml1 (Kielar et al., 2014). In contrast, as reported here, the tish rat phenotype is the consequence of a deletion in a previously unannotated exon 1 of rat Eml1. This mutation, while sparing the Eml1-S transcript, results in a loss of the Eml1-L transcript, and reduced Eml1 protein expression. In rat, both Eml1 transcripts, Eml1-L and Eml1-S, express the C-terminal 639 aa (Fig. 9), which encode a tandem atypical propeller domain composed of multiple WD40 repeats and is proposed to contain essential functional domains (Richards et al., 2014). The Eml1-S transcript lacks only 31 aa on the N-terminal. However, recent evidence indicates that the N-terminal 27 aa of human EML1 are essential for microtubule binding (Richards et al., 2015). Given 100% homology between rat and human protein in this region (Fig. 9), the functional consequence of exclusive Eml1-S expression in the tish rat cortex could reflect diminished microtubule binding activity. However, a more plausible explanation is that abrogated Eml1 protein expression underlies the human, mouse, and rat phenotypes described here. Future study of the role of Eml1 in wildtype neurodevelopment is expected to add to the current understanding of cytoskeletal dynamics during neuronal migration and maturation (Bizzotto et al., 2017).
Fig. 9.

The two isoforms of rat Eml1 do not differ in known or predicted functional domains. (A) Schematic of annotated domains in canonical rat Eml1 (UniProtKB - Q4V8C3), N-terminal features (red) are annotated. The N-terminal 31 amino acids (aa) that are truncated in the tish isoform are indicated in red. The C-terminal 639 aa encode multiple WD repeats that form an atypical propeller domain (Richards et al., 2014). A serine rich feature (S-rich) is inferred from aa 108 – aa 172 based on compositional bias, serine 131 can be phosphorylated. A unique feature (U) from aa 50 – aa 60 is annotated based on peptidomic evidence. (B) Alignment of RNAseq consensus sequences and exon-junction PCR products. Predicted first exons for Eml1-L (Eml1L_Ex1) and Eml1-S (Eml1S_Ex1) from transcriptome assembly align perfectly with Sanger-derived sequence. Both translation start sites (ATG) are indicated with red text. (C) The predicted protein from RNAseq data is most homologous with mouse and human Eml1-L. All encode the Eml1-S methionine (red) at aa 32, thus the two isoforms of Eml1 are expected to differ by 31 aa. We note a rat-specific I > V substitution of unknown significance at aa 34.
In this study, we observed the early-onset of SWD bursts in the tish rat and demonstrated that this functional phenotype segregated with the Eml1 mutation and the dysplastic cortex. Although the presence of SWD bursts in the rat have been used to model human absence epilepsy (e.g. GAERS model; Marescaux et al., 1992), spontaneous SWD bursts have been noted in healthy inbred and outbred rat strains (Inoue et al., 1990; Rankin-Gee et al., 2015; Taylor et al., 2019). Recently, Taylor et al. (2019) showed that these rhythms were present in wild-caught Brown-Norway rats. This finding, combined with previous demonstrations of retained awareness during these bursts (Drinkenburg et al., 2003; Wiest and Nicolelis, 2003), has resulted in increasing recognition that these rhythms may not be pathogenic (Kaplan, 1985; Taylor et al., 2019). Independent of whether these bursts in the rat are pathogenic or not, an improved understanding of the macro- and micro-circuits that generate pathogenic and normal brain rhythms remains valuable to understanding the functioning of neural networks (Ryan and Sharpless, 1979; Halgren et al., 2019).
While the many different strains in which these bursts have been recorded share common features (e.g. immobility), strain specific differences have been observed (e.g. Taylor et al., 2019). Although the tish rat arose spontaneously from SD rats (Lee et al., 1997), the SWD bursts recorded from the tish rat were unique from those recorded in SD rats (Kelly, 2004; Pearce et al., 2014; Rodgers et al., 2015). In a prior meticulous study, Rodgers et al. (2015) noted fragmentary bursts in one-month old SD rats. We observed well-formed bursts of 1–10 s in 100% of tish rats P19 or older while no bursts, fragmentary or well-formed, were observed in recordings from SD rats out to age P35. In a carefully designed study, Pearce et al. (2014) found sex-specific differences: female SD rats at 2–3 months were more likely to demonstrate these rhythms than were male animals. In the tish rat, no sex-specific differences were observed. Finally, the tish rat SWD bursts recorded in older animals remained distinct from those in the adult SD rat. While both the adult tish and SD rat shared the immobile semiology, the bursts in the tish rat were more likely to occur during the sleep-cycle (day-time hours, lights on), were of shorter duration, and had a lower within burst frequency.
We found that tish-specific differences in SWD bursts persisted after a dihybrid cross suggesting that the presence of the dysplastic cortex alters the neural network that generates this rhythm. Alternatively, but less likely, the Eml1 protein has a direct effect on neural network functioning, independent of the cortical malformation (Taylor et al., 2017). Prior studies have demonstrated that ESM suppresses SWD bursts in a variety of rat strains (Julien et al., 1975; Coulter et al., 1989; Pearce et al., 2014; Taylor et al., 2017, 2019). In agreement with these studies, SWD bursts observed in the young tish rat were also found to be suppressed by ESM. While this suppression may suggest a thalamocortical origin, SWD bursts have been reported to occur in isolation of either the cortex or thalamus, demonstrating that these rhythms can be generated by multiple circuits (Blumenfeld, 2005). Schottler et al. (1998, 2001) found functional bidirectional connections between both the normotopic cortex and subcortical structures and the heterotopic cortex and those same subcortical structures, including the venter-oposterial lateral and medial thalamus. How this altered anatomical connectivity, which is complemented by a reduction in GABA-mediated synaptic inhibition within the normotopic cortex (Trotter et al., 2006), results in the earlier onset of the SWD bursts will require additional studies.
In summary, we report that the rat mutant Eml1 allele is brought about by 1215 bp deletion of exon 1 that eliminates expression of Eml1-L, but not Eml1-S. Together with previous reports in human and mouse, this work shows that Eml1 plays critical, evolutionarily conserved roles in normal cerebral cortical development and that mutations in Eml1 contribute to the formation of the heterotopic dysplastic cortex resulting in altered development and function of the neural networks as demonstrated by the early appearance of SWD bursts. Future studies aimed at understanding how the altered anatomical connections result in differential development of circuits are required.
Supplementary Material
Acknowledgements
The authors would like to thank the Bioinformatics Core Facility at the University of Virginia for their support in analysis of whole-genome and RNA-sequencing data received from Hudson Alpha Genomics. Additionally, we would like to thank the Bioanalysis Molecular Facility for their assistance in Sanger Sequencing. We also thank Dr. Bill Pearson for assistance with nucleotide translation and alignments, and Meagan Darling for her assistance in RT-PCR. This study makes use of data generated by the DECIPHER community. A full list of centers who contributed to the generation of the data is available from http://decipher.sanger.ac.uk and via email from decipher@sanger.ac.uk. Funding for the DECIPHER project was provided by the Welcome Trust. MJM receives support from NIMH U01 MH106882. Whole genome sequencing data generated in this project has been submitted to NCBI SRA with STUDY # PRJNA615699. The transcriptome data was deposited to the Gene Expression Omnibus (GEO) database and can be accessed at www.ncbi.nlm.nih.gov/geo with accession number GSE147663.
Funding
This work was supported by the National Institute of Neurological Disorders, award number NS110863 to S.J.
Abbreviations:
- MCD
malformation of cortical development
- SWD
spike wave discharge
- ESM
ethosuximide
Footnotes
Appendix A. Supplementary data
Supplementary data to this article can be found online at https://doi.org/10.1016/j.nbd.2020.104836.
References
- Ackman JB, Aniksztejn L, Crepel V, Becq H, Pellegrino C, Cardoso C, Ben-Ari Y, Represa A, 2009. Abnormal network activity in a targeted genetic model of human double cortex. J. Neurosci 29, 313–327. [DOI] [PMC free article] [PubMed] [Google Scholar]
- Anders S, Huber W, 2010. Differential expression analysis for sequence count data. Genome Biol. 11, R106. [DOI] [PMC free article] [PubMed] [Google Scholar]
- Bai J, Ramos RL, Ackman JB, Thomas AM, Lee RV, LoTurco JJ, 2003. RNAi reveals doublecortin is required for radial migration in rat neocortex. Nat. Neurosci 6, 1277–1283. [DOI] [PubMed] [Google Scholar]
- Barkovich AJ, Kuzniecky RI, Jackson GD, Guerrini R, Dobyns WB, 2005. A developmental and genetic classification for malformations of cortical development. Neurology 65, 1873–1887. [DOI] [PubMed] [Google Scholar]
- Bizzotto S, Uzquiano A, Dingli F, Ershov D, Houllier A, Arras G, Richards M, Loew D, Minc N, Croquelois A, Houdusse A, Francis F, 2017. Eml1 loss impairs apical progenitor spindle length and soma shape in the developing cerebral cortex. Sci. Rep 7, 17308. [DOI] [PMC free article] [PubMed] [Google Scholar]
- Blumenfeld H, 2005. Cellular and network mechanisms of spike-wave seizures. Epilepsia 46, 21–33. [DOI] [PubMed] [Google Scholar]
- Buchsbaum IY, Cappello S, 2019. Neuronal migration in the CNS during development and disease: insights from in vivo and in vitro models. Development 146. [DOI] [PubMed] [Google Scholar]
- Cappello S, Bohringer CR, Bergami M, Conzelmann KK, Ghanem A, Tomassy GS, Arlotta P, Mainardi M, Allegra M, Caleo M, van Hengel J, Brakebusch C, Gotz M, 2012. A radial glia-specific role of RhoA in double cortex formation. Neuron 73, 911–924. [DOI] [PubMed] [Google Scholar]
- Chen ZF, Schottler F, Bertram E, Gall CM, Anzivino MJ, Lee KS, 2000. Distribution and initiation of seizure activity in a rat brain with subcortical band heterotopia. Epilepsia 41, 493–501. [DOI] [PubMed] [Google Scholar]
- Chiang C, Layer RM, Faust GG, Lindberg MR, Rose DB, Garrison EP, Marth GT, Quinlan AR, Hall IM, 2015. SpeedSeq: ultra-fast personal genome analysis and interpretation. Nat. Methods 12, 966–968. [DOI] [PMC free article] [PubMed] [Google Scholar]
- Colacitti C, Sancini G, Franceschetti S, Cattabeni F, Avanzini G, Spreafico R, Di Luca M, Battaglia G, 1998. Altered connections between neocortical and heterotopic areas in methylazoxymethanol-treated rat. Epilepsy Res. 32, 49–62. [DOI] [PubMed] [Google Scholar]
- Coulter DA, Huguenard JR, Prince DA, 1989. Specific petit mal anticonvulsants reduce calcium currents in thalamic neurons. Neurosci. Lett 98, 74–78. [DOI] [PubMed] [Google Scholar]
- Croquelois A, Giuliani F, Savary C, Kielar M, Amiot C, Schenk F, Welker E, 2009. Characterization of the HeCo mutant mouse: a new model of subcortical band heterotopia associated with seizures and behavioral deficits. Cereb. Cortex 19, 563–575. [DOI] [PubMed] [Google Scholar]
- DiGruccio MR, Joksimovic S, Joksovic PM, Lunardi N, Salajegheh R, Jevtovic-Todorovic V, Beenhakker MP, Goodkin HP, Todorovic SM, 2015. Hyperexcitability of rat thalamocortical networks after exposure to general anesthesia during brain development. J. Neurosci 35, 1481–1492. [DOI] [PMC free article] [PubMed] [Google Scholar]
- Dobin A, Davis CA, Schlesinger F, Drenkow J, Zaleski C, Jha S, Batut P, Chaisson M, Gingeras TR, 2013. STAR: ultrafast universal RNA-seq aligner. Bioinformatics 29, 15–21. [DOI] [PMC free article] [PubMed] [Google Scholar]
- Drinkenburg WH, Schuurmans ML, Coenen AM, Vossen JM, van Luijtelaar EL, 2003. Ictal stimulus processing during spike-wave discharges in genetic epileptic rats. Behav. Brain Res 143, 141–146. [DOI] [PubMed] [Google Scholar]
- Dvorak K, Feit J, 1977. Migration of neuroblasts through partial necrosis of the cerebral cortex in newborn rats-contribution to the problems of morphological development and developmental period of cerebral microgyria. Histological and auto-radiographical study. Acta Neuropathol. 38, 203–212. [DOI] [PubMed] [Google Scholar]
- Eichenmuller B, Everley P, Palange J, Lepley D, Suprenant KA, 2002. The human EMAP-like protein-70 (ELP70) is a microtubule destabilizer that localizes to the mitotic apparatus. J. Biol. Chem 277, 1301–1309. [DOI] [PubMed] [Google Scholar]
- Faust GG, Hall IM, 2012. YAHA: fast and flexible long-read alignment with optimal breakpoint detection. Bioinformatics 28, 2417–2424. [DOI] [PMC free article] [PubMed] [Google Scholar]
- Firth HV, Richards SM, Bevan AP, Clayton S, Corpas M, Rajan D, Van Vooren S, Moreau Y, Pettett RM, Carter NP, 2009. DECIPHER: database of chromosomal imbalance and phenotype in humans using Ensembl resources. Am. J. Hum. Genet 84, 524–533. [DOI] [PMC free article] [PubMed] [Google Scholar]
- Fitzgerald MP, Covio M, Lee KS, 2011. Disturbances in the positioning, proliferation and apoptosis of neural progenitors contribute to subcortical band heterotopia formation. Neuroscience 176, 455–471. [DOI] [PMC free article] [PubMed] [Google Scholar]
- Gleeson JG, Luo RF, Grant PE, Guerrini R, Huttenlocher PR, Berg MJ, Ricci S, Cusmai R, Wheless JW, Berkovic S, Scheffer I, Dobyns WB, Walsh CA, 2000. Genetic and neuroradiological heterogeneity of double cortex syndrome. Ann. Neurol 47, 265–269. [PubMed] [Google Scholar]
- Goodkin HP, Liu X, Holmes GL, 2003. Diazepam terminates brief but not prolonged seizures in young, naive rats. Epilepsia 44, 1109–1112. [DOI] [PubMed] [Google Scholar]
- Guerrini R, Dobyns WB, 2014. Malformations of cortical development: clinical features and genetic causes. Lancet Neurol. 13, 710–726. [DOI] [PMC free article] [PubMed] [Google Scholar]
- Halgren M, Ulbert I, Bastuji H, Fabo D, Eross L, Rey M, Devinsky O, Doyle WK, Mak-McCully R, Halgren E, Wittner L, Chauvel P, Heit G, Eskandar E, Mandell A, Cash SS, 2019. The generation and propagation of the human alpha rhythm. Proc. Natl. Acad. Sci. U. S. A 116, 23772–23782. [DOI] [PMC free article] [PubMed] [Google Scholar]
- Houtman SH, Rutteman M, De Zeeuw CI, French PJ, 2007. Echinoderm microtubule-associated protein like protein 4, a member of the echinoderm microtubule-associated protein family, stabilizes microtubules. Neuroscience 144, 1373–1382. [DOI] [PubMed] [Google Scholar]
- Inoue M, Peeters BW, van Luijtelaar EL, Vossen JM, Coenen AM, 1990. Spontaneous occurrence of spike-wave discharges in five inbred strains of rats. Physiol. Behav 48, 199–201. [DOI] [PubMed] [Google Scholar]
- Julien RM, Fowler GW, Danielson MG, 1975. The effects of antiepileptic drugs on estrogen-induced electrographic spike-wave discharge. J. Pharmacol. Exp. Ther 193, 647–656. [PubMed] [Google Scholar]
- Kaplan BJ, 1985. The epileptic nature of rodent electrocortical polyspiking is still unproven. Exp. Neurol 88, 425–436. [DOI] [PubMed] [Google Scholar]
- Kelly KM, 2004. Spike-wave discharges: absence or not, a common finding in common laboratory rats. Epilepsy Curr. 4, 176–177. [DOI] [PMC free article] [PubMed] [Google Scholar]
- Kielar M, Tuy FP, Bizzotto S, Lebrand C, de Juan Romero C., Poirier K, Oegema R, Mancini GM, Bahi-Buisson N, Olaso R, Le Moing AG, Boutourlinsky K, Boucher D, Carpentier W, Berquin P, Deleuze JF, Belvindrah R, Borrell V, Welker E, Chelly J, Croquelois A, Francis F, 2014. Mutations in Eml1 lead to ectopic progenitors and neuronal heterotopia in mouse and human. Nat. Neurosci 17, 923–933. [DOI] [PubMed] [Google Scholar]
- Kim D, Langmead B, Salzberg SL, 2015. HISAT: a fast spliced aligner with low memory requirements. Nat. Methods 12, 357–360. [DOI] [PMC free article] [PubMed] [Google Scholar]
- Kronenberg ZN, Osborne EJ, Cone KR, Kennedy BJ, Domyan ET, Shapiro MD, Elde NC, Yandell M, 2015. Wham: identifying structural variants of biological consequence. PLoS Comput. Biol 11, e1004572. [DOI] [PMC free article] [PubMed] [Google Scholar]
- Lagae L, 2000. Cortical malformations: a frequent cause of epilepsy in children. Eur. J. Pediatr 159, 555–562. [DOI] [PubMed] [Google Scholar]
- Lee KS, Schottler F, Collins JL, Lanzino G, Couture D, Rao A, Hiramatsu K, Goto Y, Hong SC, Caner H, Yamamoto H, Chen ZF, Bertram E, Berr S, Omary R, Scrable H, Jackson T, Goble J, Eisenman L, 1997. A genetic animal model of human neocortical heterotopia associated with seizures. J. Neurosci 17, 6236–6242. [DOI] [PMC free article] [PubMed] [Google Scholar]
- Lee KS, Collins JL, Anzivino MJ, Frankel EA, Schottler F, 1998. Heterotopic neurogenesis in a rat with cortical heterotopia. J. Neurosci 18, 9365–9375. [DOI] [PMC free article] [PubMed] [Google Scholar]
- Leventer RJ, Phelan EM, Coleman LT, Kean MJ, Jackson GD, Harvey AS, 1999. Clinical and imaging features of cortical malformations in childhood. Neurology 53, 715–722. [DOI] [PubMed] [Google Scholar]
- Leventer RJ, Guerrini R, Dobyns WB, 2008. Malformations of cortical development and epilepsy. Dialogues Clin. Neurosci 10, 47–62. [DOI] [PMC free article] [PubMed] [Google Scholar]
- Li H, Durbin R, 2010. Fast and accurate long-read alignment with burrows-wheeler transform. Bioinformatics 26, 589–595. [DOI] [PMC free article] [PubMed] [Google Scholar]
- Li H, Handsaker B, Wysoker A, Fennell T, Ruan J, Homer N, Marth G, Abecasis G, Durbin R, 2009. The Sequence Alignment/Map format and SAMtools. Bioinformatics 25, 2078–2079. [DOI] [PMC free article] [PubMed] [Google Scholar]
- Liao Y, Smyth GK, Shi W, 2014. featureCounts: an efficient general purpose program for assigning sequence reads to genomic features. Bioinformatics 30, 923–930. [DOI] [PubMed] [Google Scholar]
- Love MI, Huber W, Anders S, 2014. Moderated estimation of fold change and dispersion for RNA-seq data with DESeq2. Genome Biol. 15, 550. [DOI] [PMC free article] [PubMed] [Google Scholar]
- Marescaux C, Vergnes M, Depaulis A, 1992. Genetic absence epilepsy in rats from Strasbourg—a review. J. Neural Transm. Suppl 35, 37–69. [DOI] [PubMed] [Google Scholar]
- Matsumoto N, Leventer RJ, Kuc JA, Mewborn SK, Dudlicek LL, Ramocki MB, Pilz DT, Mills PL, Das S, Ross ME, Ledbetter DH, Dobyns WB, 2001. Mutation analysis of the DCX gene and genotype/phenotype correlation in subcortical band heterotopia. Eur. J. Hum. Genet 9, 5–12. [DOI] [PubMed] [Google Scholar]
- Munji RN, Choe Y, Li G, Siegenthaler JA, Pleasure SJ, 2011. Wnt signaling regulates neuronal differentiation of cortical intermediate progenitors. J. Neurosci 31, 1676–1687. [DOI] [PMC free article] [PubMed] [Google Scholar]
- Paredes M, Pleasure SJ, Baraban SC, 2006. Embryonic and early postnatal abnormalities contributing to the development of hippocampal malformations in a rodent model of dysplasia. J. Comp. Neurol 495, 133–148. [DOI] [PMC free article] [PubMed] [Google Scholar]
- Pearce PS, Friedman D, Lafrancois JJ, Iyengar SS, Fenton AA, Maclusky NJ, Scharfman HE, 2014. Spike-wave discharges in adult Sprague-Dawley rats and their implications for animal models of temporal lobe epilepsy. Epilepsy Behav. 32, 121–131. [DOI] [PMC free article] [PubMed] [Google Scholar]
- Pertea M, Pertea GM, Antonescu CM, Chang TC, Mendell JT, Salzberg SL, 2015. StringTie enables improved reconstruction of a transcriptome from RNA-seq reads. Nat. Biotechnol 33, 290–295. [DOI] [PMC free article] [PubMed] [Google Scholar]
- Pertea M, Kim D, Pertea GM, Leek JT, Salzberg SL, 2016. Transcript-level expression analysis of RNA-seq experiments with HISAT, StringTie and Ballgown. Nat. Protoc 11, 1650–1667. [DOI] [PMC free article] [PubMed] [Google Scholar]
- Petit LF, Jalabert M, Buhler E, Malvache A, Peret A, Chauvin Y, Watrin F, Represa A, Manent JB, 2014. Normotopic cortex is the major contributor to epilepsy in experimental double cortex. Ann. Neurol 76, 428–442. [DOI] [PubMed] [Google Scholar]
- Quinlan AR, Hall IM, 2010. BEDTools: a flexible suite of utilities for comparing genomic features. Bioinformatics 26, 841–842. [DOI] [PMC free article] [PubMed] [Google Scholar]
- Rankin-Gee EK, McRae PA, Baranov E, Rogers S, Wandrey L, Porter BE, 2015. Perineuronal net degradation in epilepsy. Epilepsia 56, 1124–1133. [DOI] [PubMed] [Google Scholar]
- RCoreTeam, 2015. R: A language and enivronment for statistical computing. In: R Foundation for Statistical Computing; Vienna, Austria. [Google Scholar]
- Richards MW, Law EW, Rennalls LP, Busacca S, O’Regan L, Fry AM, Fennell DA, Bayliss R, 2014. Crystal structure of EML1 reveals the basis for Hsp90 dependence of oncogenic EML4-ALK by disruption of an atypical beta-propeller domain. Proc. Natl. Acad. Sci. U. S. A 111, 5195–5200. [DOI] [PMC free article] [PubMed] [Google Scholar]
- Richards MW, O’Regan L, Roth D, Montgomery JM, Straube A, Fry AM, Bayliss R, 2015. Microtubule association of EML proteins and the EML4-ALK variant 3 oncoprotein require an N-terminal trimerization domain. Biochem. J 467, 529–536. [DOI] [PubMed] [Google Scholar]
- Rodgers KM, Dudek FE, Barth DS, 2015. Progressive, seizure-like, spike-wave discharges are common in both injured and uninjured Sprague-Dawley rats: implications for the fluid percussion injury model of post-traumatic epilepsy. J. Neurosci 35, 9194–9204. [DOI] [PMC free article] [PubMed] [Google Scholar]
- Romero DM, Bahi-Buisson N, Francis F, 2018. Genetics and mechanisms leading to human cortical malformations. Semin. Cell Dev. Biol 76, 33–75. [DOI] [PubMed] [Google Scholar]
- Ryan LJ, Sharpless SK, 1979. Genetically determined spontaneous and pentylenetetrazol-induced brief spindle episodes in mice. Exp. Neurol 66, 493–508. [DOI] [PubMed] [Google Scholar]
- Sahu S, Buhler E, Vermoyal JC, Watrin F, Represa A, Manent JB, 2018. Spontaneous epileptiform activity in a rat model of bilateral subcortical band heterotopia. Epilepsia 60, 337–348. [DOI] [PMC free article] [PubMed] [Google Scholar]
- Schottler F, Couture D, Rao A, Kahn H, Lee KS, 1998. Subcortical connections of normotopic and heterotopic neurons in sensory and motor cortices of the tish mutant rat. J. Comp. Neurol 395, 29–42. [PubMed] [Google Scholar]
- Schottler F, Fabiato H, Leland JM, Chang LY, Lotfi P, Getachew F, Lee KS, 2001. Normotopic and heterotopic cortical representations of mystacial vibrissae in rats with subcortical band heterotopia. Neuroscience 108, 217–235. [DOI] [PubMed] [Google Scholar]
- Shaheen R, Sebai MA, Patel N, Ewida N, Kurdi W, Altweijri I, Sogaty S, Almardawi E, Seidahmed MZ, Alnemri A, Madirevula S, Ibrahim N, Abdulwahab F, Hashem M, Al-Sheddi T, Alomar R, Alobeid E, Sallout B, AlBaqawi B, AlAali W, Ajaji N, Lesmana H, Hopkin RJ, Dupuis L, Mendoza-Londono R, Al Rukban H, Yoon G, Faqeih E, Alkuraya FS, 2017. The genetic landscape of familial congenital hydrocephalus. Ann. Neurol 81, 890–897. [DOI] [PubMed] [Google Scholar]
- Shaw FZ, 2004. Is spontaneous high-voltage rhythmic spike discharge in long Evans rats an absence-like seizure activity? J. Neurophysiol 91, 63–77. [DOI] [PubMed] [Google Scholar]
- Suprenant KA, Dean K, McKee J, Hake S, 1993. EMAP, an echinoderm microtubule-associated protein found in microtubule-ribosome complexes. J. Cell Sci 104, 445–450. [DOI] [PubMed] [Google Scholar]
- Taylor JA, Rodgers KM, Bercum FM, Booth CJ, Dudek FE, Barth DS, 2017. Voluntary control of Epileptiform spike-wave discharges in awake rats. J. Neurosci 37, 5861–5869. [DOI] [PMC free article] [PubMed] [Google Scholar]
- Taylor JA, Reuter JD, Kubiak RA, Mufford TT, Booth CJ, Dudek FE, Barth DS, 2019. Spontaneous recurrent absence seizure-like events in wild-caught rats. J. Neurosci 39, 4829–4841. [DOI] [PMC free article] [PubMed] [Google Scholar]
- Trotter SA, Kapur J, Anzivino MJ, Lee KS, 2006. GABAergic synaptic inhibition is reduced before seizure onset in a genetic model of cortical malformation. J. Neurosci 26, 10756–10767. [DOI] [PMC free article] [PubMed] [Google Scholar]
- Wiest MC, Nicolelis MA, 2003. Behavioral detection of tactile stimuli during 7-12 Hz cortical oscillations in awake rats. Nat. Neurosci 6, 913–914. [DOI] [PubMed] [Google Scholar]
- Zanelli S, Goodkin HP, Kowalski S, Kapur J, 2014. Impact of transient acute hypoxia on the developing mouse EEG. Neurobiol. Dis 68, 37–46. [DOI] [PMC free article] [PubMed] [Google Scholar]
Associated Data
This section collects any data citations, data availability statements, or supplementary materials included in this article.